
6b.1 Van Horne and Wachowicz, Fundamentals of Financial Management, 13th edition. © Pearson...
13
6b.1 Van Horne and Wachowicz, Fundamentals of Financial Management, 13th edition. © Pearson Education Limited 2009. Created by Gregory Kuhlemeyer. Chapter 6 – Chapter 6 – Support Support Financial Financial Statement Statement Analysis Analysis
-
Upload
vivien-tate -
Category
Documents
-
view
234 -
download
10
Transcript of 6b.1 Van Horne and Wachowicz, Fundamentals of Financial Management, 13th edition. © Pearson...

6b.1 Van Horne and Wachowicz, Fundamentals of Financial Management, 13th edition. © Pearson Education Limited 2009. Created by Gregory Kuhlemeyer.
Chapter 6 –Chapter 6 –SupportSupport
Financial Statement Financial Statement AnalysisAnalysis
Financial Statement Financial Statement AnalysisAnalysis
6b.2 Van Horne and Wachowicz, Fundamentals of Financial Management, 13th edition. © Pearson Education Limited 2009. Created by Gregory Kuhlemeyer.
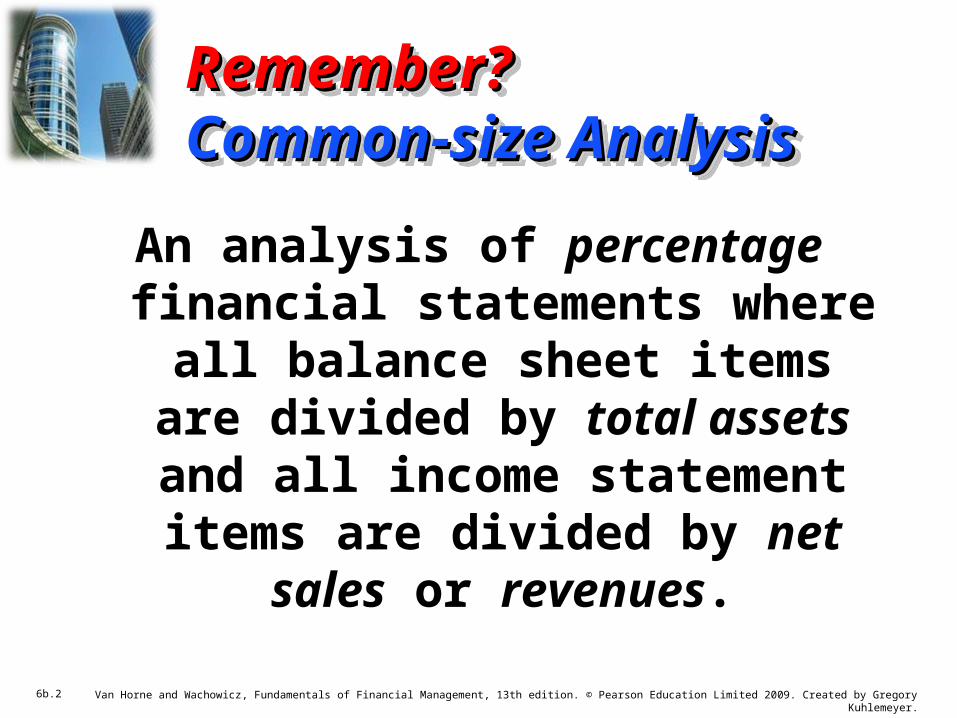
Remember?Remember?Common-size AnalysisCommon-size AnalysisRemember?Remember?Common-size AnalysisCommon-size Analysis
An analysis of percentage financial statements where all
balance sheet items are divided by total assets and all income statement items are divided by
net sales or revenues.
An analysis of percentage financial statements where all
balance sheet items are divided by total assets and all income statement items are divided by
net sales or revenues.

6b.3 Van Horne and Wachowicz, Fundamentals of Financial Management, 13th edition. © Pearson Education Limited 2009. Created by Gregory Kuhlemeyer.
and Remember?and Remember? Index AnalysesIndex Analysesand Remember?and Remember? Index AnalysesIndex Analyses
An analysis of percentage financial statements where all balance sheet or income statement figures for a
base year equal 100.0 (percent) and subsequent financial statement
items are expressed as percentages of their values in the base year.
An analysis of percentage financial statements where all balance sheet or income statement figures for a
base year equal 100.0 (percent) and subsequent financial statement
items are expressed as percentages of their values in the base year.
6b.4 Van Horne and Wachowicz, Fundamentals of Financial Management, 13th edition. © Pearson Education Limited 2009. Created by Gregory Kuhlemeyer.
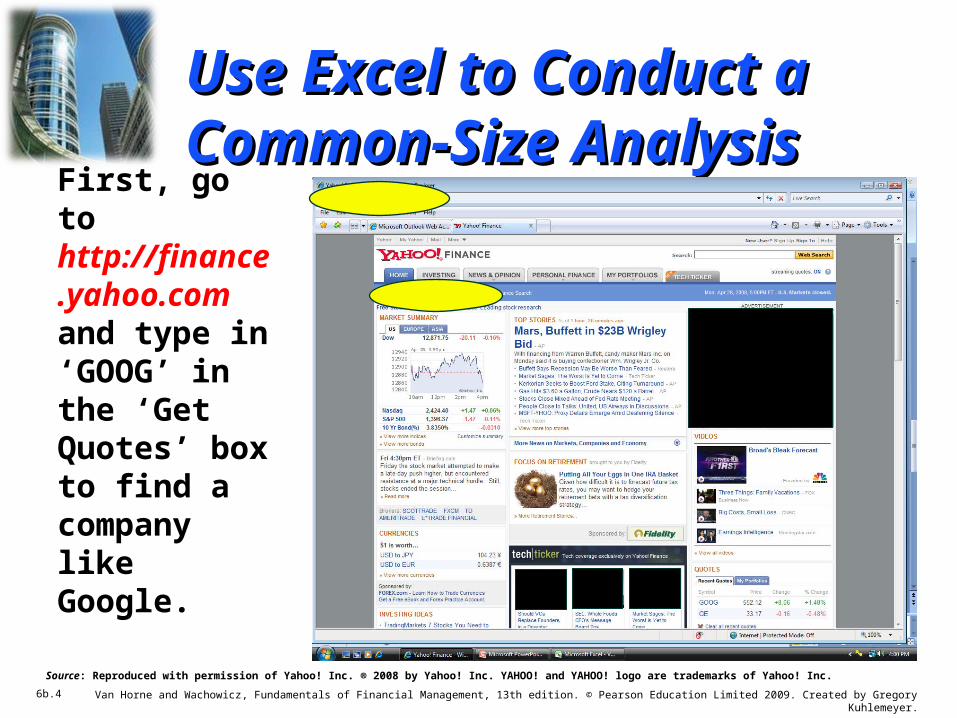
Use Excel to Conduct a Use Excel to Conduct a Common-Size AnalysisCommon-Size Analysis
First, go to http://finance.yahoo.com and type in ‘GOOG’ in the ‘Get Quotes’ box to find a company like Google.
Source: Reproduced with permission of Yahoo! Inc. ® 2008 by Yahoo! Inc. YAHOO! and YAHOO! logo are trademarks of Yahoo! Inc.
6b.5 Van Horne and Wachowicz, Fundamentals of Financial Management, 13th edition. © Pearson Education Limited 2009. Created by Gregory Kuhlemeyer.
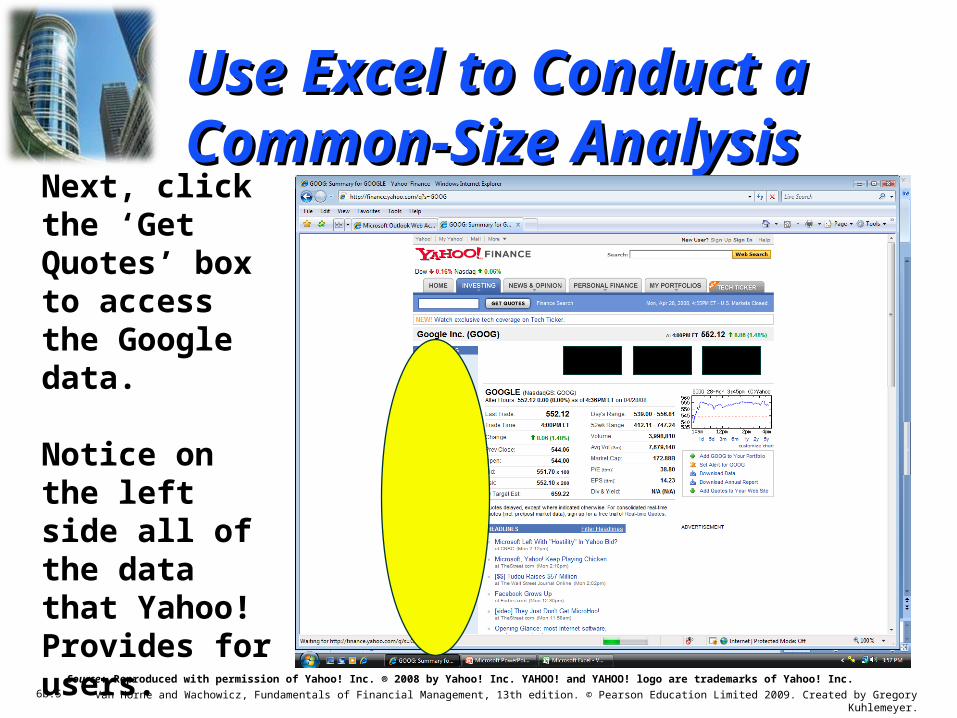
Use Excel to Conduct a Use Excel to Conduct a Common-Size AnalysisCommon-Size Analysis
Next, click the ‘Get Quotes’ box to access the Google data.
Notice on the left side all of the data that Yahoo! Provides for users.
Source: Reproduced with permission of Yahoo! Inc. ® 2008 by Yahoo! Inc. YAHOO! and YAHOO! logo are trademarks of Yahoo! Inc.
6b.6 Van Horne and Wachowicz, Fundamentals of Financial Management, 13th edition. © Pearson Education Limited 2009. Created by Gregory Kuhlemeyer.
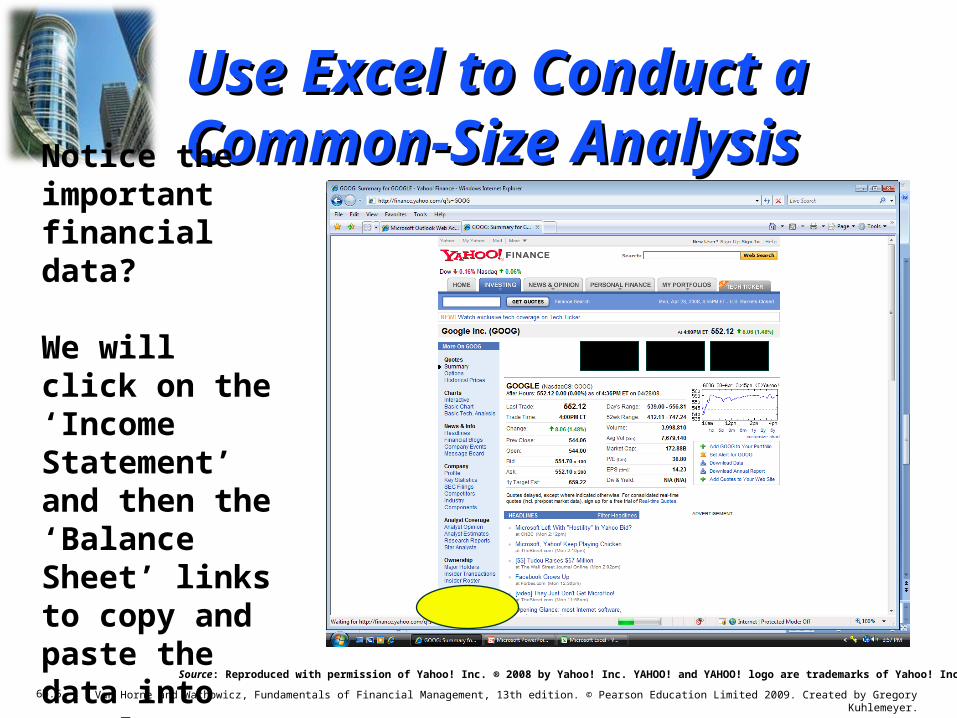
Use Excel to Conduct a Use Excel to Conduct a Common-Size AnalysisCommon-Size Analysis
Notice the important financial data?
We will click on the ‘Income Statement’ and then the ‘Balance Sheet’ links to copy and paste the data into Excel.
Source: Reproduced with permission of Yahoo! Inc. ® 2008 by Yahoo! Inc. YAHOO! and YAHOO! logo are trademarks of Yahoo! Inc.
6b.7 Van Horne and Wachowicz, Fundamentals of Financial Management, 13th edition. © Pearson Education Limited 2009. Created by Gregory Kuhlemeyer.
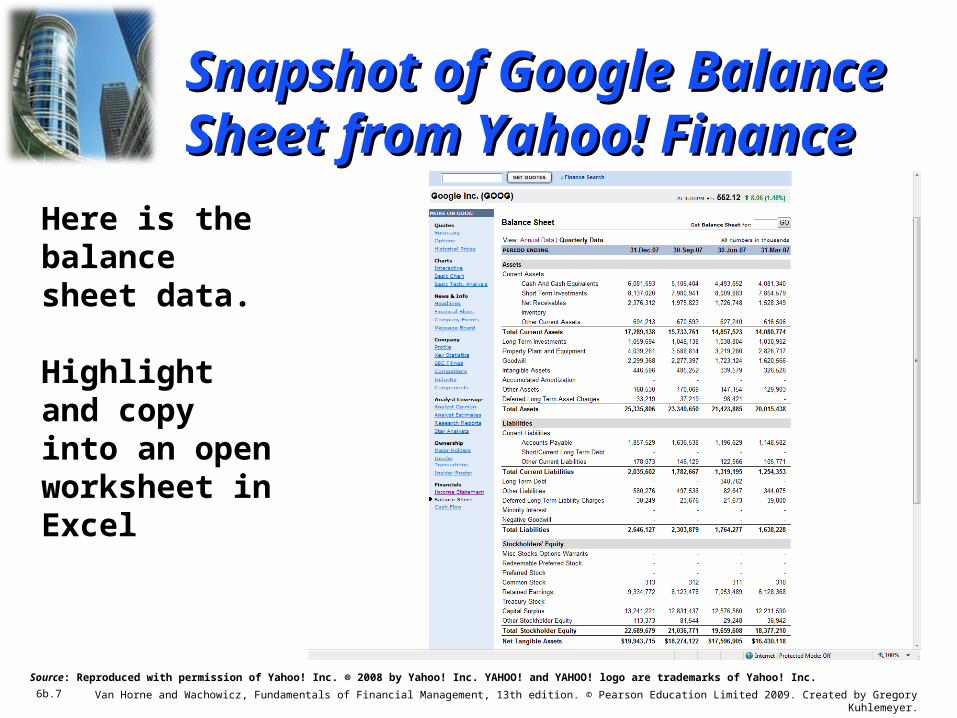
Snapshot of Google Balance Snapshot of Google Balance Sheet from Yahoo! FinanceSheet from Yahoo! Finance
Here is the balance sheet data.
Highlight and copy into an open worksheet in Excel
Source: Reproduced with permission of Yahoo! Inc. ® 2008 by Yahoo! Inc. YAHOO! and YAHOO! logo are trademarks of Yahoo! Inc.
6b.8 Van Horne and Wachowicz, Fundamentals of Financial Management, 13th edition. © Pearson Education Limited 2009. Created by Gregory Kuhlemeyer.
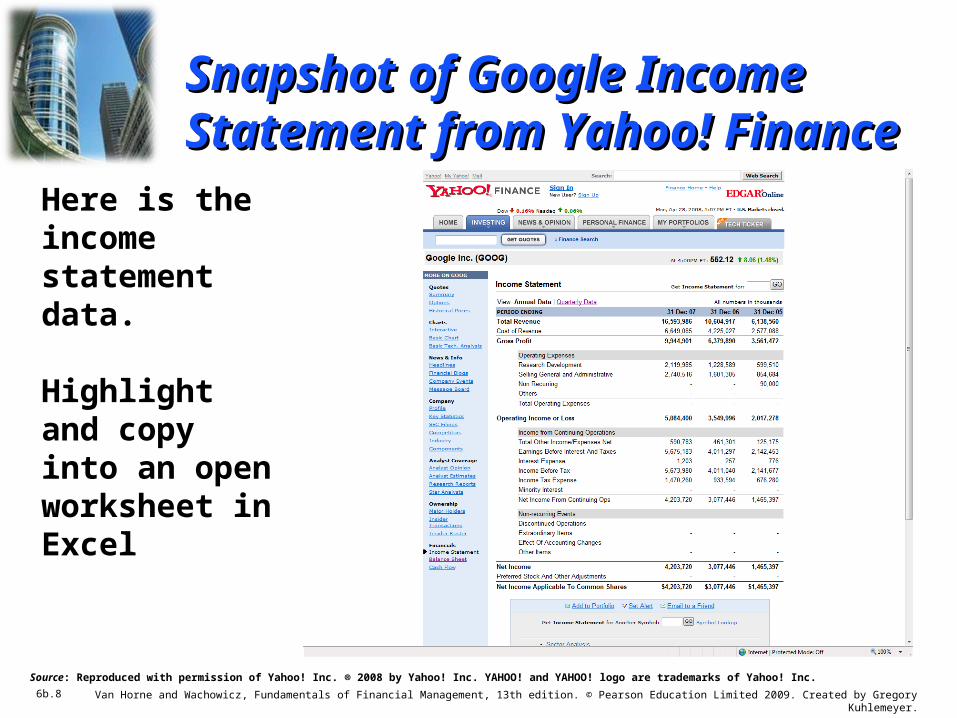
Snapshot of Google Income Snapshot of Google Income Statement from Yahoo! FinanceStatement from Yahoo! Finance
Here is the income statement data.
Highlight and copy into an open worksheet in Excel
Source: Reproduced with permission of Yahoo! Inc. ® 2008 by Yahoo! Inc. YAHOO! and YAHOO! logo are trademarks of Yahoo! Inc.

6b.9 Van Horne and Wachowicz, Fundamentals of Financial Management, 13th edition. © Pearson Education Limited 2009. Created by Gregory Kuhlemeyer.
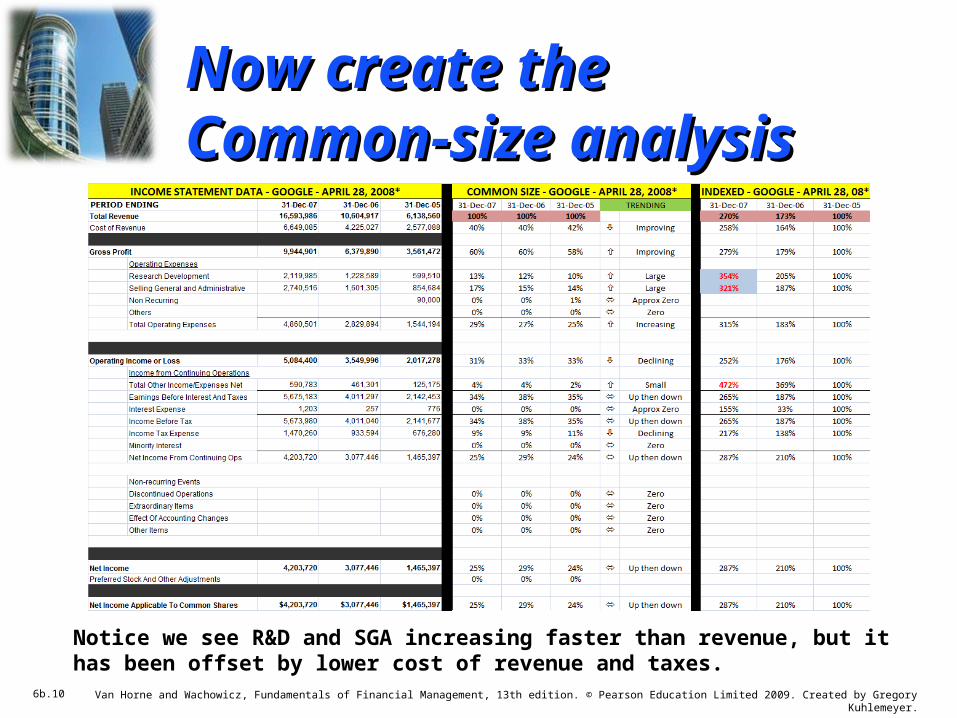
Now create the Now create the Common-size analysisCommon-size analysis
We have tweaked some of the data cells pasted as they are not copied as ‘numbers’, but ‘text’ formatting. The result is the ability to analyze quickly and easily.
6b.10 Van Horne and Wachowicz, Fundamentals of Financial Management, 13th edition. © Pearson Education Limited 2009. Created by Gregory Kuhlemeyer.
Now create the Now create the Common-size analysisCommon-size analysis
Notice we see R&D and SGA increasing faster than revenue, but it has been offset by lower cost of revenue and taxes.
6b.11 Van Horne and Wachowicz, Fundamentals of Financial Management, 13th edition. © Pearson Education Limited 2009. Created by Gregory Kuhlemeyer.
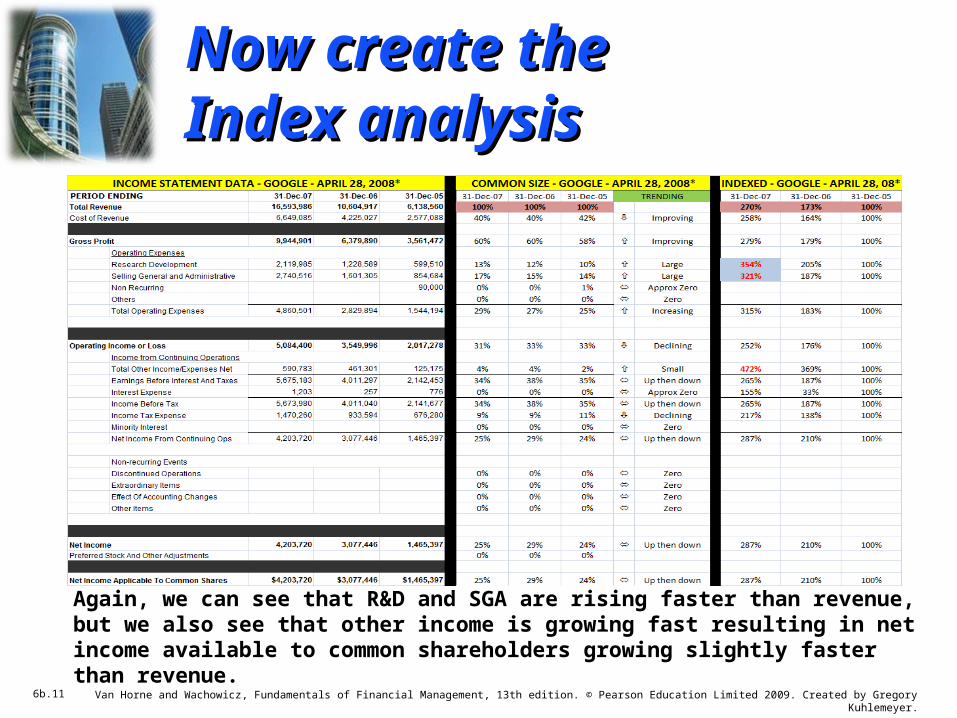
Now create the Now create the Index analysisIndex analysis
Again, we can see that R&D and SGA are rising faster than revenue, but we also see that other income is growing fast resulting in net income available to common shareholders growing slightly faster than revenue.

6b.12 Van Horne and Wachowicz, Fundamentals of Financial Management, 13th edition. © Pearson Education Limited 2009. Created by Gregory Kuhlemeyer.
We can do the same on We can do the same on the Balance Sheet!the Balance Sheet!
Again, we analyze similarly and can see that some longer-lived assets are seeing huge increases (goodwill and PP&E) which is being financed by internally generated funds shown via RE.
6b.13 Van Horne and Wachowicz, Fundamentals of Financial Management, 13th edition. © Pearson Education Limited 2009. Created by Gregory Kuhlemeyer.
Ratio AnalysisRatio AnalysisRatio AnalysisRatio Analysis
• We can, of course, now utilize the data you have in Excel to conduct ratio analysis.
• You would likely want to also collect industry relevant data.
• The result would allow you to do the type of analysis discussed in the text.
• We can, of course, now utilize the data you have in Excel to conduct ratio analysis.
• You would likely want to also collect industry relevant data.
• The result would allow you to do the type of analysis discussed in the text.


