6820 LBJ Freeway, Dallas, TX 75240 - Brinker … · Ian H. Baines Senior Vice President of...
80
Annual Report 2011
Transcript of 6820 LBJ Freeway, Dallas, TX 75240 - Brinker … · Ian H. Baines Senior Vice President of...

6820 LBJ Freeway, Dallas, TX 75240 • www.brinker.com
Annual Report 2011

BOARD OF DIRECTORS
Douglas H. BrooksChairman of the Board,Chief Executive Officer and PresidentBrinker International, Inc.
David DenoChief Financial Officer,International DivisionBest Buy Co.
Joseph M. DePintoPresident and Chief Executive Officer7-Eleven, Inc.
Michael DixonChief Financial OfficerPinkberry, Inc.
Harriet EdelmanVice Chairman Emigrant Bank
Jon L. LutherChairman of the BoardDunkin Brands
John W. MimsSenior Vice President, World-Wide Sales &Resort Marketing AsiaLas Vegas Sands Corporation
George R. MrkonicNon Executive ChairmanPaperchase Products Limited
Rosendo G. ParraPartner and FounderDaylight Partners
Cece SmithRetired Managing General PartnerPhillips-Smith-Machens Venture Partners
PRINCIPAL OFFICERS
Douglas H. BrooksChairman of the Board, Chief Executive Officer and President
Guy J. ConstantExecutive Vice President and Chief Financial Officer
Valerie L. DavissonExecutive Vice President and Chief People Works Officer
Roger F. ThomsonExecutive Vice President, Chief Administrative Officer,General Counsel and Secretary
Steve D. ProvostPresident of Maggiano’s Little Italy
Wyman T. RobertsPresident of Chili’s Grill & Bar
Carin L. StutzPresident of Global Business Development
Ian H. BainesSenior Vice President of Strategic Innovation
David R. DoyleSenior Vice President and Controller
Jeffrey A. HobanSenior Vice President, Assistant General Counseland Assistant Secretary
John R. HoseaSenior Vice President of People Services andInformation Technology
David R. ParsleySenior Vice President of Supply Chain Management
Kelli A. ValadeChief Operating Officer of Chili’s Grill & Bar
SHAREHOLDER INFORMATION
Executive OfficesBrinker International, Inc.6820 LBJ FreewayDallas, TX 75240(972) 980-9917
Annual Meeting
Brinker International, Inc.The Play Room in Building C6700 LBJ FreewayDallas,TX 75240
Independent Public AccountantsKPMG LLP717 N. Harwood, Suite 3100Dallas, TX 75201
NYSE Symbol: EAT
Stock Transfer Agent And RegistrarBNY Mellon Shareowner Services480 Washington BoulevardJersey City, NJ 07310-1900Customer Service (800) 213-5156TDD for Hearing Impaired (800) 231-5469Foreign Shareowners (201) 680-6578You can now access your Brinker Shareholder Account online via Investors Service Direct®.Visit us on the web at www.bnymellon.com/shareowner/equityaccess and follow the easy access instructions.
10-K AvailabilityThe company will furnish to any shareholder, without charge, a copy of the company’s annual report filed with the Securities and Exchange Commission on Form 10-K for the 2011 fiscal year from our website at: www.brinker.com or upon written request from the shareholder.
Please send your written request to:Secretary/Investor RelationsBrinker International, Inc.6820 LBJ FreewayDallas, TX 75240
CEO/CFO CertificationsOn November 15, 2010, the company submitted its annual Section 303A CEO certification to the New York Stock Exchange.The company also filed the CEO and CFO certifications required under Section 302 of the Sarbanes-Oxley Act of 2002 with the Securities and Exchange Commission as exhibits to its Annual Report on Form 10-K for the year ended June 29, 2011.
Chili’s® Grill & Bar and Maggiano’s Little Italy® are registered and/or proprietary trademarks of Brinker International Payroll Company, L.P.
Thursday, November 3, 2011 at 9:00 a.m.

To Our Shareholders, Team Members, Guests, Franchise Partners and Supplier PartnersDuring fiscal 2011, the restaurant industry continued to be tested by difficult macroeconomic conditions, flagging consumer confidence and high unemployment rates. Although navigation of the uncertain environment has been challenging, Brinker International® has continued to execute multi-dimensional strategies designed to drive shareholder value, positively impact the top line and improve the guest experience.
Those changes to our business model delivered strong results last fiscal year; and it’s an exciting time to be at Brinker. From the boardroom to the heart of our restaurants, Brinker brands are buzzing about the positive results we are delivering to our shareholders, guests, team members, franchise partners and supplier partners.
Brinker ended the fourth quarter with composite 2.6% gain in both comp sales and traffic for our Chili’s® Grill & Bar and Maggiano’s Little Italy® brands, marking our company’s fifth consecutive period of positive gains in those metrics. We delivered on our promise to drive shareholder value in part by repurchasing $420 million—more than 20 million shares—of company stock. Plus, we remain committed to doubling our fiscal 2010 earnings per share by the end of fiscal 2015, and our strong performance in fiscal 2011 is another significant step toward that goal.
We enter fiscal 2012 buoyed by the momentum created by success of our ongoing initiatives. Our brands stand resolute in their desire to drive guest satisfaction, team member engagement, and positive sales and traffic—in the upcoming fiscal year and beyond.
We believe in the strength of Chili’s Grill & Bar and Maggiano’s Little Italy, both heavyweight brands in their respective industry segments. Fiscal 2011 saw the resurgence of both brands for many reasons including the re-engineering of our business models with cutting-edge strategies, the infusion of talented new leadership and strong financial results.
Chili’s Grill & BarThe Southwestern spirit and heritage of Chili’s is translated into the food, service and warm hospitality we provide in our more than 1,500 company-owned and franchised restaurants everyday. This year, our flagship brand continued putting relevant, fresh spins on craveable foods that ignite the senses while exceeding the expectations of the most value-conscious guests.
Last March, Chili’s unveiled a long-term strategy to drive sustainable sales growth, and I am proud to say Chili’s “Plan to Win” is working.
We are building on the strength of Chili’s core menu with an emphasis on value. For instance, the “$20 Dinner for Two” was introduced as a limited time promotion, but was so popular it’s now a permanent fixture on the menu. This offer delivers great value at an affordable price. Our guests are telling us so, with value scores at the highest level we’ve seen in years.
Chili’s is also winning at lunch. Our new Lunch Break combos represent brand-changing innovation featuring great new sandwiches paired with soup or salad and served with homestyle fries. Offered at a value price point of $6, $7 and $8, these combos are a hit with guests and drive traffic for our brand. Since the rollout, declining lunch traffic has reversed, and we are seeing sustained positive trends. Lower-than-average food costs for the lunch menu also heighten positive financial results for the brand.
And Chili’s has found a way to keep up with the pace—literally. Chili’s is now competing head-to-head with fast casual restaurants by matching the pace of the dining experience to our guests’ expectations at lunch. We’ve achieved this through a convergence of changes in both front and heart of house processes.
the

Chili’s completed the implementation of team service—in which two team members jointly provide full-court hospitality to a shared station of tables—in restaurants nationwide. Results include increased guest satisfaction, higher earnings for our servers and significant labor cost savings for the business.
Additionally, we streamlined the heart of house labor model. Optimizing the labor component of the preparation process and maximizing food preparation yield resulted in significant reductions in both heart of house labor and food costs. Most importantly, consistent preparation means our guests receive better-tasting, high-quality meals in a timely manner.
Fiscal 2012 will bring additional efficiencies in the heart of house as we start to roll out retrofitted kitchen equipment, new point-of-sale kiosks and back office systems. In our dining rooms and most visibly to our guests, we’ll be placing special emphasis on the bar area and the happy hour daypart, as well as implementing new technology to grow Chili’s To Go business and revitalizing our brand presence by reimaging select restaurants. Menu innovations from our culinary team will ensure every menu item delivers our brand’s bold signature flavors. And our operations leadership will be focused on providing a better guest experience, making Chili’s truly Like No Place Else®.
Maggiano’s Little ItalyMaggiano’s Little Italy continues to offer everyday value with chef-created classics and contemporary Italian-American recipes at the brand’s 45 restaurants – 44 U.S. restaurants plus one international restaurant in Jeddah, Saudi Arabia. Guests come to us for made-from-scratch dishes like homemade pastas, signature salads, prime steak and fresh fish served in a warm and nostalgic atmosphere.
At Maggiano’s we’ve seen positive trends across the board, and we fully expect that momentum to continue.
Our traffic gains have been driven through an increased frequency of our core guest by creation of a new everyday value. Maggiano’s “Classic Pasta” offer provides a value proposition unmatched by the competition. Guests enjoy one entrée in-restaurant and go home with a second, full entrée—compliments of the chef. This new fixture on our menu keeps guests coming back throughout the year, growing our brand beyond special occasion dining.
Making guests feel special every day extends beyond the dining room to Maggiano’s warm and luxurious banquet spaces and through the brand’s growing delivery service. Last fiscal year, carryout and delivery sales grew by more than 25% and banquet business provided 20% of our overall revenue stream. The ability to satisfy large parties, both in a banquet setting and in the main dining room, continues to be one of the strongest differentiators for our brand.
In the upcoming fiscal year, Maggiano’s will capitalize on the opportunity to grow those additional lines of business—banquets, carryout and delivery. Within the restaurants, culinary innovation includes monthly, evolving chef specials featuring fresh, seasonal ingredients. We’ll be introducing the entire country to some of our regional, seasonal guest favorites like Peppermint Profiteroles and Butternut Squash Ravioli.
We recently shared the exciting news that Maggiano’s brand strength and positive momentum built in fiscal 2011 will allow the brand to return to growth by fiscal 2013. New restaurants mean new opportunities, which I am confident will grow into greater success for the Maggiano’s brand.
Global Business DevelopmentBrinker International continues our quest to become the global casual dining leader. Outside the U.S. and under the Chili’s and Maggiano’s brand flags, we operate 236 restaurants in 30 countries and two territories. Our most predominant markets overseas are Mexico and the Middle East and we continue to target growth in emerging markets, like Brazil, where we see a growing middle class, low restaurant penetration, demand for casual dining restaurants and a cultural preference for our brand offerings.

This year, we celebrated a market entrance in Russia and signed a development agreement to open five restaurants in Brazil. For the future, our global team will be focusing on high-potential markets to drive scale and efficiency, developing flexible business model extensions to increase market penetration and opportunistic capital investment opportunities.
Connecting with our guestsIn addition to traditional media platforms, we are creating unique connections with our guests by focusing on our ability to communicate appealing, direct messaging to our guests through our best-in-class email databases and social media platforms.
We’ve seen immediate results from email campaigns targeted to particular markets, whether it’s a “Give Back” night for a local charity, an exclusive wine dinner or a “Kids Eat Free” offer.
Maggiano’s more than doubled their brand’s fan base last year, and the brand continues to leverage the largest per restaurant database in the industry to target loyal customers and new guests. Chili’s focused efforts led to a four-fold growth in the brand’s email database last year and the brand recently celebrated its one millionth Facebook fan.
In addition to email, our brands use a variety of social media channels to engage and connect with our guests around the globe. Using popular social media sites such as Facebook and Twitter, we provide our guests with instant information regarding marketing promotions, giveaways, and the latest menu innovations, plus these platforms give our brands unique insight into our guests as well as a proven ability to drive sales and traffic.
Giving BackAt Brinker, we are committed—both at the corporate level and within each of our brands—to giving back to those who need our support the most.
For the seventh straight year, Chili’s teamed up with St. Jude Children’s Research Hospital through the Create-A-Pepper to Fight Childhood Cancer campaign. In September 2010, Chili’s helped raise $5.6 million in donations during National Childhood Cancer Awareness month to benefit the St. Jude mission of finding cures for children with cancer and other catastrophic childhood diseases.
Last year the cause made headway in the digital world, as guests donated via text message and Facebook, and followed the campaign on Twitter. Since its inception in 2002, the Create-A-Pepper campaign has raised more than $35 million, which is well over halfway to our goal of raising $50 million over 10 years for the hospital. Once completed, this extraordinary donation will be the largest donation from a single partner campaign in St. Jude history.
Maggiano’s relationship with the Make-A-Wish Foundation®, which grants the wishes of children with life-threatening medical conditions, began in 2003, and since then, our guests and team members have contributed more than $2.3 million to the Foundation.
In fiscal 2011 alone, Maggiano’s contributed $750,000 to the Make-A-Wish Foundation. Support from this year’s campaign has moved Maggiano’s into the top 10 national corporations supporting the Foundation.
Maggiano’s goal is to grant at least two wishes annually per restaurant through food and drink donations from the special Eat-A-Dish for Make-A-Wish menu, and the sale of decorative star-shaped cards which are displayed throughout the restaurant.
During the campaign, many restaurants also hosted individualized special events to raise money in each city and host send-off or welcome home parties, called Wish Enhancement Dinners, for deserving wish kids.
The Brinker Charity Golf Classic tournament leverages the strength of our Brinker brands and our love of giving back. Funds raised from the Golf Classic support four worthy charities – The Kenny Can Foundation, Texas Scottish Rite Hospital for Children, Northern Texas PGA Junior Golf

Foundation and the Limbs for Life Foundation. Since the tournament’s inception in October 2009, this event has raised more than $1 million for deserving charities. The 2010 tournament raised $600,000 and was also named, for the second straight year, the third highest grossing charity golf tournament in Dallas-Ft. Worth by the Dallas Business Journal.
Giving back to those in need is a way of life not only for our brands and our restaurant support center, but for our team members.
In 1997, we established the Brinker Family Fund to help BrinkerHeads and their families in times of catastrophic need. This program is wholly funded, managed and distributed by Brinker team members. And regardless of whether they participate, any Brinker team member is eligible to receive assistance from the Fund. Since the program began more than a decade ago, team members have donated more than $13.4 million to assist their co-workers in need.
Organizational ExcellenceAll of our goals and all the planning for the future mean nothing without execution by our team members; which is why at Brinker we believe they are our most important asset. To us, taking care of our people has always been, and always will be, one of our top priorities.
Our great team members are the biggest differentiator from our competitors. It is our team members at all levels within the organization who create memorable experiences for our guests, day-in and day-out. Our mission statement, Serving the world a great taste of life through the power of welcome®, begins and ends with the smart and talented people at Brinker. They are the ones who drive operational excellence, culinary innovation, value for our guests and, ultimately, positive growth for our company.
Our restaurant brands and restaurant support teams are led by some of the strongest, most results-oriented leaders I’ve ever had the pleasure of working alongside. Our executive team, working with our newly augmented board of directors well-versed in franchise, public company finance and global expansion, are well-positioned to continue delivering the results our shareholders have to come to expect—and earned—from our 36-year-young restaurant company.
The future holds great opportunities and many challenges for Brinker and our brands. I’m confident in our ability to capitalize on the opportunities while overcoming the challenges, leading to impressive results for our company.
We know our guests have many choices in the crowded marketplace. We believe strongly that making our guests feel special at Chili’s Grill & Bar and Maggiano’s Little Italy will create a unique competitive advantage for our brands and drive superior returns to our shareholders. That’s what success—for all Brinker stakeholders—looks like to me.
Sincerely,
Douglas H. Brooks Chairman of the Board Chief Executive Officer and President


UNITED STATESSECURITIES AND EXCHANGE COMMISSION
Washington, D.C. 20549
FORM 10-KANNUAL REPORT PURSUANT TO SECTION 13 OR 15(d) OF
THE SECURITIES EXCHANGE ACT OF 1934For the fiscal year ended June 29, 2011 Commission File No. 1-10275
BRINKER INTERNATIONAL, INC.(Exact name of registrant as specified in its charter)
Delaware 75-1914582(State or other jurisdiction ofincorporation or organization)
(I.R.S. employeridentification no.)
6820 LBJ Freeway, Dallas, Texas 75240(Address of principal executive offices) (Zip Code)
Registrant’s telephone number,including area code (972) 980-9917
Securities registered pursuant to Section 12(b) of the Act:Title of Each Class
Common Stock, $0.10 par value
Securities registered pursuant to Section 12(g) of the Act: NoneIndicate by check mark if the registrant is a well-known seasoned issuer, as defined in Rule 405 of the
Securities Act. Yes È No ‘
Indicate by check mark if the registrant is not required to file reports pursuant to Section 13 or Section 15(d)of the Act. Yes ‘ No È
Indicate by check mark whether the registrant has submitted electronically and posted on its corporate Website, if any, every Interactive Data File required to be submitted and posted pursuant to Rule 405 of RegulationS-T during the preceding 12 months (or for such shorter period that the registrant was required to submit and postsuch files). Yes È No ‘
Indicate by check mark whether the registrant (1) has filed all reports required to be filed by Section 13 or15(d) of the Securities Exchange Act of 1934 during the preceding 12 months (or for such shorter period that theregistrant was required to file such reports), and (2) has been subject to such filing requirements for the past90 days. Yes È No ‘
Indicate by check mark if disclosure of delinquent filers pursuant to Item 405 of Regulation S-K (229.405 ofthis chapter) is not contained herein, and will not be contained, to the best of the registrant’s knowledge, indefinitive proxy or information statements incorporated by reference in Part III of this Form 10-K or anyamendment to this Form 10-K. ‘
Indicate by check mark whether the registrant is a large accelerated filer, an accelerated filer, or anon-accelerated filer. See definition of “accelerated filer” in Rule 12b-2 of the Exchange Act. (Check one):Large accelerated filer È Accelerated filer ‘ Non-accelerated filer ‘ Smaller reporting company ‘
(Do not check if a smallerreporting company)
Indicate by check mark whether the registrant is a shell company (as defined in Rule 12b-2 of the Act).Yes ‘ No È
State the aggregate market value of the voting and non-voting common equity held by non-affiliatescomputed by reference to the price at which the common equity was last sold, or the average bid and asked priceof such common equity, as of the last business day of the registrant’s most recently completed second fiscalquarter. $1,737,188,902.
Indicate the number of shares outstanding of each of the registrant’s classes of common stock, as of thelatest practicable date.
Class Outstanding at August 12, 2011
Common Stock, $0.10 par value 82,677,559 shares


DOCUMENTS INCORPORATED BY REFERENCE
We have incorporated portions of our Annual Report to Shareholders for the fiscal year ended June 29, 2011into Part II hereof, to the extent indicated herein. We have also incorporated by reference portions of our ProxyStatement for our annual meeting of shareholders on November 3, 2011, to be dated on or about September 15,2011, into Part III hereof, to the extent indicated herein.
PART I
Item 1. BUSINESS.
General
References to “Brinker,” “the Company,” “we,” “us,” and “our” in this Form 10-K are references to BrinkerInternational, Inc. and its subsidiaries and any predecessor companies of Brinker International, Inc.
We own, develop, operate and franchise the Chili’s Grill & Bar (“Chili’s”) and Maggiano’s Little Italy(“Maggiano’s”) restaurant brands. The Company was organized under the laws of the State of Delaware inSeptember 1983 to succeed to the business operated by Chili’s, Inc., a Texas corporation, which was organized inAugust 1977. We completed the acquisition of Maggiano’s in August 1995. We sold Romano’s Macaroni Grill toMac Acquisition LLC, an affiliate of San Francisco-based Golden Gate Capital, in December 2008 and currentlyhold a 15.6% ownership interest in the new entity.
Restaurant Brands
Chili’s Grill & Bar
Chili’s, a recognized leader in the Bar & Grill category of casual dining, has been operating restaurants for36 years. Chili’s also enjoys a global presence with locations in 30 foreign countries and two U.S. territoriesaround the world. Consistent in all locations, whether domestic or international and company-owned orfranchised, Chili’s passion is making our guests feel special. Our Team Members, referred to as ChiliHeads, takespecial pride in serving America’s Favorites…Like No Place Else.
Chili’s varied menu features America’s favorites boldly flavored and freshly prepared, including severalsignature items such as Baby Back Ribs smoked in-house, Big Mouth Burgers, Sizzling Fajitas, hand-batteredChicken Crispers and house-made Chips and Salsa. The all-day menu offers our guests a generous selection ofappetizers, entrees and desserts at affordable prices. A special lunch section is available on weekdays. In additionto our flavorful food, Chili’s offers a full selection of alcoholic beverages available from the bar, with Margaritasand draft beer being favorites of our guests. For guests seeking convenience, Chili’s offers To Go service that canbe ordered via phone or on-line and most Chili’s offer a separate To Go entrance for service.
During the year ending June 29, 2011, at our company-owned restaurants, entrée selections ranged in menuprice from $6.00 to $17.49. The average revenue per meal, including alcoholic beverages, was approximately$13.52 per person. During this same year, food and non-alcoholic beverage sales constituted approximately86.4% of Chili’s total restaurant revenues, with alcoholic beverage sales accounting for the remaining 13.6%.Our average annual sales volume per Chili’s restaurant during this same year was $2.9 million.
Maggiano’s Little Italy
Maggiano’s is a full-service, national, casual dining Italian restaurant brand with a passion for makingpeople feel special. The exterior of each Maggiano’s restaurant varies to reflect local architecture, however, theinterior of all locations transport our guests back to a classic Italian-American restaurant in the style of NewYork’s Little Italy in the 1940s. Our Maggiano’s restaurants feature individual and family-style menus, and ourrestaurants also have extensive banquet facilities designed to host large party business or social events. We have
1

a full lunch and dinner menu offering chef-prepared, classic Italian-American fare in the form of appetizers,entrées with bountiful portions of pasta, chicken, seafood, veal and prime steaks, and desserts. Our Maggiano’srestaurants also offer a full range of alcoholic beverages, including a selection of premium wines. In addition,Maggiano’s offers a full carryout menu as well as local delivery services.
During the year ending June 29, 2011, entrée selections ranged in menu price from $12.95 to $39.95. Theaverage revenue per meal, including alcoholic beverages, was approximately $25.56 per person. During thissame year, food and non-alcoholic beverage sales constituted approximately 82.5% of Maggiano’s totalrestaurant revenues, with alcoholic beverage sales accounting for the remaining 17.5%. Sales from events at ourbanquet facilities made up 19.5% of our total restaurant revenues for the year. Our average annual sales volumeper Maggiano’s restaurant during this same year was $8.5 million.
Business Strategy
We are committed to strategies and initiatives that are centered on long-term sales and profit growth,enhancing the guest experience and team member engagement. These strategies are intended to differentiate ourbrands from the competition, reduce the costs associated with managing our restaurants and establish a strongpresence for our brands in key markets around the world. We will continue to maintain a strong balance sheetand financial flexibility to support our strategic initiatives and to provide stability in all operating environments.
Economic conditions have been turbulent over the last year and have provided a challenging operatingenvironment for the Company and the casual dining industry. Key economic factors such as total employment,consumer confidence and spending levels have been soft this year. More recently, the political environment andsoaring governmental deficits in the United States and abroad have negatively impacted consumer confidence. Inaddition, higher gas prices and the potential for near term commodity price increases may negatively impact theindustry. We anticipate that market conditions will continue to affect our business and consumers will remaincautious as the economy slowly rebounds. We will continue to evaluate our business and implement initiativesdesigned to mitigate risk, improve short-term sales and profitability and provide opportunities for long-termgrowth.
Our current initiatives are designed to drive profitable sales growth and improve the guest experience in ourrestaurants. We have implemented an improved service model at Chili’s which has resulted in labor efficienciesand better guest feedback. Additional labor savings were achieved through improved food preparationprocedures, a component of our kitchen retrofit initiative which was implemented at an accelerated pace in thesecond quarter. Another component of this initiative is the modification of our kitchens to include improvedtechnology and equipment to provide a more consistent, high quality product at a faster pace, while generatingsubstantial labor cost savings; this component is in early stages of rollout and implementation. We are also in theprocess of implementing new restaurant information systems which we anticipate will increase profits throughincreased kitchen efficiency and better inventory control. In addition to executing these operational strategies, wehave repurchased shares of our common stock in order to return value to our shareholders and recently executeda revised credit facility to increase our financial flexibility while taking advantage of more favorable financingcosts. We believe that the successful implementation of these operational and financial initiatives will help drivesales growth and operational efficiency while strengthening our competitive advantage and enhancingshareholder value.
We plan to leverage our improved business model and elevated guest experience by implementing multipleinitiatives that will further enhance guest traffic and sales. We continually evaluate our menu at Chili’s toimprove quality, freshness and value by introducing new items and improving existing favorites. Our new lunchmenu items are focused on value and pace to drive our lunch daypart sales. Additionally, we have introducednew items and promotions to enhance our dinner and happy hour business. We will continue to utilizepromotional activities as a tool to drive incremental sales; however, this is only one aspect of our overall salesstrategy. We are committed to offering a compelling everyday menu that provides items our guests prefer at asolid value. We intend to remodel a significant number of company-owned restaurants in fiscal 2012, revitalizing
2

Chili’s in a way which modernizes the brand and raises guest expectations regarding the quality of theexperience. Improvements at Chili’s will have the most significant impact on the business; however, our resultswill also benefit through additional contributions from Maggiano’s and our global business. Maggiano’s salestrends and traffic continue to improve significantly, driven by offering guests a great value with classic pasta,new menu items and direct marketing. We believe our unique food and signature drinks, improved service andupdated atmospheres will result in stronger brands and sustainable sales and profit growth through increasedguest loyalty and traffic.
Global expansion allows further diversification which is intended to enable us to build strength in a varietyof markets and economic conditions. This expansion will come through joint venture arrangements, equityinvestments and franchise relationships, taking advantage of demographic and eating trends that will acceleratein the international market over the next decade. Our growing percentage of franchise operations, bothdomestically and internationally, enable us to improve margins as royalty payments impact the bottom line.
The casual dining industry is a competitive business which is sensitive to changes in economic conditions,trends in lifestyles and fluctuating costs. Our priority remains increasing profitable growth over time in alloperating environments. We have designed both operational and financial strategies to achieve this goal and inour opinion, improve shareholder value. Success with our initiatives to improve sales trends and operationaleffectiveness will enhance the profitability of our restaurants and strengthen our competitive position. Theeffective execution of our financial strategies, including repurchasing shares of our common stock, disciplineduse of capital and efficient management of operating expenses, will further enhance our profitability and returnvalue to our shareholders. We remain confident in the financial health of our company, the long-term prospectsof the industry as well as our ability to perform effectively in a competitive marketplace and a variety ofeconomic environments.
Franchise Development
In fulfilling our long-term vision, our restaurant brands will continue to expand primarily through ourfranchisees and joint venture partners.
As part of our strategy to expand through our franchisees, our franchise operations (domestically andinternationally) increased in fiscal 2011. The following table illustrates the percentages of franchise operations(versus total restaurants) as of June 29, 2011 for the Company and by restaurant brand:
Percentage of FranchiseOperated Restaurants
Domestic International
Brinker . . . . . . . . . . . . . . . . . . . . . . . . . . . . . . . . . . . . . . . . . . . . . . . . . . . . . . . 30% 15%Chili’s . . . . . . . . . . . . . . . . . . . . . . . . . . . . . . . . . . . . . . . . . . . . . . . . . . . . . . 31% 15%Maggiano’s . . . . . . . . . . . . . . . . . . . . . . . . . . . . . . . . . . . . . . . . . . . . . . . . . . — 2%
International
We continue our international growth through development agreements with new and existing franchiseesand joint venture partners introducing our brands into new countries, as well as expanding them in existingcountries. At June 29, 2011, we had 32 total development arrangements. During the fiscal year 2011, ourinternational franchisees and joint venture partners opened 26 Chili’s restaurants. In the same year, we enteredinto new or renewed development agreements with four franchisees for the development of 49 Chili’srestaurants. The areas of development for these locations include all or portions of the following countries:Brazil, Colombia, Guatemala, India, Kuwait, Malaysia, and Taiwan.
Notably, we entered into an agreement with BTTO Participacoes Ltda to joint invest in a new company todevelop Chili’s in portions of Brazil. The new company anticipates developing approximately five restaurantsover the next five years. The first restaurant is projected to open in the first quarter of fiscal 2012.
3

As we develop our brands internationally, we will selectively pursue expansion through various means,including franchising and joint ventures. A typical international franchise development agreement provides forpayment of development fees and franchise fees in addition to subsequent royalty fees based on the gross sales ofeach restaurant. We expect future development agreements to remain limited to enterprises having significantexperience as restaurant operators and proven financial ability to support and develop multi-unit, as well as, insome instances, multi-brand operations.
Domestic
Domestic expansion is focused primarily through growth in our number of franchised restaurants. We areaccomplishing this part of our growth through existing, new or renewed development obligations with new orexisting franchisees. In addition, we have from time to time also sold and may sell company-owned restaurants toour franchisees (new or existing). At June 29, 2011, 15 total domestic development arrangements existed. Similarto our international franchise agreements, a typical domestic franchise development agreement provides forpayment of development and initial franchise fees in addition to subsequent royalty and advertising fees based onthe gross sales of each restaurant. We expect future domestic franchise development agreements to remainlimited to enterprises having significant experience as restaurant operators and proven financial ability to supportand develop multi-unit operations. In some instances, we have and may enter into development agreements formultiple brands with the same franchisee.
Domestic expansion efforts continue to focus not only on major metropolitan areas in the United States butalso on smaller market areas and non-traditional locations (such as airports, college campuses, toll plazas andfood courts) that can adequately support our restaurant brands.
During the year ended June 29, 2011, not including any restaurants we sold to our franchisees, our domesticfranchisees opened 11 Chili’s restaurants.
Company Development
Our near-term focus continues to be less on domestic development of new company-operated restaurantsallowing us to focus on our other strategic initiatives and areas of focus. We will continue to evaluate thedevelopment of new company-operated restaurants.
The following table illustrates the system-wide restaurants opened in fiscal 2011 and the planned openingsin fiscal 2012:
Fiscal 2011Openings(1)
Fiscal 2012Projected Openings
Chili’s:Company-operated . . . . . . . . . . . . . . . . . . . . . . . . . . . . . . . . . . . . . — —Franchise(2) . . . . . . . . . . . . . . . . . . . . . . . . . . . . . . . . . . . . . . . . . . 11 3
Maggiano’s . . . . . . . . . . . . . . . . . . . . . . . . . . . . . . . . . . . . . . . . . . . . . — —International:
Company-operated(3) . . . . . . . . . . . . . . . . . . . . . . . . . . . . . . . . . . — —Franchise(3) . . . . . . . . . . . . . . . . . . . . . . . . . . . . . . . . . . . . . . . . . . 26 35-40
Total . . . . . . . . . . . . . . . . . . . . . . . . . . . . . . . . . . . . . . . . . . . . . . 37 38-43
(1) The numbers in this column are the total of new restaurant openings and openings of relocatedrestaurants during fiscal 2011.
(2) The numbers on this line for fiscal 2012 are projected domestic franchise openings.
(3) The numbers on this line are for Chili’s and Maggiano’s.
4

We periodically reevaluate company-owned restaurant sites to ensure that site attributes have notdeteriorated below our minimum standards. In the event site deterioration occurs, each brand makes a concertedeffort to improve the restaurant’s performance by providing physical, operating and marketing enhancementsunique to each restaurant’s situation. If efforts to restore the restaurant’s performance to acceptable minimumstandards are unsuccessful, the brand considers relocation to a proximate, more desirable site, or evaluatesclosing the restaurant if the brand’s measurement criteria, such as return on investment and area demographictrends, do not support relocation. We closed three company-owned restaurants in fiscal 2011. We perform acomprehensive analysis that examines restaurants not performing at a required rate of return. A portion of theseclosed restaurants were performing below our standards or were near or at the expiration of their lease term. Ourstrategic plan is targeted to support our long-term growth objectives, with a focus on continued development ofthose restaurant brands that have the greatest return potential for the Company and our shareholders.
Restaurant Management
Our Chili’s and Maggiano’s brands have separate designated teams that support each brand for operations,finance, franchise, marketing, peopleworks and culinary. We believe these strategic, brand-focused teams fosterthe identities of the individual and uniquely positioned brands. To maximize efficiencies, brands continue toutilize common and shared infrastructure, including, among other services, accounting, information technology,purchasing, legal and restaurant development.
At the restaurant level, management structure varies by brand. A typical restaurant is led by a managementteam including a general manager, two to six additional managers, and for Maggiano’s, an additional three tofour chefs. The level of restaurant supervision depends upon the operating complexity and sales volume ofindividual locations.
We believe that there is a high correlation between the quality of restaurant management and the long-termsuccess of a brand. In that regard, we encourage increased experience at all management positions throughvarious short and long-term incentive programs, which may include equity ownership. These programs, coupledwith a general management philosophy emphasizing quality of life, have enabled us to attract and retain key teammembers.
We ensure consistent quality standards in all brands through the issuance of operations manuals covering allelements of operations and food and beverage manuals, which provide guidance for preparation of brand-formulated recipes. Routine visitation to the restaurants by all levels of supervision enforces strict adherence toour overall brand standards and operating procedures. Each brand is responsible for maintaining their operationaltraining program. The training program typically includes a two-to four-month training period for restaurantmanagement trainees. We also provide reoccurring management training for managers and supervisors toimprove effectiveness or prepare them for more responsibility.
Supply Chain
Our ability to maintain consistent quality throughout each of our restaurant brands depends upon acquiringproducts from reliable sources. Our pre-approved suppliers and our restaurants are required to adhere to strictproduct and safety specifications established through our quality assurance and culinary programs. Theserequirements ensure that high quality products are served in each of our restaurants. We strategically negotiatedirectly with major suppliers to obtain competitive prices. We also use purchase commitment contracts whenappropriate to stabilize the potentially volatile pricing associated with certain commodity items. All essentialproducts are available from pre-qualified distributors to be delivered to any of our restaurant brands.Additionally, as a purchaser of a variety of protein products, we do require our vendors to adhere to humaneprocessing standards for their respective industries and encourage them to evaluate new technologies for foodsafety and humane processing improvements. Because of the relatively rapid turnover of perishable foodproducts, inventories in the restaurants, consisting primarily of food, beverages and supplies, have a modest
5
aggregate dollar value in relation to revenues. Internationally, our franchisees and joint venture operations mayencounter cultural and regulatory differences resulting in differences with product specifications for internationalrestaurant locations.
Advertising and Marketing
Our brands generally focus on the eighteen to fifty-four year-old age group, which constitutes approximatelyhalf of the United States population. Though members of this target segment grew up on fast food, we believethat for many meal occasions, these consumers value the benefits of the casual dining category. In choosing notto cook, these consumers want the higher food quality, the time to relax with family and friends and the enhanceddining experience that our restaurant brands offer. To reach this target group, we use a mix of television, radio,print, outdoor or online advertising, mail (direct and electronic) and social media, with each of our restaurantbrands utilizing one or more of these mediums to meet the brand’s communication strategy and budget. Ourbrands have also developed and use to varying degrees sophisticated consumer marketing research techniques tomonitor guest satisfaction and emerging culinary trends, as well as to validate menu development and creativecampaigns.
Our franchise agreements generally require advertising contributions to us by the franchisees. We use thesecontributions for the purpose of helping retain an advertising agency, obtaining consumer insights, developingand producing brand-specific creative materials and purchasing national or regional media to meet the brand’sstrategy. Some franchisees also spend additional amounts on local advertising. Any such local advertising mustfirst be approved by us.
Team Members
As of June 29, 2011, we employed approximately 60,322 team members, 601 were restaurant support centerpersonnel in Dallas, and 4,029 were restaurant area directors, managers, or trainees. The remaining 55,692 wereemployed in non-management restaurant positions. Our executive officers have an average of 25 years ofexperience in the restaurant industry, some of whom began their careers in the restaurants we operate today.
We have a positive team member relations outlook and continue to focus on improving our team memberturnover rate. We have a variety of tools and strong resources in place to help us recruit and retain the best talentto work in our restaurants.
The majority of our team members, outside of restaurant management and restaurant support centerpersonnel, are paid on an hourly basis. We stand firm in the belief that we provide competitive workingconditions and wages favorable with other companies in our industry. Our team members are not covered by anycollective bargaining agreements.
Trademarks
We have registered and/or have pending, among other marks, “Brinker International”, “Chili’s”, “Chili’sBar & Bites”, “Chili’s Margarita Bar”, “Chili’s Southwest Grill & Bar”, “Chili’s Too”, “Maggiano’s”, and“Maggiano’s Little Italy”, as trademarks with the United States Patent and Trademark Office.
Available Information
We maintain an internet website with the address of http://www.brinker.com. You may obtain, free ofcharge, at our website, copies of our reports filed with, or furnished to, the Securities and Exchange Commission(the “SEC”) on Forms 10-K, 10-Q and 8-K. Any amendments to such reports are also available for viewing and
6

copying at our internet website. These reports will be available as soon as reasonably practicable after filing suchmaterial with, or furnishing it to, the SEC. In addition, you may view and obtain, free of charge, at our website,copies of our corporate governance materials, including, Corporate Governance Guidelines, Governance andNominating Committee Charter, Audit Committee Charter, Compensation Committee Charter, ExecutiveCommittee Charter, Code of Conduct and Ethical Business Policy, and Problem Resolution Procedure/WhistleBlower Policy.
Item 1A. RISK FACTORS.
We wish to caution you that our business and operations are subject to a number of risks and uncertainties.The factors listed below are important factors that could cause actual results to differ materially from ourhistorical results and from those projected in forward-looking statements contained in this report, in our otherfilings with the SEC, in our news releases, written or electronic communications, and verbal statements by ourrepresentatives.
You should be aware that forward-looking statements involve risks and uncertainties. These risks anduncertainties may cause our or our industry’s actual results, performance or achievements to be materiallydifferent from any future results, performances or achievements contained in or implied by these forward-lookingstatements. Forward-looking statements are generally accompanied by words like “believes,” “anticipates,”“estimates,” “predicts,” “expects,” and other similar expressions that convey uncertainty about future events oroutcomes.
Risks Related to Our Business
Competition may adversely affect our operations and financial results.
The restaurant business is highly competitive as to price, service, restaurant location, nutritional and dietarytrends and food quality, and is often affected by changes in consumer tastes, economic conditions, population andtraffic patterns. We compete within each market with locally-owned restaurants as well as national and regionalrestaurant chains, some of which operate more restaurants and have greater financial resources and longeroperating histories than ours. Despite a weak U.S. employment market, there is active competition for qualitymanagement personnel and hourly team members. We continue to face competition as a result of the trendtoward convergence in grocery, deli and restaurant services, including the offering by the grocery industry ofconvenient meals in the form of improved entrees and side dishes, as well as the trend in quick service and fastcasual restaurants toward higher quality food and beverage offerings. We compete primarily on the quality,variety and value perception of menu items, as well as the quality and efficiency of service, the attractiveness offacilities and the effectiveness of advertising and marketing programs.
Our restaurants also face competition from the introduction of new products and menu items by competitors,as well as substantial price discounting and other offers, and are likely to face such competition in the future.Although we may implement a number of business strategies, the future success of new products, initiatives andoverall strategies is highly difficult to predict and will be influenced by competitive product offerings, pricingand promotions offered by competitors. Our ability to differentiate our brands from their competitors, which is inpart limited by the advertising monies available to us and by consumer perception, cannot be assured. Thesefactors could reduce the gross sales or profitability at our restaurants, which would reduce the revenues generatedby company-owned restaurants and royalty payments from franchisees.
Changing health or dietary preferences may cause consumers to avoid our products in favor of alternativefoods. The food service industry as a whole rests on consumer preferences and demographic trends at the local,regional, national and international levels, and the impact on consumer eating habits of new informationregarding diet, nutrition and health. We and our franchisees depend on the sustained demand for our products,which may be affected by factors we do not control. Changes in nutritional guidelines issued by the federalgovernment agencies, issuance of similar guidelines or statistical information by other federal, state or local
7

municipalities, academic studies, or advocacy organizations among other things, may impact consumer choiceand cause consumers to select foods other than those that are offered by our restaurants. We may not be able toadequately adapt our menu offerings to keep pace with developments in current consumer preferences, whichmay result in reductions to the revenues generated by our company-operated restaurants and the payments wereceive from franchisees.
The global economic crisis continued to adversely impact our business and financial results in fiscal 2011and a prolonged economic recovery could materially affect us in the future.
The restaurant industry is dependent upon consumer discretionary spending. Consumer confidence has notrecovered from historic lows impacting the public’s ability and/or desire to spend discretionary dollars as a resultof job losses, home foreclosures, significantly reduced home values, investment losses in the financial markets,personal bankruptcies and reduced access to credit, resulting in lower levels of guest traffic in ourrestaurants. While sales and traffic gains have been made by the restaurant industry and our restaurants in fiscal2011, much of the economic improvement in the restaurant industry has come from cost savings initiatives. Ifthis current weak economic recovery continues for a prolonged period of time and/or deepens in magnitudereturning to the negative trends of the prior two years, our business, results of operations and ability to complywith the covenants under our credit facility could be materially affected. Deterioration in guest traffic and/or areduction in the average amount guests spend in our restaurants will negatively impact our revenues. This willresult in lower royalties collected, sales deleverage, spreading fixed costs across a lower level of sales, and will,in turn cause downward pressure on our profitability. The result could be further reductions in staff levels, assetimpairment charges and potential restaurant closures. In addition, the adverse fiscal condition of any states wherewe operate restaurants could result in these state governments issuing IOUs rather than tax refunds or employeepaychecks, which could affect guest spending patterns in these locations.
Future weak global economic results or recessionary effects on us are unknown at this time and could have apotential material adverse effect on our financial position and results of operations. There can be no assurancethat the government’s plan to restore fiscal responsibility or future plans to stimulate the economy will restoreconsumer confidence, stabilize the financial markets, increase liquidity and the availability of credit, or result inlower unemployment, which remains stubbornly high at the present time.
The current weak economic recovery could have a material adverse impact on our landlords or othertenants in retail centers in which we or our franchisees are located, which in turn could negatively affectour financial results.
If the weak economic recovery continues or returns to recessionary levels, our landlords may be unable toobtain financing or remain in good standing under their existing financing arrangements, resulting in failures topay required construction contributions or satisfy other lease covenants to us. In addition other tenants at retailcenters in which we or our franchisees are located or have executed leases may fail to open or may ceaseoperations. If our landlords fail to satisfy required co-tenancies, such failures may result in us or our franchiseesterminating leases or delaying openings in these locations. Also, decreases in total tenant occupancy in retailcenters in which we are located may affect guest traffic at our restaurants. All of these factors could have amaterial adverse impact on our operations.
Inflation may increase our operating expenses.
We have experienced impact from inflation. Inflation has caused increased food, labor and benefits costsand has increased our operating expenses. As operating expenses increase, we, to the extent permitted bycompetition, recover increased costs by increasing menu prices, or by reviewing, then implementing, alternativeproducts or processes, or by implementing other cost reduction procedures. We cannot ensure, however, that wewill be able to continue to recover increases in operating expenses due to inflation in this manner.
8

Changes in governmental regulation may adversely affect our ability to maintain our existing and futureoperations and to open new restaurants.
We are subject to the Fair Labor Standards Act (which governs such matters as minimum wages, overtimeand other working conditions), along with the Americans with Disabilities Act, the Immigration Reform andControl Act of 1986, various family leave mandates and a variety of other laws enacted, or rules and regulationspromulgated by federal, state and local governmental authorities that govern these and other employmentmatters, including, tip credits, working conditions, safety standards and immigration status. We expect increasesin payroll expenses as a result of federal and state mandated increases in the minimum wage, and although suchincreases are not expected to be material, we cannot assure you that there will not be material increases in thefuture. Enactment and enforcement of various federal, state and local laws, rules and regulations on immigrationand labor organizations may adversely impact the availability and costs of labor for our restaurants in a particulararea or across the United States. Other labor shortages or increased team member turnover could also increaselabor costs. In addition, our vendors may be affected by higher minimum wage standards or availability of labor,which may increase the price of goods and services they supply to us. We continue to review the health carereform law enacted by Congress in March of 2010 and regulations issued related to the law to evaluate thepotential impact of this new law on our business, and to accommodate various parts of the law as they take effect.There are no assurances that a combination of cost management and price increases can accommodate all of thecosts associated with compliance.
We are subject to laws and regulations, which vary from jurisdiction to jurisdiction, relating to nutritionalcontent and menu labeling. Compliance with these laws and regulations may lead to increased costs andoperational complexity, changes in sales mix and profitability, and increased exposure to governmentalinvestigations or litigation. We do not expect to incur material costs from compliance with the provision of thenew health care law requiring disclosure of calories on the menus, but cannot reliably anticipate any changes inguest behavior resulting from implementation of this portion of the law, which could have adverse effects on oursales or results of operations.
Each of our and our franchisees’ restaurants is also subject to licensing and regulation by alcoholic beveragecontrol, health, sanitation, safety and fire agencies in the state, county and/or municipality where the restaurant islocated. We generally have not encountered any material difficulties or failures in obtaining and maintaining therequired licenses and approvals that could impact the continuing operations of an existing restaurant, or delay orprevent the opening of a new restaurant. Although we do not, at this time, anticipate any occurring in the future,we cannot assure you that we or our franchisees will not experience material difficulties or failures that couldimpact the continuing operations of an existing restaurant, or delay the opening of restaurants in the future.
We are also subject to federal and state environmental regulations, and although these have not had amaterial negative effect on our operations, we cannot ensure that there will not be a material negative effect inthe future. In particular, the U.S. and other foreign governments have increased focus on environmental matterssuch as climate change, greenhouse gases and water conservation. This increased focus may lead to newinitiatives directed at regulating an as yet unspecified array of environmental matters. These efforts could resultin increased taxation or in future restrictions on or increases in costs associated with food and other restaurantsupplies, transportation costs and utility costs, any of which could decrease our operating profits and/ornecessitate future investments in our restaurant facilities and equipment to achieve compliance. Further, morestringent and varied requirements of local and state governmental bodies with respect to zoning, land use andenvironmental factors could delay, prevent or make cost prohibitive the continuing operations of an existingrestaurant or the development of new restaurants in particular locations.
The impact of current laws and regulations, the effect of future changes in laws or regulations that imposeadditional requirements and the consequences of litigation relating to current or future laws and regulations, orour inability to respond effectively to significant regulatory or public policy issues, could increase ourcompliance and other costs of doing business and therefore have an adverse effect on our results of operations.
9

Failure to comply with the laws and regulatory requirements of federal, state and local authorities could result in,among other things, revocation of required licenses, administrative enforcement actions, fines and civil andcriminal liability. Compliance with these laws and regulations can be costly and can increase our exposure tolitigation or governmental investigations or proceedings.
Our profitability may be adversely affected by increases in energy costs.
Our success depends in part on our ability to absorb increases in utility costs, in particular electricity andnatural gas. Various regions of the United States in which we operate multiple restaurants have experienced inthe recent past significant increases in utility prices. These increases have affected costs and if they occur again,it would have possible adverse effects on our profitability to the extent not otherwise recoverable through priceincreases or alternative products, processes or cost reduction procedures. Further, higher prices for petroleum-based fuels may be passed on to us by vendors putting further pressure on margins as well as impact our guestsdiscretionary funds and ability to patron our restaurants or guests’ menu choices.
Shortages or interruptions in the availability and delivery of food and other supplies may increase costs orreduce revenues.
Possible shortages or interruptions in the supply of food items and other supplies to our restaurants causedby inclement weather, natural disasters such as floods, drought and hurricanes, the inability of our vendors toobtain credit in a tightened credit market, food safety warnings or advisories or the prospect of suchpronouncements, or other conditions beyond our control could adversely affect the availability, quality and costof items we buy and the operations of our restaurants. Our inability to effectively manage supply chain risk couldincrease our costs and limit the availability of products critical to our restaurant operations.
Successful mergers, acquisitions, divestitures and other strategic transactions are important to our futuregrowth and profitability.
We evaluate potential mergers, acquisitions, franchisees of new and existing restaurants, joint ventureinvestments, and divestitures as part of our strategic planning initiative. These transactions involve variousinherent risks, including accurately assessing:
• the value, future growth potential, strengths, weaknesses, contingent and other liabilities and potentialprofitability of acquisition or divestiture candidates;
• our ability to achieve projected economic and operating synergies;
• unanticipated changes in business and economic conditions affecting an acquired business; and
• our ability to complete divestitures on acceptable terms and at or near the prices estimated as attainableby us.
If we are unable to meet our business strategy plan, our profitability in the future may be adverselyaffected.
Our ability to meet our business strategy plan is dependent upon, among other things, our and ourfranchisees’ ability to:
• increase gross sales and operating profits at existing restaurants with food and beverage options andhigh quality service desired by our guests through successful implementation of strategic initiatives;
• identify adequate sources of capital to fund and finance strategic initiatives, including remodeling ofexisting restaurants and new restaurant development;
• identify available, suitable and economically viable locations for new restaurants;
10

• obtain all required governmental permits (including zoning approvals and liquor licenses) on a timelybasis;
• hire all necessary contractors and subcontractors, obtain construction materials at suitable prices, andmaintain construction schedules; and
• hire and train or retain qualified managers and team members for existing and new restaurants.
The success of our franchisees is important to our future growth.
We have significantly increased the percentage of restaurants owned and operated by our franchisees. Whileour franchise agreements are designed to maintain brand consistency, this increase reduces our direct day-to-daycontrol over these restaurants and may expose us to risks not otherwise encountered if we maintained ownershipand control of same. These risks include franchisee defaults in their obligations to us arising from financial orother difficulties encountered by them, such as payments to us or maintenance and improvements obligations;limitations on enforcement of franchise obligations due to bankruptcy or insolvency proceedings; inability toparticipate in business strategy changes due to financial constraints; inability to meet rent obligations on leaseson which we retain contingent liability; and failure to comply with food quality and preparation requirementssubjecting us to litigation even when we are not legally liable for a franchisee’s actions or failure to act.
Our sales volumes generally decrease in winter months.
Our sales volumes fluctuate seasonally and are generally higher in the summer months and lower in thewinter months, which may cause seasonal fluctuations in our operating results.
Unfavorable publicity relating to one or more of our restaurants in a particular brand may taint publicperception of the brand.
Multi-unit restaurant businesses can be adversely affected by publicity resulting from poor food quality,illness or health concerns or operating issues stemming from one or a limited number of restaurants. In particular,since we depend heavily on the Chili’s brand for a majority of our revenues, unfavorable publicity relating to oneor more Chili’s restaurants could have a material adverse effect on the Chili’s brand, and consequently on ourbusiness, financial condition and results of operations.
We are dependent on information technology and any material failure of that technology could impair ourability to efficiently operate our business.
We rely on information systems across our operations, including, for example, point-of-sale processing inour restaurants, management of our supply chain, collection of cash, payment of obligations and various otherprocesses and procedures. Our ability to efficiently manage our business depends significantly on the reliabilityand capacity of these systems. The failure of these systems to operate effectively, problems with maintenance,upgrading or transitioning to replacement systems, or a breach in security of these systems could cause delays incustomer service and reduce efficiency in our operations. Significant capital investments might be required toremediate any problems.
We outsource certain business processes to third-party vendors that subject us to risks, includingdisruptions in business and increased costs.
Some business processes are currently outsourced to third parties. Such processes include gift card trackingand authorization, credit card authorization and processing, insurance claims processing, certain payrollprocessing, tax filings and other accounting processes. We also continue to evaluate our other business processesto determine if additional outsourcing is a viable option to accomplish our goals. We make a diligent effort toensure that all providers of outsourced services are observing proper internal control practices, such as redundant
11

processing facilities; however, there are no guarantees that failures will not occur. Failure of third parties toprovide adequate services could have an adverse effect on our results of operations, financial condition or abilityto accomplish our financial and management reporting.
Continuing disruptions in the global financial markets may adversely impact the availability and cost ofcredit and consumer spending patterns.
The continuing disruptions to the global financial markets and continuing weak economic recovery hasadversely impacted the availability of credit already arranged and the availability and cost of credit in the future.The disruptions in the financial markets also had an adverse effect on the U.S. and world economy, which hasnegatively impacted consumer spending patterns. There can be no assurance that various U.S. and worldgovernment present and future responses to the disruptions in the financial markets will restore consumerconfidence, stabilize the markets or increase liquidity or the availability of credit.
Declines in the market price of our common stock or changes in other circumstances that may indicate animpairment of goodwill could adversely affect our financial position and results of operations.
We perform our annual goodwill impairment test in the second quarter of each fiscal year. Interim goodwillimpairment tests are also required when events or circumstances change between annual tests that would morelikely than not reduce the fair value of our reporting units below their carrying value. It is possible that a changein circumstances such as the decline in the market price of our common stock or changes in consumer spendinglevels, or in the numerous variables associated with the judgments, assumptions and estimates made in assessingthe appropriate valuation of our goodwill, could negatively impact the valuation of our brands and create thepotential for a non-cash charge to recognize impairment losses on some or all of our goodwill. If we wererequired to write down a portion of our goodwill and record related non-cash impairment charges, our financialposition and results of operations would be adversely affected.
Changes to estimates related to our property and equipment, or operating results that are lower than ourcurrent estimates at certain restaurant locations, may cause us to incur impairment charges on certainlong-lived assets.
We make certain estimates and projections with regards to individual restaurant operations, as well as ouroverall performance in connection with our impairment analyses for long-lived assets. An impairment charge isrequired when the carrying value of the asset exceeds the estimated fair value or undiscounted future cash flowsof the asset. The projection of future cash flows used in this analysis requires the use of judgment and a numberof estimates and projections of future operating results. If actual results differ from our estimates, additionalcharges for asset impairments may be required in the future. If impairment charges are significant, our results ofoperations could be adversely affected.
Failure to protect the integrity and security of individually identifiable data of our guests and teammatescould expose us to litigation and damage our reputation.
We receive and maintain certain personal information about our guests and teammates. The use of thisinformation by us is regulated at the federal and state levels, as well as by certain third party contracts. If oursecurity and information systems are compromised or our business associates fail to comply with these laws andregulations and this information is obtained by unauthorized persons or used inappropriately, it could adverselyaffect our reputation, as well as operations, results of operations and financial condition, and could result inlitigation against us or the imposition of penalties. As privacy and information security laws and regulationschange, we may incur additional costs to ensure it remains in compliance.
Identification of material weakness in internal control may adversely affect our financial results.
We are subject to the ongoing internal control provisions of Section 404 of the Sarbanes-Oxley Act of 2002.Those provisions provide for the identification of material weaknesses in internal control. If such a material
12

weakness is identified, it could indicate a lack of adequate controls to generate accurate financial statements. Weroutinely assess our internal controls, but we cannot assure you that we will be able to timely remediate anymaterial weaknesses that may be identified in future periods, or maintain all of the controls necessary forcontinued compliance. Likewise, we cannot assure you that we will be able to retain sufficient skilled finance andaccounting team members, especially in light of the increased demand for such individuals among publiclytraded companies.
Other risk factors may adversely affect our financial performance.
Other risk factors that could cause our actual results to differ materially from those indicated in the forward-looking statements by affecting, among many things, pricing, consumer spending and consumer confidence,include, without limitation, changes in economic conditions and financial and credit markets (including risinginterest rates and costs for consumers and reduced disposable income); credit availability; increased costs of foodcommodities; increased fuel costs and availability for our team members, customers and suppliers; increasedhealth care costs; health epidemics or pandemics or the prospects of these events (such as reports on swine flu);consumer perceptions of food safety; changes in consumer tastes and behaviors; governmental monetary policies;changes in demographic trends; availability of employees; terrorist acts; energy shortages and rolling blackouts;and weather (including, major hurricanes and regional winter storms) and other acts of God.
Item 1B. UNRESOLVED STAFF COMMENTS.
None.
Item 2. PROPERTIES.
Restaurant Locations
At June 29, 2011, our system of company-owned and franchised restaurants included 1,579 restaurantslocated in 50 states, and Washington, D.C. We also have restaurants in the U.S. territories of Guam and PuertoRico and the countries of Bahrain, Canada, Dominican Republic, Ecuador, Egypt, El Salvador, Germany,Guatemala, Honduras, India, Indonesia, Japan, Jordan, Kuwait, Lebanon, Malaysia, Mexico, Oman, Peru,Philippines, Portugal, Qatar, Russia, Saudi Arabia, Singapore, South Korea, Syria, Taiwan, United Arab Emiratesand Venezuela. We have provided you a breakdown of our portfolio of restaurants in the two tables below:
Table 1: Company-owned vs. franchise (by brand) as of June 29, 2011:
Chili’sCompany-owned . . . . . . . . . . . . . . . . . . . . . . . . . . . . . . . . . . . . . . . . . . . . . . . . . . . . . . . . . . . 824Franchise . . . . . . . . . . . . . . . . . . . . . . . . . . . . . . . . . . . . . . . . . . . . . . . . . . . . . . . . . . . . . . . . . 710
Maggiano’sCompany-owned . . . . . . . . . . . . . . . . . . . . . . . . . . . . . . . . . . . . . . . . . . . . . . . . . . . . . . . . . . . 44Franchise . . . . . . . . . . . . . . . . . . . . . . . . . . . . . . . . . . . . . . . . . . . . . . . . . . . . . . . . . . . . . . . . . 1
Total . . . . . . . . . . . . . . . . . . . . . . . . . . . . . . . . . . . . . . . . . . . . . . . . . . . . . . . . . . . . . . . . . . . 1,579
Table 2: Domestic vs. foreign locations (by brand) as of June 29, 2011 (company-owned and franchised):
Domestic(No. of States)
Foreign(No. of countriesand territories)
Chili’s . . . . . . . . . . . . . . . . . . . . . . . . . . . . . . . . . . . . . . . . . . . . . . . . 1,299(50) 235(32)Maggiano’s . . . . . . . . . . . . . . . . . . . . . . . . . . . . . . . . . . . . . . . . . . . . 44(20 & D.C.) 1
13

Restaurant Property Information
The following table illustrates the approximate average dining capacity for each current prototypicalrestaurant in our restaurant brands:
Chili’s Maggiano’s
Square Feet . . . . . . . . . . . . . . . . . . . . . . . . . . . . . . . . . . . . . . . . . . . . . . 3,930-5,450 12,000-17,000Dining Seats . . . . . . . . . . . . . . . . . . . . . . . . . . . . . . . . . . . . . . . . . . . . . 150-220 500-700Dining Tables . . . . . . . . . . . . . . . . . . . . . . . . . . . . . . . . . . . . . . . . . . . . 35-50 100-150
The leases typically provide for a fixed rental plus percentage rentals based on sales volume. AtJune 29, 2011, we owned the land and building for 189 of our 868 company-operated restaurant locations. Forthese 189 restaurant locations, the net book value for the land was $142 million and for the buildings was$132 million. For the remaining 679 restaurant locations leased by us, the net book value of the buildings andleasehold improvements was $591 million. The 679 leased restaurant locations can be categorized as follows:536 are ground leases (where we lease land only, but own the building) and 143 are retail leases (where we leasethe land/retail space and building). We believe that our properties are suitable, adequate, well-maintained andsufficient for the operations contemplated. Some of our leased restaurants are leased for an initial lease term of5 to 30 years, with renewal terms of 1 to 35 years.
Other Properties
We own an office building containing approximately 108,000 square feet which we use for part of ourcorporate headquarters and menu development activities. We lease an additional office complex containingapproximately 198,000 square feet for the remainder of our corporate headquarters which is currently utilized byus, reserved for future expansion of our headquarters, or sublet to third parties. Because of our operationsthroughout the United States, we also lease office space in California, Colorado, Florida, New Jersey and Texasfor use as regional operation offices. The size of these office leases range from approximately 100 square feet toapproximately 4,000 square feet.
Item 3. LEGAL PROCEEDINGS.
Certain current and former hourly restaurant employees filed a lawsuit against us in California SuperiorCourt alleging violations of California labor laws with respect to meal and rest breaks. The lawsuit seekspenalties and attorneys’ fees and was certified as a class action in July 2006. On July 22, 2008, the CaliforniaCourt of Appeals decertified the class action on all claims with prejudice. On October 22, 2008, the CaliforniaSupreme Court granted writ to review the decision of the Court of Appeals. We intend to vigorously defend ourposition. It is not possible at this time to reasonably estimate the possible loss or range of loss, if any.
We are engaged in various other legal proceedings and have certain unresolved claims pending. Reserveshave been established based on our best estimates of our potential liability in certain of these matters. Theultimate liability, if any, for the aggregate amounts claimed cannot be determined at this time. Based uponconsultation with legal counsel, management is of the opinion that there are no matters pending or threatenedwhich are expected to have a material adverse effect, individually or in the aggregate, on our consolidatedfinancial condition or results of operations.
Item 4. SUBMISSION OF MATTERS TO A VOTE OF SECURITY HOLDERS.
None.
14
PART II
Item 5. MARKET FOR REGISTRANT’S COMMON EQUITY, RELATED STOCKHOLDERMATTERS AND ISSUER PURCHASES OF EQUITY SECURITIES.
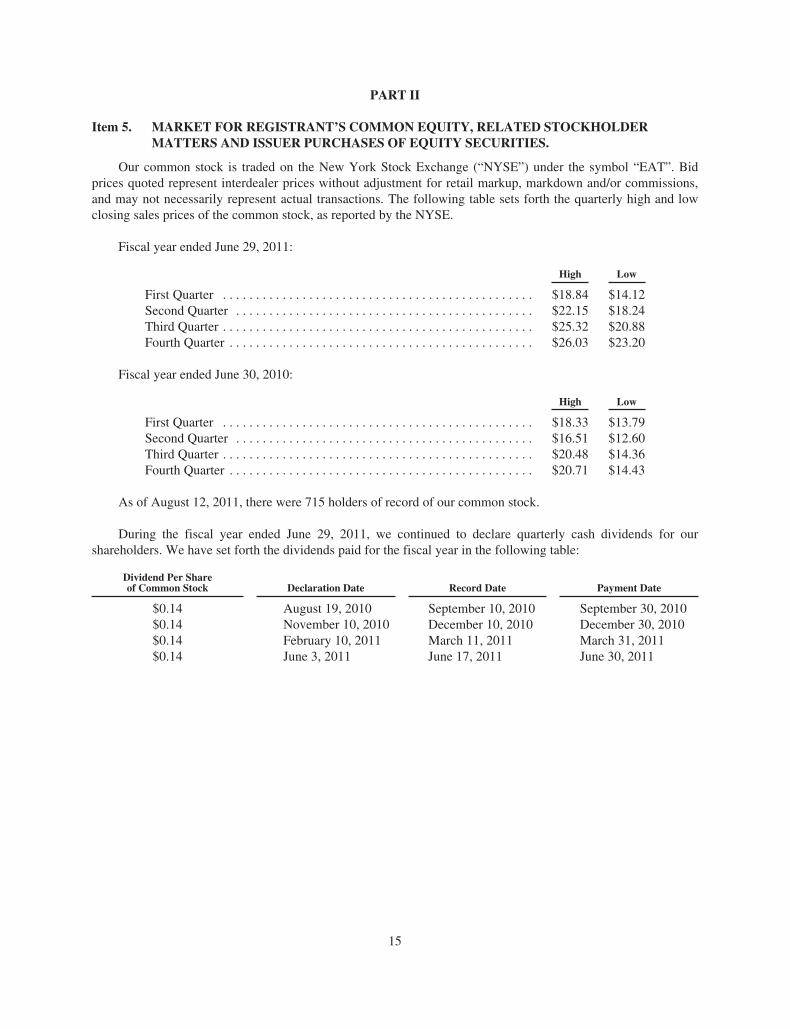
Our common stock is traded on the New York Stock Exchange (“NYSE”) under the symbol “EAT”. Bidprices quoted represent interdealer prices without adjustment for retail markup, markdown and/or commissions,and may not necessarily represent actual transactions. The following table sets forth the quarterly high and lowclosing sales prices of the common stock, as reported by the NYSE.
Fiscal year ended June 29, 2011:
High Low
First Quarter . . . . . . . . . . . . . . . . . . . . . . . . . . . . . . . . . . . . . . . . . . . . . . . $18.84 $14.12Second Quarter . . . . . . . . . . . . . . . . . . . . . . . . . . . . . . . . . . . . . . . . . . . . . $22.15 $18.24Third Quarter . . . . . . . . . . . . . . . . . . . . . . . . . . . . . . . . . . . . . . . . . . . . . . . $25.32 $20.88Fourth Quarter . . . . . . . . . . . . . . . . . . . . . . . . . . . . . . . . . . . . . . . . . . . . . . $26.03 $23.20
Fiscal year ended June 30, 2010:
High Low
First Quarter . . . . . . . . . . . . . . . . . . . . . . . . . . . . . . . . . . . . . . . . . . . . . . . $18.33 $13.79Second Quarter . . . . . . . . . . . . . . . . . . . . . . . . . . . . . . . . . . . . . . . . . . . . . $16.51 $12.60Third Quarter . . . . . . . . . . . . . . . . . . . . . . . . . . . . . . . . . . . . . . . . . . . . . . . $20.48 $14.36Fourth Quarter . . . . . . . . . . . . . . . . . . . . . . . . . . . . . . . . . . . . . . . . . . . . . . $20.71 $14.43
As of August 12, 2011, there were 715 holders of record of our common stock.
During the fiscal year ended June 29, 2011, we continued to declare quarterly cash dividends for ourshareholders. We have set forth the dividends paid for the fiscal year in the following table:
Dividend Per Shareof Common Stock Declaration Date Record Date Payment Date
$0.14 August 19, 2010 September 10, 2010 September 30, 2010$0.14 November 10, 2010 December 10, 2010 December 30, 2010$0.14 February 10, 2011 March 11, 2011 March 31, 2011$0.14 June 3, 2011 June 17, 2011 June 30, 2011
15

The following graph compares the cumulative five-year total return provided shareholders on BrinkerInternational, Inc.’s common stock relative to the cumulative total returns of the S&P 500 Index and the S&PRestaurants Index.
COMPARISON OF 5 YEAR CUMULATIVE TOTAL RETURN*Among Brinker International, Inc., the S&P 500 Index
and the S&P Restaurants Index
Brinker International, Inc. S&P 500 S&P Restaurants
$0
$50
$100
$150
$200
$250
6/28/06 6/27/07 6/25/08 6/24/09 6/30/10 6/29/11
*$100 invested on 6/28/06 in stock or index, including reinvestment of dividends.Fiscal year ending June 29.
Copyright© 2011 S&P, a division of The McGraw-Hill Companies Inc. All rights reserved.
The graph assumes a $100 initial investment and the reinvestment of dividends in our stock and each of theindexes on June 28, 2006 and its relative performance is tracked through June 29, 2011. The values shown areneither indicative nor determinative of future performance.
2006 2007 2008 2009 2010 2011
Brinker International . . . . . . $100.00 $125.33 $ 85.67 $ 72.15 $ 67.63 $117.68S&P 500 . . . . . . . . . . . . . . . $100.00 $120.59 $104.77 $ 77.30 $ 88.46 $115.61S&P Restaurants(1) . . . . . . . $100.00 $121.77 $122.19 $124.04 $155.20 $217.46
(1) The S&P Restaurants Index is comprised of Darden Restaurants, Inc., McDonald’s Corp., StarbucksCorp., and Yum! Brands Inc.
Except as described in the immediately preceding paragraphs, during the three-year period ended onAugust 12, 2011, we issued no securities which were not registered under the Securities Act of 1933, asamended.
16

We continue to maintain our share repurchase program; on June 3, 2011 our Board of Directors increasedour share repurchase authorization by $250 million, bringing the total authorization to $2,885 million. During thefourth quarter, we repurchased shares as follows (in thousands, except share and per share amounts):
TotalNumberof Shares
Purchased(a)
AveragePrice Paidper Share
Total Numberof Shares
Purchased asPart of Publicly
AnnouncedProgram
Approximate DollarValue
that May Yet bePurchased
Under the Program
March 31, 2011 through May 4, 2011 . . . . . 668,065 $24.76 663,158 $241,324May 5, 2011 through June 1, 2011 . . . . . . . 1,600,819 $24.68 1,600,000 $201,808June 2, 2011 through June 29, 2011 . . . . . . 274,909 $25.53 273,600 $444,819
Total . . . . . . . . . . . . . . . . . . . . . . . . . . . . . 2,543,793 $24.79 2,536,758
(a) These amounts include shares purchased as part of our publicly announced programs and shares ownedand tendered by team members to satisfy tax withholding obligations on the vesting of restricted shareawards, which are not deducted from shares available to be purchased under publicly announcedprograms. Unless otherwise indicated, shares owned and tendered by team members to satisfy taxwithholding obligations were purchased at the average of the high and low prices of the Company’sshares on the date of vesting. During the fourth quarter of fiscal 2011, 7,035 shares were tendered byteam members at an average price of $25.02.
Item 6. SELECTED FINANCIAL DATA.
The information set forth in that section entitled “Selected Financial Data” in our 2011 Annual Report toShareholders is presented on page F-1 of Exhibit 13 to this document. We incorporate that information in thisdocument by reference.
Item 7. MANAGEMENT’S DISCUSSION AND ANALYSIS OF FINANCIAL CONDITION ANDRESULTS OF OPERATIONS.
The information set forth in that section entitled “Management’s Discussion and Analysis of FinancialCondition and Results of Operations” in our 2011 Annual Report to Shareholders is presented on pages F-2through F-13 of Exhibit 13 to this document. We incorporate that information in this document by reference.
Item 7A. QUANTITATIVE AND QUALITATIVE DISCLOSURES ABOUT MARKET RISK.
The information set forth in that section entitled “Quantitative and Qualitative Disclosures About MarketRisk” contained within “Management’s Discussion and Analysis of Financial Condition and Results ofOperations” is in our 2011 Annual Report to Shareholders presented on pages F-12 and F-13 of Exhibit 13 to thisdocument. We incorporate that information in this document by reference.
Item 8. FINANCIAL STATEMENTS AND SUPPLEMENTARY DATA.
We refer you to the Index to Financial Statements attached hereto on page 21 for a listing of all financialstatements in our 2011 Annual Report to Shareholders. This report is attached as part of Exhibit 13 to thisdocument. We incorporate those financial statements in this document by reference.
Item 9. CHANGES IN AND DISAGREEMENTS WITH ACCOUNTANTS ON ACCOUNTING ANDFINANCIAL DISCLOSURE.
None.
17

Item 9A. CONTROLS AND PROCEDURES.
Disclosure Controls and Procedures
Based on their evaluation of our disclosure controls and procedures (as defined in Rules 13a-15 and 15d-15under the Securities Exchange Act of 1934 [the “Exchange Act”]), as of the end of the period covered by thisAnnual Report on Form 10-K, our principal executive officer and principal financial officer have concluded thatour disclosure controls and procedures were effective.
Management’s Report on Internal Control over Financial Reporting
“Management’s Report on Internal Control over Financial Reporting” and the attestation report of theindependent registered public accounting firm of KPMG, LLP on internal control over financial reporting are inour 2011 Annual Report to Shareholders and are presented on pages F-35 through F-37 of Exhibit 13 to thisdocument. We incorporate these reports in this document by reference.
Internal Control over Financial Reporting
There were no changes in our internal control over financial reporting during our fourth quarter endedJune 29, 2011, that have materially affected or are reasonably likely to materially affect, our internal control overfinancial reporting.
Item 9B. OTHER INFORMATION.
None.
PART III
Item 10. DIRECTORS, EXECUTIVE OFFICERS AND CORPORATE GOVERNANCE.
If you would like information about:
• our executive officers,
• our Board of Directors, including its committees, and
• our Section 16(a) reporting compliance,
you should read the sections entitled “Election of Directors—Information About Nominees”, “Committees of theBoard of Directors”, “Executive Officers”, and “Section 16(a) Beneficial Ownership Reporting Compliance” inour Proxy Statement to be dated on or about September 15, 2011, for the annual meeting of shareholders onNovember 3, 2011. We incorporate that information in this document by reference.
The Board of Directors has adopted a code of ethics that applies to all of the members of Board of Directorsand all of our employees, including, the principal executive officer, principal financial officer, principalaccounting officer or controller, or persons performing similar functions. A copy of the code is posted on ourinternet website at the internet address: http://www.brinker.com/corp_gov/ethical_business_ policy.asp. You mayobtain free of charge copies of the code from our website at the above internet address. Any amendment of, orwaiver from, our code of ethics will be posted on our website within four business days of such amendment orwaiver.
Item 11. EXECUTIVE COMPENSATION.
If you would like information about our executive compensation, you should read the section entitled“Executive Compensation—Compensation Discussion and Analysis” in our Proxy Statement to be dated on orabout September 15, 2011, for the annual meeting of shareholders on November 3, 2011. We incorporate thatinformation in this document by reference.
18

Item 12. SECURITY OWNERSHIP OF CERTAIN BENEFICIAL OWNERS AND MANAGEMENTAND RELATED STOCKHOLDER MATTERS.
If you would like information about our security ownership of certain beneficial owners and managementand related stockholder matters, you should read the sections entitled “Director Compensation for Fiscal 2011”,“Compensation Discussion and Analysis”, and “Stock Ownership of Certain Persons” in our Proxy Statement tobe dated on or about September 15, 2011, for the annual meeting of shareholders on November 3, 2011. Weincorporate that information in this document by reference.
Item 13. CERTAIN RELATIONSHIPS AND RELATED TRANSACTIONS, AND DIRECTORINDEPENDENCE.
If you would like information about certain relationships and related transactions, you should read thesection entitled “Compensation Committee Interlocks and Insider Participation” in our Proxy Statement to bedated on or about September 15, 2011, for the annual meeting of shareholders on November 3, 2011. Weincorporate that information in this document by reference.
If you would like information about the independence of our non-management directors and thecomposition of the Audit Committee, Compensation Committee and Governance and Nominating Committee,you should read the sections entitled “Director Independence” and “Committees of the Board of Directors” in ourProxy Statement to be dated on or about September 15, 2011, for the annual meeting of shareholders onNovember 3, 2011. We incorporate that information in this document by reference.
Item 14. PRINCIPAL ACCOUNTANT FEES AND SERVICES.
If you would like information about principal accountant fees and services, you should read the sectionentitled “Ratification of Independent Auditors” in our Proxy Statement to be dated on or about September 15,2011, for the annual meeting of shareholders on November 3, 2011. We incorporate that information in thisdocument by reference.
PART IV
Item 15. EXHIBITS AND FINANCIAL STATEMENT SCHEDULES.
(a)(1) Financial Statements.
We make reference to the Index to Financial Statements attached to this document on page 21 for a listingof all financial statements attached as Exhibit 13 to this document.
(a)(2) Financial Statement Schedules.
None.
(a)(3) Exhibits.
We make reference to the Index to Exhibits preceding the exhibits attached hereto on page E-1 for a list ofall exhibits filed as a part of this document.
19
SIGNATURES
Pursuant to the requirements of Section 13 or 15(d) of the Securities Exchange Act of 1934, the registranthas duly caused this report to be signed on its behalf by the undersigned, thereunto duly authorized.
BRINKER INTERNATIONAL, INC.,a Delaware corporation
By: /S/ GUY J. CONSTANT
Guy J. Constant,Executive Vice President and
Chief Financial Officer
Dated: August 29, 2011
Pursuant to the requirements of the Securities Exchange Act of 1934, we have signed in our indicatedcapacities on August 29, 2011.
Name Title
/S/ DOUGLAS H. BROOKS
Douglas H. Brooks
Chairman of the Board, President, and Chief ExecutiveOfficer (Principal Executive Officer)
/S/ GUY J. CONSTANT
Guy J. Constant
Executive Vice President and Chief Financial Officer(Principal Financial and Accounting Officer)
/S/ DAVID DENO
David Deno
Director
/S/ JOSEPH M. DEPINTO
Joseph M. DePinto
Director
/S/ MICHAEL DIXON
Michael Dixon
Director
/S/ HARRIET EDELMAN
Harriet Edelman
Director
/S/ MARVIN J. GIROUARD
Marvin J. Girouard
Director
/S/ JON LUTHER
Jon Luther
Director
/S/ JOHN W. MIMS
John W. Mims
Director
/S/ GEORGE R. MRKONIC
George R. Mrkonic
Director
/S/ ERLE NYE
Erle Nye
Director
/S/ ROSENDO G. PARRA
Rosendo G. Parra
Director
/S/ CECE SMITH
Cece Smith
Director
20

INDEX TO FINANCIAL STATEMENTS
The following is a listing of the financial statements which are attached hereto as part of Exhibit 13.
Page
Selected Financial Data . . . . . . . . . . . . . . . . . . . . . . . . . . . . . . . . . . . . . . . . . . . . . . . . . . . . . . . . . . . . . . . . . . F-1
Management’s Discussion and Analysis of Financial Condition and Results of Operations . . . . . . . . . . . . . F-2
Consolidated Statements of Income—Fiscal Years Ended June 29, 2011, June 30, 2010, and June 24,2009 . . . . . . . . . . . . . . . . . . . . . . . . . . . . . . . . . . . . . . . . . . . . . . . . . . . . . . . . . . . . . . . . . . . . . . . . . . . . . . . F-14
Consolidated Balance Sheets—June 29, 2011 and June 30, 2010 . . . . . . . . . . . . . . . . . . . . . . . . . . . . . . . . . F-15
Consolidated Statements of Shareholders’ Equity—Fiscal Years Ended June 29, 2011, June 30, 2010, andJune 24, 2009 . . . . . . . . . . . . . . . . . . . . . . . . . . . . . . . . . . . . . . . . . . . . . . . . . . . . . . . . . . . . . . . . . . . . . . . . F-16
Consolidated Statements of Cash Flows—Fiscal Years Ended June 29, 2011, June 30, 2010, and June 24,2009 . . . . . . . . . . . . . . . . . . . . . . . . . . . . . . . . . . . . . . . . . . . . . . . . . . . . . . . . . . . . . . . . . . . . . . . . . . . . . . . F-17
Notes to Consolidated Financial Statements . . . . . . . . . . . . . . . . . . . . . . . . . . . . . . . . . . . . . . . . . . . . . . . . . . F-18
Reports of Independent Registered Public Accounting Firm . . . . . . . . . . . . . . . . . . . . . . . . . . . . . . . . . . . . . F-35
Management’s Responsibility for Consolidated Financial Statements . . . . . . . . . . . . . . . . . . . . . . . . . . . . . . F-37
Management’s Report on Internal Control over Financial Reporting . . . . . . . . . . . . . . . . . . . . . . . . . . . . . . . F-37
All schedules are omitted as the required information is inapplicable or the information is presented in thefinancials statements or related notes.
21


INDEX TO EXHIBITS
Exhibit
3(a) Certificate of Incorporation of the Registrant, as amended.(1)
3(b) Bylaws of the Registrant.(2)
4(a) Form of 5.75% Note due 2014.(3)
4(b) Indenture between the Registrant and Citibank, N.A., as Trustee.(4)
4(c) Registration Rights Agreement by and among the Registrant, Citigroup Global Marketing, Inc., andJ.P. Morgan Securities, Inc., as representatives of the initial named purchasers of the Notes.(4)
10(a) Registrant’s 1991 Stock Option Plan for Non-Employee Directors and Consultants.(5)
10(b) Registrant’s 1992 Incentive Stock Option Plan.(5)
10(c) Registrant’s Stock Option and Incentive Plan.(6)
10(d) Registrant’s 1999 Stock Option and Incentive Plan for Non-Employee Directors and Consultants.(7)
10(e) Registrant’s Performance Share Plan Description.(8)
10(f) Credit Agreement dated as of June 22, 2010, by and among Registrant, Brinker RestaurantCorporation, Bank of America, N.A., Merrill Lynch, Pierce, Fenner & Smith Incorporated, J.P.Morgan Securities, LLC, Regions Capital Markets, a Division of Regions Bank, J.P. Morgan ChaseBank, N.A., Regions Bank, Compass Bank, and Wells Fargo Bank, National Association, as amendedby Amendment No. 1, dated as of August 9, 2011.(9)
13 2011 Annual Report to Shareholders.(10)
21 Subsidiaries of the Registrant.(11)
23 Consent of Independent Registered Public Accounting Firm.(11)
31(a) Certification by Douglas H. Brooks, Chairman of the Board, President and Chief Executive Officer ofthe Registrant, pursuant to 17 CFR 240.13a—14(a) or 17 CFR 240.15d—14(a).(11)
31(b) Certification by Guy Constant, Executive Vice President and Chief Financial Officer of theRegistrant, pursuant to 17 CFR 240.13a—14(a) or 17 CFR 240.15d—14(a).(11)
32(a) Certification by Douglas H. Brooks, Chairman of the Board, President and Chief Executive Officer ofthe Registrant, pursuant to 18 U.S.C. Section 1350, as adopted pursuant to Section 906 of theSarbanes-Oxley Act of 2002.(11)
32(b) Certification by Guy Constant, Executive Vice President and Chief Financial Officer of theRegistrant, pursuant to 18 U.S.C. Section 1350, as adopted pursuant to Section 906 of the Sarbanes-Oxley Act of 2002.(11)
99(a) Proxy Statement of Registrant.(12)
101+ Interactive Data File
+ As provided in Rule 406T of Regulation S-T, this information is furnished and not filed for purposesof Sections 11 and 12 of the Securities Act of 1933 and Section 18 of the Securities Exchange Act of1934.
(1) Filed as an exhibit to annual report on Form 10-K for year ended June 28, 1995, and incorporated herein byreference.
(2) Filed as an exhibit to quarterly report on Form 10-Q for quarter ended March 30, 2011, and incorporatedherein by reference.
E-1

(3) Included in exhibit 4(d) to annual report on Form 10-K for year ended June 30, 2004, and incorporatedherein by reference.
(4) Filed as an exhibit to registration statement on Form S-4 filed June 25, 2004, SEC File No. 333-116879, andincorporated herein by reference.
(5) Filed as an exhibit to annual report on Form 10-K for the year ended June 25, 1997, and incorporated hereinby reference.
(6) Filed as Appendix A to Proxy Statement of Registrant, filed on September 11, 2008, and incorporated hereinby reference.
(7) Filed as an exhibit to quarterly report on Form 10-Q for the quarter ended December 28, 2005, andincorporated herein by reference.
(8) Filed as an exhibit to quarterly report on Form 10-Q for the quarter ended March 29, 2006, and incorporatedherein by reference.
(9) Filed as an exhibit to current report on Form 8-K dated August 9, 2011, and incorporated herein byreference.
(10) Portions filed herewith, to the extent indicated herein.
(11) Filed herewith.
(12) To be filed on or about September 15, 2011.
E-2

EXHIBIT 13
BRINKER INTERNATIONAL, INC.
SELECTED FINANCIAL DATA
(In thousands, except per share amounts and number of restaurants)
Fiscal Years
2011 2010(a) 2009 2008 2007
Income Statement Data:Revenues . . . . . . . . . . . . . . . . . . . . . . . . . . . . . . . . . . . . . $2,761,386 $2,858,498 $3,276,362 $3,860,921 $4,007,771
Operating Costs and Expenses:Cost of sales . . . . . . . . . . . . . . . . . . . . . . . . . . . . . . . . . 742,283 816,015 923,668 1,101,125 1,126,756Restaurant labor . . . . . . . . . . . . . . . . . . . . . . . . . . . . . . 886,559 926,474 1,054,078 1,239,604 1,261,579Restaurant expenses . . . . . . . . . . . . . . . . . . . . . . . . . . 655,060 660,922 784,657 922,382 950,957Depreciation and amortization . . . . . . . . . . . . . . . . . . 128,447 135,832 145,220 147,393 171,768General and administrative . . . . . . . . . . . . . . . . . . . . . 132,834 136,270 147,372 163,996 188,630Other gains and charges . . . . . . . . . . . . . . . . . . . . . . . 10,783 28,485 118,612 196,364 (9,082)
Total operating costs and expenses . . . . . . . . . . . . . 2,555,966 2,703,998 3,173,607 3,770,864 3,690,608
Operating income . . . . . . . . . . . . . . . . . . . . . . . . . . . . . . 205,420 154,500 102,755 90,057 317,163Interest expense . . . . . . . . . . . . . . . . . . . . . . . . . . . . . . . . 28,311 28,515 33,330 45,862 30,929Other, net . . . . . . . . . . . . . . . . . . . . . . . . . . . . . . . . . . . . . (6,220) (6,001) (9,430) (4,046) (5,071)
Income before provision for income taxes . . . . . . . . . . . 183,329 131,986 78,855 48,241 291,305Provision for income taxes . . . . . . . . . . . . . . . . . . . . . . . 42,269 28,264 6,734 2,644 80,144
Income from continuing operations . . . . . . . . . . . . 141,060 103,722 72,121 45,597 211,161Income from discontinued operations, net of
taxes . . . . . . . . . . . . . . . . . . . . . . . . . . . . . . . . . . . 0 33,982 7,045 6,125 18,888
Net income . . . . . . . . . . . . . . . . . . . . . . . . . . . . . $ 141,060 $ 137,704 $ 79,166 $ 51,722 $ 230,049
Basic net income per share:Income from continuing operations . . . . . . . . . . . . $ 1.55 $ 1.02 $ 0.71 $ 0.44 $ 1.74
Income from discontinued operations . . . . . . . . . . . $ 0.00 $ 0.33 $ 0.07 $ 0.06 $ 0.16
Net income per share . . . . . . . . . . . . . . . . . . . . . . . . $ 1.55 $ 1.35 $ 0.78 $ 0.50 $ 1.90
Diluted net income per share:Income from continuing operations . . . . . . . . . . . . $ 1.53 $ 1.01 $ 0.70 $ 0.43 $ 1.70
Income from discontinued operations . . . . . . . . . . . $ 0.00 $ 0.33 $ 0.07 $ 0.06 $ 0.15
Net income per share . . . . . . . . . . . . . . . . . . . . . . . . $ 1.53 $ 1.34 $ 0.77 $ 0.49 $ 1.85
Basic weighted average shares outstanding . . . . . . . . . . 90,807 102,287 101,852 103,101 121,062
Diluted weighted average shares outstanding . . . . . . . . . 92,320 103,044 102,713 104,897 124,116
Balance Sheet Data:Working capital . . . . . . . . . . . . . . . . . . . . . . . . . . . . . . . . $ (184,241) $ 51,190 $ 110,812 $ 88,745 $ 277,298Total assets . . . . . . . . . . . . . . . . . . . . . . . . . . . . . . . . . . . 1,484,568 1,852,104 1,948,947 2,193,122 2,318,021Long-term obligations . . . . . . . . . . . . . . . . . . . . . . . . . . . 640,057 673,479 883,521 1,061,669 960,196Shareholders’ equity . . . . . . . . . . . . . . . . . . . . . . . . . . . . 438,910 728,748 646,924 595,089 805,089Dividends per share . . . . . . . . . . . . . . . . . . . . . . . . . . . . . $ 0.56 $ 0.47 $ 0.44 $ 0.42 $ 0.34Number of Restaurants Open (End of Period):Company-operated . . . . . . . . . . . . . . . . . . . . . . . . . . . . . 868 871 1,024 1,265 1,312Franchised/Joint venture . . . . . . . . . . . . . . . . . . . . . . . . . 711 679 665 623 489
Total . . . . . . . . . . . . . . . . . . . . . . . . . . . . . . . . . 1,579 1,550 1,689 1,888 1,801
Revenues of franchisees(b) $1,558,886
(a) Fiscal year 2010 consisted of 53 weeks while all other periods presented consisted of 52 weeks.
(b) Revenues of franchisees are not recorded as revenues by the Company. Management believes that franchisee revenueinformation is important in understanding the Company’s financial performance because these revenues are the basis onwhich the Company calculates and records franchise revenues.
F-1

MANAGEMENT’S DISCUSSION AND ANALYSIS OFFINANCIAL CONDITION AND RESULTS OF OPERATIONS
GENERAL
The following Management’s Discussion and Analysis of Financial Condition and Results of Operations(“MD&A”) is intended to help you understand our company, our operations, and our current operatingenvironment. For an understanding of the significant factors that influenced our performance during the pastthree fiscal years, the MD&A should be read in conjunction with the consolidated financial statements andrelated notes included in this annual report. Our MD&A consists of the following sections:
• Overview—a general description of our business and the casual dining segment of the restaurantindustry
• Results of Operations—an analysis of our consolidated statements of income for the three yearspresented in our consolidated financial statements
• Liquidity and Capital Resources—an analysis of cash flows, including capital expenditures,aggregate contractual obligations, share repurchase activity, known trends that may impact liquidity,and the impact of inflation
• Critical Accounting Estimates—a discussion of accounting policies that require critical judgmentsand estimates
We have a 52/53 week fiscal year ending on the last Wednesday in June. Fiscal years 2011 and 2009, whichended on June 29, 2011 and June 24, 2009, respectively, each contained 52 weeks. Fiscal year 2010 ended onJune 30, 2010 and contained 53 weeks. The 53rd week in fiscal 2010 contributed approximately $52 million ofincremental revenue and nine cents of incremental earnings per diluted share. While certain expenses increasedin direct relationship to additional revenue from the 53rd week, other expenses, such as fixed costs, are incurredon a calendar month basis.
At the beginning of fiscal 2011, we began reporting certain labor and related expenses in a separate captionon the consolidated statements of income titled restaurant labor. All prior year amounts previously classified inrestaurant expenses have been reclassified to conform to the fiscal 2011 presentation. Restaurant labor includesall compensation-related expenses, including benefits and incentive compensation, for restaurant team membersat the general manager level and below. Labor-related expenses attributable to supervision above the individualrestaurant level continue to be included in restaurant expenses. These reclassifications have no effect on our netincome or financial position as previously reported.
OVERVIEW
We are principally engaged in the ownership, operation, development, and franchising of the Chili’s Grill &Bar (“Chili’s”) and Maggiano’s Little Italy (“Maggiano’s”) restaurant brands. At June 29, 2011, we owned,operated, or franchised 1,579 restaurants. We sold On The Border Mexican Grill & Cantina (“On The Border”)to OTB Acquisition LLC (“OTB Acquisition”), an affiliate of San Francisco-based Golden Gate Capital, in June2010. On The Border is presented as discontinued operations in the consolidated financial statements.
We are committed to strategies and initiatives that are centered on long-term sales and profit growth,enhancing the guest experience and team member engagement. These strategies are intended to differentiate ourbrands from the competition, reduce the costs associated with managing our restaurants and establish a strongpresence for our brands in key markets around the world. We will continue to maintain a strong balance sheetand financial flexibility to support our strategic initiatives and to provide stability in all operating environments.
Economic conditions have been turbulent over the last year and have provided a challenging operatingenvironment for Brinker and the casual dining industry. Key economic factors such as total employment,
F-2

consumer confidence and spending levels have been soft this year. More recently, the political environment andgovernmental deficits in the United States and abroad have negatively impacted consumer confidence. Inaddition, higher gas prices and the potential for near term commodity price increases may negatively impact theindustry. We anticipate that market conditions will continue to affect our business and consumers will remaincautious. We will continue to evaluate our business and implement initiatives designed to mitigate risk, improveshort-term sales and profitability and provide opportunities for long-term growth.
Our current initiatives are designed to drive profitable sales growth and improve the guest experience in ourrestaurants. We have implemented a team service model at Chili’s which has resulted in labor efficiencies and betterguest feedback. Additional labor savings were achieved through improved food preparation procedures, acomponent of our kitchen retrofit initiative which was implemented at an accelerated pace in the second quarter.Another component of this initiative is the modification of our kitchens to include improved technology andequipment to provide a more consistent, high quality product at a faster pace, while generating substantial labor costsavings. We expect to install this equipment in a substantial number of Chili’s restaurants in fiscal 2012. We arealso implementing new restaurant information systems which we anticipate will increase profits through increasedkitchen efficiency and better inventory control. In addition to executing these operational strategies, we haverepurchased shares of our common stock in order to return value to our shareholders and recently executed a revisedcredit facility to increase our financial flexibility while taking advantage of more favorable financing costs. Webelieve that the successful implementation of these operational and financial initiatives will help drive sales growthand operational efficiency while strengthening our competitive advantage and enhancing shareholder value.
We plan to leverage our improved business model and elevated guest experience by implementing multipleinitiatives that will further enhance guest traffic and sales. We continually evaluate our menu at Chili’s toimprove quality, freshness and value by introducing new items and improving existing favorites. Our new lunchmenu items are focused on value and pace to drive our lunch daypart sales. Additionally, we have introducednew items and promotions to enhance our dinner and happy hour business. We will continue to utilizepromotional activities as a tool to drive incremental sales; however, this is only one aspect of our overall salesstrategy. We are committed to offering a compelling everyday menu that provides items our guests prefer at asolid value. We intend to remodel a significant number of company-owned restaurants in fiscal 2012, revitalizingChili’s in a way which modernizes the brand and raises guest expectations regarding the quality of theexperience. Improvements at Chili’s will have the most significant impact on the business; however, our resultswill also benefit through additional contributions from Maggiano’s and our global business. Maggiano’s salestrends and traffic continue to improve, driven by offering guests a great value with classic pasta, new menu itemsand direct marketing. We believe our unique food and signature drinks, improved service and updatedatmospheres will result in stronger brands and sustainable sales and profit growth through increased guest loyaltyand traffic.
Global expansion allows further diversification which is intended to enable us to build strength in a varietyof markets and economic conditions. This expansion will come through joint venture arrangements, equityinvestments and franchise relationships, taking advantage of demographic and eating trends that will acceleratein the international market over the next decade. Our growing percentage of franchise operations, bothdomestically and internationally, enable us to improve margins as royalty payments impact the bottom line.
The casual dining industry is a competitive business which is sensitive to changes in economic conditions,trends in lifestyles and fluctuating costs. Our priority remains increasing profitable growth over time in alloperating environments. We have designed both operational and financial strategies to achieve this goal and inour opinion, improve shareholder value. Success with our initiatives to improve sales trends and operationaleffectiveness will enhance the profitability of our restaurants and strengthen our competitive position. Theeffective execution of our financial strategies, including repurchasing shares of our common stock, disciplineduse of capital and efficient management of operating expenses, will further enhance our profitability and returnvalue to our shareholders. We remain confident in the financial health of our company, the long-term prospectsof the industry as well as our ability to perform effectively in a competitive marketplace and a variety ofeconomic environments.
F-3

RESULTS OF OPERATIONS FOR FISCAL YEARS 2011, 2010, AND 2009
The following table sets forth income and expense items as a percentage of total revenues for the periodsindicated:
Percentage of Total RevenuesFiscal Years
2011 2010 2009
Revenues . . . . . . . . . . . . . . . . . . . . . . . . . . . . . . . . . . . . . . . . . . 100.0% 100.0% 100.0%
Operating Costs and Expenses:Cost of sales . . . . . . . . . . . . . . . . . . . . . . . . . . . . . . . . . . . . . 26.9% 28.5% 28.2%Restaurant labor . . . . . . . . . . . . . . . . . . . . . . . . . . . . . . . . . . 32.1% 32.4% 32.2%Restaurant expenses . . . . . . . . . . . . . . . . . . . . . . . . . . . . . . . 23.7% 23.1% 23.9%Depreciation and amortization . . . . . . . . . . . . . . . . . . . . . . . 4.7% 4.8% 4.5%General and administrative . . . . . . . . . . . . . . . . . . . . . . . . . . 4.8% 4.8% 4.5%Other gains and charges . . . . . . . . . . . . . . . . . . . . . . . . . . . . 0.4% 1.0% 3.6%
Total operating costs and expenses . . . . . . . . . . . . . . . . . . 92.6% 94.6% 96.9%
Operating income . . . . . . . . . . . . . . . . . . . . . . . . . . . . . . . . . . . 7.4% 5.4% 3.1%Interest expense . . . . . . . . . . . . . . . . . . . . . . . . . . . . . . . . . . . . . 1.0% 1.0% 1.0%Other, net . . . . . . . . . . . . . . . . . . . . . . . . . . . . . . . . . . . . . . . . . (0.2)% (0.2)% (0.3)%
Income before provision for income taxes . . . . . . . . . . . . . . . . 6.6% 4.6% 2.4%Provision for income taxes . . . . . . . . . . . . . . . . . . . . . . . . . . . . 1.5% 1.0% 0.2%
Income from continuing operations . . . . . . . . . . . . . . . . . . . 5.1% 3.6% 2.2%Income from discontinued operations, net of taxes . . . . . . . 0.0% 1.2% 0.2%
Net income . . . . . . . . . . . . . . . . . . . . . . . . . . . . . . . . . . . . 5.1% 4.8% 2.4%
REVENUES
Revenues for fiscal 2011 decreased to $2,761.4 million, a 3.4% decrease from the $2,858.5 milliongenerated for fiscal 2010. Excluding revenues of approximately $52 million attributable to the additionaloperating week in fiscal 2010, the decrease in revenue was primarily due to the change in comparable restaurantsales resulting from a decline in guest traffic, partially offset by favorable menu pricing, as well as a decline incapacity at company-owned restaurants as follows:
Fiscal Year Ended June 29, 2011(1)
ComparableSales
PriceIncrease Mix Shift Traffic Capacity
Company-owned . . . . . . . . . . . . . . (1.2)% 1.1% (0.1)% (2.2)% (1.9)%Chili’s . . . . . . . . . . . . . . . . . . . . . (2.0)% 1.2% 0.0% (3.2)% (2.0)%Maggiano’s . . . . . . . . . . . . . . . . 3.9% 0.7% (0.6)% 3.8% 0.2%
Franchise(2) . . . . . . . . . . . . . . . . . . (1.5)%Domestic . . . . . . . . . . . . . . . . . . (3.2)%International . . . . . . . . . . . . . . . . 3.5%
System-wide(3) . . . . . . . . . . . . . . . (1.3)%
(1) Amounts are calculated based on 52 weeks in each fiscal year.
(2) Revenues generated by franchisees are not included in revenues on the consolidatedstatements of income; however, we generate royalty revenue and advertising fees basedon franchisee revenues, where applicable. We believe including franchisee comparablerestaurants revenues provides investors information regarding brand performance that isrelevant to current operations and may impact future restaurant development.
F-4

(3) System-wide comparable restaurant sales are derived from sales generated by company-owned Chili’s and Maggiano’s restaurants in addition to the sales generated atfranchisee operated restaurants.
Chili’s revenues decreased to $2,321.7 million in fiscal 2011, a 4.9% decrease from $2,441.9 million infiscal 2010. The decrease was primarily driven by the impact of the additional operating week in fiscal 2010 anda decline in comparable restaurant sales of 2.0% attributable to a decrease in guest traffic, partially offset byfavorable menu pricing. Revenues were also impacted by a decrease in capacity of 2.0% for fiscal 2011 (asmeasured by average-weighted sales weeks) primarily due to three restaurant closures during fiscal 2011.
Maggiano’s revenues increased to $374.0 million in fiscal 2011, a 6.3% increase from $352.0 million infiscal 2010 driven primarily by an increase in guest traffic partially offset by the impact of the additionaloperating week in fiscal 2010.
Royalty and franchise revenues increased 1.7% to $65.7 million in fiscal 2011 compared to $64.6 million infiscal 2010. The increase is primarily due to the net addition of six domestic and 23 international franchisedrestaurants during fiscal 2011. Royalty revenues are recognized based on the sales generated by our franchiseesand reported to us. Our franchisees generated approximately $1,559 million in sales, an increase of 1.1% overprior year.
Revenues for fiscal 2010 decreased to $2,858.5 million, a 12.8% decrease from the $3,276.4 milliongenerated for fiscal 2009. The decrease in revenue was primarily attributable to the change in comparablerestaurant sales resulting from a decline in guest traffic, product mix and capacity at company-owned restaurants,partially offset by the positive impact of the additional operating week as follows:
Fiscal Year Ended June 30, 2010(1)
ComparableSales
PriceIncrease Mix Shift Traffic Capacity
Company-owned . . . . . . . . . . . . . . (4.2)% 1.3% (1.2)% (4.3)% (13.2)%Chili’s . . . . . . . . . . . . . . . . . . . (4.6)% 1.5% (1.2)% (4.9)% (4.1)%Maggiano’s . . . . . . . . . . . . . . (1.2)% 0.5% (1.2)% (0.5)% 2.3%
Franchise(2) . . . . . . . . . . . . . . . . . . (4.8)%Domestic . . . . . . . . . . . . . . . . (5.9)%International . . . . . . . . . . . . . . (1.2)%
System-wide(3) . . . . . . . . . . . . . . . (4.4)%
(1) Amounts are calculated based on 52 weeks in each fiscal year.
(2) Revenues generated by franchisees are not included in revenues on the consolidatedstatements of income; however, we generate royalty revenue and advertising fees basedon franchisee revenues, where applicable. We believe including franchisee comparablerestaurants revenues provides investors information regarding brand performance that isrelevant to current operations and may impact future restaurant development.
(3) System-wide comparable restaurant sales are derived from sales generated by company-owned Chili’s and Maggiano’s restaurants in addition to the sales generated atfranchisee operated restaurants.
Our capacity decreased 13.2% in fiscal 2010 (as measured by average-weighted sales weeks). The reduction incapacity was primarily due to the sale of 189 Macaroni Grill restaurants at the end of the second quarter of fiscal2009 as well as the sale of 21 Chili’s restaurants to a franchisee and 11 restaurant closures during fiscal 2010.
F-5

Chili’s revenues decreased to $2,441.9 million in fiscal 2010, a 6.5% decrease from $2,611.9 million infiscal 2009. The decrease was primarily driven by a decline in comparable restaurant sales of 4.6%, partiallyoffset by the impact of the additional operating week in fiscal 2010. The decrease in comparable restaurant saleswas attributable to a decline in guest traffic and unfavorable product mix shifts, partially offset by favorablemenu pricing. Revenues were also impacted by a decrease in capacity of 4.1% for fiscal 2010 (as measured byaverage-weighted sales weeks) primarily due to the sale of 21 restaurants to a franchisee and 10 Chili’s restaurantclosures during fiscal 2010.
Maggiano’s revenues increased to $352.0 million in fiscal 2010, a 2.1% increase from $344.6 million infiscal 2009. The increase was primarily driven by the additional operating week in fiscal 2010 and an increase incapacity of 2.3% for fiscal 2010 (as measured by average-weighted sales weeks) primarily due to one restaurantopening in fiscal 2010. Revenues were also impacted by a decrease in comparable restaurant sales of 1.2%resulting primarily from unfavorable product mix shifts.
Royalty and franchise revenues of $64.6 million for fiscal 2010 were flat as compared to fiscal 2009.Royalty revenues are recognized based on the sales generated by our franchisees and reported to us.
COSTS AND EXPENSES
Cost of sales, as a percent of revenues, decreased 1.6% in fiscal 2011. Cost of sales was favorably impactedprimarily by improved product mix at Chili’s and decreased commodity pricing for chicken and cheese. Cost ofsales, as a percent of revenues, increased 0.3% in fiscal 2010. Cost of sales was negatively impacted primarily bypromotions and the impact of the new menu rollout at Chili’s, partially offset by favorable menu pricing andfavorable commodity pricing for beef and chicken.
Restaurant labor, as a percent of revenues, decreased 0.3% in fiscal 2011 primarily driven by lower laborexpenses due to the successful implementation of team service and food preparation initiatives at Chili’s,partially offset by higher restaurant manager incentive compensation resulting from improved restaurantperformance. Restaurant labor, as a percent of revenues, increased 0.2% in fiscal 2010 primarily driven by theunfavorable impact of menu promotions and the rollout of new menu items for Chili’s, partially offset by lowermanager salaries and incentive compensation due to reduced headcount. Restaurant labor includes allcompensation-related expenses, including benefits and incentive compensation, for restaurant team members atthe general manager level and below.
Restaurant expenses, as a percent of revenues, increased 0.6% in fiscal 2011 primarily driven by salesdeleverage on fixed costs from the additional operating week in fiscal 2010 and current year changes toMaggiano’s banquet billing and compensation structure, partially offset by a reduced utilities expense due tolower rates. Restaurant expenses, as a percent of revenues, decreased 0.8% in fiscal 2010 primarily driven byreduced utility and advertising expense, sales leverage due to the additional operating week and the receipt of a$3.3 million credit card class action lawsuit settlement.
Depreciation and amortization decreased $7.4 million in fiscal 2011 and $9.4 million in fiscal 2010primarily driven by an increase in fully depreciated assets, restaurant closures and impairments, partially offsetby an increase in depreciation due to asset replacements and investments in existing restaurants.
General and administrative expenses decreased $3.4 million in fiscal 2011 primarily due to reductions insalary and stock-based compensation expenses resulting from lower headcount driven by organizational changes,partially offset by increased performance based compensation, higher professional fees and the expiration of thetransitional services agreement with Macaroni Grill that offset the internal cost of providing the services. Generaland administrative expenses decreased $11.1 million in fiscal 2010 primarily due to lower headcount and the saleof Macaroni Grill in the second quarter of fiscal 2009, decreases in professional fees, and income related totransitional services provided to Macaroni Grill. The reductions in general and administrative expenses werepartially offset by higher annual performance based compensation expense.
F-6

Other gains and charges in fiscal 2011 consisted of $5.0 million in severance and other benefits resultingfrom organizational changes, $3.0 million in lease termination charges related to previously closed restaurantsand $1.9 million in long-lived asset impairments related to underperforming restaurants that are continuing tooperate. Additionally, we recorded a $1.5 million charge related to litigation and net gains of $1.7 million relatedto land sales.
Other gains and charges in fiscal 2010 included a $19.8 million impairment charge related to 22underperforming restaurants that are continuing to operate. We also recorded $4.0 million in lease terminationcharges and $5.4 million in long-lived asset impairments resulting from the decision to close nineunderperforming restaurants. Additionally, we recorded $2.4 million in lease termination charges related torestaurants closed in prior years and $1.9 million in severance and other benefits resulting from organizationalchanges. These charges were partially offset by gains of $4.9 million related to the sale of 21 restaurants to afranchisee and land sales.
Other gains and charges in fiscal 2009 included $59.4 million in charges primarily resulting from the decisionto close 37 underperforming restaurants, including eight international restaurants. The charges include $40.8 millionin long-lived asset impairments, $5.2 million in lease termination charges, $1.2 million of charges related to thewrite-off of other assets and liabilities, and $2.1 million of charges related to realized foreign currency translationlosses. Also included is $6.2 million in lease termination charges associated with restaurants closed in prior years.Additionally, we recorded a $10.5 million impairment charge related to underperforming restaurants, a $7.7 milliongoodwill impairment charge as a result of the international restaurant closings and organizational changes resultedin charges of $5.5 million for severance and other costs. In December 2008, we sold Macaroni Grill to MacAcquisition and recorded a loss on the sale of $40.4 million. The charges were partially offset by a $3.9 million gainrelated to the sale of nine restaurants to a franchisee and land sales.
Interest expense remained flat in fiscal 2011 as a result of higher average interest rates on our debt carryingvariable interest rates, offset by the impact of a lower average borrowing balance and $1.7 million in acceleratedexpense in the prior year related to the remaining capitalized financing costs associated with the terminatedrevolving credit facility in fiscal 2010. Interest expense decreased $4.8 million in fiscal 2010 primarily as a resultof a lower average borrowing balance and a decrease in interest rates on our debt carrying variable interest rates.We repaid $190.0 million on the three-year term loan during the year. These decreases were partially offset by$1.7 million in accelerated expense related to the remaining capitalized financing costs associated with theterminated revolving credit facility.
Other, net in fiscal 2011 includes $5.3 million of sublease income from Mac Acquisition and franchisees aspart of the sale agreements and other subtenants as well as $0.6 million of interest income on short-terminvestment balances. Other, net in fiscal 2010 includes $4.7 million of sublease income from Mac Acquisition aspart of the sale agreement and other subtenants as well as $0.6 million of interest income on short-terminvestment balances. Other, net in fiscal 2009 includes a $5.5 million gain from insurance proceeds, $1.7 millionof sublease income and $1.6 million of interest income on short-term investment balances.
Income from discontinued operations, net of taxes, increased to $34.0 million in fiscal 2010 from $7.0million in fiscal 2009. In fiscal 2010, we recorded a $16.5 million pre-tax gain on the sale of the On The Borderrestaurants.
INCOME TAXES
The effective income tax rate from continuing operations increased to 23.1% for fiscal 2011 from 21.4% infiscal 2010 primarily due to an increase in earnings, partially offset by the resolution of certain tax positionsresulting in a positive impact in the current year greater than the prior year. Excluding the impact of special itemsand resolved tax positions, the effective income tax rate from continuing operations increased to 27.8% in fiscal2011 from 26.0% in fiscal 2010 due to an increase in earnings, partially offset by a decrease in state income taxexpense.
F-7

The effective income tax rate increased to 21.4% for fiscal 2010 from 8.5% for fiscal 2009. The variation inthe effective tax rates during fiscal 2009 was significantly impacted by the loss on the sale of Macaroni Grill andcharges for long-lived asset impairments. Excluding the impact of these significant non-recurring items, theeffective income tax rate from continuing operations decreased slightly to 26.0% in fiscal 2010 compared to26.5% in fiscal 2009 due to a decrease in earnings.
LIQUIDITY AND CAPITAL RESOURCES
Cash Flows
Cash Flow from Operating Activities—Continuing Operations
During fiscal 2011, net cash flow provided by operating activities of continuing operations was $260.0million compared to $297.4 million in the prior year. The decrease was driven by significant changes in workingcapital during the fiscal year. The settlement of liabilities associated with the On The Border brand and cash paidfor taxes in the current year negatively impacted operating cash flow in comparison to the prior year. Cash paidfor taxes in the prior year was positively impacted by the recognition of losses related to the Macaroni Grilldivestiture.
Working capital decreased to a deficit of $184.2 million at June 29, 2011 from a surplus of $51.2 million atJune 30, 2010. The deficit as of June 29, 2011 was primarily due to purchases of treasury stock and quarterlydividend payments in fiscal 2011, partially offset by the timing of income tax and operational payments. Thesurplus as of June 30, 2010 was primarily due to proceeds from the sale of On The Border at year-end and theretention of cash from operations to maximize our liquidity position.
Cash Flow from Investing Activities—Continuing Operations
2011 2010
Net cash used in investing activities (in thousands):Payments for property and equipment . . . . . . . . . . . . . . . . . . . . . . $(70,361) $(60,879)Proceeds from sale of assets . . . . . . . . . . . . . . . . . . . . . . . . . . . . . . 8,696 26,603Investments in equity method investees . . . . . . . . . . . . . . . . . . . . . (2,896) —Decrease in restricted cash . . . . . . . . . . . . . . . . . . . . . . . . . . . . . . . — 29,749
$(64,561) $ (4,527)
Net cash used in investing activities of continuing operations for fiscal 2011 increased to approximately$64.6 million compared to $4.5 million in the prior year. Capital expenditures increased to $70.4 million forfiscal 2011 compared to $60.9 million for fiscal 2010 driven primarily by increases in asset replacements,investments in information technology infrastructure and remodel investments. We estimate that our capitalexpenditures during fiscal 2012 will be approximately $155 million to $165 million and will be funded entirelyby cash from operations.
During fiscal 2010, we sold 21 Chili’s restaurants to a franchisee for $19.0 million. We also dissolved ourwholly-owned captive insurance company which allowed us to access $29.7 million of cash that was previouslypledged as collateral and classified as restricted.
F-8

Cash Flow from Financing Activities—Continuing Operations
2011 2010
Net cash used in financing activities (in thousands):Purchases of treasury stock . . . . . . . . . . . . . . . . . . . . . . . . . . . . $(422,099) $ (22,868)Payments of dividends . . . . . . . . . . . . . . . . . . . . . . . . . . . . . . . . (53,185) (34,448)Proceeds from issuances of treasury stock . . . . . . . . . . . . . . . . . 33,057 2,396Payments on long-term debt . . . . . . . . . . . . . . . . . . . . . . . . . . . . (16,127) (391,046)Net proceeds from issuance of long-term debt . . . . . . . . . . . . . . — 196,389Other . . . . . . . . . . . . . . . . . . . . . . . . . . . . . . . . . . . . . . . . . . . . . . 291 139
$(458,063) $(249,438)
Net cash used in financing activities of continuing operations for fiscal 2011 increased to approximately$458.1 million compared to $249.4 million in the prior year primarily due to higher treasury stock purchases anddividend payments, partially offset by lower debt payments in the current year.
Pursuant to our stock repurchase plan, we repurchased approximately 20.6 million shares of our commonstock for $420.0 million during fiscal 2011. The share repurchases were funded using proceeds from the On TheBorder divestiture in June 2010 as well as cash flow from operations. As of August 23, 2011, we haverepurchased approximately 1.9 million shares for $45.8 million in fiscal 2012.
We paid dividends of $53.2 million to common stock shareholders in fiscal 2011 compared to $34.4 millionin dividends paid in fiscal 2010. The increase is primarily due to the payment of four quarterly cash dividends infiscal 2011 compared to three quarterly cash dividends in fiscal 2010, as the fourth quarter fiscal 2010 dividendwas declared in March 2010 and paid in July 2010. The increase also reflects a 27 percent increase in ourquarterly dividend rate from $0.11 to $0.14 per share effective with the July 2010 payment. Additionally, wedeclared a quarterly dividend late in fiscal 2011 which was paid early in fiscal 2012 on June 30, 2011. We willcontinue to target a 40 percent dividend payout ratio to provide additional return to shareholders. We received$33.1 million of proceeds from issuances of treasury stock related to stock option exercises in fiscal 2011.
During fiscal 2011, we paid our required installments totaling $15.0 million on our five-year term loanbringing the outstanding balance to $185.0 million. The term loan bears interest at LIBOR plus an applicablemargin, which is a function of our credit rating at such time, but is subject to a maximum of LIBOR plus 3.25%,and expires in June 2015. Based on our current credit rating, we are paying interest at a rate of LIBOR plus2.75% (2.94% as of June 29, 2011).
As of June 29, 2011, we have an undrawn $200 million revolving credit facility, which expires in June2015. The revolving credit facility bears interest at LIBOR plus an applicable margin, which is a function of ourcredit rating at such time, but is subject to a maximum of LIBOR plus 3.25%. Based on our current credit rating,the revolving credit facility carries an interest rate of LIBOR plus 2.75% (2.94% as of June 29, 2011). We are incompliance with all financial debt covenants.
On August 9, 2011, we executed a revised unsecured senior credit facility increasing the total capacity from$400 million to $500 million. The maturity date of the revised facility is August 2016. The facility includes a$250 million revolver and a $250 million term loan. The net term loan proceeds of approximately $68 millionwill be used for general corporate purposes in fiscal 2012.
Standard and Poor’s (“S&P”) reaffirmed our debt rating of BBB- (investment grade) with a stable outlook infiscal 2010. In December 2010, Moody’s reaffirmed our corporate family rating of Ba1 (non-investment grade)and our senior unsecured note rating of Ba2 (non-investment grade) with a stable outlook. Our goal is to retainthe investment grade rating from S&P and ultimately regain our investment grade rating from Moody’s.
F-9
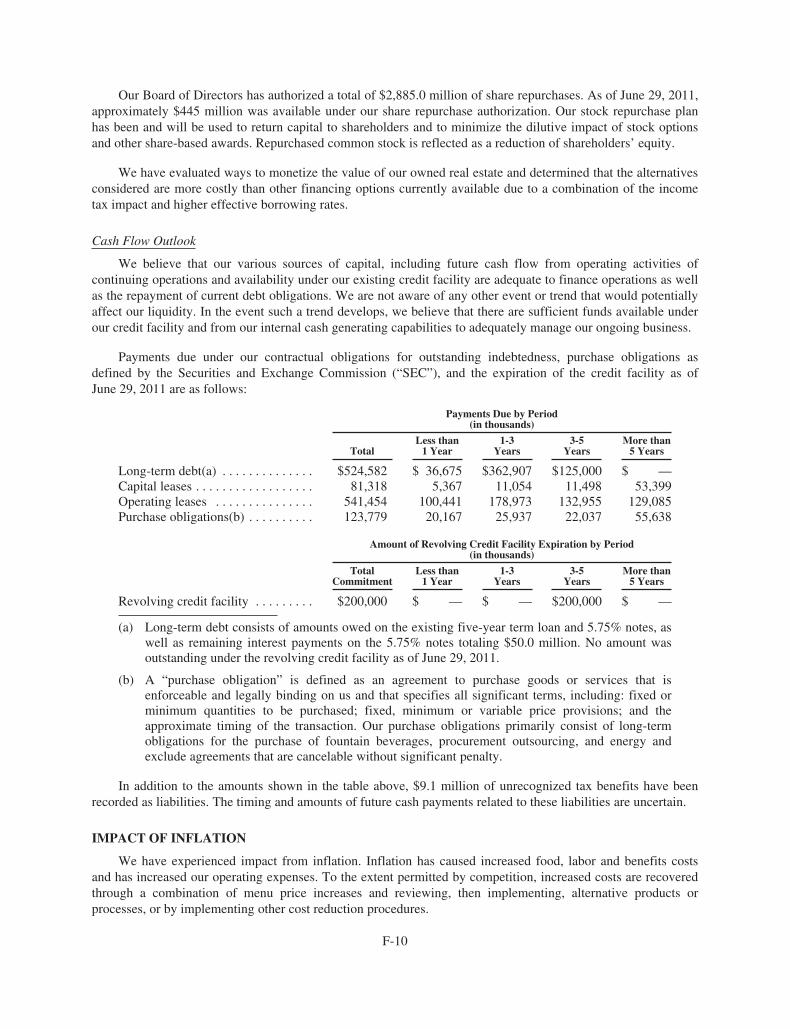
Our Board of Directors has authorized a total of $2,885.0 million of share repurchases. As of June 29, 2011,approximately $445 million was available under our share repurchase authorization. Our stock repurchase planhas been and will be used to return capital to shareholders and to minimize the dilutive impact of stock optionsand other share-based awards. Repurchased common stock is reflected as a reduction of shareholders’ equity.
We have evaluated ways to monetize the value of our owned real estate and determined that the alternativesconsidered are more costly than other financing options currently available due to a combination of the incometax impact and higher effective borrowing rates.
Cash Flow Outlook
We believe that our various sources of capital, including future cash flow from operating activities ofcontinuing operations and availability under our existing credit facility are adequate to finance operations as wellas the repayment of current debt obligations. We are not aware of any other event or trend that would potentiallyaffect our liquidity. In the event such a trend develops, we believe that there are sufficient funds available underour credit facility and from our internal cash generating capabilities to adequately manage our ongoing business.
Payments due under our contractual obligations for outstanding indebtedness, purchase obligations asdefined by the Securities and Exchange Commission (“SEC”), and the expiration of the credit facility as ofJune 29, 2011 are as follows:
Payments Due by Period(in thousands)
TotalLess than
1 Year1-3
Years3-5
YearsMore than
5 Years
Long-term debt(a) . . . . . . . . . . . . . . $524,582 $ 36,675 $362,907 $125,000 $ —Capital leases . . . . . . . . . . . . . . . . . . 81,318 5,367 11,054 11,498 53,399Operating leases . . . . . . . . . . . . . . . 541,454 100,441 178,973 132,955 129,085Purchase obligations(b) . . . . . . . . . . 123,779 20,167 25,937 22,037 55,638
Amount of Revolving Credit Facility Expiration by Period(in thousands)
TotalCommitment
Less than1 Year
1-3Years
3-5Years
More than5 Years
Revolving credit facility . . . . . . . . . $200,000 $ — $ — $200,000 $ —
(a) Long-term debt consists of amounts owed on the existing five-year term loan and 5.75% notes, aswell as remaining interest payments on the 5.75% notes totaling $50.0 million. No amount wasoutstanding under the revolving credit facility as of June 29, 2011.
(b) A “purchase obligation” is defined as an agreement to purchase goods or services that isenforceable and legally binding on us and that specifies all significant terms, including: fixed orminimum quantities to be purchased; fixed, minimum or variable price provisions; and theapproximate timing of the transaction. Our purchase obligations primarily consist of long-termobligations for the purchase of fountain beverages, procurement outsourcing, and energy andexclude agreements that are cancelable without significant penalty.
In addition to the amounts shown in the table above, $9.1 million of unrecognized tax benefits have beenrecorded as liabilities. The timing and amounts of future cash payments related to these liabilities are uncertain.
IMPACT OF INFLATION
We have experienced impact from inflation. Inflation has caused increased food, labor and benefits costsand has increased our operating expenses. To the extent permitted by competition, increased costs are recoveredthrough a combination of menu price increases and reviewing, then implementing, alternative products orprocesses, or by implementing other cost reduction procedures.
F-10

CRITICAL ACCOUNTING ESTIMATES
Our significant accounting policies are disclosed in Note 1 to our consolidated financial statements. Thefollowing discussion addresses our most critical accounting estimates, which are those that are most important tothe portrayal of our financial condition and results, and that require significant judgment.
Stock Based Compensation
We measure and recognize compensation cost at fair value for all share-based payments, including stockoptions. We determine the fair value of our stock option awards using the Black-Scholes option valuation model.The Black-Scholes model requires judgmental assumptions including expected life and stock price volatility. Webase our expected life assumptions on historical experience regarding option life. Stock price volatility iscalculated based on historical prices and the expected life of the options. We determine the fair value of ourperformance shares using a Monte Carlo simulation model. The Monte Carlo method is a statistical modelingtechnique that requires highly judgmental assumptions regarding our future operating performance compared toour plan designated peer group in the future. The simulation is based on a probability model and market-basedinputs that are used to predict future stock returns. We use the historical operating performance and correlation ofstock performance to the S&P 500 composite index of us and our peer group as inputs to the simulation model.These historical returns could differ significantly in the future and as a result, the fair value assigned to theperformance shares could vary significantly to the final payout. We believe the Monte Carlo simulation modelprovides the best evidence of fair value at the grant date and is an appropriate technique for valuing share-basedawards. We recognize compensation expense for only the portion of share-based awards that are expected to vest.Therefore, we apply estimated forfeiture rates that are derived from our historical forfeitures of similar awards.
Income Taxes
In determining net income for financial statement purposes, we make certain estimates and judgments in thecalculation of tax expense and the resulting tax liabilities and in the recoverability of deferred tax assets that arisefrom temporary differences between the tax and financial statement recognition of revenue and expense. Whenconsidered necessary, we record a valuation allowance to reduce deferred tax assets to a balance that is morelikely than not to be recognized. We use an estimate of our annual effective tax rate at each interim period basedon the facts and circumstances available at that time while the actual effective tax rate is calculated at year-end.
We record a liability for unrecognized tax benefits resulting from tax positions taken, or expected to betaken, in an income tax return. We recognize any interest and penalties related to unrecognized tax benefits inincome tax expense. Significant judgment is required in assessing, among other things, the timing and amountsof deductible and taxable items. Tax reserves are evaluated and adjusted as appropriate, while taking into accountthe progress of audits of various taxing jurisdictions.
In addition to the risks related to the effective tax rate described above, the effective tax rate reflected inforward-looking statements is based on current tax law. Any significant changes in the tax laws could affect theseestimates.
Property and Equipment
Property and equipment are depreciated on a straight-line basis over the estimated useful lives of the assets.The useful lives of the assets are based upon our expectations for the period of time that the asset will be used togenerate revenues. We periodically review the assets for changes in circumstances, which may impact theiruseful lives.
Impairment of Long-Lived Assets
We review the carrying amount of property and equipment semi-annually or when events or circumstancesindicate that the carrying amount may not be recoverable. If the carrying amount is not recoverable, we record an
F-11

impairment charge for the excess of the carrying amount over the fair value. We determine fair value based onprojected discounted future operating cash flows of the restaurants over their remaining service life using a riskadjusted discount rate that is commensurate with the risk inherent in our current business model. This processrequires the use of estimates and assumptions, which are subject to a high degree of judgment.
Impairment of Goodwill
We assess the recoverability of goodwill related to our restaurant brands on an annual basis or more often ifcircumstances or events indicate impairment may exist. We consider our restaurants brands, Chili’s andMaggiano’s, to be both our operating segments and reporting units. The impairment test is a two-step process.Step one includes comparing the fair value of our reporting units to their carrying value. If the fair value of thereporting unit exceeds the carrying value, then the goodwill balance is not impaired and no further evaluation isrequired. If the carrying value of the reporting unit exceeds its fair value, impairment may exist and performingstep two is necessary to determine the impairment loss. The amount of impairment would be determined byperforming a hypothetical analysis resulting in an implied goodwill value by performing a fair value allocation asif the unit were being acquired in a business combination. This implied value would be compared to the carryingvalue to determine the amount of impairment loss, if any.
We determine fair value based on projected discounted future operating cash flows of the restaurant brandsusing a risk adjusted discount rate that is commensurate with the risk inherent in our current business model. Wemake assumptions regarding future profits and cash flows, expected growth rates, terminal values, and otherfactors which could significantly impact the fair value calculations. In the event that these assumptions change inthe future, we may be required to record impairment charges related to goodwill. The fair value of our reportingunits was substantially in excess of the carry value as of our fiscal 2011 goodwill impairment test that wasperformed at the end of the second quarter. No indicators of impairment were identified from the date of ourimpairment test through the end of fiscal year 2011.
Self-Insurance
We are self-insured for certain losses related to health, general liability and workers’ compensation. Wemaintain stop loss coverage with third party insurers to limit our total exposure. The self-insurance liabilityrepresents an estimate of the ultimate cost of claims incurred and unpaid as of the balance sheet date. Theestimated liability is not discounted and is established based upon analysis of historical data and actuarialestimates, and is reviewed on a quarterly basis to ensure that the liability is appropriate. If actual trends,including the severity or frequency of claims, differ from our estimates, our financial results could be impacted.
Recent Accounting Pronouncements
We reviewed all significant newly issued accounting pronouncements and concluded that they either are notapplicable to our operations or that no material effect is expected on our financial statements as a result of futureadoption.
QUANTITATIVE AND QUALITATIVE DISCLOSURES ABOUT MARKET RISK
We are exposed to interest rate risk on short-term and long-term financial instruments carrying variableinterest rates. The variable rate financial instruments consist of the outstanding borrowings on our term loan andrevolving credit facility. At June 29, 2011, $185.0 million was outstanding under the term loan and no amountwas outstanding under the revolving credit facility. The impact on our annual results of operations of a one-pointinterest rate change on the outstanding balance of these variable rate financial instruments as of June 29, 2011would be approximately $1.9 million.
We purchase certain commodities such as beef, pork, poultry, seafood, produce, and dairy. Thesecommodities are generally purchased based upon market prices established with vendors. These purchase
F-12

arrangements may contain contractual features that fix the price paid for certain commodities. We do not usefinancial instruments to hedge commodity prices because these purchase arrangements help control the ultimatecost paid and any commodity price aberrations are generally short-term in nature.
This market risk discussion contains forward-looking statements. Actual results may differ materially fromthis discussion based upon general market conditions and changes in domestic and global financial markets.
F-13
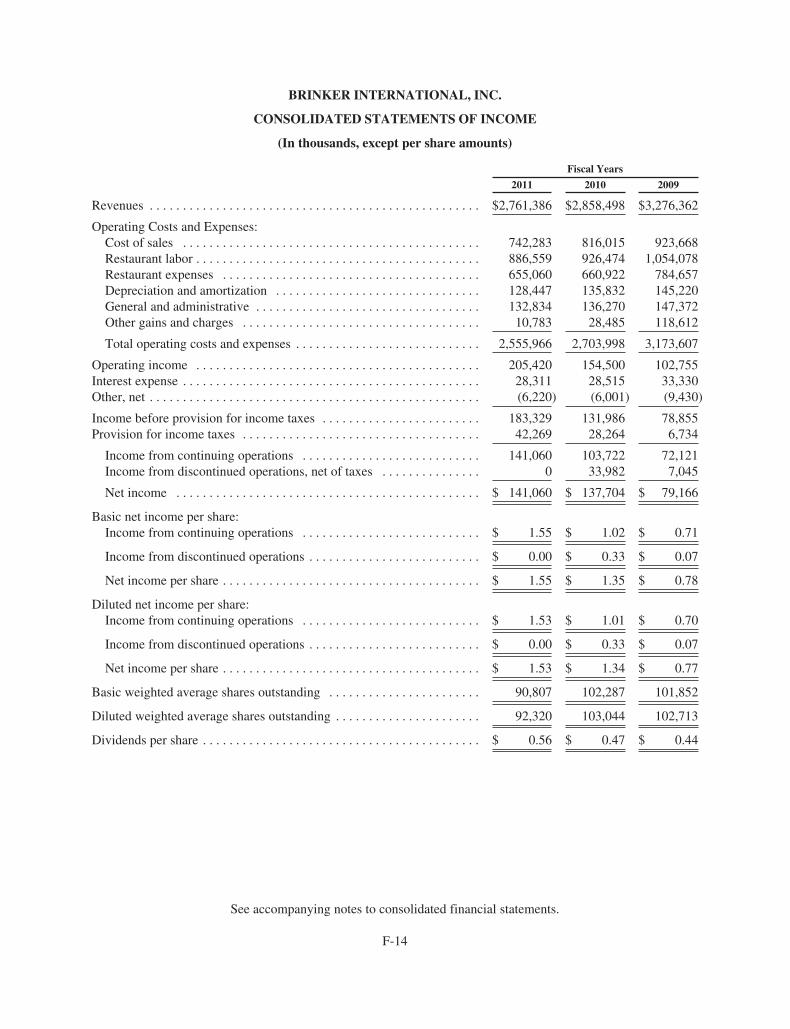
BRINKER INTERNATIONAL, INC.
CONSOLIDATED STATEMENTS OF INCOME
(In thousands, except per share amounts)
Fiscal Years
2011 2010 2009
Revenues . . . . . . . . . . . . . . . . . . . . . . . . . . . . . . . . . . . . . . . . . . . . . . . . . . $2,761,386 $2,858,498 $3,276,362
Operating Costs and Expenses:Cost of sales . . . . . . . . . . . . . . . . . . . . . . . . . . . . . . . . . . . . . . . . . . . . . 742,283 816,015 923,668Restaurant labor . . . . . . . . . . . . . . . . . . . . . . . . . . . . . . . . . . . . . . . . . . . 886,559 926,474 1,054,078Restaurant expenses . . . . . . . . . . . . . . . . . . . . . . . . . . . . . . . . . . . . . . . 655,060 660,922 784,657Depreciation and amortization . . . . . . . . . . . . . . . . . . . . . . . . . . . . . . . 128,447 135,832 145,220General and administrative . . . . . . . . . . . . . . . . . . . . . . . . . . . . . . . . . . 132,834 136,270 147,372Other gains and charges . . . . . . . . . . . . . . . . . . . . . . . . . . . . . . . . . . . . 10,783 28,485 118,612
Total operating costs and expenses . . . . . . . . . . . . . . . . . . . . . . . . . . . . 2,555,966 2,703,998 3,173,607
Operating income . . . . . . . . . . . . . . . . . . . . . . . . . . . . . . . . . . . . . . . . . . . 205,420 154,500 102,755Interest expense . . . . . . . . . . . . . . . . . . . . . . . . . . . . . . . . . . . . . . . . . . . . . 28,311 28,515 33,330Other, net . . . . . . . . . . . . . . . . . . . . . . . . . . . . . . . . . . . . . . . . . . . . . . . . . . (6,220) (6,001) (9,430)
Income before provision for income taxes . . . . . . . . . . . . . . . . . . . . . . . . 183,329 131,986 78,855Provision for income taxes . . . . . . . . . . . . . . . . . . . . . . . . . . . . . . . . . . . . 42,269 28,264 6,734
Income from continuing operations . . . . . . . . . . . . . . . . . . . . . . . . . . . 141,060 103,722 72,121Income from discontinued operations, net of taxes . . . . . . . . . . . . . . . 0 33,982 7,045
Net income . . . . . . . . . . . . . . . . . . . . . . . . . . . . . . . . . . . . . . . . . . . . . . $ 141,060 $ 137,704 $ 79,166
Basic net income per share:Income from continuing operations . . . . . . . . . . . . . . . . . . . . . . . . . . . $ 1.55 $ 1.02 $ 0.71
Income from discontinued operations . . . . . . . . . . . . . . . . . . . . . . . . . . $ 0.00 $ 0.33 $ 0.07
Net income per share . . . . . . . . . . . . . . . . . . . . . . . . . . . . . . . . . . . . . . . $ 1.55 $ 1.35 $ 0.78
Diluted net income per share:Income from continuing operations . . . . . . . . . . . . . . . . . . . . . . . . . . . $ 1.53 $ 1.01 $ 0.70
Income from discontinued operations . . . . . . . . . . . . . . . . . . . . . . . . . . $ 0.00 $ 0.33 $ 0.07
Net income per share . . . . . . . . . . . . . . . . . . . . . . . . . . . . . . . . . . . . . . . $ 1.53 $ 1.34 $ 0.77
Basic weighted average shares outstanding . . . . . . . . . . . . . . . . . . . . . . . 90,807 102,287 101,852
Diluted weighted average shares outstanding . . . . . . . . . . . . . . . . . . . . . . 92,320 103,044 102,713
Dividends per share . . . . . . . . . . . . . . . . . . . . . . . . . . . . . . . . . . . . . . . . . . $ 0.56 $ 0.47 $ 0.44
See accompanying notes to consolidated financial statements.
F-14

BRINKER INTERNATIONAL, INC.
CONSOLIDATED BALANCE SHEETS
(In thousands, except share and per share amounts)
2011 2010
ASSETSCurrent Assets:
Cash and cash equivalents . . . . . . . . . . . . . . . . . . . . . . . . . . . . . . . . . . . . . . . . . . . . $ 81,988 $ 344,624Accounts receivable . . . . . . . . . . . . . . . . . . . . . . . . . . . . . . . . . . . . . . . . . . . . . . . . . 42,785 45,140Inventories . . . . . . . . . . . . . . . . . . . . . . . . . . . . . . . . . . . . . . . . . . . . . . . . . . . . . . . . 25,365 26,735Prepaid expenses and other . . . . . . . . . . . . . . . . . . . . . . . . . . . . . . . . . . . . . . . . . . . . 59,698 63,961Deferred income taxes . . . . . . . . . . . . . . . . . . . . . . . . . . . . . . . . . . . . . . . . . . . . . . . 11,524 20,607
Total current assets . . . . . . . . . . . . . . . . . . . . . . . . . . . . . . . . . . . . . . . . . . . . . . . . 221,360 501,067
Property and Equipment:Land . . . . . . . . . . . . . . . . . . . . . . . . . . . . . . . . . . . . . . . . . . . . . . . . . . . . . . . . . . . . . 156,731 163,018Buildings and leasehold improvements . . . . . . . . . . . . . . . . . . . . . . . . . . . . . . . . . . 1,383,311 1,367,646Furniture and equipment . . . . . . . . . . . . . . . . . . . . . . . . . . . . . . . . . . . . . . . . . . . . . . 543,682 556,815Construction-in-progress . . . . . . . . . . . . . . . . . . . . . . . . . . . . . . . . . . . . . . . . . . . . . 6,425 11,870
2,090,149 2,099,349Less accumulated depreciation and amortization . . . . . . . . . . . . . . . . . . . . . . . . . . . (1,033,870) (970,272)
Net property and equipment . . . . . . . . . . . . . . . . . . . . . . . . . . . . . . . . . . . . . . . . . 1,056,279 1,129,077
Other Assets:Goodwill . . . . . . . . . . . . . . . . . . . . . . . . . . . . . . . . . . . . . . . . . . . . . . . . . . . . . . . . . . 124,089 124,089Deferred income taxes . . . . . . . . . . . . . . . . . . . . . . . . . . . . . . . . . . . . . . . . . . . . . . . 30,365 44,213Other . . . . . . . . . . . . . . . . . . . . . . . . . . . . . . . . . . . . . . . . . . . . . . . . . . . . . . . . . . . . . 52,475 53,658
Total other assets . . . . . . . . . . . . . . . . . . . . . . . . . . . . . . . . . . . . . . . . . . . . . . . . . 206,929 221,960
Total assets . . . . . . . . . . . . . . . . . . . . . . . . . . . . . . . . . . . . . . . . . . . . . . . . . . . . . . $ 1,484,568 $ 1,852,104
LIABILITIES AND SHAREHOLDERS’ EQUITYCurrent Liabilities:
Current installments of long-term debt . . . . . . . . . . . . . . . . . . . . . . . . . . . . . . . . . . . $ 22,091 $ 16,866Accounts payable . . . . . . . . . . . . . . . . . . . . . . . . . . . . . . . . . . . . . . . . . . . . . . . . . . . 87,549 112,824Accrued liabilities . . . . . . . . . . . . . . . . . . . . . . . . . . . . . . . . . . . . . . . . . . . . . . . . . . . 287,365 300,540Income taxes payable . . . . . . . . . . . . . . . . . . . . . . . . . . . . . . . . . . . . . . . . . . . . . . . . 8,596 19,647
Total current liabilities . . . . . . . . . . . . . . . . . . . . . . . . . . . . . . . . . . . . . . . . . . . . . 405,601 449,877
Long-term debt, less current installments . . . . . . . . . . . . . . . . . . . . . . . . . . . . . . . . . . 502,572 524,511Other liabilities . . . . . . . . . . . . . . . . . . . . . . . . . . . . . . . . . . . . . . . . . . . . . . . . . . . . . . . 137,485 148,968Commitments and Contingencies (Notes 9 and 14)
Shareholders’ Equity:Common stock—250,000,000 authorized shares;
$.10 par value; 176,246,649 shares issued and 82,938,493 shares outstandingat June 29, 2011, and 176,246,649 shares issued and 101,571,588 sharesoutstanding at June 30, 2010 . . . . . . . . . . . . . . . . . . . . . . . . . . . . . . . . . . . . . . . . 17,625 17,625
Additional paid-in capital . . . . . . . . . . . . . . . . . . . . . . . . . . . . . . . . . . . . . . . . . . . . . 463,688 465,721Retained earnings . . . . . . . . . . . . . . . . . . . . . . . . . . . . . . . . . . . . . . . . . . . . . . . . . . . 2,013,189 1,923,561
2,494,502 2,406,907Less treasury stock, at cost (93,308,156 shares at June 29, 2011 and 74,675,061
shares at June 30, 2010) . . . . . . . . . . . . . . . . . . . . . . . . . . . . . . . . . . . . . . . . . . . . (2,055,592) (1,678,159)
Total shareholders’ equity . . . . . . . . . . . . . . . . . . . . . . . . . . . . . . . . . . . . . . . . . . 438,910 728,748
Total liabilities and shareholders’ equity . . . . . . . . . . . . . . . . . . . . . . . . . . . . . . . $ 1,484,568 $ 1,852,104
See accompanying notes to consolidated financial statements.
F-15

BRINKER INTERNATIONAL, INC.
CONSOLIDATED STATEMENTS OF SHAREHOLDERS’ EQUITY
(In thousands)
Common Stock AdditionalPaid-InCapital
RetainedEarnings
TreasuryStock
AccumulatedOther
ComprehensiveIncome (Loss) TotalShares Amount
Balances at June 25, 2008 . . . . . 101,316 $17,625 $464,666 $1,800,300 $(1,687,334) $ (168) $ 595,089
Net income . . . . . . . . . . . . . . . . 0 0 0 79,166 0 0 79,166Currency translation
adjustment . . . . . . . . . . . . . . . 0 0 0 0 0 (2,068) (2,068)Realized loss on currency
translation . . . . . . . . . . . . . . . 0 0 0 0 0 2,236 2,236
Comprehensive income . . . . . 79,334
Dividends ($0.44 per share) . . . 0 0 0 (45,159) 0 0 (45,159)Stock-based compensation . . . . 0 0 17,518 0 0 0 17,518Purchases of treasury stock . . . . (30) 0 (3,116) 0 (623) 0 (3,739)Issuances of common stock . . . . 816 0 (13,721) 0 18,371 0 4,650Tax benefit from stock options
exercised . . . . . . . . . . . . . . . . 0 0 (769) 0 0 0 (769)Issuances of restricted stock, net
of forfeitures . . . . . . . . . . . . . 23 0 (598) 0 598 0 0
Balances at June 24, 2009 . . . . . 102,125 17,625 463,980 1,834,307 (1,668,988) 0 646,924Net income and comprehensive
income . . . . . . . . . . . . . . . . . . 0 0 0 137,704 0 0 137,704
Dividends ($0.47 per share) . . . 0 0 0 (48,450) 0 0 (48,450)Stock-based compensation . . . . 0 0 16,493 0 0 0 16,493Purchases of treasury stock . . . . (1,046) 0 (2,448) 0 (20,420) 0 (22,868)Issuances of common stock . . . . 518 0 (9,268) 0 11,664 0 2,396Tax benefit from stock options
exercised . . . . . . . . . . . . . . . . 0 0 (3,451) 0 0 0 (3,451)Issuances of restricted stock, net
of forfeitures . . . . . . . . . . . . . (25) 0 415 0 (415) 0 0
Balances at June 30, 2010 . . . . . 101,572 17,625 465,721 1,923,561 (1,678,159) 0 728,748Net income and comprehensive
income . . . . . . . . . . . . . . . . . . 0 0 0 141,060 0 0 141,060
Dividends ($0.56 per share) . . . 0 0 0 (51,432) 0 0 (51,432)Stock-based compensation . . . . 0 0 13,381 0 0 0 13,381Purchases of treasury stock . . . . (20,585) 0 (1,788) 0 (420,311) 0 (422,099)Issuances of common stock . . . . 1,951 0 (9,821) 0 42,878 0 33,057Tax benefit from stock options
exercised . . . . . . . . . . . . . . . . 0 0 (3,805) 0 0 0 (3,805)
Balances at June 29, 2011 . . . . . 82,938 $17,625 $463,688 $2,013,189 $(2,055,592) $ 0 $ 438,910
See accompanying notes to consolidated financial statements.
F-16

BRINKER INTERNATIONAL, INC.
CONSOLIDATED STATEMENTS OF CASH FLOWS
(In thousands)
Fiscal Years
2011 2010 2009
Cash Flows from Operating Activities:Net income . . . . . . . . . . . . . . . . . . . . . . . . . . . . . . . . . . . . . . . . . . . . . . . . . . . $ 141,060 $ 137,704 $ 79,166Income from discontinued operations, net of taxes . . . . . . . . . . . . . . . . . . . . 0 (33,982) (7,045)Adjustments to reconcile net income to net cash provided by operating
activities:Depreciation and amortization . . . . . . . . . . . . . . . . . . . . . . . . . . . . . . . . . . 128,447 135,832 145,220Restructure charges and other impairments . . . . . . . . . . . . . . . . . . . . . . . . 8,427 31,766 76,957Deferred income taxes . . . . . . . . . . . . . . . . . . . . . . . . . . . . . . . . . . . . . . . . 15,277 (25,516) 40,921Net (gain) loss on disposal of assets . . . . . . . . . . . . . . . . . . . . . . . . . . . . . (401) (4,878) 36,955Stock-based compensation . . . . . . . . . . . . . . . . . . . . . . . . . . . . . . . . . . . . . 12,789 15,595 17,128(Earnings) Loss on equity investments . . . . . . . . . . . . . . . . . . . . . . . . . . . (1,802) (114) 201Other . . . . . . . . . . . . . . . . . . . . . . . . . . . . . . . . . . . . . . . . . . . . . . . . . . . . . . 405 2,637 (823)
Changes in assets and liabilities, excluding effects of dispositions:Accounts receivable . . . . . . . . . . . . . . . . . . . . . . . . . . . . . . . . . . . . . . . . 1,255 6,083 (800)Inventories . . . . . . . . . . . . . . . . . . . . . . . . . . . . . . . . . . . . . . . . . . . . . . . 1,341 6,544 (1,680)Prepaid expenses and other . . . . . . . . . . . . . . . . . . . . . . . . . . . . . . . . . . 1,044 1,847 2,150Other assets . . . . . . . . . . . . . . . . . . . . . . . . . . . . . . . . . . . . . . . . . . . . . . 406 551 1,496Current income taxes . . . . . . . . . . . . . . . . . . . . . . . . . . . . . . . . . . . . . . . (3,976) 51,800 (42,153)Accounts payable . . . . . . . . . . . . . . . . . . . . . . . . . . . . . . . . . . . . . . . . . . (21,515) (9,963) (43,512)Accrued liabilities . . . . . . . . . . . . . . . . . . . . . . . . . . . . . . . . . . . . . . . . . (15,178) (7,483) (68,199)Other liabilities . . . . . . . . . . . . . . . . . . . . . . . . . . . . . . . . . . . . . . . . . . . . (7,591) (11,021) (1,975)
Net cash provided by operating activities . . . . . . . . . . . . . . . . . . . . . . . . . 259,988 297,402 234,007
Cash Flows from Investing Activities:Payments for property and equipment . . . . . . . . . . . . . . . . . . . . . . . . . . . . . . (70,361) (60,879) (88,152)Proceeds from sale of assets . . . . . . . . . . . . . . . . . . . . . . . . . . . . . . . . . . . . . . 8,696 26,603 81,865Investment in equity method investees . . . . . . . . . . . . . . . . . . . . . . . . . . . . . (2,896) 0 (4,612)Decrease in restricted cash . . . . . . . . . . . . . . . . . . . . . . . . . . . . . . . . . . . . . . . 0 29,749 4,688
Net cash used in investing activities . . . . . . . . . . . . . . . . . . . . . . . . . . . . . (64,561) (4,527) (6,211)
Cash Flows from Financing Activities:Purchases of treasury stock . . . . . . . . . . . . . . . . . . . . . . . . . . . . . . . . . . . . . . (422,099) (22,868) (3,739)Payments of dividends . . . . . . . . . . . . . . . . . . . . . . . . . . . . . . . . . . . . . . . . . . (53,185) (34,448) (45,355)Proceeds from issuances of treasury stock . . . . . . . . . . . . . . . . . . . . . . . . . . . 33,057 2,396 4,650Payments on long-term debt . . . . . . . . . . . . . . . . . . . . . . . . . . . . . . . . . . . . . . (16,127) (391,046) (19,735)Net proceeds from issuance of long-term debt . . . . . . . . . . . . . . . . . . . . . . . 0 196,389 0Excess tax benefits from stock-based compensation . . . . . . . . . . . . . . . . . . . 291 139 551Net payments on credit facilities . . . . . . . . . . . . . . . . . . . . . . . . . . . . . . . . . . 0 0 (160,757)
Net cash used in financing activities . . . . . . . . . . . . . . . . . . . . . . . . . . . . . (458,063) (249,438) (224,385)
Cash Flows from Discontinued Operations:Net cash provided by operating activities . . . . . . . . . . . . . . . . . . . . . . . . . . . 0 39,033 40,958Net cash provided by (used in) investing activities . . . . . . . . . . . . . . . . . . . . 0 167,998 (4,927)
Net cash provided by discontinued operations . . . . . . . . . . . . . . . . . . . . . . 0 207,031 36,031
Net change in cash and cash equivalents . . . . . . . . . . . . . . . . . . . . . . . . . . . . (262,636) 250,468 39,442Cash and cash equivalents at beginning of year . . . . . . . . . . . . . . . . . . . . . . . 344,624 94,156 54,714
Cash and cash equivalents at end of year . . . . . . . . . . . . . . . . . . . . . . . . . . . . $ 81,988 $ 344,624 $ 94,156
See accompanying notes to consolidated financial statements.
F-17

BRINKER INTERNATIONAL, INC.
NOTES TO CONSOLIDATED FINANCIAL STATEMENTS
1. NATURE OF OPERATIONS AND SUMMARY OF SIGNIFICANT ACCOUNTING POLICIES
(a) Nature of Operations
We are principally engaged in the ownership, operation, development, and franchising of the Chili’s Grill &Bar (“Chili’s”) and Maggiano’s Little Italy (“Maggiano’s”) restaurant brands. At June 29, 2011, we owned,operated, or franchised 1,579 restaurants in the United States and 30 countries and two territories outside of theUnited States.
We sold On The Border Mexican Grill & Cantina (“On The Border”) to OTB Acquisition LLC (“OTBAcquisition”), an affiliate of San Francisco-based Golden Gate Capital, in June 2010. We sold Romano’sMacaroni Grill (“Macaroni Grill”) to Mac Acquisition LLC (“Mac Acquisition”), also an affiliate of Golden GateCapital, in December 2008 and we currently hold a 15.6% ownership interest in the new entity.
(b) Basis of Presentation
Our consolidated financial statements include the accounts of Brinker International, Inc. and our wholly-owned subsidiaries. All intercompany accounts and transactions have been eliminated in consolidation.
We have a 52/53 week fiscal year ending on the last Wednesday in June. Fiscal years 2011 and 2009, whichended on June 29, 2011 and June 24, 2009, respectively, each contained 52 weeks. Fiscal year 2010 ended onJune 30, 2010 and contained 53 weeks.
At the beginning of fiscal 2011, we began reporting certain labor and related expenses in a separate captionon the consolidated statements of income titled restaurant labor. All prior year amounts previously classified inrestaurant expenses have been reclassified to conform to the fiscal 2011 presentation. Restaurant labor includesall compensation-related expenses, including benefits and incentive compensation, for restaurant team membersat the general manager level and below. Labor-related expenses attributable to supervision above the individualrestaurant level continue to be included in restaurant expenses. These reclassifications have no effect on our netincome or financial position as previously reported.
Certain other prior year amounts in the accompanying consolidated financial statements have beenreclassified to conform with fiscal 2011 presentation. These reclassifications have no effect on our net income orfinancial position as previously reported.
On The Border has been presented as discontinued operations in the consolidated financial statements. SeeNote 2 for additional disclosures. As a result of our retained interest and involvement in the ongoing operations,Macaroni Grill’s operating results were included in continuing operations in the consolidated financial statementsfor fiscal 2009 (through the sale date of December 18, 2008).
(c) Use of Estimates
The preparation of the consolidated financial statements in conformity with generally accepted accountingprinciples in the United States of America requires management to make estimates and assumptions that affectthe reported amounts of assets and liabilities and the disclosure of contingent assets and liabilities at the date ofthe consolidated financial statements and the reported amounts of revenues and costs and expenses during thereporting period. Actual results could differ from those estimates.
F-18

(d) Revenue Recognition
We record revenue from the sale of food, beverages and alcohol as products are sold. Initial fees receivedfrom a franchisee to establish a new franchise are recognized as income when we have performed our obligationsrequired to assist the franchisee in opening a new franchise restaurant, which is generally upon the opening ofsuch restaurant. Continuing royalties, which are a percentage of net sales of franchised restaurants, are accrued asincome when earned. Proceeds from the sale of gift cards are recorded as deferred revenue and recognized asincome when the gift card is redeemed by the holder or the likelihood of redemption, based upon our historicalredemption patterns, becomes remote.
(e) Fair Value Measurements
Fair value is defined as the price that we would receive to sell an asset or pay to transfer a liability in anorderly transaction between market participants on the measurement date. In determining fair value, theaccounting standards establish a three level hierarchy for inputs used in measuring fair value, as follows:
• Level 1—inputs are quoted prices in active markets for identical assets or liabilities.
• Level 2—inputs are observable for the asset or liability, either directly or indirectly, including quotedprices in active markets for similar assets or liabilities.
• Level 3—inputs are unobservable and reflect our own assumptions.
(f) Cash and Cash Equivalents
Our policy is to invest cash in excess of operating requirements in income-producing investments. Income-producing investments with original maturities of three months or less are reflected as cash equivalents.
(g) Accounts Receivable
Accounts receivable, net of the allowance for doubtful accounts, represents their estimated net realizablevalue. Provisions for doubtful accounts are recorded based on management’s judgment regarding our ability tocollect as well as the age of the receivables. Accounts receivable are written off when they are deemeduncollectible.
(h) Inventories
Inventories, which consist of food, beverages, and supplies, are stated at the lower of cost (weighted averagecost method) or market.
(i) Property and Equipment
Property and equipment is stated at cost. Buildings and leasehold improvements are depreciated using thestraight-line method over the lesser of the life of the lease, including renewal options, or the estimated usefullives of the assets, which range from 5 to 20 years. Furniture and equipment are depreciated using thestraight-line method over the estimated useful lives of the assets, which range from 3 to 10 years. Routine repairand maintenance costs are expensed when incurred. Major replacements and improvements are capitalized.
We review the carrying amount of property and equipment semi-annually or when events or circumstancesindicate that the carrying amount may not be recoverable. If the carrying amount is not recoverable, we record animpairment charge for the excess of the carrying amount over the fair value. We determine fair value based onprojected discounted future operating cash flows of the restaurants over their remaining service life using a riskadjusted discount rate that is commensurate with the risk inherent in our current business model. Impairmentcharges are included in other gains and charges in the consolidated statements of income.
F-19

(j) Operating Leases
Rent expense for leases that contain scheduled rent increases is recognized on a straight-line basis over thelease term, including cancelable option periods where failure to exercise such options would result in aneconomic penalty such that the renewal appears reasonably assured. The straight-line rent calculation and rentexpense includes the rent holiday period, which is the period of time between taking control of a leased site andthe rent commencement date. Contingent rents are generally amounts due as a result of sales in excess ofamounts stipulated in certain restaurant leases and are included in rent expense as they are incurred. Landlordcontributions are recorded when received as a deferred rent liability and amortized as a reduction of rent expenseon a straight-line basis over the lesser of the lease term, including renewal options, or 20 years.
(k) Advertising
Advertising production costs are expensed in the period when the advertising first takes place. Otheradvertising costs are expensed as incurred. Advertising costs, net of advertising contributions from franchisees,were $80.2 million, $80.6 million and $103.5 million in fiscal 2011, 2010, and 2009, respectively, and areincluded in restaurant expenses in the consolidated statements of income.
(l) Goodwill
Goodwill is not subject to amortization, but is tested for impairment annually or more frequently if events orchanges in circumstances indicate that the asset might be impaired. Goodwill has been assigned to reporting unitsfor purposes of impairment testing. Our two restaurant brands, Chili’s and Maggiano’s, are both reporting unitsand operating segments. We have established that the appropriate level to evaluate goodwill is at the operatingsegment level. The menu items, services offered and food preparation are virtually identical at each restaurantwithin the reporting unit and our targeted customer is consistent across each brand. We maintain a centralizedpurchasing department which manages all purchasing and distribution for our restaurants. In addition, contractsfor our food supplies are negotiated at a consolidated level in order to secure the best prices and maintain similarquality across all of our brands. Local laws, regulations and other issues may result in slightly different legal andregulatory environments; however, the overall regulatory climate within and across our operating segments isquite similar. As such, we believe that aggregating components is appropriate for the evaluation of goodwill.
Goodwill impairment tests consist of a comparison of each reporting unit’s fair value with its carryingvalue. We determine fair value based on a combination of market based values and projected discounted futureoperating cash flows of the restaurant brands using a risk adjusted discount rate that is commensurate with therisk inherent in our current business model. If the carrying value of a reporting unit exceeds its fair value,goodwill is written down to its implied fair value. We determined that there was no goodwill impairment duringour annual test and no indicators of impairment were identified through the end of fiscal year 2011. See Note 5for additional disclosures related to goodwill.
We have occasionally acquired restaurants from our franchisees. Goodwill from these acquisitionsrepresents the excess of the cost of a business acquired over the net amounts assigned to assets acquired,including identifiable intangible assets, primarily reacquired franchise rights. In connection with the sale ofrestaurants, we have allocated goodwill from the reporting unit, or restaurant brand, to the disposal group in thedetermination of the gain or loss on the disposition. The allocation was based on the relative fair values of thedisposal group and the portion of the reporting unit that was retained. We have recognized reacquired rights inconnection with previous business combinations; however, we have not sold any restaurants acquired in thosecombinations. When we have disposed a restaurant brand and all related restaurants, the entire goodwill balanceassociated with the reporting unit or brand has been included in the disposal group for purposes of determiningthe gain or loss on the disposition.
F-20

(m) Sales Taxes
Sales taxes collected from guests are excluded from revenues. The obligation is included in accruedliabilities until the taxes are remitted to the appropriate taxing authorities.
(n) Self-Insurance Program
We utilize a paid loss self-insurance plan for health, general liability and workers’ compensation coverage.Predetermined loss limits have been arranged with insurance companies to limit our per occurrence cash outlay.Accrued and other liabilities include the estimated incurred but unreported costs to settle unpaid claims andestimated future claims.
In December 2009, we dissolved our wholly-owned captive insurance company which allowed us to access$29.7 million of cash that was previously pledged as collateral and classified as restricted.
(o) Income Taxes
Income taxes are accounted for under the asset and liability method. Deferred tax assets and liabilities arerecognized for the future tax consequences attributable to differences between the financial statement carryingamounts of existing assets and liabilities and their respective tax bases. Deferred tax assets and liabilities aremeasured using enacted tax rates expected to apply to taxable income in the years in which those temporarydifferences are expected to be recovered or settled. The effect on deferred tax assets and liabilities of a change intax rates is recognized in income in the period that includes the enactment date. We record a liability forunrecognized tax benefits resulting from tax positions taken, or expected to be taken, in an income tax return. Werecognize any interest and penalties related to unrecognized tax benefits in income tax expense. Tax reserves areevaluated and adjusted as appropriate, while taking into account the progress of audits of various taxingjurisdictions.
(p) Stock-Based Compensation
We measure and recognize compensation cost at fair value for all share-based payments, including stockoptions. We record compensation expense using a graded-vesting schedule over the vesting period, or to the dateon which retirement eligibility is achieved, if shorter (non-substantive vesting period approach).
Certain employees are eligible to receive stock options, performance shares, restricted stock and restrictedstock units, while non-employee members of the Board of Directors are eligible to receive stock options,restricted stock and restricted stock units. Performance shares represent a right to receive shares of commonstock upon satisfaction of performance goals or other specified metrics at the end of a three-year cycle.Performance shares are paid out in common stock and will be fully vested upon issuance. The fair value ofperformance shares is determined on the date of grant based on a Monte Carlo simulation model. The fair valueof restricted stock and restricted stock units are based on our closing stock price on the date of grant.
Stock-based compensation expense from continuing operations totaled approximately $13.4 million, $15.8million and $17.2 million for fiscal 2011, 2010 and 2009, respectively. The total income tax benefit recognizedin the consolidated statements of income related to stock-based compensation expense from continuingoperations was approximately $5.7 million, $5.3 million and $6.4 million during fiscal 2011, 2010 and 2009,respectively.
F-21

The weighted average fair values of option grants were $7.20, $6.04 and $5.52 during fiscal 2011, 2010 and2009, respectively. The fair value of stock options is estimated using the Black-Scholes option-pricing modelwith the following weighted average assumptions:
2011 2010 2009
Expected volatility . . . . . . . . . . . . . . . . . . . . . . . . . . . . . . . . . 55.6% 53.7% 37.8%Risk-free interest rate . . . . . . . . . . . . . . . . . . . . . . . . . . . . . . . 1.6% 2.5% 2.9%Expected lives . . . . . . . . . . . . . . . . . . . . . . . . . . . . . . . . . . . . . 5 years 5 years 5 yearsDividend yield . . . . . . . . . . . . . . . . . . . . . . . . . . . . . . . . . . . . . 3.1% 3.1% 2.8%
Expected volatility and the expected life of stock options are based on historical experience. The risk-freerate is based on the yield of a Treasury Note with a term equal to the expected life of the stock options.
(q) Preferred Stock
Our Board of Directors is authorized to provide for the issuance of 1.0 million preferred shares with a parvalue of $1.00 per share, in one or more series, and to fix the voting rights, liquidation preferences, dividendrates, conversion rights, redemption rights, and terms, including sinking fund provisions, and certain other rightsand preferences. As of June 29, 2011, no preferred shares were issued.
(r) Shareholders’ Equity
Our Board of Directors has authorized a total of $2,885.0 million of share repurchases. Pursuant to our stockrepurchase plan, we repurchased approximately 20.6 million shares of our common stock for $420.0 millionduring fiscal 2011. As of June 29, 2011, approximately $445 million was available under our share repurchaseauthorizations. Our stock repurchase plan has been and will be used to return capital to shareholders and tominimize the dilutive impact of stock options and other share-based awards. We evaluate potential sharerepurchases under our plan based on several factors, including our cash position, share price, operationalliquidity, proceeds from divestitures, borrowings and planned investment and financing needs. Repurchasedcommon stock is reflected as a reduction of shareholders’ equity.
We paid dividends of $53.2 million, or $0.56 per share, to common stock shareholders during fiscal 2011,compared to $34.4 million, or $0.33 per share, in the prior year. Additionally, we declared a quarterly dividend of$11.6 million, or $0.14 per share, in June 2011 which was paid on June 30, 2011.
(s) Comprehensive Income
Comprehensive income is defined as the change in equity of a business enterprise during a period fromtransactions and other events and circumstances from non-owner sources. Fiscal 2011 and 2010 comprehensiveincome consists of net income. Fiscal 2009 comprehensive income consists of net income, currency translationadjustments and a realized loss on currency translation adjustments related to the closure of internationalcompany-owned restaurants (see Note 4).
(t) Net Income Per Share
Basic earnings per share is computed by dividing income available to common shareholders by the weightedaverage number of common shares outstanding for the reporting period. Diluted earnings per share reflects thepotential dilution that could occur if securities or other contracts to issue common stock were exercised orconverted into common stock. For the calculation of diluted net income per share, the basic weighted averagenumber of shares is increased by the dilutive effect of stock options and restricted share awards, determinedusing the treasury stock method. We had approximately 1.7 million stock options and restricted share awardsoutstanding at June 29, 2011, 6.9 million stock options and restricted share awards outstanding at June 30, 2010,and 7.4 million stock options and restricted share awards outstanding at June 24, 2009 that were not included inthe dilutive earnings per share calculation because the effect would have been antidilutive.
F-22

(u) Segment Reporting
Operating segments are components of an enterprise about which separate financial information is availablethat is evaluated regularly by the chief operating decision maker in deciding how to allocate resources and inassessing performance. Two or more operating segments may be aggregated into a single operating segment ifthey have similar economic characteristics and are similar in the following areas:
• The nature of products and services
• Nature of production processes
• Type or class of customer
• Methods used to distribute products or provide services
• The nature of the regulatory environment, if applicable
Our two brands have similar types of products, contracts, customers, and employees and all operate as full-service restaurants offering lunch and dinner in the casual-dining segment of the industry. In addition, we havesimilar long-term average margins across our brands. Therefore, we believe we meet the criteria for aggregatingoperating segments into a single reporting segment.
2. DISCONTINUED OPERATIONS
In June 2010, we completed the sale of On The Border for gross proceeds of approximately $180 millionand recorded a pre-tax gain of $16.5 million in income from discontinued operations, net of taxes, in theconsolidated statement of income in fiscal 2010. The assets sold totaled approximately $164.0 million andconsisted primarily of property and equipment of $146.7 million and goodwill of $5.8 million. The associatedliabilities totaled approximately $9.9 million and consisted primarily of straight-line rent accruals of $9.3 million.
As part of the sale, we entered into an agreement with OTB Acquisition whereby we provided corporatesupport services for the new entity during fiscal 2011 until the agreement terminated in June 2011. The incomegenerated offset the internal cost of providing the services.
On The Border has been presented as discontinued operations in the consolidated financial statements infiscal 2010 and 2009. Discontinued operations includes only the revenues and expenses which can be specificallyidentified with On The Border and excludes any allocation of corporate costs, including general andadministrative expenses. The results of On The Border consist of the following (in thousands):
2010 2009
Revenues . . . . . . . . . . . . . . . . . . . . . . . . . . . . . . . . . . . . . . . . . . . . . . . . . . . . . . $331,247 $344,218
Income before income taxes from discontinued operations . . . . . . . . . . . . . . . 51,488 7,883Income tax expense . . . . . . . . . . . . . . . . . . . . . . . . . . . . . . . . . . . . . . . . . . . . . . 17,506 838
Net income from discontinued operations(a) . . . . . . . . . . . . . . . . . . . . . . . . $ 33,982 $ 7,045
(a) Other gains and charges, net of taxes, was a gain of $8.4 million and a loss of $10.2 million infiscal 2010 and 2009, respectively.
Other gains and charges in fiscal 2010 included a $16.5 million gain on the sale of On The Border, partiallyoffset by $2.9 million of charges related to long-lived asset impairments and lease termination charges primarilyassociated with the closure of three underperforming restaurants.
F-23

Other gains and charges in fiscal 2009 included a $9.0 million charge related to long-lived assetimpairments, $1.0 million of lease termination charges resulting from the decision to close six underperformingrestaurants and $1.6 million of lease termination charges associated with restaurants closed in prior years. Alsoincluded was a $3.7 million impairment charge associated with four underperforming restaurants that arecontinuing to operate.
3. OTHER RESTAURANT DISPOSITIONS AND EQUITY METHOD INVESTMENTS
(a) Sale of Macaroni Grill
In December 2008, we completed the sale of Macaroni Grill. We received cash proceeds of approximately$88.0 million and recorded a loss of $40.4 million in other gains and charges in the consolidated statement ofincome in fiscal 2009. The net assets sold totaled approximately $110 million and consisted primarily of propertyand equipment of $105 million. Macaroni Grill operating results were included in continuing operations for fiscal2009 (through the sale date of December 18, 2008) as we have involvement in the ongoing operations ofMacaroni Grill. As of June 29, 2011, we held a 15.6% ownership interest in the new entity, compared to 18.2%as of June 30, 2010.
In fiscal 2011, we resumed the application of the equity method of accounting as Macaroni Grill reportednet income during the period subsequent to reporting net losses in fiscal 2010 and 2009. We recorded our shareof Macaroni Grill’s fiscal 2011 net income, net of our share of fiscal 2010 and 2009 losses, within operatingincome since the operations of Macaroni Grill are similar to our ongoing operations. This amount has beenincluded in restaurant expense instead of a separate caption in our consolidated statements of income due to theimmaterial nature of the amount.
(b) Other Dispositions
During fiscal 2010, we sold 21 restaurants to a franchisee for $19.0 million in cash and recorded a gain of$2.8 million in other gains and charges in the consolidated statement of income.
During fiscal 2009, we recorded gains of $3.9 million related to the sale of nine restaurants to a franchiseeand other land sales.
(c) Joint Venture Investments
In fiscal 2011, we entered into an agreement with BTTO Participacoes Ltda for a joint venture investment ina new company to develop five Chili’s restaurants in Brazil. We made a $1.3 million capital contribution to thejoint venture in fiscal 2011. The first restaurant is projected to open in fiscal 2012.
In fiscal 2008, we entered into an agreement with CMR, S.A.B. de C.V. for a joint venture investment in anew corporation to develop 50 Chili’s and Maggiano’s restaurants in Mexico. We made a $1.6 million and a $4.6million capital contribution to the joint venture in fiscal 2011 and 2009, respectively. At June 29, 2011,25 Chili’s restaurants were operating in the joint venture.
We account for these investments under the equity method of accounting and record our share of the net incomeor loss of the investees within operating income since the operations of the joint ventures are similar to ourongoing operations. These amounts have been included in restaurant expense in our consolidated statements ofincome due to the immaterial nature of the amounts.
F-24

4. OTHER GAINS AND CHARGES
2011 2010 2009
Restaurant impairment charges . . . . . . . . . . . . . . . . . . . . . . . . . $ 1,937 $19,789 $ 10,517Restaurant closure charges . . . . . . . . . . . . . . . . . . . . . . . . . . . . 4,515 13,409 59,362Severance and other benefits . . . . . . . . . . . . . . . . . . . . . . . . . . . 5,034 1,887 5,496Gains on the sale of assets, net (see Note 3) . . . . . . . . . . . . . . . (2,100) (4,878) (3,902)Charges related to the sale of Macaroni Grill (see Note 3) . . . . 0 0 40,362Impairment of goodwill . . . . . . . . . . . . . . . . . . . . . . . . . . . . . . 0 0 7,713Other gains and charges, net . . . . . . . . . . . . . . . . . . . . . . . . . . . 1,397 (1,722) (936)
$ 10,783 $28,485 $118,612
We recorded impairment charges for the excess of the carrying amount of property and equipment over thefair value related to underperforming restaurants. Restaurant impairment charges were $1.9 million, $19.8million, and $10.5 million during fiscal 2011, 2010, and 2009, respectively. See Note 10 for fair valuedisclosures related to the fiscal 2011 and 2010 charges.
In fiscal 2011, we recorded $4.5 million in charges, including $3.0 million in lease termination chargesassociated with restaurants closed in prior years.
In fiscal 2010, we recorded $13.4 million in charges primarily related to long-lived asset impairmentsresulting from the decision to close nine underperforming restaurants. The charges included $5.4 million of long-lived asset impairments and $4.0 million in lease termination charges. Also included is $2.4 million in leasetermination charges related to restaurants closed in prior years.
In fiscal 2009, we recorded $59.4 million in charges primarily related to long-lived asset impairmentsresulting from the decision to close 37 underperforming restaurants, including eight international restaurants. Thecharges related to the domestic restaurant closures include $35.2 million of long-lived asset impairments, $5.2million in lease termination charges and $1.2 million of charges related to the write-off of other assets andliabilities. The charges related to the international restaurant closures include $5.6 million of long-lived assetimpairments and $2.1 million of charges related to realized foreign currency translation losses. We also recordeda goodwill impairment charge of $7.7 million resulting from the closure of the international restaurants as well as$6.2 million in lease termination charges associated with restaurants closed in prior years.
During the last three fiscal years, we made organizational changes designed to streamline decision makingand support our strategic goals and evolving business model. We incurred $5.0 million, $1.9 million and $5.5million in severance and other benefits resulting from these actions in fiscal 2011, 2010, and 2009, respectively.The severance charges are net of income related to the forfeiture of stock-based compensation awards.
F-25

5. GOODWILL
The changes in the carrying amount of goodwill for the fiscal years ended June 29, 2011 and June 30, 2010are as follows (in thousands):
2011 2010
Balance at beginning of year:Goodwill . . . . . . . . . . . . . . . . . . . . . . . . . . . . . . . . . . . . . . . . . . . . $186,923 $187,766Accumulated impairment losses(a) . . . . . . . . . . . . . . . . . . . . . . . . (62,834) (62,834)
124,089 124,932
Changes in goodwill:Disposals and other, net(b) . . . . . . . . . . . . . . . . . . . . . . . . . . . . . . 0 (843)
Balance at end of year:Goodwill . . . . . . . . . . . . . . . . . . . . . . . . . . . . . . . . . . . . . . . . . . . . 186,923 186,923Accumulated impairment losses . . . . . . . . . . . . . . . . . . . . . . . . . . (62,834) (62,834)
$124,089 $124,089
(a) The impairment losses recorded in prior years are related to restaurant brands that we nolonger own.
(b) Disposals and other, net primarily reflects goodwill write-offs associated withrefranchising transactions.
6. ACCRUED AND OTHER LIABILITIES
Accrued liabilities consist of the following (in thousands):
2011 2010
Payroll . . . . . . . . . . . . . . . . . . . . . . . . . . . . . . . . . . . . . . . . . . . . . . . . $ 91,935 $ 79,159Gift cards . . . . . . . . . . . . . . . . . . . . . . . . . . . . . . . . . . . . . . . . . . . . . . 79,837 78,505Insurance . . . . . . . . . . . . . . . . . . . . . . . . . . . . . . . . . . . . . . . . . . . . . . 25,138 28,234Sales tax . . . . . . . . . . . . . . . . . . . . . . . . . . . . . . . . . . . . . . . . . . . . . . . 19,234 24,801Property tax . . . . . . . . . . . . . . . . . . . . . . . . . . . . . . . . . . . . . . . . . . . . 15,844 17,423Dividends . . . . . . . . . . . . . . . . . . . . . . . . . . . . . . . . . . . . . . . . . . . . . 11,609 14,565Other . . . . . . . . . . . . . . . . . . . . . . . . . . . . . . . . . . . . . . . . . . . . . . . . . 43,768 57,853
$287,365 $300,540
Other liabilities consist of the following (in thousands):
2011 2010
Straight-line rent . . . . . . . . . . . . . . . . . . . . . . . . . . . . . . . . . . . . . . . . $ 55,180 $ 52,241Insurance . . . . . . . . . . . . . . . . . . . . . . . . . . . . . . . . . . . . . . . . . . . . . . 42,674 47,123Landlord contributions . . . . . . . . . . . . . . . . . . . . . . . . . . . . . . . . . . . 28,420 30,810Unrecognized tax benefits . . . . . . . . . . . . . . . . . . . . . . . . . . . . . . . . . 5,245 13,290Other . . . . . . . . . . . . . . . . . . . . . . . . . . . . . . . . . . . . . . . . . . . . . . . . . 5,966 5,504
$137,485 $148,968
F-26

7. INCOME TAXES
The provision for income taxes from continuing operations consists of the following (in thousands):
2011 2010 2009
Current income tax expense (benefit):Federal . . . . . . . . . . . . . . . . . . . . . . . . . . . . . . . . . . . . . $16,596 $ 36,493 $(41,803)State . . . . . . . . . . . . . . . . . . . . . . . . . . . . . . . . . . . . . . . 1,694 9,055 (1,189)Foreign . . . . . . . . . . . . . . . . . . . . . . . . . . . . . . . . . . . . . 2,046 1,904 1,808
Total current income tax expense (benefit) . . . . . . . 20,336 47,452 (41,184)
Deferred income tax expense (benefit):Federal . . . . . . . . . . . . . . . . . . . . . . . . . . . . . . . . . . . . . 20,507 (15,773) 41,878State . . . . . . . . . . . . . . . . . . . . . . . . . . . . . . . . . . . . . . . 1,426 (3,415) 6,040
Total deferred income tax expense (benefit) . . . . . . 21,933 (19,188) 47,918
$42,269 $ 28,264 $ 6,734
A reconciliation between the reported provision for income taxes from continuing operations and theamount computed by applying the statutory Federal income tax rate of 35% to income before provision forincome taxes is as follows (in thousands):
2011 2010 2009
Income tax expense at statutory rate . . . . . . . . . . . . . . . $ 64,165 $ 46,196 $ 27,599FICA tax credit . . . . . . . . . . . . . . . . . . . . . . . . . . . . . . . . (15,779) (16,625) (19,307)State income taxes, net of Federal benefit . . . . . . . . . . . (316) 1,711 3,154Other . . . . . . . . . . . . . . . . . . . . . . . . . . . . . . . . . . . . . . . . (5,801) (3,018) (4,712)
$ 42,269 $ 28,264 $ 6,734
The income tax effects of temporary differences that give rise to significant portions of deferred income taxassets and liabilities as of June 29, 2011 and June 30, 2010 are as follows (in thousands):
2011 2010
Deferred income tax assets:Leasing transactions . . . . . . . . . . . . . . . . . . . . . . . . . . . . . . . . . . . $ 41,603 $ 35,795Stock-based compensation . . . . . . . . . . . . . . . . . . . . . . . . . . . . . . 15,320 17,671Restructure charges and impairments . . . . . . . . . . . . . . . . . . . . . . 4,962 9,134Insurance reserves . . . . . . . . . . . . . . . . . . . . . . . . . . . . . . . . . . . . . 23,636 26,734Employee benefit plans . . . . . . . . . . . . . . . . . . . . . . . . . . . . . . . . . 591 1,044Gift cards . . . . . . . . . . . . . . . . . . . . . . . . . . . . . . . . . . . . . . . . . . . . 9,369 8,733Other, net . . . . . . . . . . . . . . . . . . . . . . . . . . . . . . . . . . . . . . . . . . . . 10,296 12,882
Total deferred income tax assets . . . . . . . . . . . . . . . . . . . . . . . . 105,777 111,993
Deferred income tax liabilities:Prepaid expenses . . . . . . . . . . . . . . . . . . . . . . . . . . . . . . . . . . . . . . 13,448 12,963Goodwill and other amortization . . . . . . . . . . . . . . . . . . . . . . . . . 22,297 19,971Depreciation and capitalized interest on property and
equipment . . . . . . . . . . . . . . . . . . . . . . . . . . . . . . . . . . . . . . . . . 24,672 11,143Other, net . . . . . . . . . . . . . . . . . . . . . . . . . . . . . . . . . . . . . . . . . . . . 3,471 3,096
Total deferred income tax liabilities . . . . . . . . . . . . . . . . . . . . . 63,888 47,173
Net deferred income tax asset . . . . . . . . . . . . . . . . . . . . . . . . . . $ 41,889 $ 64,820
F-27

A reconciliation of unrecognized tax benefits for the fiscal years ended June 29, 2011 and June 30, 2010 areas follows (in thousands):
2011 2010
Balance at beginning of year . . . . . . . . . . . . . . . . . . . . . . . . . . . . . . . . . $18,850 $27,711Additions based on tax positions related to the current year . . . . . . 1,199 1,184Additions (Reductions) based on tax positions related to prior
years . . . . . . . . . . . . . . . . . . . . . . . . . . . . . . . . . . . . . . . . . . . . . . . 188 (1,754)Settlements with tax authorities . . . . . . . . . . . . . . . . . . . . . . . . . . . . (5,387) (2,290)Expiration of statute of limitations . . . . . . . . . . . . . . . . . . . . . . . . . . (5,708) (6,001)
Balance at end of year . . . . . . . . . . . . . . . . . . . . . . . . . . . . . . . . . . $ 9,142 $18,850
The total amount of unrecognized tax benefits as of June 29, 2011 was $9.1 million ($6.3 million of whichwould favorably affect the effective tax rate if resolved in our favor due to the effect of deferred taxbenefits). During the next twelve months, we anticipate that it is reasonably possible that the amount ofunrecognized tax benefits could be reduced by approximately $2.5 million ($1.7 million of which would affectthe effective tax rate due to the effect of deferred tax benefits) either because our tax position will be sustainedupon audit or as a result of the expiration of the statute of limitations for specific jurisdictions.
We recognize accrued interest and penalties related to unrecognized tax benefits in income tax expense. Werecognized benefits in interest of approximately $1.8 million and $1.0 million in fiscal 2011 and 2010,respectively, due to the reduction of accrued interest from statute expirations and settlements, net of accruedinterest for remaining positions. As of June 29, 2011, we had $3.0 million ($2.3 million net of a $0.7 millionFederal deferred tax benefit) of interest and penalties accrued, compared to $4.9 million ($3.5 million net of a$1.4 million Federal deferred tax benefit) at June 30, 2010.
8. DEBT
Long-term debt consists of the following (in thousands):
2011 2010
Term loan . . . . . . . . . . . . . . . . . . . . . . . . . . . . . . . . . . . . . . . . . . . . . $185,000 $200,0005.75% notes . . . . . . . . . . . . . . . . . . . . . . . . . . . . . . . . . . . . . . . . . . . . 289,557 289,405Capital lease obligations (see Note 9) . . . . . . . . . . . . . . . . . . . . . . . . 50,106 51,972
524,663 541,377Less current installments . . . . . . . . . . . . . . . . . . . . . . . . . . . . . . . . . . (22,091) (16,866)
$502,572 $524,511
During fiscal 2011, we paid our required installments totaling $15.0 million on our five-year term loanbringing the outstanding balance to $185.0 million. The term loan bears interest at LIBOR plus an applicablemargin, which is a function of our credit rating at such time, but is subject to a maximum of LIBOR plus 3.25%,and expires in June 2015. Based on our current credit rating, we are paying interest at a rate of LIBOR plus2.75% (2.94% as of June 29, 2011).
As of June 29, 2011, we have an undrawn $200 million revolving credit facility, which expires in June2015. The revolving credit facility bears interest at LIBOR plus an applicable margin, which is a function of ourcredit rating at such time, but is subject to a maximum of LIBOR plus 3.25%. Based on our current credit rating,the revolving credit facility carries an interest rate of LIBOR plus 2.75% (2.94% as of June 29, 2011).
F-28
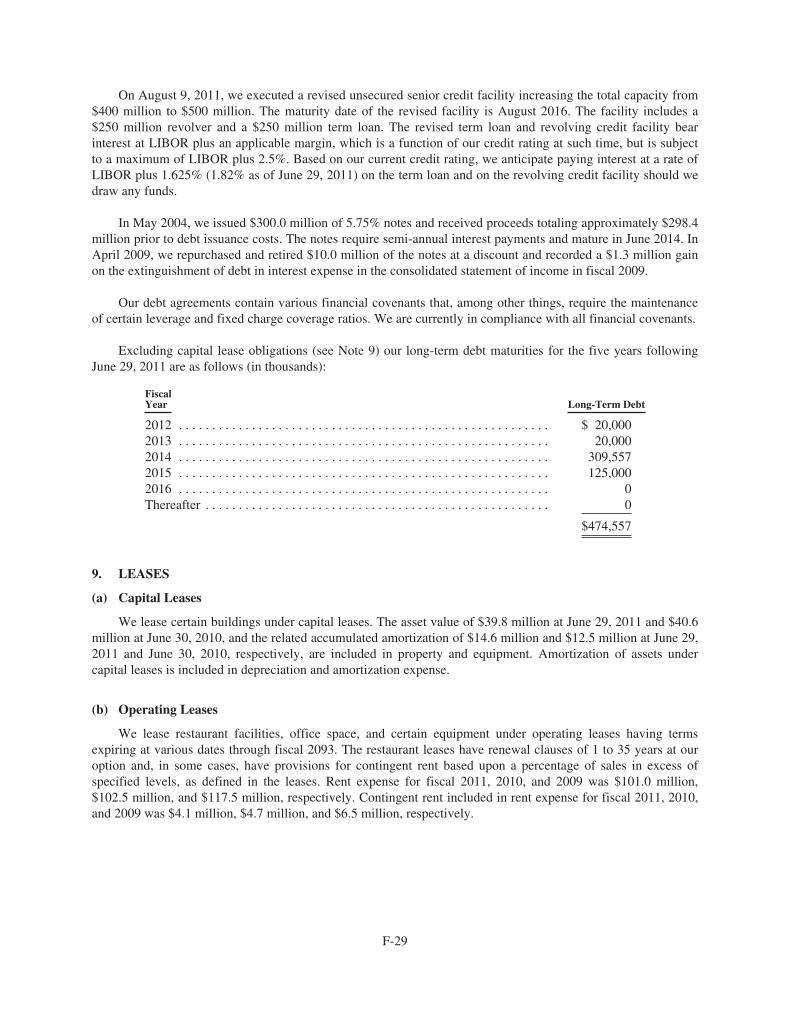
On August 9, 2011, we executed a revised unsecured senior credit facility increasing the total capacity from$400 million to $500 million. The maturity date of the revised facility is August 2016. The facility includes a$250 million revolver and a $250 million term loan. The revised term loan and revolving credit facility bearinterest at LIBOR plus an applicable margin, which is a function of our credit rating at such time, but is subjectto a maximum of LIBOR plus 2.5%. Based on our current credit rating, we anticipate paying interest at a rate ofLIBOR plus 1.625% (1.82% as of June 29, 2011) on the term loan and on the revolving credit facility should wedraw any funds.
In May 2004, we issued $300.0 million of 5.75% notes and received proceeds totaling approximately $298.4million prior to debt issuance costs. The notes require semi-annual interest payments and mature in June 2014. InApril 2009, we repurchased and retired $10.0 million of the notes at a discount and recorded a $1.3 million gainon the extinguishment of debt in interest expense in the consolidated statement of income in fiscal 2009.
Our debt agreements contain various financial covenants that, among other things, require the maintenanceof certain leverage and fixed charge coverage ratios. We are currently in compliance with all financial covenants.
Excluding capital lease obligations (see Note 9) our long-term debt maturities for the five years followingJune 29, 2011 are as follows (in thousands):
FiscalYear Long-Term Debt
2012 . . . . . . . . . . . . . . . . . . . . . . . . . . . . . . . . . . . . . . . . . . . . . . . . . . . . . . . . $ 20,0002013 . . . . . . . . . . . . . . . . . . . . . . . . . . . . . . . . . . . . . . . . . . . . . . . . . . . . . . . . 20,0002014 . . . . . . . . . . . . . . . . . . . . . . . . . . . . . . . . . . . . . . . . . . . . . . . . . . . . . . . . 309,5572015 . . . . . . . . . . . . . . . . . . . . . . . . . . . . . . . . . . . . . . . . . . . . . . . . . . . . . . . . 125,0002016 . . . . . . . . . . . . . . . . . . . . . . . . . . . . . . . . . . . . . . . . . . . . . . . . . . . . . . . . 0Thereafter . . . . . . . . . . . . . . . . . . . . . . . . . . . . . . . . . . . . . . . . . . . . . . . . . . . . 0
$474,557
9. LEASES
(a) Capital Leases
We lease certain buildings under capital leases. The asset value of $39.8 million at June 29, 2011 and $40.6million at June 30, 2010, and the related accumulated amortization of $14.6 million and $12.5 million at June 29,2011 and June 30, 2010, respectively, are included in property and equipment. Amortization of assets undercapital leases is included in depreciation and amortization expense.
(b) Operating Leases
We lease restaurant facilities, office space, and certain equipment under operating leases having termsexpiring at various dates through fiscal 2093. The restaurant leases have renewal clauses of 1 to 35 years at ouroption and, in some cases, have provisions for contingent rent based upon a percentage of sales in excess ofspecified levels, as defined in the leases. Rent expense for fiscal 2011, 2010, and 2009 was $101.0 million,$102.5 million, and $117.5 million, respectively. Contingent rent included in rent expense for fiscal 2011, 2010,and 2009 was $4.1 million, $4.7 million, and $6.5 million, respectively.
F-29

(c) Commitments
As of June 29, 2011, future minimum lease payments on capital and operating leases were as follows (inthousands):
FiscalYear
CapitalLeases
OperatingLeases
2012 . . . . . . . . . . . . . . . . . . . . . . . . . . . . . . . . . . . . . . . . . . . . . . . . . . $ 5,367 $100,4412013 . . . . . . . . . . . . . . . . . . . . . . . . . . . . . . . . . . . . . . . . . . . . . . . . . . 5,473 94,3152014 . . . . . . . . . . . . . . . . . . . . . . . . . . . . . . . . . . . . . . . . . . . . . . . . . . 5,581 84,6582015 . . . . . . . . . . . . . . . . . . . . . . . . . . . . . . . . . . . . . . . . . . . . . . . . . . 5,692 73,4732016 . . . . . . . . . . . . . . . . . . . . . . . . . . . . . . . . . . . . . . . . . . . . . . . . . . 5,806 59,482Thereafter . . . . . . . . . . . . . . . . . . . . . . . . . . . . . . . . . . . . . . . . . . . . . . 53,399 129,085
Total minimum lease payments(a) . . . . . . . . . . . . . . . . . . . . . . . . . 81,318 $541,454
Imputed interest (average rate of 7%) . . . . . . . . . . . . . . . . . . . . . . (31,212)
Present value of minimum lease payments . . . . . . . . . . . . . . . . . . 50,106Less current installments . . . . . . . . . . . . . . . . . . . . . . . . . . . . . . . . (2,091)
$ 48,015
(a) Future minimum lease payments have not been reduced by minimum sublease rentals due in the futureunder non-cancelable subleases. Sublease rentals are approximately $40.7 million and $59.1 million forcapital and operating subleases, respectively.
10. FAIR VALUE DISCLOSURES
(a) Non-Financial Assets Measured on a Non-Recurring Basis
In fiscal 2011, three underperforming restaurants with a carrying value of $2.2 million were written down totheir fair value of $0.3 million resulting in an impairment charge of $1.9 million, which was included in othergains and charges in the consolidated statement of income for the period. In fiscal 2010, 22 underperformingrestaurants with a carrying value of $27.1 million were written down to their fair value of $7.3 million resultingin an impairment charge of $19.8 million, which was included in other gains and charges in the consolidatedstatement of income for the period. We determined fair value based on projected discounted future operatingcash flows of the restaurants over their remaining service life using a risk adjusted discount rate that iscommensurate with the risk inherent in our current business model.
The following table presents fair values for those assets measured at fair value on a non-recurring basis atJune 29, 2011 and June 30, 2010 (in thousands):
Fair Value Measurements Using
(Level 1) (Level 2) (Level 3) Total
Long-lived assets held for use:At June 29, 2011 . . . . . . . . . . . . . . . . . . . . . $— $— $ 255.0 $ 255.0At June 30, 2010 . . . . . . . . . . . . . . . . . . . . . $— $— $7,343.0 $7,343.0
(b) Other Financial Instruments
Our financial instruments consist of cash and cash equivalents, accounts receivable, accounts payable andlong-term debt. The fair value of cash and cash equivalents, accounts receivable and accounts payableapproximates their carrying amounts while the fair value of the 5.75% notes is based on quoted market prices. AtJune 29, 2011, the 5.75% notes had a carrying value of $289.6 million and a fair value of $308.1 million. AtJune 30, 2010, the 5.75% notes had a carrying value of $289.4 million and a fair value of $302.6 million.
F-30

11. STOCK-BASED COMPENSATION
Our shareholders approved stock-based compensation plans including the Stock Option and Incentive Planand the Stock Option and Incentive Plan for Non-Employee Directors and Consultants (collectively, the “Plans”).The total number of shares authorized for issuance to employees and non-employee directors and consultantsunder the Plans is currently 35.3 million. The Plans provide for grants of options to purchase our common stock,restricted stock, restricted stock units, performance shares and stock appreciation rights.
(a) Stock Options
Expense related to stock options issued to eligible employees under the Plans is recognized using a graded-vesting schedule over the vesting period or to the date on which retirement eligibility is achieved, if shorter.Stock options generally vest over a period of 1 to 4 years and have contractual terms to exercise of 8 to 10 years.Full or partial vesting of awards may occur upon a change in control (as defined in the Plans), or upon anemployee’s death, disability or involuntary termination.
Transactions during fiscal 2011 were as follows (in thousands, except option prices):
Number ofOptions
WeightedAverageExercise
Price
WeightedAverage
RemainingContractualLife (Years)
AggregateIntrinsic
Value
Options outstanding at June 30, 2010 . . . . 7,640 $21.52Granted . . . . . . . . . . . . . . . . . . . . . . . . . . . 786 19.07Exercised . . . . . . . . . . . . . . . . . . . . . . . . . . (1,726) 19.15Forfeited or canceled . . . . . . . . . . . . . . . . (563) 22.57
Options outstanding at June 29, 2011 . . . . 6,137 $21.77 3.5 $19,599
Options exercisable at June 29, 2011 . . . . 4,723 $22.62 2.5 $11,406
At June 29, 2011, unrecognized compensation expense related to stock options totaled approximately $4.0million and will be recognized over a weighted average period of 2.1 years. The intrinsic value of optionsexercised totaled approximately $5.5 million, $0.7 million and $3.3 million during fiscal 2011, 2010 and 2009,respectively. The tax benefit realized on options exercised totaled approximately $2.1 million, $0.3 million and$1.2 million during fiscal 2011, 2010 and 2009, respectively.
(b) Restricted Share Awards
Restricted share awards consist of performance shares, restricted stock and restricted stock units.Performance shares and most restricted stock units issued to eligible employees under the Plans generally vest infull on the third anniversary of the date of grant, while restricted stock units issued to eligible employees underour career equity plan generally vest upon each employee’s retirement from the Company. Expense is recognizedratably over the vesting period, or to the date on which retirement eligibility is achieved, if shorter. Restrictedstock and restricted stock units issued to non-employee directors under the Plans generally vest in full on thefourth anniversary of the date of grant or upon each director’s retirement from the Board and are expensed whengranted. Full or partial vesting of awards may occur upon a change in control (as defined in the Plans), or uponan employee’s death, disability or involuntary termination.
F-31

Transactions during fiscal 2011 were as follows (in thousands, except fair values):
Number ofRestricted
ShareAwards
WeightedAverage
Fair ValuePer Award
Restricted share awards outstanding at June 30, 2010 . . . . . . . . . . . 2,448 $17.40Granted . . . . . . . . . . . . . . . . . . . . . . . . . . . . . . . . . . . . . . . . . . . . . . . 1,051 12.72Vested . . . . . . . . . . . . . . . . . . . . . . . . . . . . . . . . . . . . . . . . . . . . . . . . (711) 24.28Forfeited . . . . . . . . . . . . . . . . . . . . . . . . . . . . . . . . . . . . . . . . . . . . . . (446) 13.07
Restricted share awards outstanding at June 29, 2011 . . . . . . . . . . . 2,342 $14.03
At June 29, 2011, unrecognized compensation expense related to restricted share awards totaledapproximately $8.2 million and will be recognized over a weighted average period of 2.4 years. The fair value ofshares that vested during fiscal 2011, 2010, and 2009 totaled approximately $7.5 million, $9.6 million and $12.7million, respectively.
12. SAVINGS PLANS
We sponsor a qualified defined contribution retirement plan (“Plan I”) covering all employees who haveattained the age of twenty-one and have completed one year and 1,000 hours of service. Plan I allows eligibleemployees to contribute, subject to IRS limitations on total annual contributions, up to 50% of their basecompensation and 100% of their eligible bonuses, as defined in the plan, to various investment funds. We matchin cash at a rate of 100% of the first 3% an employee contributes and 50% of the next 2% the employeecontributes with immediate vesting. In fiscal 2011, 2010, and 2009, we contributed approximately $6.3 million,$7.3 million, and $8.1 million, respectively.
We also sponsor a non-qualified defined contribution plan covering a select group of highly compensatedemployees, as defined in the plan. Eligible employees are allowed to defer receipt of up to 50% of their basecompensation and bonus, as defined in the plan. There is no company match, but employee contributions earninterest based on a rate determined and announced in November prior to the start of the plan year. Employeecontributions and earnings thereon vest immediately. A Rabbi Trust is used to fund obligations of thenon-qualified plan. The market value of the trust assets is included in other assets and the liability to planparticipants is included in other liabilities.
13. SUPPLEMENTAL CASH FLOW INFORMATION
Cash paid for interest and income taxes is as follows (in thousands):
2011 2010 2009
Income taxes, net of refunds . . . . . . . . . . . . . . . . . . . . . . $38,340 $20,052 $ 5,219Interest, net of amounts capitalized . . . . . . . . . . . . . . . . 25,810 23,923 34,473
Non-cash investing activities are as follows (in thousands):
2011 2010 2009
Retirement of fully depreciated assets . . . . . . . . . . . . . . $60,175 $45,854 $46,382
F-32

14. CONTINGENCIES
In connection with the sale of restaurants to franchisees and brand divestitures, we have, in certain cases,guaranteed lease payments. As of June 29, 2011 and June 30, 2010, we have outstanding lease guarantees or aresecondarily liable for $166.1 million and $208.0 million, respectively. This amount represents the maximumpotential liability of future payments under the guarantees. These leases have been assigned to the buyers andexpire at the end of the respective lease terms, which range from fiscal 2012 through fiscal 2023. In the event ofdefault, the indemnity and default clauses in our assignment agreements govern our ability to pursue and recoverdamages incurred. No material liabilities have been recorded as of June 29, 2011.
Certain current and former hourly restaurant employees filed a lawsuit against us in California SuperiorCourt alleging violations of California labor laws with respect to meal and rest breaks. The lawsuit seekspenalties and attorney’s fees and was certified as a class action in July 2006. In July 2008, the California Court ofAppeal decertified the class action on all claims with prejudice. In October 2008, the California Supreme Courtgranted a writ to review the decision of the Court of Appeal. We intend to vigorously defend our position. It isnot possible at this time to reasonably estimate the possible loss or range of loss, if any.
We are engaged in various other legal proceedings and have certain unresolved claims pending. Reserveshave been established based on our best estimates of our potential liability in certain of these matters. Based uponconsultation with legal counsel, Management is of the opinion that there are no matters pending or threatenedwhich are expected to have a material adverse effect, individually or in the aggregate, on our consolidatedfinancial condition or results of operations.
15. QUARTERLY RESULTS OF OPERATIONS (UNAUDITED)
The following table summarizes the unaudited consolidated quarterly results of operations for fiscal 2011and 2010 (in thousands, except per share amounts):
Fiscal Year 2011Quarters Ended
Sept. 29 Dec. 29 March 30 June 29
Revenues . . . . . . . . . . . . . . . . . . . . . . . . . . . . . . . . . . . . . $654,893 $671,886 $717,119 $717,488
Income before provision for income taxes . . . . . . . . . . . $ 26,919 $ 45,426 $ 55,499 $ 55,485
Income from continuing operations . . . . . . . . . . . . . . . . $ 21,431 $ 37,464 $ 40,246 $ 41,919Income from discontinued operations, net of taxes . . . . $ 0 $ 0 $ 0 $ 0Net income . . . . . . . . . . . . . . . . . . . . . . . . . . . . . . . . . . . $ 21,431 $ 37,464 $ 40,246 $ 41,919Basic net income per share:
Income from continuing operations . . . . . . . . . . . . . . $ 0.21 $ 0.41 $ 0.46 $ 0.50Income from discontinued operations . . . . . . . . . . . . . $ 0.00 $ 0.00 $ 0.00 $ 0.00Net income per share . . . . . . . . . . . . . . . . . . . . . . . . . . $ 0.21 $ 0.41 $ 0.46 $ 0.50
Diluted net income per share:Income from continuing operations . . . . . . . . . . . . . . $ 0.21 $ 0.41 $ 0.45 $ 0.49Income from discontinued operations . . . . . . . . . . . . . $ 0.00 $ 0.00 $ 0.00 $ 0.00Net income per share . . . . . . . . . . . . . . . . . . . . . . . . . . $ 0.21 $ 0.41 $ 0.45 $ 0.49
Basic weighted average shares outstanding . . . . . . . . . . 100,667 90,936 87,679 83,888Diluted weighted average shares outstanding . . . . . . . . . 101,556 92,111 89,647 85,906
F-33

Fiscal Year 2010Quarters Ended
Sept. 23 Dec. 23 March 24 June 30(1)
Revenues . . . . . . . . . . . . . . . . . . . . . . . . . . . . . . . . . . . . . $696,543 $705,515 $713,380 $743,060
Income before provision for income taxes . . . . . . . . . . . $ 13,411 $ 17,827 $ 44,245 $ 56,503
Income from continuing operations . . . . . . . . . . . . . . . . $ 10,279 $ 14,837 $ 35,508 $ 43,098Income from discontinued operations, net of taxes . . . . $ 5,488 $ 3,487 $ 4,490 $ 20,517Net income . . . . . . . . . . . . . . . . . . . . . . . . . . . . . . . . . . . $ 15,767 $ 18,324 $ 39,998 $ 63,615Basic net income per share:
Income from continuing operations . . . . . . . . . . . . . . $ 0.10 $ 0.14 $ 0.35 $ 0.42Income from discontinued operations . . . . . . . . . . . . . $ 0.05 $ 0.04 $ 0.04 $ 0.20Net income per share . . . . . . . . . . . . . . . . . . . . . . . . . . $ 0.15 $ 0.18 $ 0.39 $ 0.62
Diluted net income per share:Income from continuing operations . . . . . . . . . . . . . . $ 0.10 $ 0.14 $ 0.35 $ 0.42Income from discontinued operations . . . . . . . . . . . . . $ 0.05 $ 0.04 $ 0.04 $ 0.20Net income per share . . . . . . . . . . . . . . . . . . . . . . . . . . $ 0.15 $ 0.18 $ 0.39 $ 0.62
Basic weighted average shares outstanding . . . . . . . . . . 102,243 102,481 102,470 101,934Diluted weighted average shares outstanding . . . . . . . . . 103,016 102,994 103,357 102,791
(1) The quarter ended June 30, 2010 consisted of 14 weeks, while all other quarters consisted of13 weeks.
Income from continuing operations for fiscal year 2011 included severance charges of $2.8 million, $0.9million and $1.0 million in the first, second and third quarters, respectively. Lease termination charges of $1.2million, $0.8 million and $1.0 million were incurred in the first, second and fourth quarters, respectively. Incomefrom continuing operations also included long-lived asset impairments of $1.1 million and $0.8 million in thesecond and fourth quarters, respectively.
Income from continuing operations for fiscal year 2010 included long-lived asset impairments of $20.6million and $4.6 million in the second and fourth quarters, respectively. Lease termination charges of $2.2million and $4.0 million were also incurred in the first and third quarters, respectively.
Income from discontinued operations, net of taxes, in the fourth quarter of fiscal 2010 included a pre-taxgain on the sale of On The Border of $16.5 million.
F-34

Report of Independent Registered Public Accounting Firm
The Board of Directors and ShareholdersBrinker International, Inc.:
We have audited the accompanying consolidated balance sheets of Brinker International, Inc. andsubsidiaries (“the Company”) as of June 29, 2011 and June 30, 2010, and the related consolidated statements ofincome, shareholders’ equity and cash flows for each of the years in the three-year period ended June 29, 2011.These consolidated financial statements are the responsibility of the Company’s management. Our responsibilityis to express an opinion on these consolidated financial statements based on our audits.
We conducted our audits in accordance with the standards of the Public Company Accounting OversightBoard (United States). Those standards require that we plan and perform the audit to obtain reasonable assuranceabout whether the financial statements are free of material misstatement. An audit includes examining, on a testbasis, evidence supporting the amounts and disclosures in the financial statements, assessing the accountingprinciples used and significant estimates made by management, as well as evaluating the overall financialstatement presentation. We believe that our audits provide a reasonable basis for our opinion.
In our opinion, the consolidated financial statements referred to above present fairly, in all material respects,the financial position of Brinker International, Inc. and subsidiaries as of June 29, 2011 and June 30, 2010, andthe results of their operations and their cash flows for each of the years in the three-year period ended June 29,2011 in conformity with U.S. generally accepted accounting principles.
We also have audited, in accordance with the standards of the Public Company Accounting Oversight Board(United States), the Company’s internal control over financial reporting as of June 29, 2011, based on criteriaestablished in Internal Control—Integrated Framework issued by the Committee of Sponsoring Organizations ofthe Treadway Commission and our report dated August 29, 2011 expressed an unqualified opinion on theeffectiveness of the Company’s internal control over financial reporting.
KPMG LLP
Dallas, TXAugust 29, 2011
F-35

Report of Independent Registered Public Accounting Firm
The Board of Directors and ShareholdersBrinker International, Inc.:
We have audited Brinker International, Inc. and subsidiaries’ (“the Company”) internal control overfinancial reporting as of June 29, 2011, based on criteria established in Internal Control—Integrated Frameworkissued by the Committee of Sponsoring Organizations of the Treadway Commission (COSO). The Company’smanagement is responsible for maintaining effective internal control over financial reporting and for itsassessment of the effectiveness of internal control over financial reporting, included in the accompanyingManagement’s Report on Internal Control Over Financial Reporting. Our responsibility is to express an opinionon the Company’s internal control over financial reporting based on our audit.
We conducted our audit in accordance with the standards of the Public Company Accounting OversightBoard (United States). Those standards require that we plan and perform the audit to obtain reasonable assuranceabout whether effective internal control over financial reporting was maintained in all material respects. Ouraudit included obtaining an understanding of internal control over financial reporting, assessing the risk that amaterial weakness exists, and testing and evaluating the design and operating effectiveness of internal controlbased on the assessed risk. Our audit also included performing such other procedures as we considered necessaryin the circumstances. We believe that our audit provides a reasonable basis for our opinion.
A company’s internal control over financial reporting is a process designed to provide reasonable assuranceregarding the reliability of financial reporting and the preparation of financial statements for external purposes inaccordance with generally accepted accounting principles. A company’s internal control over financial reportingincludes those policies and procedures that (1) pertain to the maintenance of records that, in reasonable detail,accurately and fairly reflect the transactions and dispositions of the assets of the company; (2) provide reasonableassurance that transactions are recorded as necessary to permit preparation of financial statements in accordancewith generally accepted accounting principles, and that receipts and expenditures of the company are being madeonly in accordance with authorizations of management and directors of the company; and (3) provide reasonableassurance regarding prevention or timely detection of unauthorized acquisition, use, or disposition of thecompany’s assets that could have a material effect on the financial statements.
Because of its inherent limitations, internal control over financial reporting may not prevent or detectmisstatements. Also, projections of any evaluation of effectiveness to future periods are subject to the risk thatcontrols may become inadequate because of changes in conditions, or that the degree of compliance with thepolicies or procedures may deteriorate.
In our opinion, the Company maintained, in all material respects, effective internal control over financialreporting as of June 29, 2011, based on criteria established in Internal Control—Integrated Framework issued byCOSO.
We also have audited, in accordance with the standards of the Public Company Accounting Oversight Board(United States), the consolidated balance sheets of Brinker International, Inc. and subsidiaries as of June 29, 2011and June 30, 2010, and the related consolidated statements of operations, shareholders’ equity, and cash flows foreach of the years in the three-year period ended June 29, 2011, and our report dated August 29, 2011 expressedan unqualified opinion on those consolidated financial statements.
KPMG LLP
Dallas, TXAugust 29, 2011
F-36

MANAGEMENT’S RESPONSIBILITY FOR CONSOLIDATED FINANCIAL STATEMENTS
Management is responsible for the reliability of the consolidated financial statements and related notes,which have been prepared in conformity with U. S. generally accepted accounting principles and includeamounts based upon our estimate and judgments, as required. The consolidated financial statements have beenaudited and reported on by our independent registered public accounting firm, KPMG LLP, who were given freeaccess to all financial records and related data, including minutes of the meetings of the Board of Directors andCommittees of the Board. We believe that the representations made to the independent auditors were valid andappropriate.
We maintain a system of internal controls over financial reporting designed to provide reasonable assuranceof the reliability of the consolidated financial statements. Our internal audit function monitors and reports on theadequacy of the compliance with the internal control system and appropriate actions are taken to addresssignificant control deficiencies and other opportunities for improving the system as they are identified. The AuditCommittee of the Board of Directors, which is comprised solely of outside directors, provides oversight to thefinancial reporting process through periodic meetings with our independent auditors, internal auditors, andmanagement. Both our independent auditors and internal auditors have free access to the Audit Committee.Although no cost-effective internal control system will preclude all errors and irregularities, we believe ourcontrols as of and for the year ended June 29, 2011 provide reasonable assurance that the consolidated financialstatements are reliable.
MANAGEMENT’S REPORT ON INTERNAL CONTROL OVER FINANCIAL REPORTING
Management is responsible for establishing and maintaining adequate internal control over financialreporting. We have assessed the effectiveness of our internal control over financial reporting based on theframework in Internal Control—Integrated Framework issued by the Committee of Sponsoring Organizations ofthe Treadway Commission. Based on our assessment, we concluded that our internal control over financialreporting was effective as of June 29, 2011.
Because of inherent limitations, internal control over financial reporting may not prevent or detectmisstatements. Also, projection of any evaluation of effectiveness to future periods are subject to the risk thatcontrols may become inadequate because of changes in conditions, or that the degree of compliance with thepolicies and procedures may deteriorate.
The effectiveness of our internal control over financial reporting as of June 29, 2011 has been audited byKPMG LLP, an independent registered public accounting firm, as stated in its attestation report which is includedherein.
/s/ DOUGLAS H. BROOKS
DOUGLAS H. BROOKSPresident and Chief Executive Officer
/s/ GUY J. CONSTANT
GUY J. CONSTANTExecutive Vice President and Chief Financial Officer
F-37

Exhibit 21
BRINKER INTERNATIONAL, INC., A DELAWARE CORPORATIONSUBSIDIARIES
BRINKER RESTAURANT CORPORATION, a Delaware corporationBRINKER INTERNATIONAL PAYROLL COMPANY, L.P., a Delaware limited partnership
BRINKER ALABAMA, INC., a Delaware corporationBRINKER ARKANSAS, INC., a Delaware corporation
BRINKER FLORIDA, INC., a Delaware corporationBRINKER FREEHOLD, INC., a New Jersey corporation
BRINKER GEORGIA, INC., a Delaware corporationBRINKER LOUISIANA, INC., a Delaware corporation
BRINKER MASSACHUSETTS CORPORATION, a Delaware corporationBRINKER MHC B.V., a Netherlands private companyBRINKER MICHIGAN, INC., a Delaware corporationBRINKER MISSISSIPPI, INC., a Delaware corporationBRINKER MISSOURI, INC., a Delaware corporation
BRINKER NEVADA, INC., a Nevada corporationBRINKER NEW JERSEY, INC., a Delaware corporation
BRINKER NORTH CAROLINA, INC., a Delaware corporationBRINKER OF BALTIMORE COUNTY, INC., a Maryland corporation
BRINKER OF CARROLL COUNTY, INC., a Maryland corporationBRINKER OF CECIL COUNTY, INC., a Maryland corporation
BRINKER OKLAHOMA, INC., a Delaware corporationBRINKER PENN TRUST, a Pennsylvania business trust
BRINKER SERVICES CORPORATION, a Florida corporationBRINKER TEXAS, INC., a Delaware corporation
BRINKER VIRGINIA, INC., a Delaware corporationCHILI’S BEVERAGE COMPANY, INC., a Texas corporation
CHILI’S, INC., a Delaware corporationCHILI’S, INC., a Tennessee corporation
CHILI’S INTERNATIONAL BASES, B.V., a Netherlands private companyCHILI’S OF BEL AIR, INC., a Maryland corporationCHILI’S OF KANSAS, INC., a Kansas corporation
CHILI’S OF MARYLAND, INC., a Maryland corporationCHILI’S OF WEST VIRGINIA, INC., a West Virginia corporation
MAGGIANO’S, INC., an Illinois corporationMAGGIANO’S BEVERAGE COMPANY, a Texas corporation
MAGGIANO’S HOLDING CORPORATION, a Delaware corporationMAGGIANO’S OF TYSON’S, INC., a Virginia corporation
MAGGIANO’S TEXAS, INC., a Delaware corporationBRINKER CB MANAGEMENT, LLC, a Delaware limited liability company
BRINKER CB, LP, a Texas limited partnershipBRINKER PURCHASING, INC., a Delaware corporation
BIPC MANAGEMENT, LLC, a Delaware limited liability companyBIPC INVESTMENTS, LLC, a Delaware limited liability company
BRINKER BRAZIL, LLC, a Delaware limited liability companyBRINKER INTERNATIONAL GOLF CLASSIC, a Texas non-profit corporation
BRINKER FAMILY FUND, INC., a Delaware non-profit corporation

Exhibit 23
Consent of Independent Registered Public Accounting Firm
The Board of Directors
Brinker International, Inc.:
We consent to the incorporation by reference in the Registration Statement Nos. 33-56491, 333-02201,333-93755, 333-42224, 333-105720, 333-125289, and 333-157050 on Form S-8; Registration No. 333-74902 onForm S-3; and Registration Statement No. 333-116879 on Form S-4 of Brinker International, Inc. of our reportsdated August 29, 2011, with respect to the consolidated balance sheets of Brinker International, Inc. as of June29, 2011 and June 30, 2010, and the related consolidated statements of earnings, shareholders’ equity, and cashflows for each of the years in the three-year period ended June 29, 2011, and the effectiveness of internal controlover financial reporting as of June 29, 2011, which reports appear in the 2011 Annual Report to Shareholders onForm 10-K of Brinker International, Inc.
KPMG LLP
Dallas, Texas
August 29, 2011

Exhibit 31(a)
CERTIFICATION
I, Douglas H. Brooks, certify that:
1. I have reviewed this Annual Report on Form 10-K of Brinker International, Inc.;
2. Based on my knowledge, this report does not contain any untrue statement of a material fact or omit to statea material fact necessary to make the statements made, in light of the circumstances under which suchstatements were made, not misleading with respect to the period covered by this report;
3. Based on my knowledge, the financial statements, and other financial information included in this annualreport, fairly present in all material respects the financial condition, results of operations and cash flows ofthe registrant as of, and for, the periods presented in this annual report;
4. The registrant’s other certifying officer(s) and I are responsible for establishing and maintaining disclosurecontrols and procedures (as defined in Exchange Act Rules 13a-15(e) and 15d-15(e)) and internal controlover financial reporting (as defined in Exchange Act Rules 13a-15(f) and 15d-15(f)) for the registrant andhave:
a. Designed such disclosure controls and procedures, or caused such disclosure controls and procedures tobe designed under our supervision, to ensure that material information relating to the registrant,including its consolidated subsidiaries, is made known to us by others within those entities, particularlyduring the period in which this report is being prepared;
b. Designed such internal control over financial reporting, or caused such internal control over financialreporting to be designed under our supervision, to provide reasonable assurance regarding thereliability of financial reporting and the preparation of financial statements for external purposes inaccordance with generally acceptable accounting principles;
c. Evaluated the effectiveness of the registrant’s disclosure controls and procedures and presented in thisreport our conclusions about the effectiveness of the disclosure controls and procedures, as of the endof the period covered by this report based on such evaluation; and
d. Disclosed in this report any change in the registrant’s internal control over financial reporting thatoccurred during the registrant’s most recent fiscal quarter (the registrant’s fourth fiscal quarter in thecase of an annual report) that has materially affected, or is reasonably likely to materially affect, theregistrant’s internal control over financial reporting; and
5. The registrant’s other certifying officer(s) and I have disclosed, based on our most recent evaluation ofinternal control over financial reporting, to the registrant’s auditors and the audit committee of theregistrant’s board of directors (or persons performing the equivalent functions);
a. All significant deficiencies and material weaknesses in the design or operation of internal control overfinancial reporting which are reasonably likely to adversely affect the registrant’s ability to record,process, summarize and report financial information; and
b. Any fraud, whether or not material, that involves management or other employees who have asignificant role in the registrant’s internal control over financial reporting.
Dated: August 29, 2011
/S/ DOUGLAS H. BROOKS
Douglas H. BrooksChairman of the Board, President andChief Executive Officer(Principal Executive Officer)

Exhibit 31(b)
CERTIFICATION
I, Guy J. Constant, certify that:
1. I have reviewed this Annual Report on Form 10-K of Brinker International, Inc.;
2. Based on my knowledge, this report does not contain any untrue statement of a material fact or omit to statea material fact necessary to make the statements made, in light of the circumstances under which suchstatements were made, not misleading with respect to the period covered by this report;
3. Based on my knowledge, the financial statements, and other financial information included in this report,fairly present in all material respects the financial condition, results of operations and cash flows of theregistrant as of, and for, the periods presented in this report;
4. The registrant’s other certifying officer(s) and I are responsible for establishing and maintaining disclosurecontrols and procedures (as defined in Exchange Act Rules 13a-15(e) and 15d-15(e)) and internal controlover financial reporting (as defined in Exchange Act Rules 13a-15(f) and 15d-15(f)) for the registrant andhave:
a. Designed such disclosure controls and procedures, or caused such disclosure controls and procedures tobe designed under our supervision, to ensure that material information relating to the registrant,including its consolidated subsidiaries, is made known to us by others within those entities, particularlyduring the period in which this report is being prepared;
b. Designed such internal control over financial reporting, or caused such internal control over financialreporting to be designed under our supervision, to provide reasonable assurance regarding thereliability of financial reporting and the preparation of financial statements for external purposes inaccordance with generally acceptable accounting principles;
c. Evaluated the effectiveness of the registrant’s disclosure controls and procedures and presented in thisreport our conclusions about the effectiveness of the disclosure controls and procedures, as of the endof the period covered by this report based on such evaluation; and
d. Disclosed in this report any change in the registrant’s internal control over financial reporting thatoccurred during the registrant’s most recent fiscal quarter (the registrant’s fourth fiscal quarter in thecase of an annual report) that has materially affected, or is reasonably likely to materially affect, theregistrant’s internal control over financial reporting; and
5. The registrant’s other certifying officer(s) and I have disclosed, based on our most recent evaluation ofinternal control over financial reporting, to the registrant’s auditors and the audit committee of theregistrant’s board of directors (or persons performing the equivalent functions);
a. All significant deficiencies and material weaknesses in the design or operation of internal control overfinancial reporting which are reasonably likely to adversely affect the registrant’s ability to record,process, summarize and report financial information; and
b. Any fraud, whether or not material, that involves management or other employees who have asignificant role in the registrant’s internal control over financial reporting.
Dated: August 29, 2011
/S/ GUY J. CONSTANT
Guy J. ConstantExecutive Vice President andChief Financial Officer(Principal Financial Officer)

Exhibit 32(a)
CERTIFICATION
Pursuant to 18 U.S.C. Section 1350, the undersigned officer of Brinker International, Inc. (the “Company”),hereby certifies that the Company’s Annual Report on Form 10-K for the year ended June 29, 2011 (the“Report”) fully complies with the requirements of Section 13(a) or 15(d), as applicable, of the SecuritiesExchange Act of 1934 and that the information contained in the Report fairly presents, in all material respects,the financial condition and results of operations of the Company.
Dated: August 29, 2011
By: /S/ DOUGLAS H. BROOKS
Name: Douglas H. BrooksTitle: Chairman of the Board, President and
Chief Executive Officer(Principal Executive Officer)

Exhibit 32(b)
CERTIFICATION
Pursuant to 18 U.S.C. Section 1350, the undersigned officer of Brinker International, Inc. (the “Company”),hereby certifies that the Company’s Annual Report on Form 10-K for the year ended June 29, 2011 (the“Report”) fully complies with the requirements of Section 13(a) or 15(d), as applicable, of the SecuritiesExchange Act of 1934 and that the information contained in the Report fairly presents, in all material respects,the financial condition and results of operations of the Company.
Dated: August 29, 2011
By: /S/ GUY J. CONSTANT
Name: Guy J. ConstantTitle: Executive Vice President and
Chief Financial Officer(Principal Financial Officer)


BOARD OF DIRECTORS
Douglas H. BrooksChairman of the Board,Chief Executive Officer and PresidentBrinker International, Inc.
David DenoChief Financial Officer,International DivisionBest Buy Co.
Joseph M. DePintoPresident and Chief Executive Officer7-Eleven, Inc.
Michael DixonChief Financial OfficerPinkberry, Inc.
Harriet EdelmanVice Chairman Emigrant Bank
Jon L. LutherChairman of the BoardDunkin Brands
John W. MimsSenior Vice President, World-Wide Sales &Resort Marketing AsiaLas Vegas Sands Corporation
George R. MrkonicNon Executive ChairmanPaperchase Products Limited
Rosendo G. ParraPartner and FounderDaylight Partners
Cece SmithRetired Managing General PartnerPhillips-Smith-Machens Venture Partners
PRINCIPAL OFFICERS
Douglas H. BrooksChairman of the Board, Chief Executive Officer and President
Guy J. ConstantExecutive Vice President and Chief Financial Officer
Valerie L. DavissonExecutive Vice President and Chief People Works Officer
Roger F. ThomsonExecutive Vice President, Chief Administrative Officer,General Counsel and Secretary
Steve D. ProvostPresident of Maggiano’s Little Italy
Wyman T. RobertsPresident of Chili’s Grill & Bar
Carin L. StutzPresident of Global Business Development
Ian H. BainesSenior Vice President of Strategic Innovation
David R. DoyleSenior Vice President and Controller
Jeffrey A. HobanSenior Vice President, Assistant General Counseland Assistant Secretary
John R. HoseaSenior Vice President of People Services andInformation Technology
David R. ParsleySenior Vice President of Supply Chain Management
Kelli A. ValadeChief Operating Officer of Chili’s Grill & Bar
SHAREHOLDER INFORMATION
Executive OfficesBrinker International, Inc.6820 LBJ FreewayDallas, TX 75240(972) 980-9917
Annual Meeting
Brinker International, Inc.The Play Room in Building C6700 LBJ FreewayDallas,TX 75240
Independent Public AccountantsKPMG LLP717 N. Harwood, Suite 3100Dallas, TX 75201
NYSE Symbol: EAT
Stock Transfer Agent And RegistrarBNY Mellon Shareowner Services480 Washington BoulevardJersey City, NJ 07310-1900Customer Service (800) 213-5156TDD for Hearing Impaired (800) 231-5469Foreign Shareowners (201) 680-6578You can now access your Brinker Shareholder Account online via Investors Service Direct®.Visit us on the web at www.bnymellon.com/shareowner/equityaccess and follow the easy access instructions.
10-K AvailabilityThe company will furnish to any shareholder, without charge, a copy of the company’s annual report filed with the Securities and Exchange Commission on Form 10-K for the 2011 fiscal year from our website at: www.brinker.com or upon written request from the shareholder.
Please send your written request to:Secretary/Investor RelationsBrinker International, Inc.6820 LBJ FreewayDallas, TX 75240
CEO/CFO CertificationsOn November 15, 2010, the company submitted its annual Section 303A CEO certification to the New York Stock Exchange.The company also filed the CEO and CFO certifications required under Section 302 of the Sarbanes-Oxley Act of 2002 with the Securities and Exchange Commission as exhibits to its Annual Report on Form 10-K for the year ended June 29, 2011.
Chili’s® Grill & Bar and Maggiano’s Little Italy® are registered and/or proprietary trademarks of Brinker International Payroll Company, L.P.
Thursday, November 3, 2011 at 9:00 a.m.

6820 LBJ Freeway, Dallas, TX 75240 • www.brinker.com
Annual Report 2011