Flood Disaster Protection Introduction - Federal Reserve System
Final Report
6-41
6.3 Disaster Characteristics of Flood Disaster and Countermeasures in Kabupaten Padang Pariaman
6.3.1 Disaster Characteristics of Flood Disaster in Kabupaten Padang Pariaman
1) Flood Disaster in the past
The water-related disasters in Kabupaten Padang Pariaman are shown in the table below which indicates the recent flood and sediment disasters in Kabupaten Padang Pariaman. Off the table, a number of flood and sediment disasters had struck Kabupaten Padang Pariaman frequently.
Table 6.3.1 Recent History of Major Flood and Sediment Disasters
Date (DD/MM/YY) Type Profile of Damages due to Disaster
24/04/07 Flood Flood Disaster in Kec. Ulakan Tapakis and Kec. Sintoga Flooded Houses: 98
22-23/01/07 Flood Flood Disaster in Kec. Batang Gasan, Kec. Sungai Limau, Kec. V Koto Kp. Dalam, Kec. Nan Sabaris, Kec. Ulakan Tapakis and Kec. Batang Anai Flooded Houses: 1,506, Flooded School 8
12/01/07 Flood Flood Disaster in Kec. Batang Anai, Kec. Lubuk Alung, Kec. Ulakan Tapakis, Kec. Batang Gasan and Kec. V Koto Kp. Dalam Flooded Houses: 234, , Heavily Damaged Houses 14, etc.
08/01/07 Sediment Landslide Disaster in Kec. V Koto Timur Number of Killed: 13, Buried Houses: 4, etc.
12/01/06 Flood
Flood Disaster in Kec. Batang Anai, Kec. Lubuk Alung, Kec. Ulakan Tapakis, Kec. Batang Gasan, Kec. Sungai Limau, Kec. VII Koto, Kec. V Koto Kampung Dalam Flooded Houses 1,204, Heavily Damaged Houses: 4, etc.
25/04/05 Flood Flood Disaster in Kec. Batang Anai, Kec. Lubuk Alung, Kec. Ulakan Tapakis, Kec. Batang Gasan and Kec. V Koto Kp. Dalam Flooded Houses 340, Heavily Damaged Houses 4, etc.
Source: Board of National Unity and Society Protection, Kabupaten Padang Pariaman
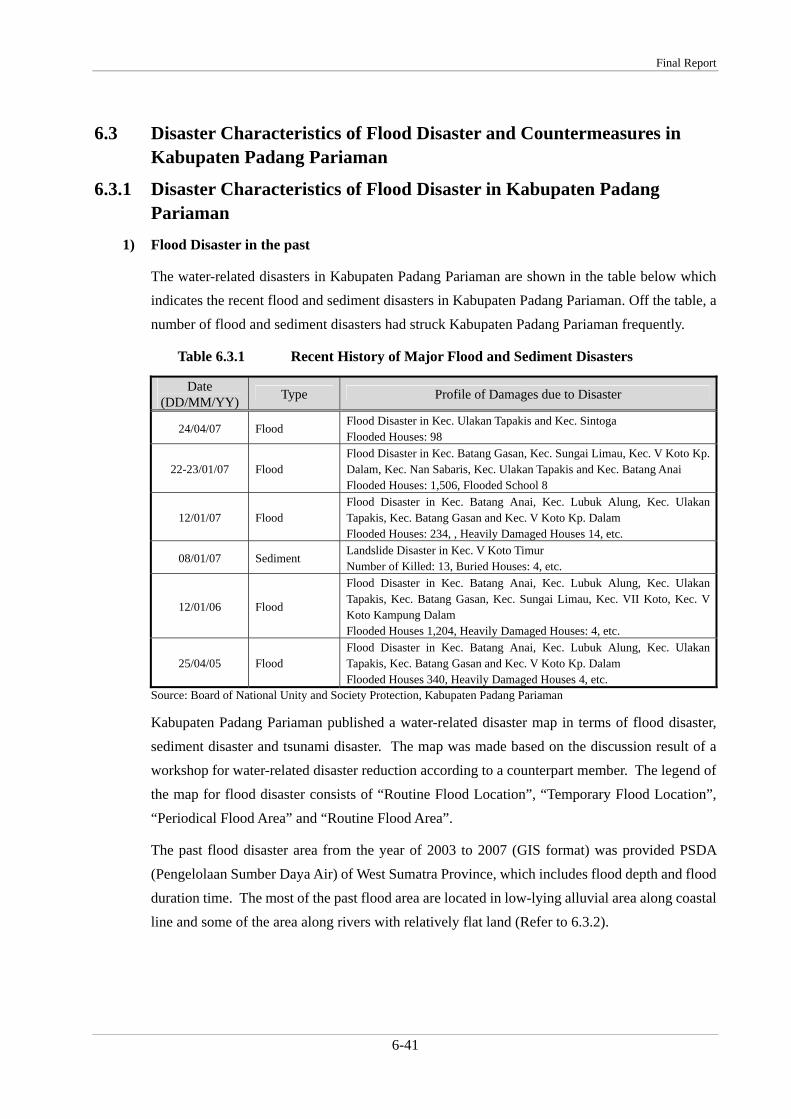
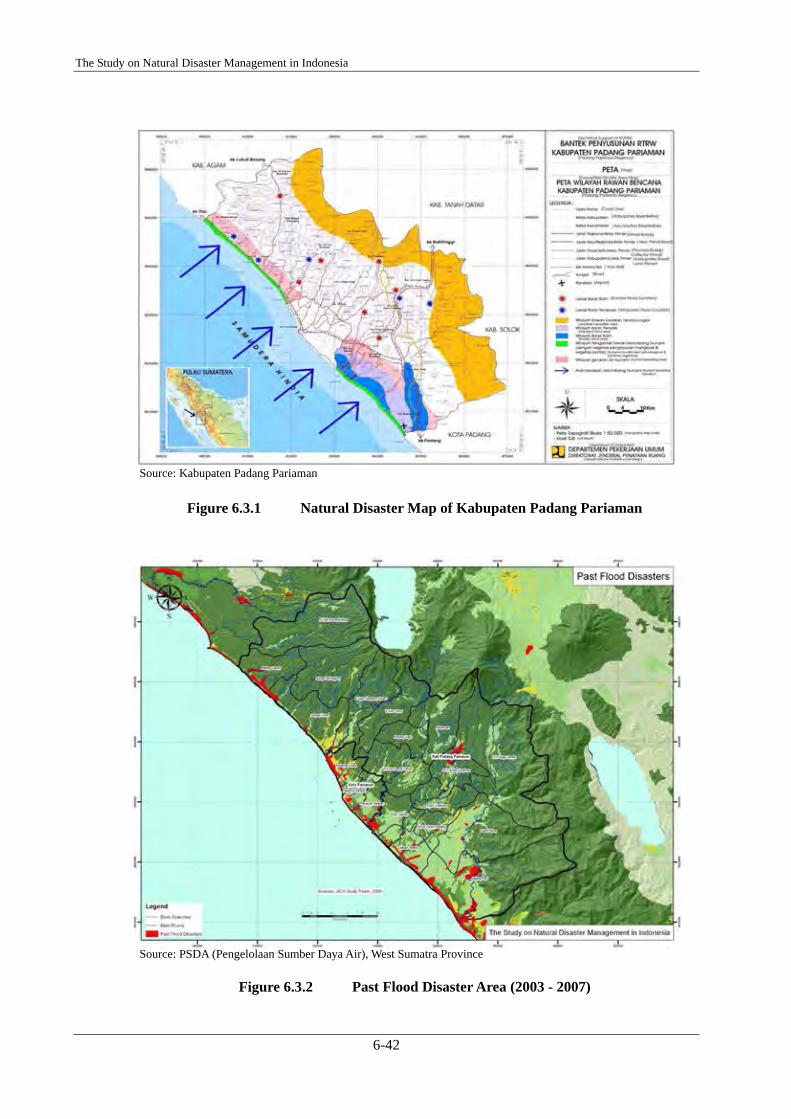
Kabupaten Padang Pariaman published a water-related disaster map in terms of flood disaster, sediment disaster and tsunami disaster. The map was made based on the discussion result of a workshop for water-related disaster reduction according to a counterpart member. The legend of the map for flood disaster consists of “Routine Flood Location”, “Temporary Flood Location”, “Periodical Flood Area” and “Routine Flood Area”.
The past flood disaster area from the year of 2003 to 2007 (GIS format) was provided PSDA (Pengelolaan Sumber Daya Air) of West Sumatra Province, which includes flood depth and flood duration time. The most of the past flood area are located in low-lying alluvial area along coastal line and some of the area along rivers with relatively flat land (Refer to 6.3.2).
The Study on Natural Disaster Management in Indonesia
6-42
Figure 6.3.1 Natural Disaster Map of Kabupaten Padang Pariaman
Figure 6.3.2 Past Flood Disaster Area (2003 - 2007)
Source: Kabupaten Padang Pariaman
Source: PSDA (Pengelolaan Sumber Daya Air), West Sumatra Province

Final Report
6-43
2) Main rivers in Kabupaten Padang Pariaman
There are more than 10 rivers in Kabupaten Padang Pariaman which are Anai river, Tapakis river, Ulakan river, Mangau river, Piaman river, Naras river, Sungai Sirah river, Limau river, Kamumuan river, Paingan river, Gasan river and Tiku river. The profiles of the rivers are shown in Table 6.3.2.
Table 6.3.2 Major Rivers Flowing through Kabupaten Padang Pariaman
Figure 6.3.3 River basins in Kabupaten Padang Pariaman
River Catchments Area Length Anai river Tapakis river Ulakan river Mangau river Piaman river Naras river Sungai Sirah river Limau river Kamumuan river Paingan river Gasan river Tiku river
684.2km2
(214.84km2)(214.84km2)
268.49km2
71.56km2
155.54km2
33.21km2
30.70km2
25.50km2
22.21km2
74.77km2
117.76km2
68.2km27.8km40.2km37.1km28.5km39.2km19.9km21.2km16.3km14.0km28.0km
-
Note: The total catchment area of Tapakis river and Ulakan river is 214.84km2. Source: Kabupaten Padang Pariaman and PSDA (Pengelolaan Sumber Daya Air) of West Sumatra Province
The Study on Natural Disaster Management in Indonesia
6-44
3) Factors for Damages due to Flood
Flood disasters are regarded to be drought down due to the following factors; 1) Climatic factor, 2) Hydro-geographical factor, 3) Socio-economic factor and 4) Countermeasure factor. It is almost impossible to control rainfall amount, which is one of the climatic factor, but the potential flood damage can be reduced by strengthening the countermeasure factor (e.g. Construction of levee, Channel improvement, Early warning system, Land use limitation, etc.), which may give some beneficially effects to the Hydro-geographical factor and the Socio-economic factor to some extent so that resilient community to flood disaster will be attained.
As for Kabupaten Padang Pariaman, a number of flood events had been observed in the alluvial low-lying area which covers most of the inland up to some 3km to 10km from coastal line in the south part as well as the northwest coastal line. Along coastal line, the river mouths tend to be blocked by sand bars, beach ridges and sand dunes which may cause flooding from main rivers, poor drainage, forming marsh and thus higher potential of flooding. Along rivers in mid-reach to upstream (Anai river, Ulakan river, Tapakis river, Mangau river and Piaman river), some flood marks on some houses could be observed, which are located within 0.5km – 1.0km from main stream and relatively flat area.
In consideration of the above, the hazard map and risk map for flood disaster in Kabupaten Padang Pariaman were made based on the data or information derived or provided from the relevant organizations.
Final Report
6-45
6.3.2 Flood Hazard Map in Kabupaten Padang Pariaman 1) Indices of Hazard Map for Flood Disaster
In this study, simplified methodologies for the creations of hazard maps and risk maps are applied for facilitating the technology transfer to the counterpart members of Kabupaten Padang Pariaman smoothly, since it is aimed at the counterpart members who are to understand the methodologies and to produce the maps based on the methods in the future. The flood hazard map for Kabupaten Padang Pariaman was created based on data and information provided from the relevant organizations of Kabupaten Padang Pariaman and Pengelolaan Sumber Daya Air (PSDA) of West Sumatra Province through the discussions between the experts of the JICA study team and the counterpart members of Kabupaten Padang Pariaman. The indices used for creations of flood hazard map are indicated in Table 6.3.3. The indices of “Flatness” and “Alluvium” were adopted as indices of flood hazard, since low-lying area or alluvium flat plain can be the area of higher potential of flood disaster. On the other hand, the recent flood area may indicate more realistic flood hazard area. Since the past flood disaster area including flood depth and flood duration for the year of 2003 to 2007 was provided PSDA (Pengelolaan Sumber Daya Air) of West Sumatra Province, “Flood Depth” and “Flood Duration” were also adopted as flood hazard indices. The basics of creation of flood hazard map are described in the sections of 1.6.1 to 1.6.3, CHAPTER 1.
Table 6.3.3 Indices used for creations of flood hazard map
Hazard Indices
1) Flatness (Slope) (HP7)
2) Alluvium (Geology) (HP8)
3) Flood Depth (HP9)
4) Flood Duration (HP10)
The Study on Natural Disaster Management in Indonesia
6-46
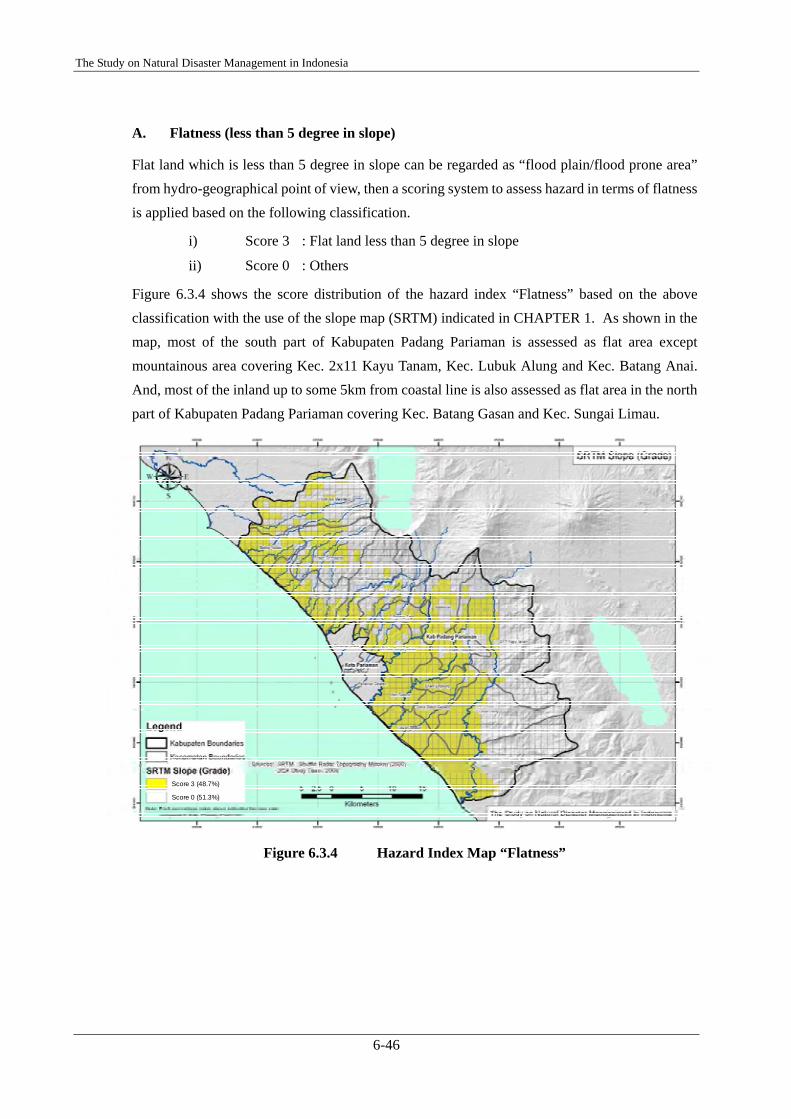
Score 3 (48.7%)
Score 0 (51.3%)
A. Flatness (less than 5 degree in slope)
Flat land which is less than 5 degree in slope can be regarded as “flood plain/flood prone area” from hydro-geographical point of view, then a scoring system to assess hazard in terms of flatness is applied based on the following classification.
i) Score 3 : Flat land less than 5 degree in slope
ii) Score 0 : Others
Figure 6.3.4 shows the score distribution of the hazard index “Flatness” based on the above classification with the use of the slope map (SRTM) indicated in CHAPTER 1. As shown in the map, most of the south part of Kabupaten Padang Pariaman is assessed as flat area except mountainous area covering Kec. 2x11 Kayu Tanam, Kec. Lubuk Alung and Kec. Batang Anai. And, most of the inland up to some 5km from coastal line is also assessed as flat area in the north part of Kabupaten Padang Pariaman covering Kec. Batang Gasan and Kec. Sungai Limau.
Figure 6.3.4 Hazard Index Map “Flatness”
Final Report
6-47
Alluvium
River
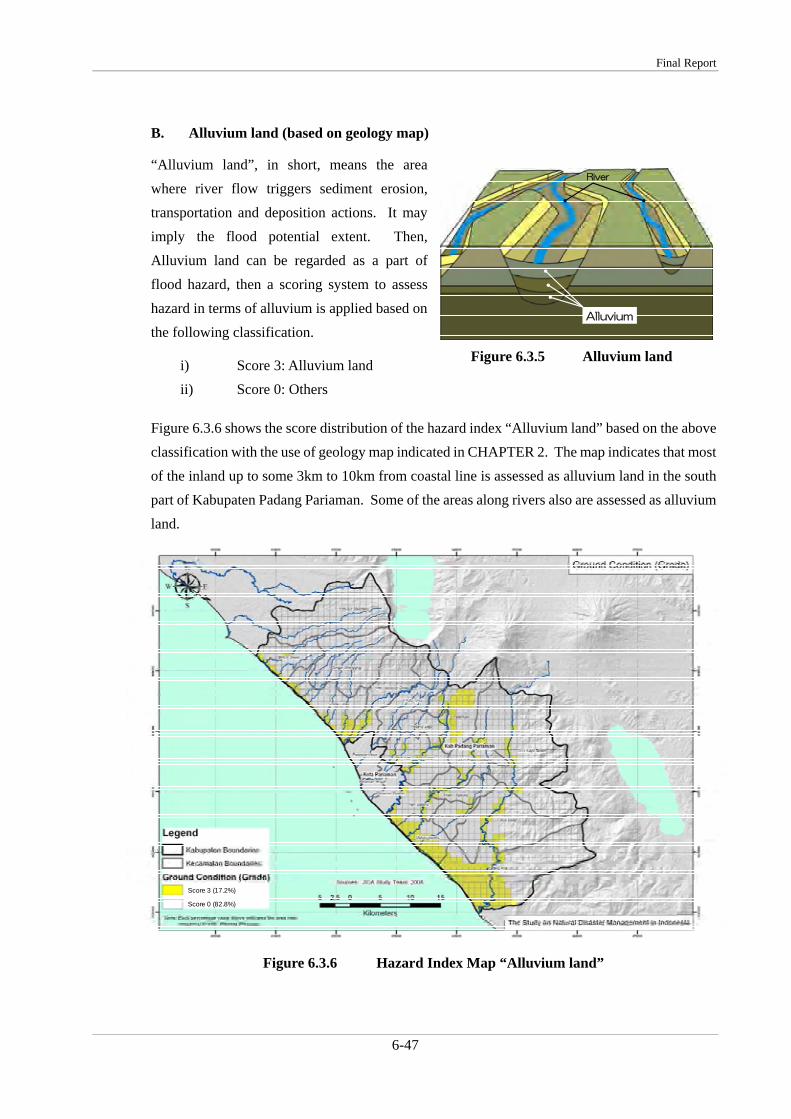
Score 3 (17.2%)
Score 0 (82.8%)
B. Alluvium land (based on geology map)
“Alluvium land”, in short, means the area where river flow triggers sediment erosion, transportation and deposition actions. It may imply the flood potential extent. Then, Alluvium land can be regarded as a part of flood hazard, then a scoring system to assess hazard in terms of alluvium is applied based on the following classification.
Figure 6.3.5 Alluvium land
Figure 6.3.6 shows the score distribution of the hazard index “Alluvium land” based on the above classification with the use of geology map indicated in CHAPTER 2. The map indicates that most of the inland up to some 3km to 10km from coastal line is assessed as alluvium land in the south part of Kabupaten Padang Pariaman. Some of the areas along rivers also are assessed as alluvium land.
Figure 6.3.6 Hazard Index Map “Alluvium land”
i) Score 3: Alluvium land ii) Score 0: Others
The Study on Natural Disaster Management in Indonesia
6-48
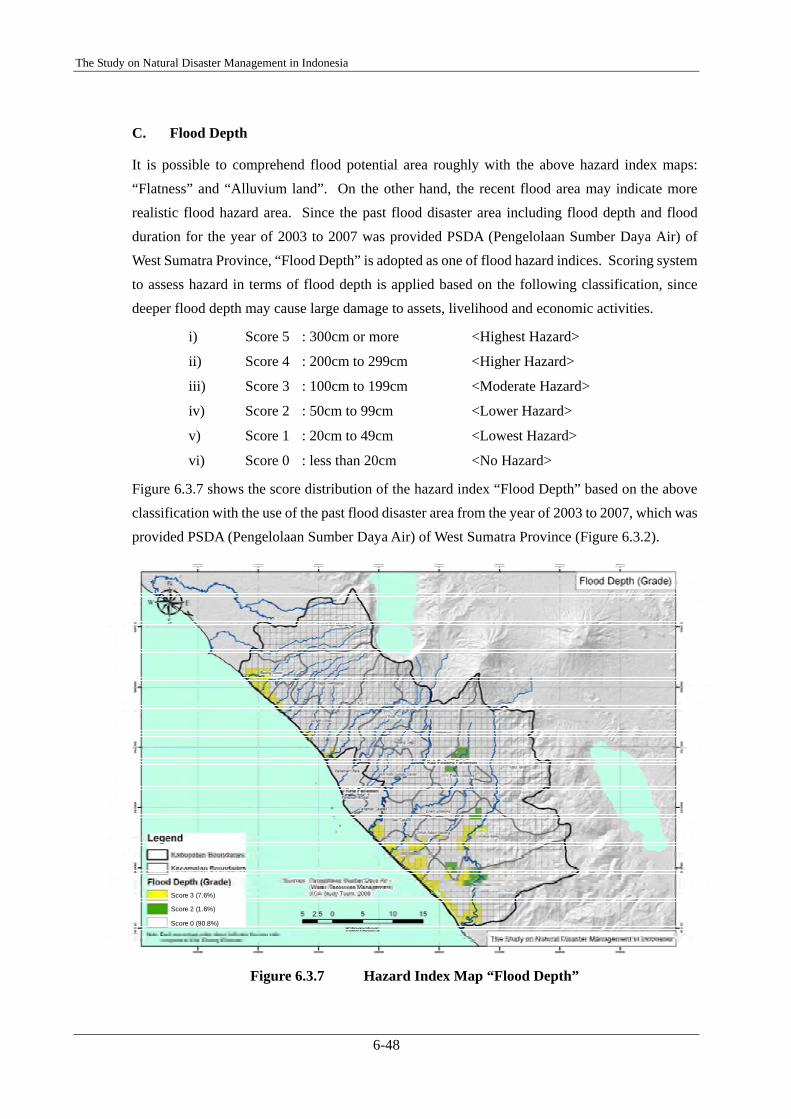
Score 3 (7.6%)
Score 0 (90.8%)
Score 2 (1.6%)
C. Flood Depth
It is possible to comprehend flood potential area roughly with the above hazard index maps: “Flatness” and “Alluvium land”. On the other hand, the recent flood area may indicate more realistic flood hazard area. Since the past flood disaster area including flood depth and flood duration for the year of 2003 to 2007 was provided PSDA (Pengelolaan Sumber Daya Air) of West Sumatra Province, “Flood Depth” is adopted as one of flood hazard indices. Scoring system to assess hazard in terms of flood depth is applied based on the following classification, since deeper flood depth may cause large damage to assets, livelihood and economic activities.
i) Score 5 : 300cm or more <Highest Hazard>
ii) Score 4 : 200cm to 299cm <Higher Hazard>
iii) Score 3 : 100cm to 199cm <Moderate Hazard>
iv) Score 2 : 50cm to 99cm <Lower Hazard>
v) Score 1 : 20cm to 49cm <Lowest Hazard>
vi) Score 0 : less than 20cm <No Hazard>
Figure 6.3.7 shows the score distribution of the hazard index “Flood Depth” based on the above classification with the use of the past flood disaster area from the year of 2003 to 2007, which was provided PSDA (Pengelolaan Sumber Daya Air) of West Sumatra Province (Figure 6.3.2).
Figure 6.3.7 Hazard Index Map “Flood Depth”

Final Report
6-49
Score 5 (1.6%)
Score 0 (90.7%)
Score 1 (7.7%)
D. Flood Duration
It is possible to comprehend flood potential area roughly with the above hazard index maps: “Flatness” and “Alluvium land”. On the other hand, the recent flood area may indicate more realistic flood hazard area. Since the past flood disaster area including flood depth and flood duration for the year of 2003 to 2007 was provided PSDA (Pengelolaan Sumber Daya Air) of West Sumatra Province, “Flood Duration” is adopted as one of flood hazard indices. Scoring system to assess hazard in terms of flood duration is applied based on the following classification, since longer flood duration may cause large damage to assets, livelihood and economic activities.
i) Score 5 : 7days or more <Highest Hazard>
ii) Score 4 : 5 to 6 days <Higher Hazard>
iii) Score 3 : 3 to 4 days <Moderate Hazard>
iv) Score 2 : 1 to 2 days <Lower Hazard>
v) Score 1 : 1 to 24 hours <Lowest Hazard>
vi) Score 0 : less than 1 hour <No Hazard>
Figure 6.3.8 shows the score distribution of the hazard index “Flood Duration” based on the above classification with the use of the past flood disaster area from the year of 2003 to 2007, which was provided PSDA of West Sumatra Province (Figure 6.3.2).
Figure 6.3.8 Hazard Index Map “Flood Duration”
The Study on Natural Disaster Management in Indonesia
6-50
Flatness(Slope)
Alluvium(Geology) Flood Depth Flood Duration
Flat area hashigher floodpotential.
Alluvium area hashigher floodpotential.
Deeper floodcause largedamage.
Longer durationcause largedamage.
5 Highest Hazard - - 300cm or more 7days or more
4 Higher Hazard - - between 200cmand 299cm
between 5to 6 days
3 Moderate Hazard ○ ○between 100cm
and 199cmbetween 3to 4 days
2 Low Hazard - - between 50cmand 99cm
between 1to 2 days
1 Lower Hazard - - between 20cmand 49cm
between 1to 24 hours
0 No Hazard None None less than 20cm less than1 hour
Hazard Index
Description
Score
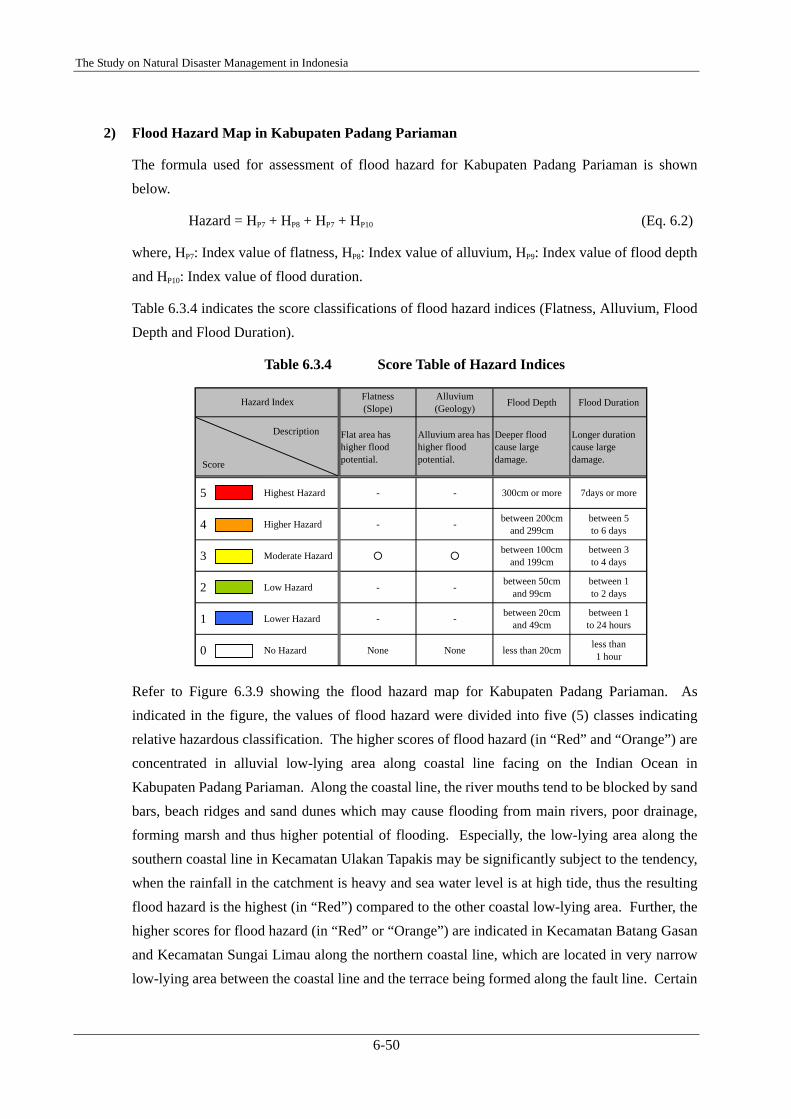
2) Flood Hazard Map in Kabupaten Padang Pariaman
The formula used for assessment of flood hazard for Kabupaten Padang Pariaman is shown below.
Hazard = HP7 + HP8 + HP7 + HP10 (Eq. 6.2)
where, HP7: Index value of flatness, HP8: Index value of alluvium, HP9: Index value of flood depth and HP10: Index value of flood duration.
Table 6.3.4 indicates the score classifications of flood hazard indices (Flatness, Alluvium, Flood Depth and Flood Duration).
Table 6.3.4 Score Table of Hazard Indices
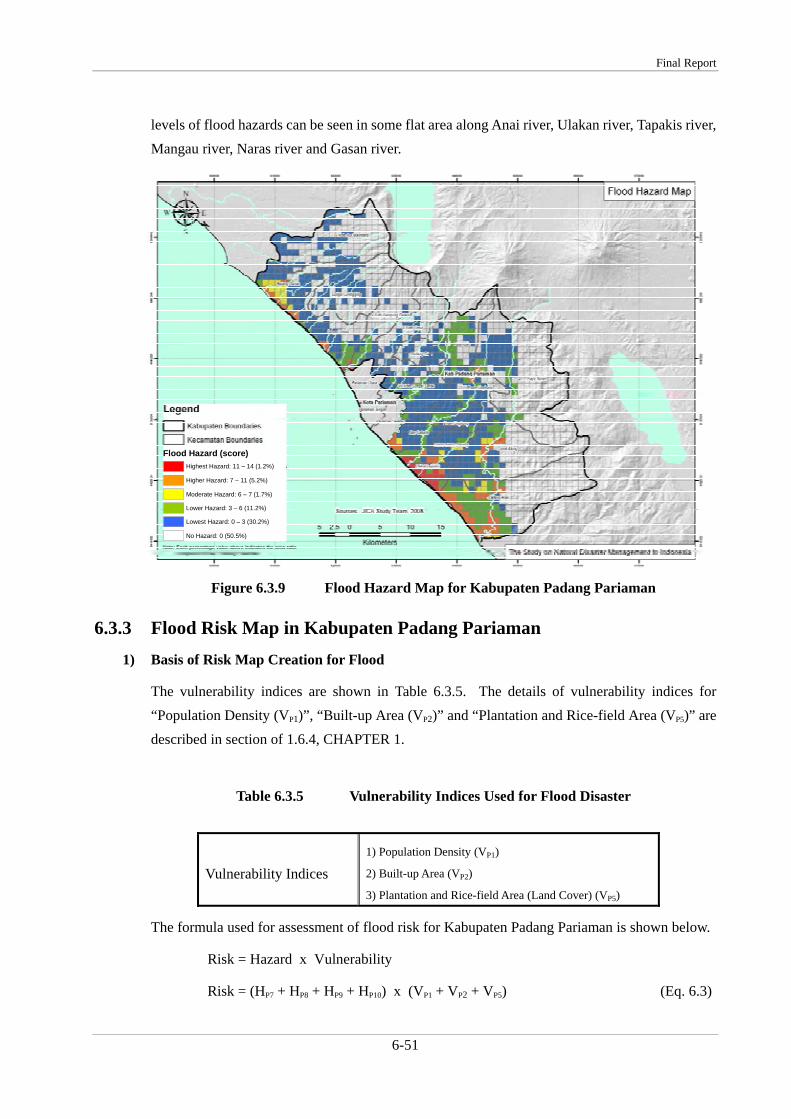
Refer to Figure 6.3.9 showing the flood hazard map for Kabupaten Padang Pariaman. As indicated in the figure, the values of flood hazard were divided into five (5) classes indicating relative hazardous classification. The higher scores of flood hazard (in “Red” and “Orange”) are concentrated in alluvial low-lying area along coastal line facing on the Indian Ocean in Kabupaten Padang Pariaman. Along the coastal line, the river mouths tend to be blocked by sand bars, beach ridges and sand dunes which may cause flooding from main rivers, poor drainage, forming marsh and thus higher potential of flooding. Especially, the low-lying area along the southern coastal line in Kecamatan Ulakan Tapakis may be significantly subject to the tendency, when the rainfall in the catchment is heavy and sea water level is at high tide, thus the resulting flood hazard is the highest (in “Red”) compared to the other coastal low-lying area. Further, the higher scores for flood hazard (in “Red” or “Orange”) are indicated in Kecamatan Batang Gasan and Kecamatan Sungai Limau along the northern coastal line, which are located in very narrow low-lying area between the coastal line and the terrace being formed along the fault line. Certain
Final Report
6-51
Flood Hazard (score)Highest Hazard: 11 – 14 (1.2%)
Higher Hazard: 7 – 11 (5.2%)
Moderate Hazard: 6 – 7 (1.7%)
Lower Hazard: 3 – 6 (11.2%)
Lowest Hazard: 0 – 3 (30.2%)
No Hazard: 0 (50.5%)
levels of flood hazards can be seen in some flat area along Anai river, Ulakan river, Tapakis river, Mangau river, Naras river and Gasan river.
Figure 6.3.9 Flood Hazard Map for Kabupaten Padang Pariaman
6.3.3 Flood Risk Map in Kabupaten Padang Pariaman 1) Basis of Risk Map Creation for Flood
The vulnerability indices are shown in Table 6.3.5. The details of vulnerability indices for “Population Density (VP1)”, “Built-up Area (VP2)” and “Plantation and Rice-field Area (VP5)” are described in section of 1.6.4, CHAPTER 1.
Table 6.3.5 Vulnerability Indices Used for Flood Disaster
Vulnerability Indices
1) Population Density (VP1)
2) Built-up Area (VP2)
3) Plantation and Rice-field Area (Land Cover) (VP5)
The formula used for assessment of flood risk for Kabupaten Padang Pariaman is shown below.
Risk = Hazard x Vulnerability
Risk = (HP7 + HP8 + HP9 + HP10) x (VP1 + VP2 + VP5) (Eq. 6.3)
The Study on Natural Disaster Management in Indonesia
6-52
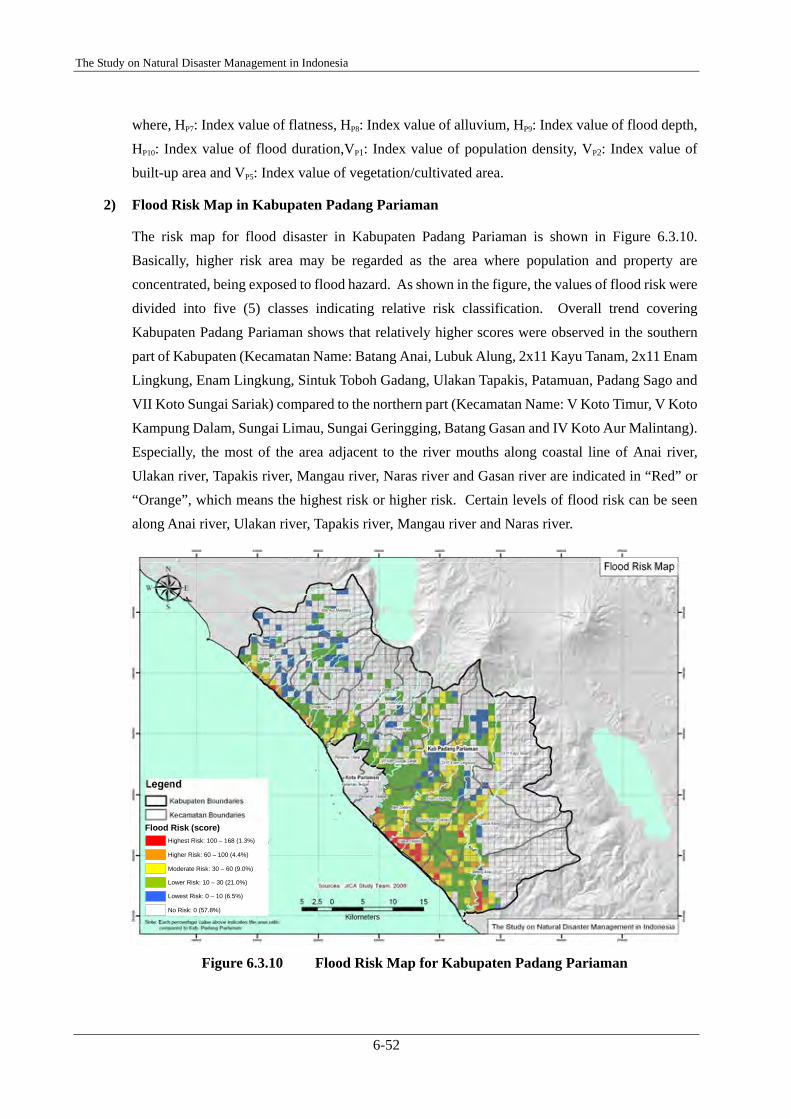
Flood Risk (score)Highest Risk: 100 – 168 (1.3%)
Higher Risk: 60 – 100 (4.4%)
Moderate Risk: 30 – 60 (9.0%)
Lower Risk: 10 – 30 (21.0%)
Lowest Risk: 0 – 10 (6.5%)
No Risk: 0 (57.8%)
where, HP7: Index value of flatness, HP8: Index value of alluvium, HP9: Index value of flood depth, HP10: Index value of flood duration,VP1: Index value of population density, VP2: Index value of built-up area and VP5: Index value of vegetation/cultivated area.
2) Flood Risk Map in Kabupaten Padang Pariaman
The risk map for flood disaster in Kabupaten Padang Pariaman is shown in Figure 6.3.10. Basically, higher risk area may be regarded as the area where population and property are concentrated, being exposed to flood hazard. As shown in the figure, the values of flood risk were divided into five (5) classes indicating relative risk classification. Overall trend covering Kabupaten Padang Pariaman shows that relatively higher scores were observed in the southern part of Kabupaten (Kecamatan Name: Batang Anai, Lubuk Alung, 2x11 Kayu Tanam, 2x11 Enam Lingkung, Enam Lingkung, Sintuk Toboh Gadang, Ulakan Tapakis, Patamuan, Padang Sago and VII Koto Sungai Sariak) compared to the northern part (Kecamatan Name: V Koto Timur, V Koto Kampung Dalam, Sungai Limau, Sungai Geringging, Batang Gasan and IV Koto Aur Malintang). Especially, the most of the area adjacent to the river mouths along coastal line of Anai river, Ulakan river, Tapakis river, Mangau river, Naras river and Gasan river are indicated in “Red” or “Orange”, which means the highest risk or higher risk. Certain levels of flood risk can be seen along Anai river, Ulakan river, Tapakis river, Mangau river and Naras river.
Figure 6.3.10 Flood Risk Map for Kabupaten Padang Pariaman
Final Report
6-53
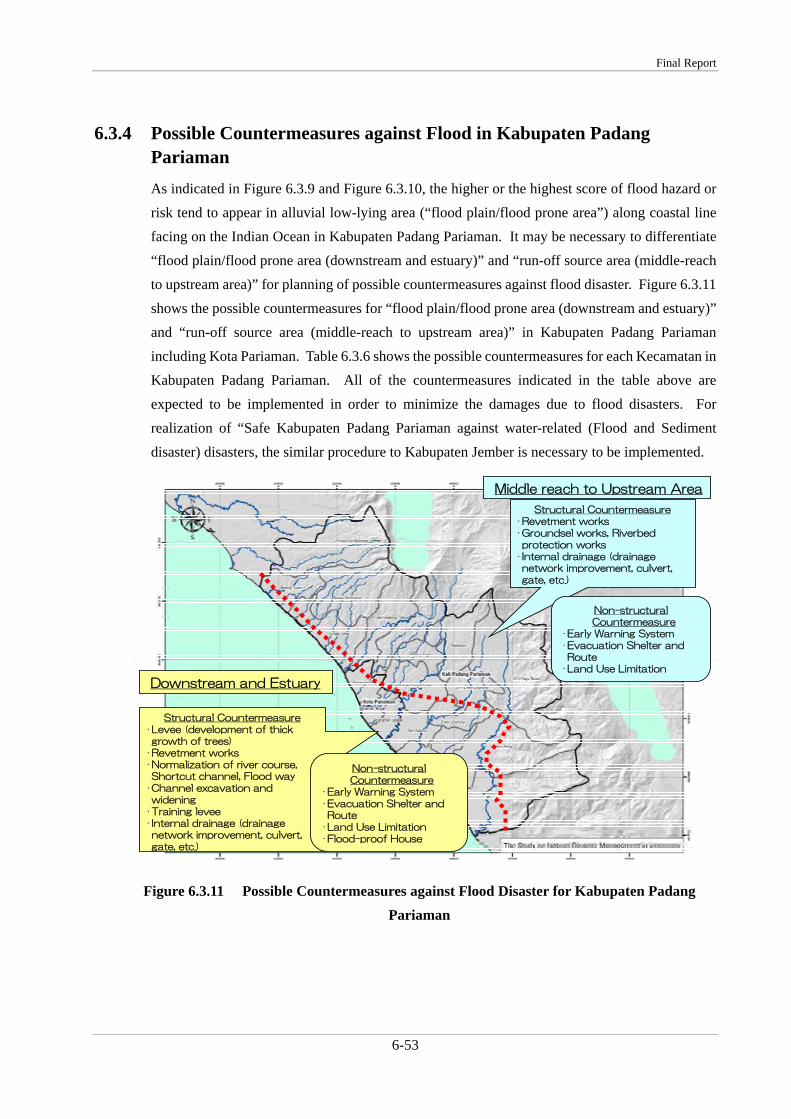
Structural Countermeasure•Levee (development of thick growth of trees)
•Revetment works•Normalization of river course, Shortcut channel, Flood way
•Channel excavation and widening
•Training levee• Internal drainage (drainage network improvement, culvert, gate, etc.)
Non-structural Countermeasure
•Early Warning System•Evacuation Shelter and Route
•Land Use Limitation•Flood-proof House
Structural Countermeasure•Revetment works•Groundsel works, Riverbed protection works
• Internal drainage (drainage network improvement, culvert, gate, etc.)
Non-structural Countermeasure
•Early Warning System•Evacuation Shelter and Route
•Land Use Limitation
Downstream and Estuary
Middle reach to Upstream Area
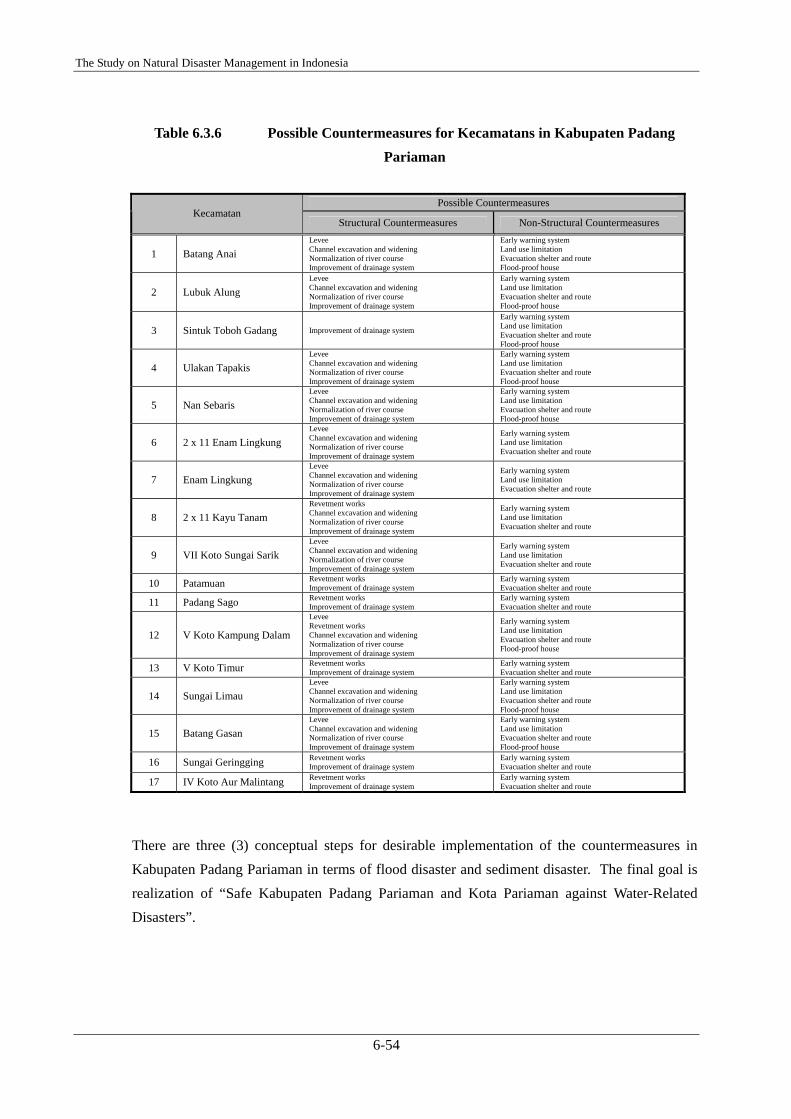
6.3.4 Possible Countermeasures against Flood in Kabupaten Padang Pariaman As indicated in Figure 6.3.9 and Figure 6.3.10, the higher or the highest score of flood hazard or risk tend to appear in alluvial low-lying area (“flood plain/flood prone area”) along coastal line facing on the Indian Ocean in Kabupaten Padang Pariaman. It may be necessary to differentiate “flood plain/flood prone area (downstream and estuary)” and “run-off source area (middle-reach to upstream area)” for planning of possible countermeasures against flood disaster. Figure 6.3.11 shows the possible countermeasures for “flood plain/flood prone area (downstream and estuary)” and “run-off source area (middle-reach to upstream area)” in Kabupaten Padang Pariaman including Kota Pariaman. Table 6.3.6 shows the possible countermeasures for each Kecamatan in Kabupaten Padang Pariaman. All of the countermeasures indicated in the table above are expected to be implemented in order to minimize the damages due to flood disasters. For realization of “Safe Kabupaten Padang Pariaman against water-related (Flood and Sediment disaster) disasters, the similar procedure to Kabupaten Jember is necessary to be implemented.
Figure 6.3.11 Possible Countermeasures against Flood Disaster for Kabupaten Padang Pariaman
The Study on Natural Disaster Management in Indonesia
6-54
Table 6.3.6 Possible Countermeasures for Kecamatans in Kabupaten Padang Pariaman
Possible Countermeasures
Kecamatan Structural Countermeasures Non-Structural Countermeasures
1 Batang Anai Levee Channel excavation and widening Normalization of river course Improvement of drainage system
Early warning system Land use limitation Evacuation shelter and route Flood-proof house
2 Lubuk Alung Levee Channel excavation and widening Normalization of river course Improvement of drainage system
Early warning system Land use limitation Evacuation shelter and route Flood-proof house
3 Sintuk Toboh Gadang Improvement of drainage system
Early warning system Land use limitation Evacuation shelter and route Flood-proof house
4 Ulakan Tapakis Levee Channel excavation and widening Normalization of river course Improvement of drainage system
Early warning system Land use limitation Evacuation shelter and route Flood-proof house
5 Nan Sebaris Levee Channel excavation and widening Normalization of river course Improvement of drainage system
Early warning system Land use limitation Evacuation shelter and route Flood-proof house
6 2 x 11 Enam Lingkung Levee Channel excavation and widening Normalization of river course Improvement of drainage system
Early warning system Land use limitation Evacuation shelter and route
7 Enam Lingkung Levee Channel excavation and widening Normalization of river course Improvement of drainage system
Early warning system Land use limitation Evacuation shelter and route
8 2 x 11 Kayu Tanam Revetment works Channel excavation and widening Normalization of river course Improvement of drainage system
Early warning system Land use limitation Evacuation shelter and route
9 VII Koto Sungai Sarik Levee Channel excavation and widening Normalization of river course Improvement of drainage system
Early warning system Land use limitation Evacuation shelter and route
10 Patamuan Revetment works Improvement of drainage system
Early warning system Evacuation shelter and route
11 Padang Sago Revetment works Improvement of drainage system
Early warning system Evacuation shelter and route
12 V Koto Kampung Dalam
Levee Revetment works Channel excavation and widening Normalization of river course Improvement of drainage system
Early warning system Land use limitation Evacuation shelter and route Flood-proof house
13 V Koto Timur Revetment works Improvement of drainage system
Early warning system Evacuation shelter and route
14 Sungai Limau Levee Channel excavation and widening Normalization of river course Improvement of drainage system
Early warning system Land use limitation Evacuation shelter and route Flood-proof house
15 Batang Gasan Levee Channel excavation and widening Normalization of river course Improvement of drainage system
Early warning system Land use limitation Evacuation shelter and route Flood-proof house
16 Sungai Geringging Revetment works Improvement of drainage system
Early warning system Evacuation shelter and route
17 IV Koto Aur Malintang Revetment works Improvement of drainage system
Early warning system Evacuation shelter and route
There are three (3) conceptual steps for desirable implementation of the countermeasures in Kabupaten Padang Pariaman in terms of flood disaster and sediment disaster. The final goal is realization of “Safe Kabupaten Padang Pariaman and Kota Pariaman against Water-Related Disasters”.
Final Report
6-55
A. Step 1: Preparation for comprehensive planning
The step 1 is mainly aimed for the preparation activities for comprehensive planning including countermeasure and capacity building. The step 1 consists of the following sub-steps:
1. Establish and improvement of the system for disaster data collection and storage,
2. Analysis based on the storage data,
3. Revision and improvement of regional disaster management plan,
4. More appropriate and prompt emergency activity such as early warning, rescue, evacuation, etc.,
5. Comprehensive plan for non-structural countermeasures and improvement/strengthening of existing countermeasures, and
6. Plan for capacity building in terms of human resources, organization framework, institution, etc.
B. Step 2: Implementation especially for non-structural countermeasures
In the step 2, the non-structural countermeasures mainly are implemented as well as capacity building especially for flood control engineering and sabo engineering in cooperated with STC (Sabo Technical Center) in Jog Jakarta for instance, academic institution and international cooperation organization. The step 2 is composed of the following sub-steps:
7. Implementation of non-structural countermeasure as well as the structural countermeasures with minimum budget,
8. Capacity building especially for flood control engineering and sabo engineering, and
9. Technical assistance from STC (Sabo Technical Center), academic institution and international cooperation organization.
C. Step 3: Formulation of master plan (M/P) and implementation of countermeasures with structural and non structural countermeasures
The final step 3 is for formulation of master plan (M/P) and implementation of countermeasures with structural and non structural countermeasures. The step 3 consists of the following sub-steps:
10. Formulation of master plan (M/P) or feasibility study (F/S) for disaster reduction in terms of sediment disaster and flood disaster, and
11. Implementation of structural countermeasure in cooperated with non-structural countermeasure.
The Study on Natural Disaster Management in Indonesia
6-56
Steps for Realization of ”Safe Kabupaten Padang Pariaman and Kota Pariaman against Water-Related Disasters”
1. Establish and improvement of the system for disaster data collection and storage
2. Analysis based on the storage data
3. Revision and improvement of regional disaster management plan (Note: Revision and improvement in Steps 2 and 3, when necessary)
4. More appropriate and prompt emergency activity such as early warning, rescue, evacuation, etc.
5. Comprehensive plan for non-structural countermeasures and improvement/strengthening of existing countermeasures
6. Plan for capacity building in terms of human resources, organization framework, institution, etc.
7. Implementation of non-structural countermeasure as well as the structural countermeasures with minimum budget
8. Capacity building especially for flood control engineering and sabo engineering
12. Realization of “Safe Kabupaten Padang Pariaman and Kota Pariaman against Water-Related Disasters”
12. Realization of “Safe Kabupaten Padang Pariaman and Kota Pariaman against Water-Related Disasters”
Step 1 Step 2
Step 3
9. Technical assistance from STC (Sabo Technical Center), academic institution and international cooperation organization
10. Formulation of master plan (M/P) or feasibility study (F/S) for disaster reduction in terms of sediment disaster and flood disaster
11. Implementation of structural countermeasure in cooperated with non-structural countermeasure
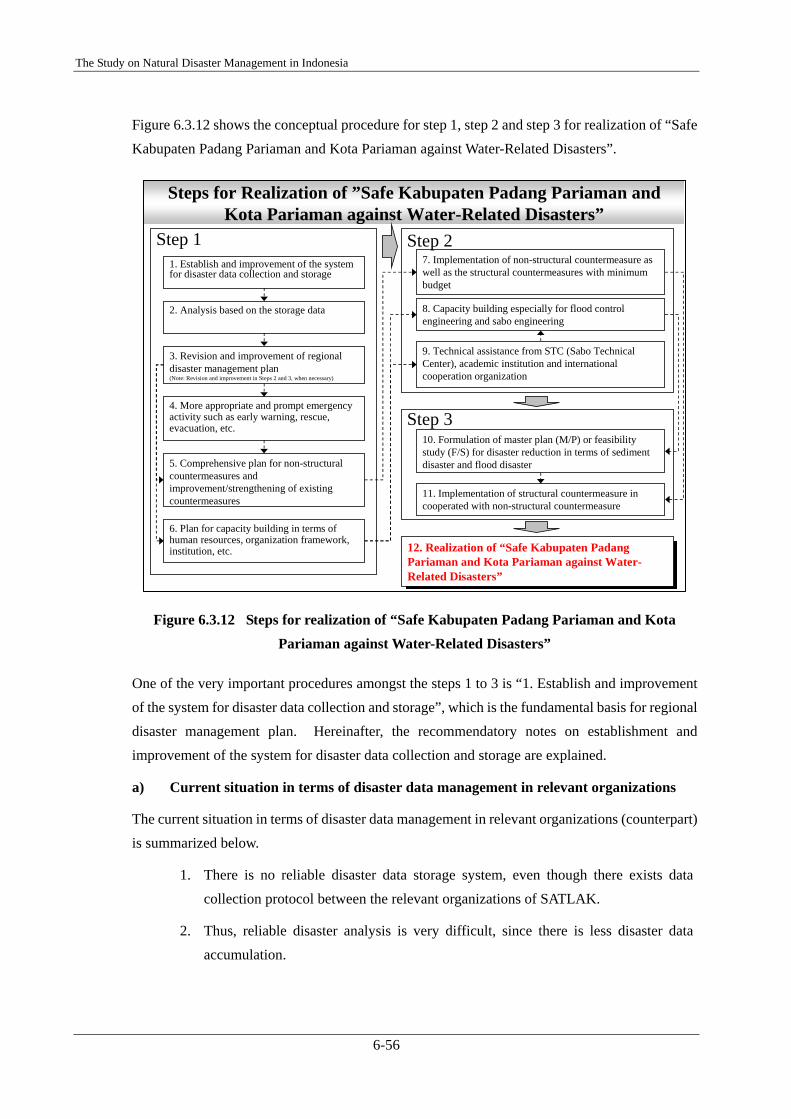
Figure 6.3.12 shows the conceptual procedure for step 1, step 2 and step 3 for realization of “Safe Kabupaten Padang Pariaman and Kota Pariaman against Water-Related Disasters”.
Figure 6.3.12 Steps for realization of “Safe Kabupaten Padang Pariaman and Kota Pariaman against Water-Related Disasters”
One of the very important procedures amongst the steps 1 to 3 is “1. Establish and improvement of the system for disaster data collection and storage”, which is the fundamental basis for regional disaster management plan. Hereinafter, the recommendatory notes on establishment and improvement of the system for disaster data collection and storage are explained.
a) Current situation in terms of disaster data management in relevant organizations
The current situation in terms of disaster data management in relevant organizations (counterpart) is summarized below.
1. There is no reliable disaster data storage system, even though there exists data collection protocol between the relevant organizations of SATLAK.
2. Thus, reliable disaster analysis is very difficult, since there is less disaster data accumulation.
Final Report
6-57
3. The knowledge, which is supposed to be based on the analysis, can not be reflected into regional disaster management plan.
b) Establishment and improvement of the system for disaster data collection and storage
It is recommended that the system for disaster data collection and storage should be established and improved so that the reliable disaster data can be accumulated for the disaster analysis, which can be reflected into regional disaster management plan.
1. Establishment and improvement of the system for disaster data collection and storage
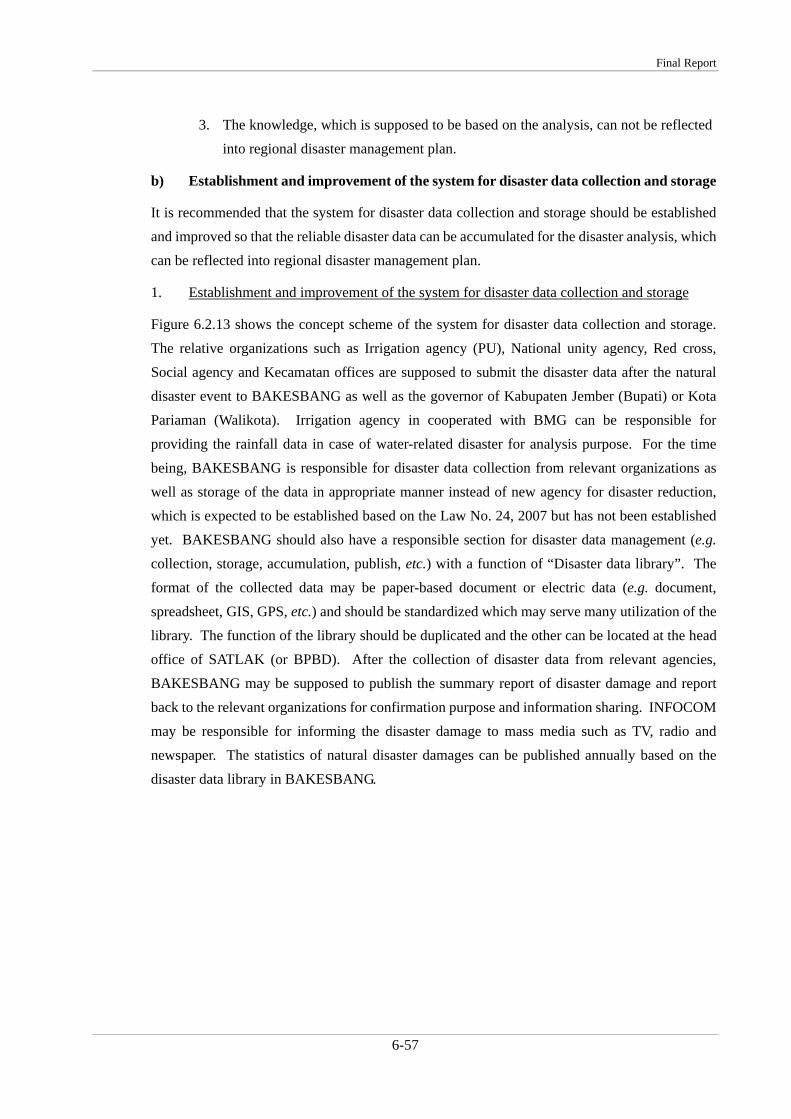
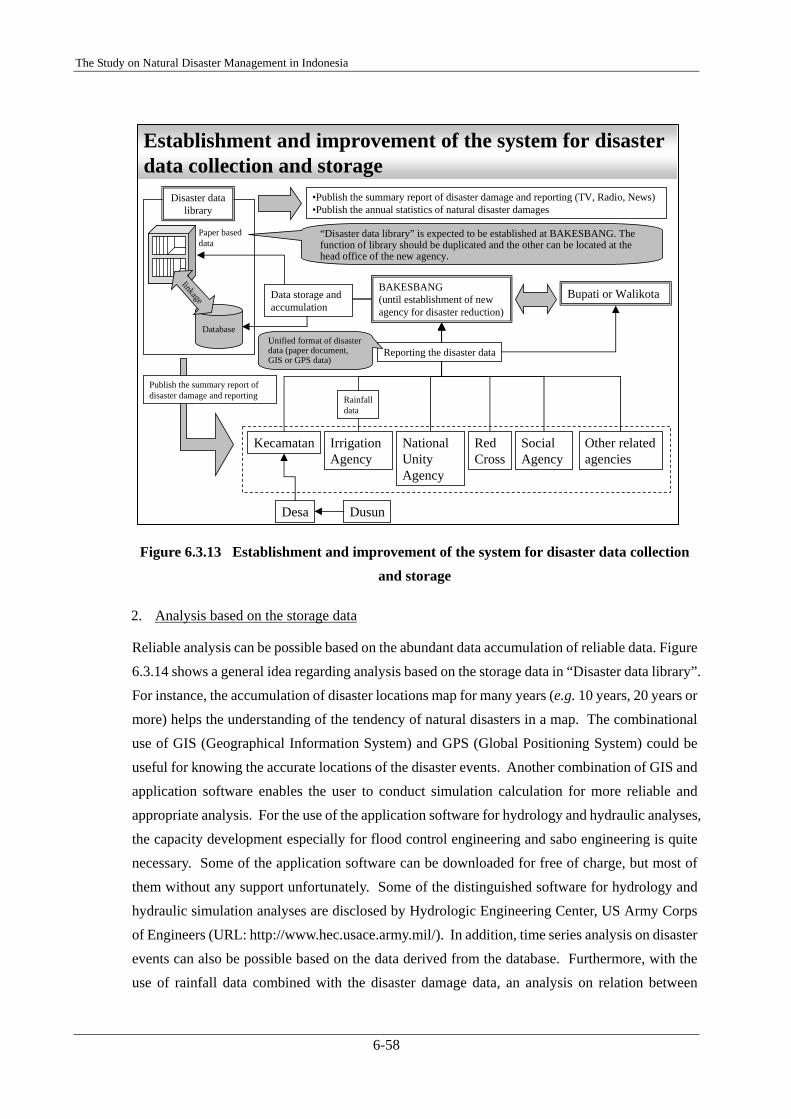
Figure 6.2.13 shows the concept scheme of the system for disaster data collection and storage. The relative organizations such as Irrigation agency (PU), National unity agency, Red cross, Social agency and Kecamatan offices are supposed to submit the disaster data after the natural disaster event to BAKESBANG as well as the governor of Kabupaten Jember (Bupati) or Kota Pariaman (Walikota). Irrigation agency in cooperated with BMG can be responsible for providing the rainfall data in case of water-related disaster for analysis purpose. For the time being, BAKESBANG is responsible for disaster data collection from relevant organizations as well as storage of the data in appropriate manner instead of new agency for disaster reduction, which is expected to be established based on the Law No. 24, 2007 but has not been established yet. BAKESBANG should also have a responsible section for disaster data management (e.g. collection, storage, accumulation, publish, etc.) with a function of “Disaster data library”. The format of the collected data may be paper-based document or electric data (e.g. document, spreadsheet, GIS, GPS, etc.) and should be standardized which may serve many utilization of the library. The function of the library should be duplicated and the other can be located at the head office of SATLAK (or BPBD). After the collection of disaster data from relevant agencies, BAKESBANG may be supposed to publish the summary report of disaster damage and report back to the relevant organizations for confirmation purpose and information sharing. INFOCOM may be responsible for informing the disaster damage to mass media such as TV, radio and newspaper. The statistics of natural disaster damages can be published annually based on the disaster data library in BAKESBANG.
The Study on Natural Disaster Management in Indonesia
6-58
Establishment and improvement of the system for disaster data collection and storage
BAKESBANG(until establishment of new agency for disaster reduction)
Kecamatan Irrigation Agency
National Unity Agency
Social Agency
Red Cross
Other related agencies
Desa Dusun
Reporting the disaster dataUnified format of disaster data (paper document, GIS or GPS data)
Database
Disaster data library
Publish the summary report of disaster damage and reporting
•Publish the summary report of disaster damage and reporting (TV, Radio, News)•Publish the annual statistics of natural disaster damages
linkage Data storage and accumulation
Paper based data
Rainfalldata
“Disaster data library” is expected to be established at BAKESBANG. The function of library should be duplicated and the other can be located at the head office of the new agency.
Bupati or Walikota
Figure 6.3.13 Establishment and improvement of the system for disaster data collection and storage
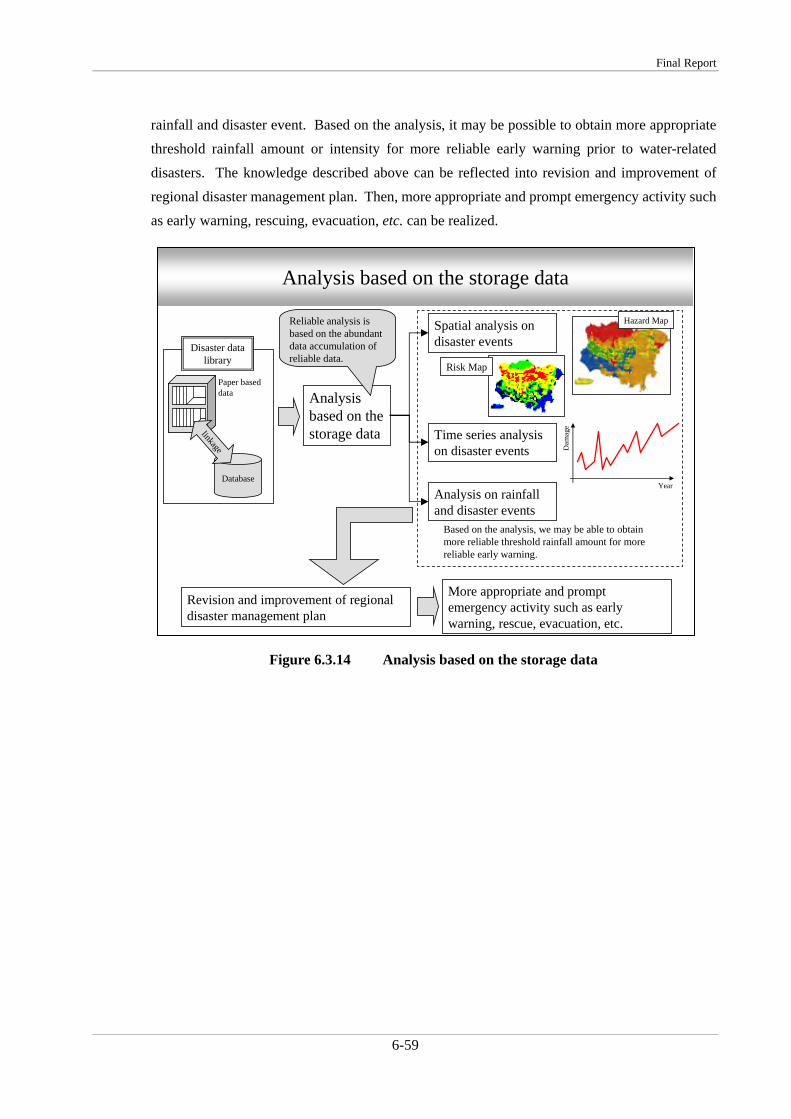
2. Analysis based on the storage data
Reliable analysis can be possible based on the abundant data accumulation of reliable data. Figure 6.3.14 shows a general idea regarding analysis based on the storage data in “Disaster data library”. For instance, the accumulation of disaster locations map for many years (e.g. 10 years, 20 years or more) helps the understanding of the tendency of natural disasters in a map. The combinational use of GIS (Geographical Information System) and GPS (Global Positioning System) could be useful for knowing the accurate locations of the disaster events. Another combination of GIS and application software enables the user to conduct simulation calculation for more reliable and appropriate analysis. For the use of the application software for hydrology and hydraulic analyses, the capacity development especially for flood control engineering and sabo engineering is quite necessary. Some of the application software can be downloaded for free of charge, but most of them without any support unfortunately. Some of the distinguished software for hydrology and hydraulic simulation analyses are disclosed by Hydrologic Engineering Center, US Army Corps of Engineers (URL: http://www.hec.usace.army.mil/). In addition, time series analysis on disaster events can also be possible based on the data derived from the database. Furthermore, with the use of rainfall data combined with the disaster damage data, an analysis on relation between
Final Report
6-59
Analysis based on the storage data
Database
Disaster data library
linkage
Paper based data Analysis
based on the storage data
Reliable analysis is based on the abundant data accumulation of reliable data.
Spatial analysis on disaster events
Analysis on rainfall and disaster events
Based on the analysis, we may be able to obtain more reliable threshold rainfall amount for more reliable early warning.
Revision and improvement of regional disaster management plan
More appropriate and prompt emergency activity such as early warning, rescue, evacuation, etc.
Hazard Map
Risk Map
Time series analysis on disaster events D
amag
e
Year
rainfall and disaster event. Based on the analysis, it may be possible to obtain more appropriate threshold rainfall amount or intensity for more reliable early warning prior to water-related disasters. The knowledge described above can be reflected into revision and improvement of regional disaster management plan. Then, more appropriate and prompt emergency activity such as early warning, rescuing, evacuation, etc. can be realized.
Figure 6.3.14 Analysis based on the storage data
The Study on Natural Disaster Management in Indonesia
6-60
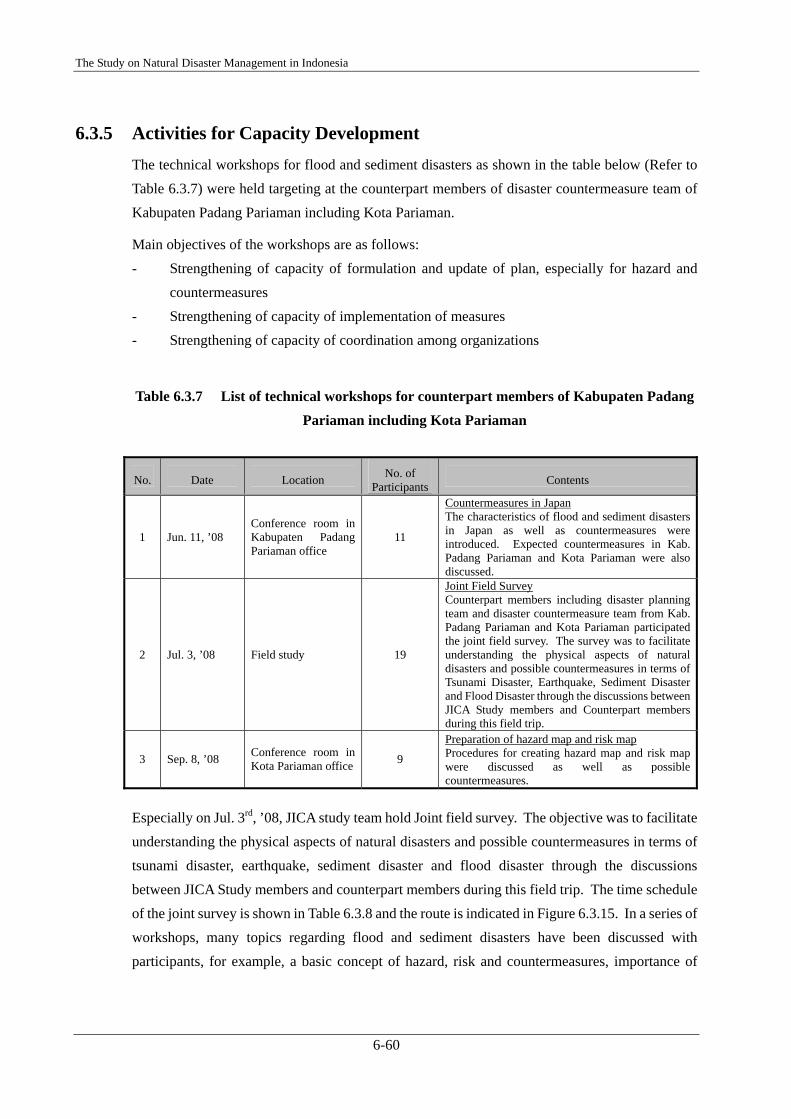
6.3.5 Activities for Capacity Development The technical workshops for flood and sediment disasters as shown in the table below (Refer to Table 6.3.7) were held targeting at the counterpart members of disaster countermeasure team of Kabupaten Padang Pariaman including Kota Pariaman.
Main objectives of the workshops are as follows: - Strengthening of capacity of formulation and update of plan, especially for hazard and
countermeasures - Strengthening of capacity of implementation of measures - Strengthening of capacity of coordination among organizations
Table 6.3.7 List of technical workshops for counterpart members of Kabupaten Padang Pariaman including Kota Pariaman
No. Date Location No. of Participants Contents
1 Jun. 11, ’08 Conference room in Kabupaten Padang Pariaman office
11
Countermeasures in Japan The characteristics of flood and sediment disasters in Japan as well as countermeasures were introduced. Expected countermeasures in Kab. Padang Pariaman and Kota Pariaman were also discussed.
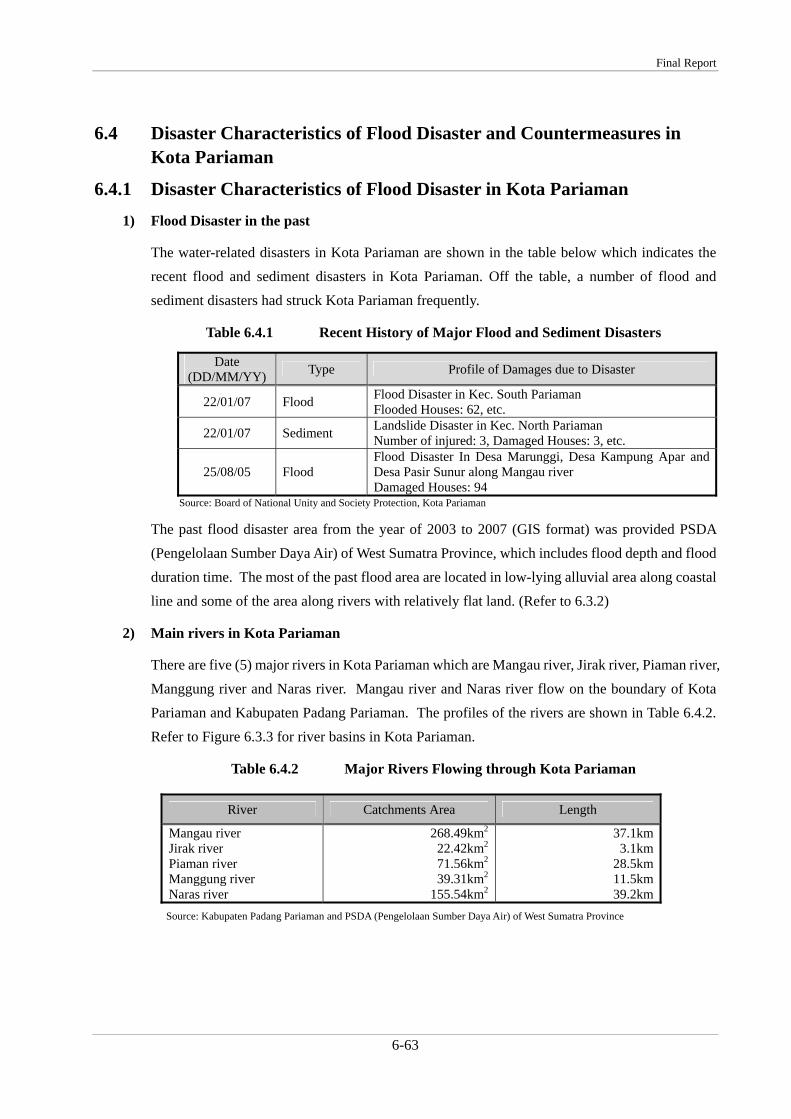
2 Jul. 3, ’08 Field study 19
Joint Field Survey Counterpart members including disaster planning team and disaster countermeasure team from Kab. Padang Pariaman and Kota Pariaman participated the joint field survey. The survey was to facilitate understanding the physical aspects of natural disasters and possible countermeasures in terms of Tsunami Disaster, Earthquake, Sediment Disaster and Flood Disaster through the discussions between JICA Study members and Counterpart members during this field trip.
3 Sep. 8, ’08 Conference room in Kota Pariaman office 9
Preparation of hazard map and risk map Procedures for creating hazard map and risk map were discussed as well as possible countermeasures.
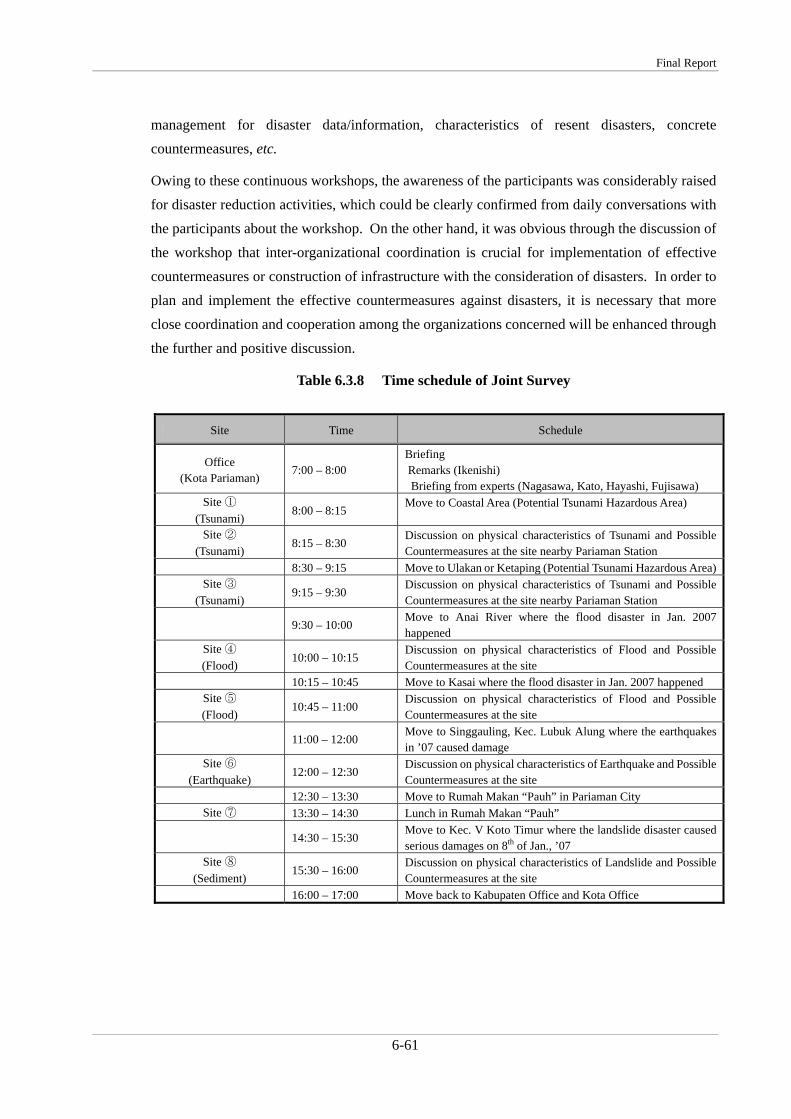
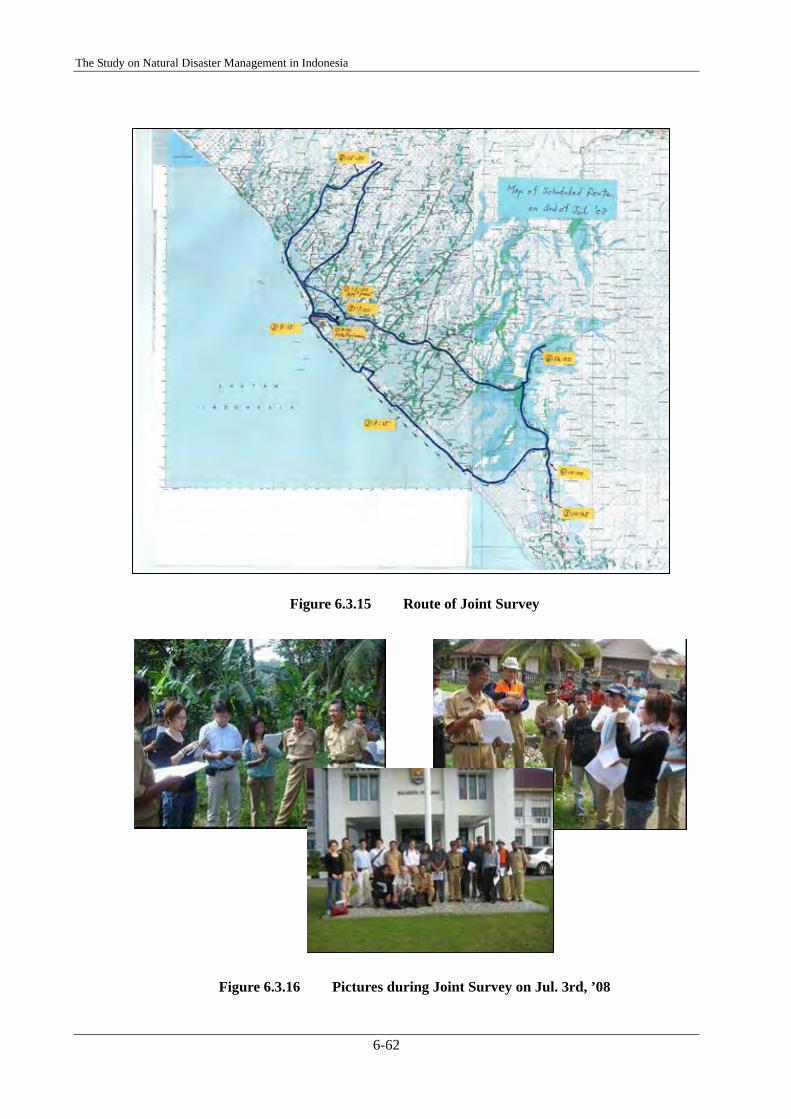
Especially on Jul. 3rd, ’08, JICA study team hold Joint field survey. The objective was to facilitate understanding the physical aspects of natural disasters and possible countermeasures in terms of tsunami disaster, earthquake, sediment disaster and flood disaster through the discussions between JICA Study members and counterpart members during this field trip. The time schedule of the joint survey is shown in Table 6.3.8 and the route is indicated in Figure 6.3.15. In a series of workshops, many topics regarding flood and sediment disasters have been discussed with participants, for example, a basic concept of hazard, risk and countermeasures, importance of
Final Report
6-61
management for disaster data/information, characteristics of resent disasters, concrete countermeasures, etc.
Owing to these continuous workshops, the awareness of the participants was considerably raised for disaster reduction activities, which could be clearly confirmed from daily conversations with the participants about the workshop. On the other hand, it was obvious through the discussion of the workshop that inter-organizational coordination is crucial for implementation of effective countermeasures or construction of infrastructure with the consideration of disasters. In order to plan and implement the effective countermeasures against disasters, it is necessary that more close coordination and cooperation among the organizations concerned will be enhanced through the further and positive discussion.
Table 6.3.8 Time schedule of Joint Survey
Site Time Schedule
Office (Kota Pariaman)
7:00 – 8:00 Briefing Remarks (Ikenishi) Briefing from experts (Nagasawa, Kato, Hayashi, Fujisawa)
Site ① (Tsunami)
8:00 – 8:15 Move to Coastal Area (Potential Tsunami Hazardous Area)
Site ② (Tsunami)
8:15 – 8:30 Discussion on physical characteristics of Tsunami and Possible Countermeasures at the site nearby Pariaman Station
8:30 – 9:15 Move to Ulakan or Ketaping (Potential Tsunami Hazardous Area)Site ③
(Tsunami) 9:15 – 9:30
Discussion on physical characteristics of Tsunami and Possible Countermeasures at the site nearby Pariaman Station
9:30 – 10:00 Move to Anai River where the flood disaster in Jan. 2007 happened
Site ④ (Flood)
10:00 – 10:15 Discussion on physical characteristics of Flood and Possible Countermeasures at the site
10:15 – 10:45 Move to Kasai where the flood disaster in Jan. 2007 happened Site ⑤ (Flood)
10:45 – 11:00 Discussion on physical characteristics of Flood and Possible Countermeasures at the site
11:00 – 12:00 Move to Singgauling, Kec. Lubuk Alung where the earthquakes in ’07 caused damage
Site ⑥ (Earthquake)
12:00 – 12:30 Discussion on physical characteristics of Earthquake and Possible Countermeasures at the site
12:30 – 13:30 Move to Rumah Makan “Pauh” in Pariaman City Site ⑦ 13:30 – 14:30 Lunch in Rumah Makan “Pauh”
14:30 – 15:30 Move to Kec. V Koto Timur where the landslide disaster caused serious damages on 8th of Jan., ’07
Site ⑧ (Sediment)
15:30 – 16:00 Discussion on physical characteristics of Landslide and Possible Countermeasures at the site
16:00 – 17:00 Move back to Kabupaten Office and Kota Office
The Study on Natural Disaster Management in Indonesia
6-62
Figure 6.3.15 Route of Joint Survey
Figure 6.3.16 Pictures during Joint Survey on Jul. 3rd, ’08
Final Report
6-63
6.4 Disaster Characteristics of Flood Disaster and Countermeasures in Kota Pariaman
6.4.1 Disaster Characteristics of Flood Disaster in Kota Pariaman 1) Flood Disaster in the past
The water-related disasters in Kota Pariaman are shown in the table below which indicates the recent flood and sediment disasters in Kota Pariaman. Off the table, a number of flood and sediment disasters had struck Kota Pariaman frequently.
Table 6.4.1 Recent History of Major Flood and Sediment Disasters
Date (DD/MM/YY) Type Profile of Damages due to Disaster
22/01/07 Flood Flood Disaster in Kec. South Pariaman Flooded Houses: 62, etc.
22/01/07 Sediment Landslide Disaster in Kec. North Pariaman Number of injured: 3, Damaged Houses: 3, etc.
25/08/05 Flood Flood Disaster In Desa Marunggi, Desa Kampung Apar and Desa Pasir Sunur along Mangau river Damaged Houses: 94
Source: Board of National Unity and Society Protection, Kota Pariaman
The past flood disaster area from the year of 2003 to 2007 (GIS format) was provided PSDA (Pengelolaan Sumber Daya Air) of West Sumatra Province, which includes flood depth and flood duration time. The most of the past flood area are located in low-lying alluvial area along coastal line and some of the area along rivers with relatively flat land. (Refer to 6.3.2)
2) Main rivers in Kota Pariaman
There are five (5) major rivers in Kota Pariaman which are Mangau river, Jirak river, Piaman river, Manggung river and Naras river. Mangau river and Naras river flow on the boundary of Kota Pariaman and Kabupaten Padang Pariaman. The profiles of the rivers are shown in Table 6.4.2. Refer to Figure 6.3.3 for river basins in Kota Pariaman.
Table 6.4.2 Major Rivers Flowing through Kota Pariaman
River Catchments Area Length
Mangau river Jirak river Piaman river Manggung river Naras river
268.49km2
22.42km2
71.56km2
39.31km2
155.54km2
37.1km 3.1km
28.5km 11.5km 39.2km
Source: Kabupaten Padang Pariaman and PSDA (Pengelolaan Sumber Daya Air) of West Sumatra Province

The Study on Natural Disaster Management in Indonesia
6-64
3) Factors for Damages due to Flood
Flood disasters are regarded to be drought down due to the following factors; 1) Climatic factor, 2) Hydro-geographical factor, 3) Socio-economic factor and 4) Countermeasure factor. It is almost impossible to control rainfall amount, which is one of the climatic factor, but the potential flood damage can be reduced by strengthening the countermeasure factor (e.g. Construction of levee, Channel improvement, Early warning system, Land use limitation, etc.), which may give some beneficially effects to the Hydro-geographical factor and the Socio-economic factor to some extent so that resilient community to flood disaster will be attained.
As for Kota Pariaman, a number of flood events had been observed in the alluvial low-lying area along coastal line. Along coastal line, the river mouths tend to be blocked by sand bars, beach ridges and sand dunes which may cause flooding from main rivers, poor drainage, forming marsh and thus higher potential of flooding. In Kec. Pariaman Selatan, some residential area along Mangau river have been suffered from flooding year after year.
In consideration of the above, the hazard map and risk map for flood disaster in Kabupaten Padang Pariaman were made based on the data or information derived or provided from the relevant organizations.
Final Report
6-65
6.4.2 Flood Hazard Map in Kota Pariaman 1) Indices of Hazard Map for Flood Disaster
In this study, simplified methodologies for the creations of hazard maps and risk maps are applied for facilitating the technology transfer to the counterpart members of Kota Pariaman smoothly, since it is aimed at the counterpart members who are to understand the methodologies and to produce the maps based on the methods in the future. The flood hazard map for Kota Pariaman was created based on data and information provided from the relevant organizations of Kota Pariaman and Pengelolaan Sumber Daya Air (PSDA) of West Sumatra Province through the discussions between the experts of the JICA study team and the counterpart members of Kota Pariaman. The indices used for creations of flood hazard map are indicated in Table 6.4.3. The indices of “Flatness” and “Alluvium” were adopted as indices of flood hazard, since low-lying area or alluvium flat plain can be the area of higher potential of flood disaster. On the other hand, the recent flood area may indicate more realistic flood hazard area. Since the past flood disaster area including flood depth and flood duration for the year of 2003 to 2007 was provided PSDA (Pengelolaan Sumber Daya Air) of West Sumatra Province, “Flood Depth” and “Flood Duration” were also adopted as flood hazard indices. The basics of creation of flood hazard map are described in the sections of 1.6.1 to 1.6.3, CHAPTER 1.
Table 6.4.3 Indices used for creations of flood hazard map
Hazard Indices
1) Flatness (Slope) (HP7)
2) Alluvium (Geology) (HP8)
3) Flood Depth (HP9)
4) Flood Duration (HP10)
The Study on Natural Disaster Management in Indonesia
6-66
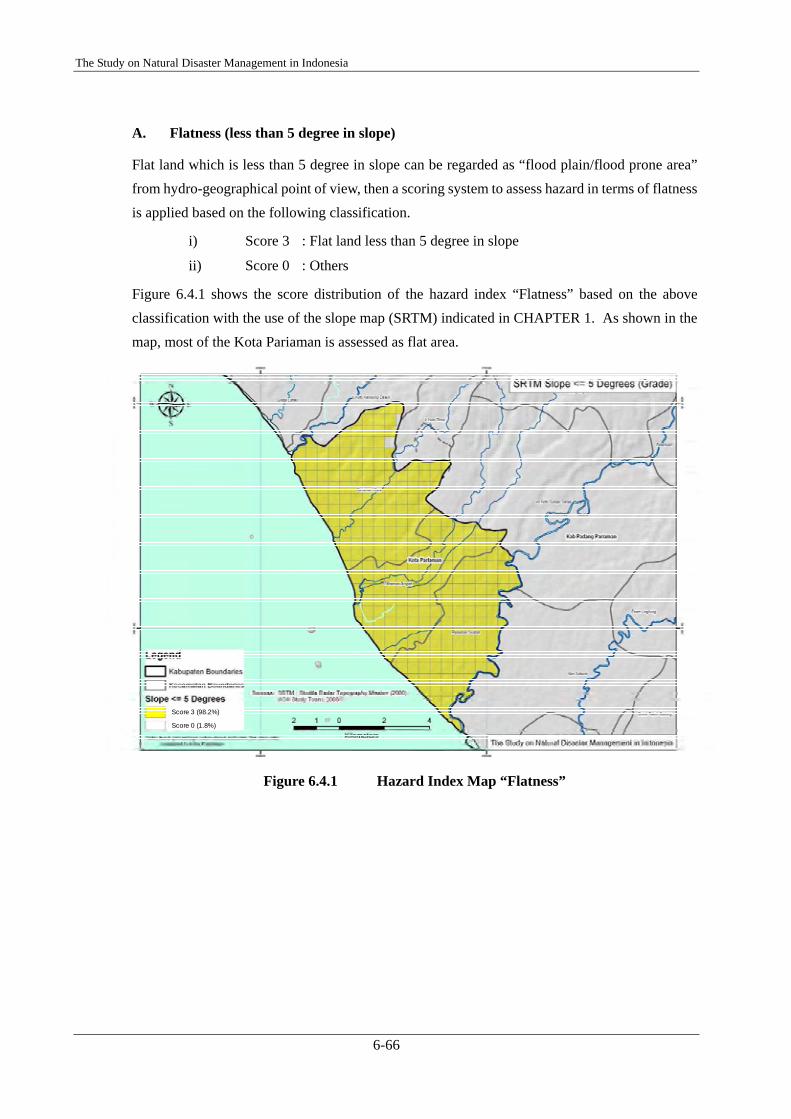
Score 3 (98.2%)
Score 0 (1.8%)
A. Flatness (less than 5 degree in slope)
Flat land which is less than 5 degree in slope can be regarded as “flood plain/flood prone area” from hydro-geographical point of view, then a scoring system to assess hazard in terms of flatness is applied based on the following classification.
i) Score 3 : Flat land less than 5 degree in slope
ii) Score 0 : Others
Figure 6.4.1 shows the score distribution of the hazard index “Flatness” based on the above classification with the use of the slope map (SRTM) indicated in CHAPTER 1. As shown in the map, most of the Kota Pariaman is assessed as flat area.
Figure 6.4.1 Hazard Index Map “Flatness”

Final Report
6-67
Alluvium
River
Score 3 (58.2%)
Score 0 (41.8%)
B. Alluvium land (based on geology map)
“Alluvium land”, in short, means the area where river flow triggers sediment erosion, transportation and deposition actions. It may imply the flood potential extent. Then, Alluvium land can be regarded as a part of flood hazard, then a scoring system to assess hazard in terms of alluvium is applied based on the following classification.
Figure 6.4.2 Alluvium land
Figure 6.4.3 shows the score distribution of the hazard index “Alluvium land” based on the above classification with the use of geology map indicated in CHAPTER 2. The map indicates that most of the inland up to some 1.5km to 3km from coastal line is assessed. The areas along rivers also are assessed as alluvium land.
Figure 6.4.3 Hazard Index Map “Alluvium land”
i) Score 3: Alluvium land ii) Score 0: Others
The Study on Natural Disaster Management in Indonesia
6-68
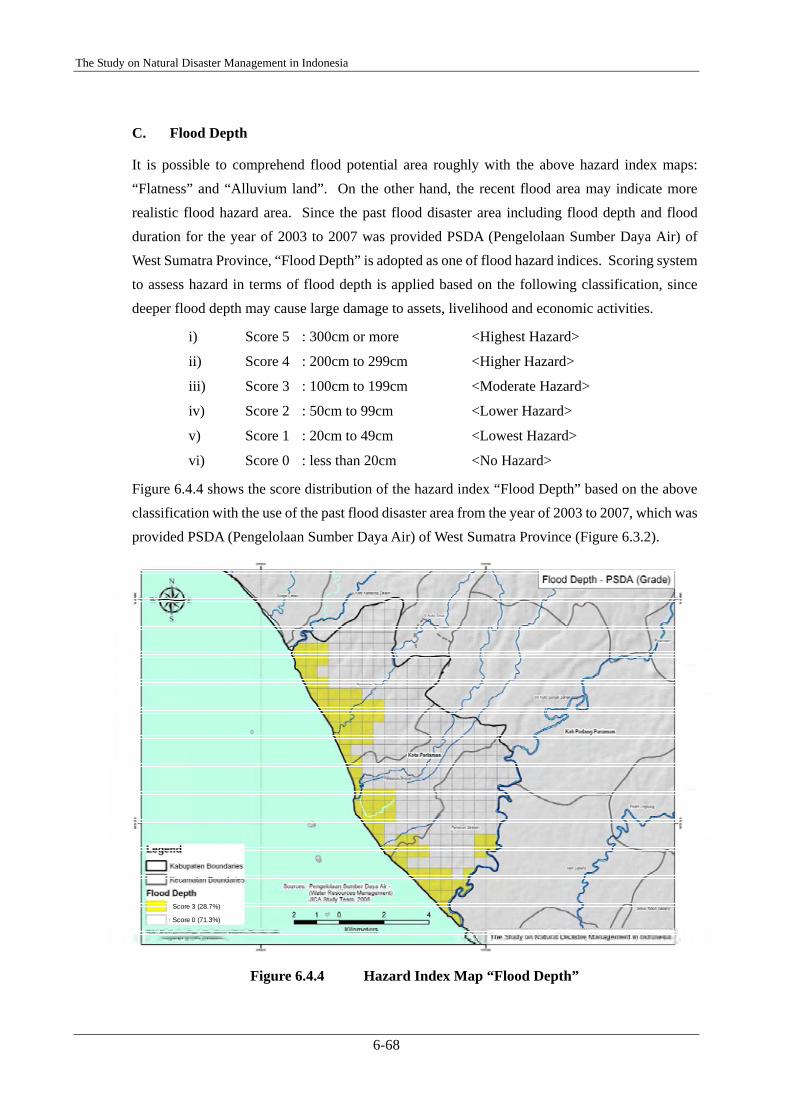
Score 3 (28.7%)
Score 0 (71.3%)
C. Flood Depth
It is possible to comprehend flood potential area roughly with the above hazard index maps: “Flatness” and “Alluvium land”. On the other hand, the recent flood area may indicate more realistic flood hazard area. Since the past flood disaster area including flood depth and flood duration for the year of 2003 to 2007 was provided PSDA (Pengelolaan Sumber Daya Air) of West Sumatra Province, “Flood Depth” is adopted as one of flood hazard indices. Scoring system to assess hazard in terms of flood depth is applied based on the following classification, since deeper flood depth may cause large damage to assets, livelihood and economic activities.
i) Score 5 : 300cm or more <Highest Hazard>
ii) Score 4 : 200cm to 299cm <Higher Hazard>
iii) Score 3 : 100cm to 199cm <Moderate Hazard>
iv) Score 2 : 50cm to 99cm <Lower Hazard>
v) Score 1 : 20cm to 49cm <Lowest Hazard>
vi) Score 0 : less than 20cm <No Hazard>
Figure 6.4.4 shows the score distribution of the hazard index “Flood Depth” based on the above classification with the use of the past flood disaster area from the year of 2003 to 2007, which was provided PSDA (Pengelolaan Sumber Daya Air) of West Sumatra Province (Figure 6.3.2).
Figure 6.4.4 Hazard Index Map “Flood Depth”
Final Report
6-69
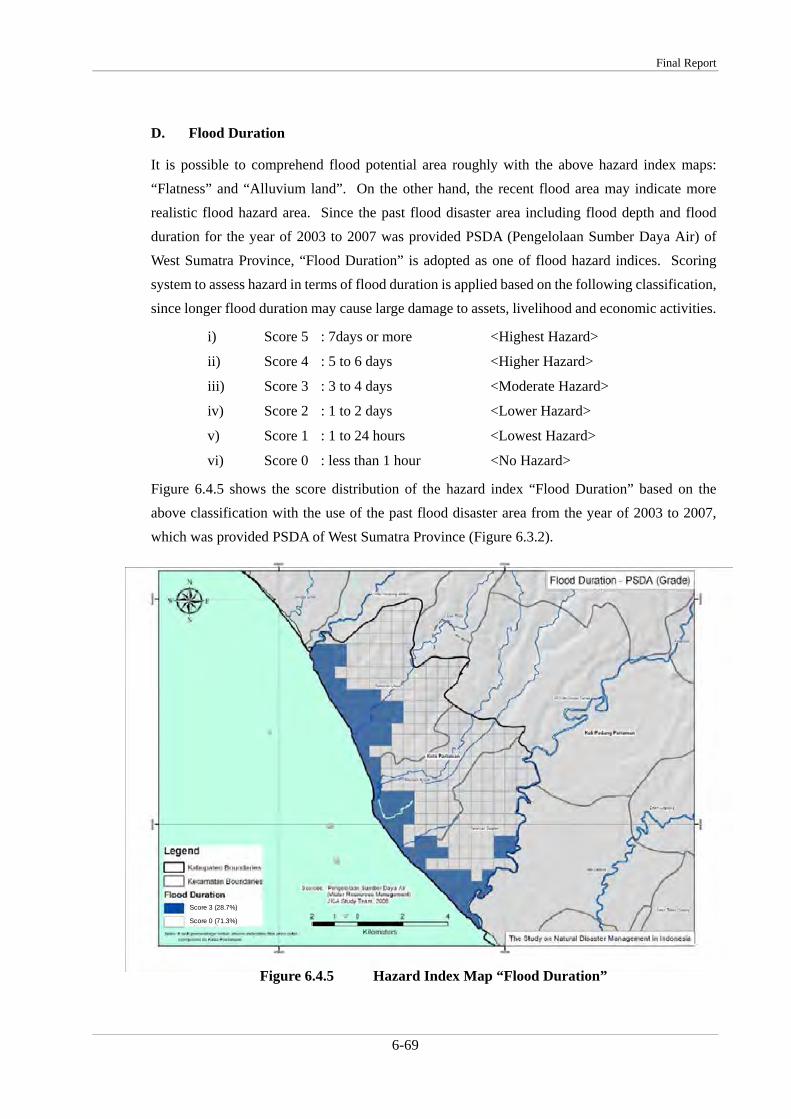
Score 3 (28.7%)
Score 0 (71.3%)
D. Flood Duration
It is possible to comprehend flood potential area roughly with the above hazard index maps: “Flatness” and “Alluvium land”. On the other hand, the recent flood area may indicate more realistic flood hazard area. Since the past flood disaster area including flood depth and flood duration for the year of 2003 to 2007 was provided PSDA (Pengelolaan Sumber Daya Air) of West Sumatra Province, “Flood Duration” is adopted as one of flood hazard indices. Scoring system to assess hazard in terms of flood duration is applied based on the following classification, since longer flood duration may cause large damage to assets, livelihood and economic activities.
i) Score 5 : 7days or more <Highest Hazard>
ii) Score 4 : 5 to 6 days <Higher Hazard>
iii) Score 3 : 3 to 4 days <Moderate Hazard>
iv) Score 2 : 1 to 2 days <Lower Hazard>
v) Score 1 : 1 to 24 hours <Lowest Hazard>
vi) Score 0 : less than 1 hour <No Hazard>
Figure 6.4.5 shows the score distribution of the hazard index “Flood Duration” based on the above classification with the use of the past flood disaster area from the year of 2003 to 2007, which was provided PSDA of West Sumatra Province (Figure 6.3.2).
Figure 6.4.5 Hazard Index Map “Flood Duration”
The Study on Natural Disaster Management in Indonesia
6-70
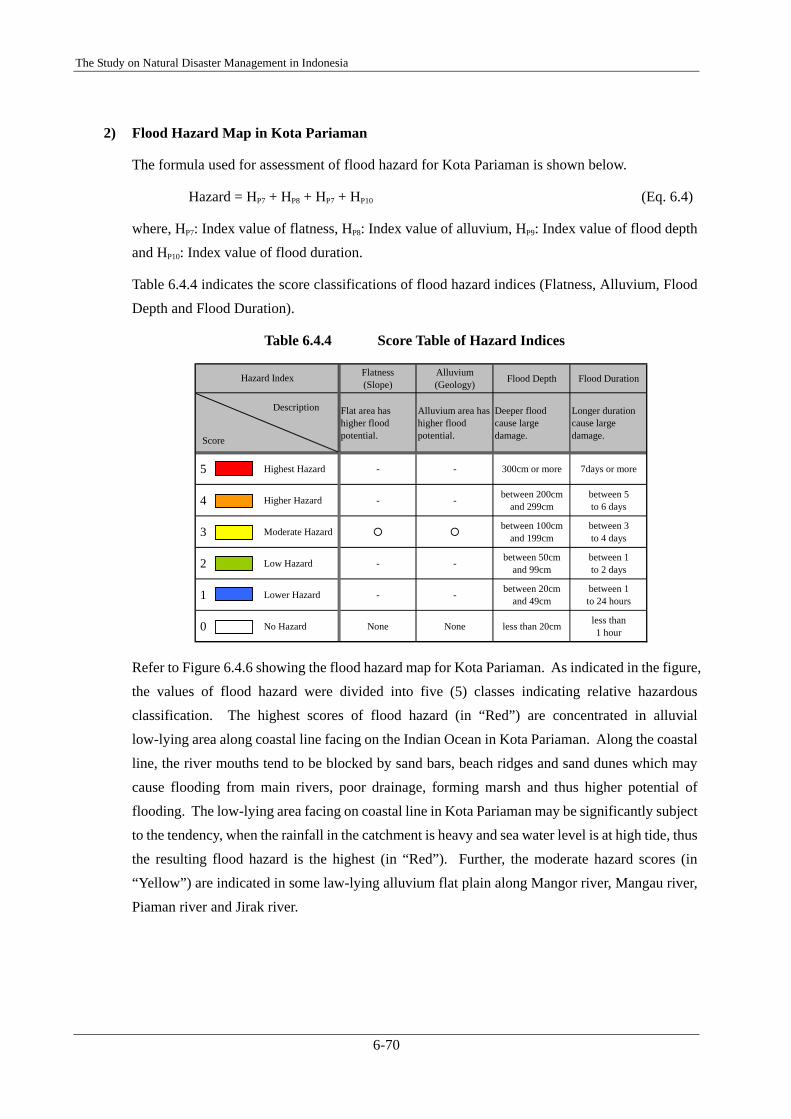
Flatness(Slope)
Alluvium(Geology) Flood Depth Flood Duration
Flat area hashigher floodpotential.
Alluvium area hashigher floodpotential.
Deeper floodcause largedamage.
Longer durationcause largedamage.
5 Highest Hazard - - 300cm or more 7days or more
4 Higher Hazard - - between 200cmand 299cm
between 5to 6 days
3 Moderate Hazard ○ ○between 100cm
and 199cmbetween 3to 4 days
2 Low Hazard - - between 50cmand 99cm
between 1to 2 days
1 Lower Hazard - - between 20cmand 49cm
between 1to 24 hours
0 No Hazard None None less than 20cm less than1 hour
Hazard Index
Description
Score
2) Flood Hazard Map in Kota Pariaman
The formula used for assessment of flood hazard for Kota Pariaman is shown below.
Hazard = HP7 + HP8 + HP7 + HP10 (Eq. 6.4)
where, HP7: Index value of flatness, HP8: Index value of alluvium, HP9: Index value of flood depth and HP10: Index value of flood duration.
Table 6.4.4 indicates the score classifications of flood hazard indices (Flatness, Alluvium, Flood Depth and Flood Duration).
Table 6.4.4 Score Table of Hazard Indices
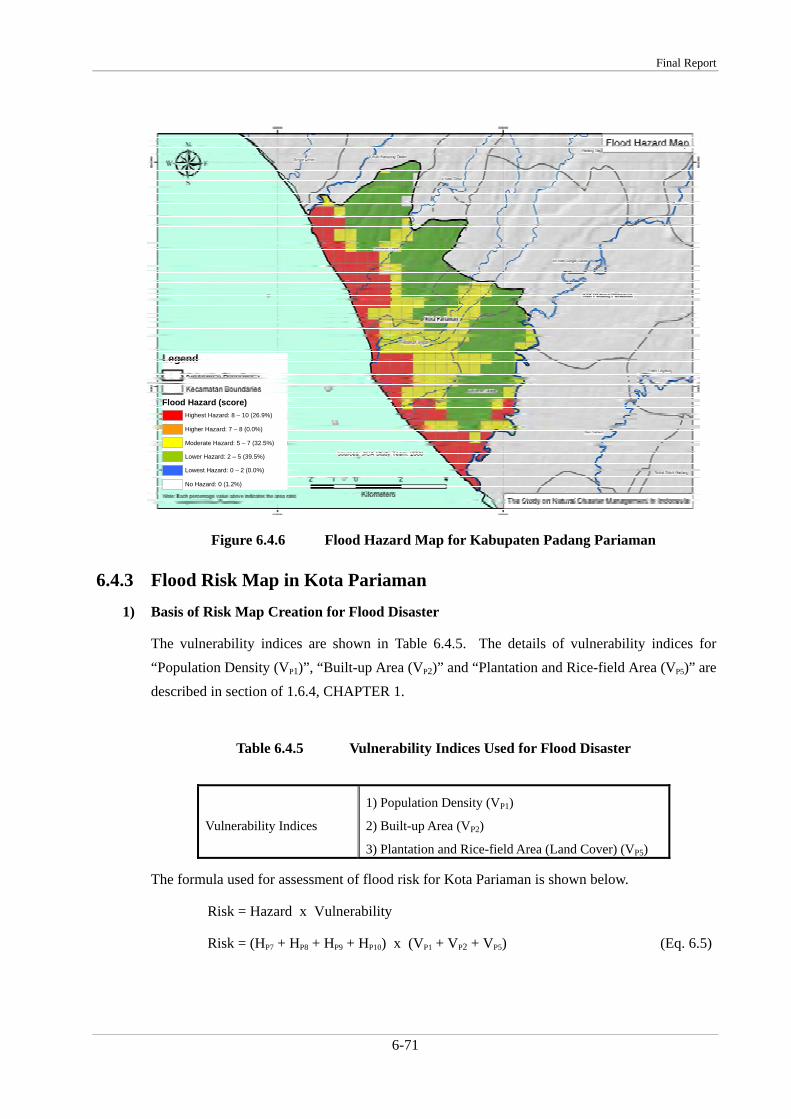
Refer to Figure 6.4.6 showing the flood hazard map for Kota Pariaman. As indicated in the figure, the values of flood hazard were divided into five (5) classes indicating relative hazardous classification. The highest scores of flood hazard (in “Red”) are concentrated in alluvial low-lying area along coastal line facing on the Indian Ocean in Kota Pariaman. Along the coastal line, the river mouths tend to be blocked by sand bars, beach ridges and sand dunes which may cause flooding from main rivers, poor drainage, forming marsh and thus higher potential of flooding. The low-lying area facing on coastal line in Kota Pariaman may be significantly subject to the tendency, when the rainfall in the catchment is heavy and sea water level is at high tide, thus the resulting flood hazard is the highest (in “Red”). Further, the moderate hazard scores (in “Yellow”) are indicated in some law-lying alluvium flat plain along Mangor river, Mangau river, Piaman river and Jirak river.
Final Report
6-71
Flood Hazard (score)Highest Hazard: 8 – 10 (26.9%)
Higher Hazard: 7 – 8 (0.0%)
Moderate Hazard: 5 – 7 (32.5%)
Lower Hazard: 2 – 5 (39.5%)
Lowest Hazard: 0 – 2 (0.0%)
No Hazard: 0 (1.2%)
Figure 6.4.6 Flood Hazard Map for Kabupaten Padang Pariaman
6.4.3 Flood Risk Map in Kota Pariaman 1) Basis of Risk Map Creation for Flood Disaster
The vulnerability indices are shown in Table 6.4.5. The details of vulnerability indices for “Population Density (VP1)”, “Built-up Area (VP2)” and “Plantation and Rice-field Area (VP5)” are described in section of 1.6.4, CHAPTER 1.
Table 6.4.5 Vulnerability Indices Used for Flood Disaster
Vulnerability Indices
1) Population Density (VP1)
2) Built-up Area (VP2)
3) Plantation and Rice-field Area (Land Cover) (VP5)
The formula used for assessment of flood risk for Kota Pariaman is shown below.
Risk = Hazard x Vulnerability
Risk = (HP7 + HP8 + HP9 + HP10) x (VP1 + VP2 + VP5) (Eq. 6.5)
The Study on Natural Disaster Management in Indonesia
6-72
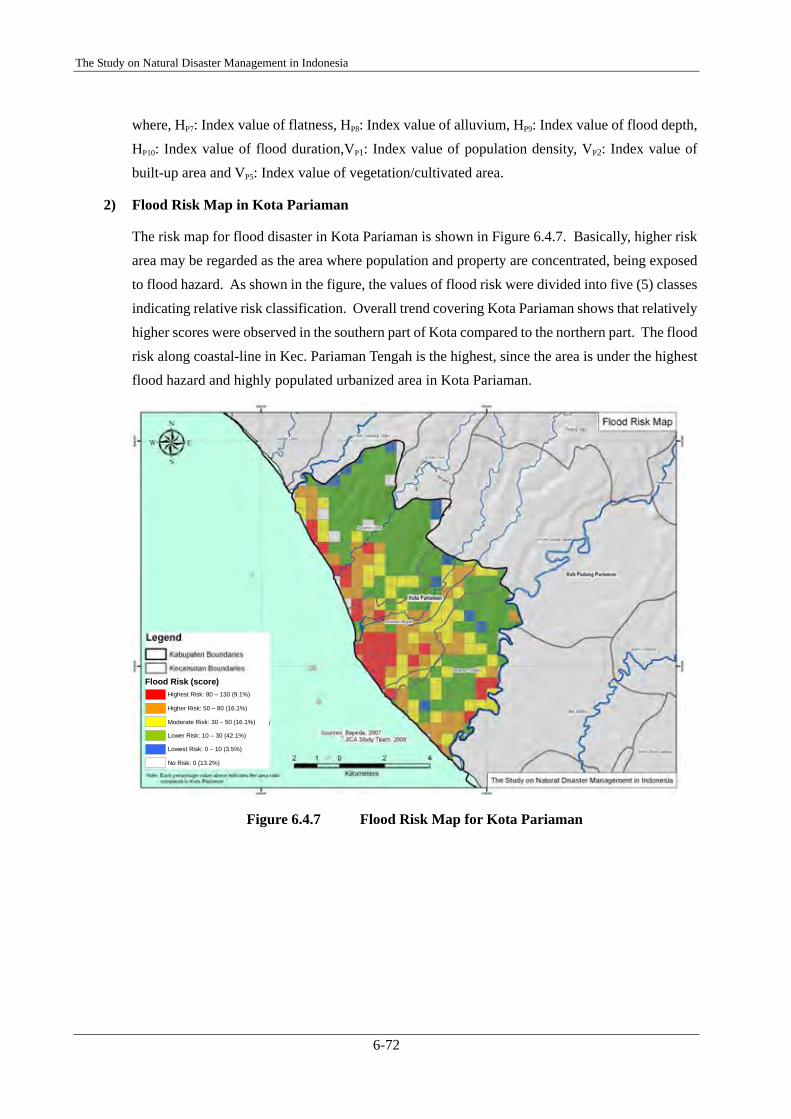
Flood Risk (score)Highest Risk: 80 – 130 (9.1%)
Higher Risk: 50 – 80 (16.1%)
Moderate Risk: 30 – 50 (16.1%)
Lower Risk: 10 – 30 (42.1%)
Lowest Risk: 0 – 10 (3.5%)
No Risk: 0 (13.2%)
where, HP7: Index value of flatness, HP8: Index value of alluvium, HP9: Index value of flood depth, HP10: Index value of flood duration,VP1: Index value of population density, VP2: Index value of built-up area and VP5: Index value of vegetation/cultivated area.
2) Flood Risk Map in Kota Pariaman
The risk map for flood disaster in Kota Pariaman is shown in Figure 6.4.7. Basically, higher risk area may be regarded as the area where population and property are concentrated, being exposed to flood hazard. As shown in the figure, the values of flood risk were divided into five (5) classes indicating relative risk classification. Overall trend covering Kota Pariaman shows that relatively higher scores were observed in the southern part of Kota compared to the northern part. The flood risk along coastal-line in Kec. Pariaman Tengah is the highest, since the area is under the highest flood hazard and highly populated urbanized area in Kota Pariaman.
Figure 6.4.7 Flood Risk Map for Kota Pariaman
Final Report
6-73
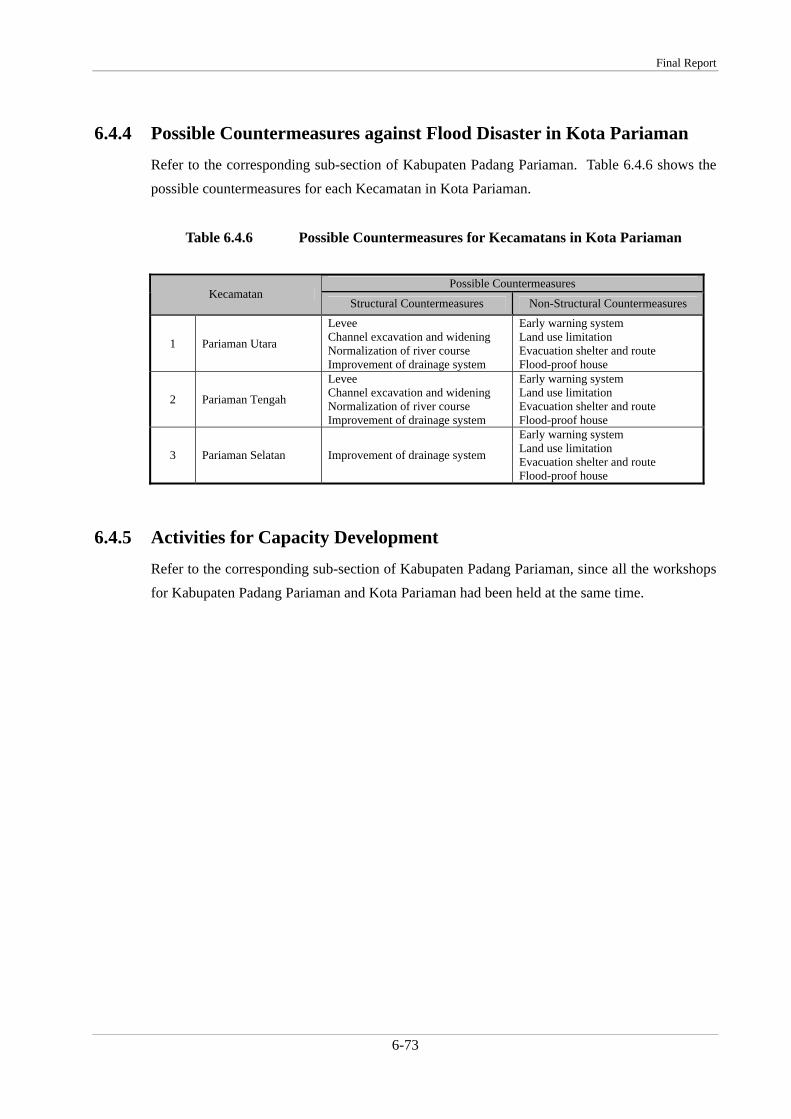
6.4.4 Possible Countermeasures against Flood Disaster in Kota Pariaman Refer to the corresponding sub-section of Kabupaten Padang Pariaman. Table 6.4.6 shows the possible countermeasures for each Kecamatan in Kota Pariaman.
Table 6.4.6 Possible Countermeasures for Kecamatans in Kota Pariaman
Possible Countermeasures
Kecamatan Structural Countermeasures Non-Structural Countermeasures
1 Pariaman Utara
Levee Channel excavation and widening Normalization of river course Improvement of drainage system
Early warning system Land use limitation Evacuation shelter and route Flood-proof house
2 Pariaman Tengah
Levee Channel excavation and widening Normalization of river course Improvement of drainage system
Early warning system Land use limitation Evacuation shelter and route Flood-proof house
3 Pariaman Selatan Improvement of drainage system
Early warning system Land use limitation Evacuation shelter and route Flood-proof house
6.4.5 Activities for Capacity Development Refer to the corresponding sub-section of Kabupaten Padang Pariaman, since all the workshops for Kabupaten Padang Pariaman and Kota Pariaman had been held at the same time.