1. IJAMSS - Modeling and Analysis of a Vector-Host Epidemic Model - Sneha Porwal - OPaid
Upload
tjprc-publicationsCategory
view
217download
0
www.tjprc.org [email protected]
International Journal of Electrical and
Electronics Engineering Research (IJEEER)
ISSN(P): 2250-155X; ISSN(E): 2278-943X
Vol. 4, Issue 3, Jun 2014, 51-62
© TJPRC Pvt. Ltd.
COMPARATIVE STUDY OF VARIOUS CASCADED H-BRIDGE MULTILEVEL
INVERTER TOPOLOGIES
KAVALI JANARDHAN1 & ARVIND MITTAL
2
1M. Tech Student, Department of Energy, Maulana Azad National Institute of Technology, Bhopal, Madhya Pradesh, India
2Associate Professor, Department of Energy, Maulana Azad National Institute of Technology, Bhopal,
Madhya Pradesh, India
ABSTRACT
Multilevel inverters are becoming more popular in the power conversion systems for high power and power
quality demanding applications. The MATLAB based simulation on simulink platform is presented for three various
topologies of Single Phase cascaded H-bridge Multilevel Inverter for 5, 7 and 9 levels. A detailed comparison of various
Topologies is presented in the paper based on number of power devices used, Total Harmonic Distortion, average voltage
stress, maximum voltage stress and utilization factor. The Topology I and Topology II are cheap and efficient because
number of conducting power devices are less as compared to the conventional Topology.
KEYWORDS: Multilevel Inverter, Reduced Number of Switches, Reduced THD, Voltage Stress and Utilization Factor
INTRODUCTION
Multilevel inverters have more attention in the field of high voltage and medium power applications due to their
advantages, such as low voltage stress on power semiconductor devices, low harmonic distortions, good electromagnetic
compatibility, reduced switching losses and improved reliability on fault tolerance. Therefore, the multilevel inverters also
have lower dv/dt ratio to prevent induction or discharge failures on the loads. Recently low voltage applications also has
been studied to apply the multilevel inverters for high efficiency such as in the uninterrupted power supply (UPS) and
power inverter for solar photovoltaic system (PV).
Different types of multilevel inverters for the conversion from DC to AC are available such as Neutral point
clamped multilevel inverter (NPC-MLI), Flying capacitor multilevel inverter (FC-MLI) and Cascade H-Bridge multilevel
inverter (CHB-MLI). Among them CHB-MLIs are mostly used for PV applications because each module of CHB-MLI
requires separate DC sources which can be easily supplied by individual PV arrays. The number of levels of the output
waveform can be increased by cascading the number of H-Bridge modules in series. If the number of level increases then
total harmonic distortion (THD) also reduces.
CONVENTIONAL CASCADED H-BRIDGE MULTILEVEL INVERTER
Cascaded H-Bridge MLI is nothing but H-Bridges connected in a cascaded manner. By adding each H-Bridge
module, we can increase the two levels in an output waveform. Normally for an single phase cascaded H-Bridge multilevel
inverter, number of semi conductor switches required is 2(n-1), where n is the number of levels.
52 Kavali Janardhan & Arvind Mittal
Impact Factor (JCC): 5.9638 Index Copernicus Value (ICV): 3.0
S2
S8S7
LOAD
S6
S5
S3
S4
S1
V
V
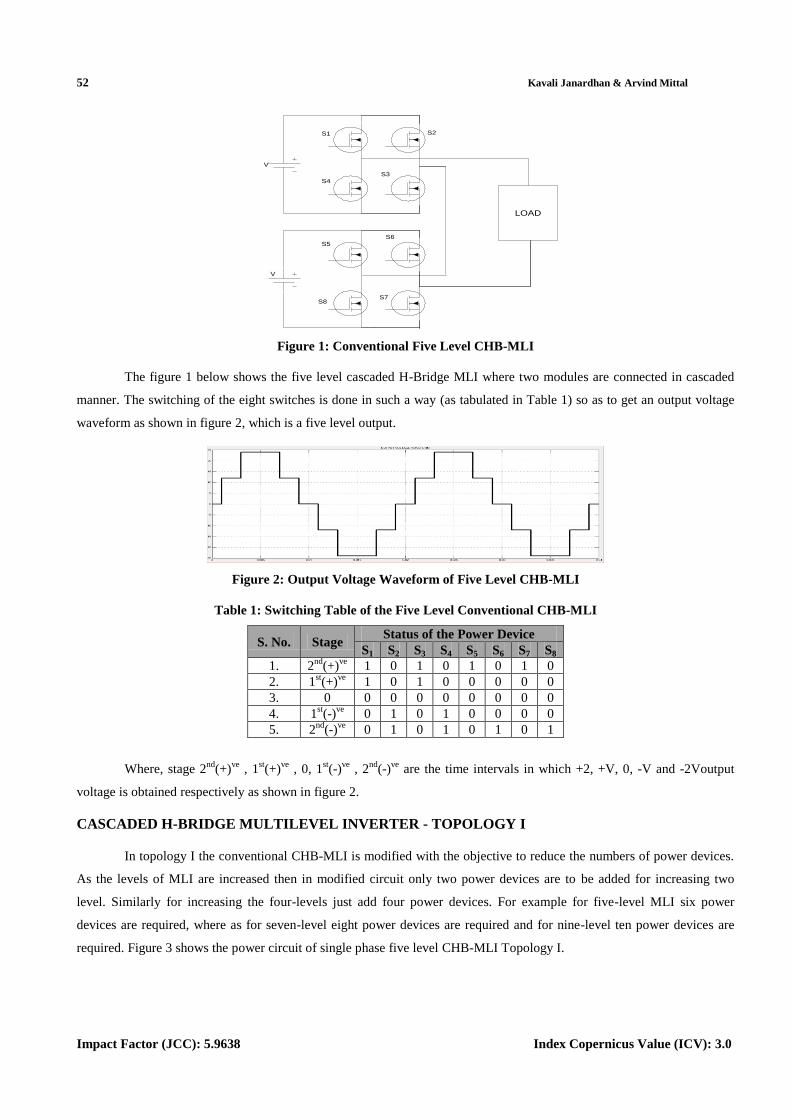
Figure 1: Conventional Five Level CHB-MLI
The figure 1 below shows the five level cascaded H-Bridge MLI where two modules are connected in cascaded
manner. The switching of the eight switches is done in such a way (as tabulated in Table 1) so as to get an output voltage
waveform as shown in figure 2, which is a five level output.
Figure 2: Output Voltage Waveform of Five Level CHB-MLI
Table 1: Switching Table of the Five Level Conventional CHB-MLI
S. No. Stage Status of the Power Device
S1 S2 S3 S4 S5
S6
S7
S8
1. 2nd
(+)ve
1 0 1 0 1 0 1 0
2. 1st(+)
ve 1 0 1 0 0 0 0 0
3. 0 0 0 0 0 0 0 0 0
4. 1st(-)
ve 0 1 0 1 0 0 0 0
5. 2nd
(-)ve
0 1 0 1 0 1 0 1
Where, stage 2nd
(+)ve
, 1st(+)
ve , 0, 1
st(-)
ve , 2
nd(-)
ve are the time intervals in which +2, +V, 0, -V and -2Voutput
voltage is obtained respectively as shown in figure 2.
CASCADED H-BRIDGE MULTILEVEL INVERTER - TOPOLOGY I
In topology I the conventional CHB-MLI is modified with the objective to reduce the numbers of power devices.
As the levels of MLI are increased then in modified circuit only two power devices are to be added for increasing two
level. Similarly for increasing the four-levels just add four power devices. For example for five-level MLI six power
devices are required, where as for seven-level eight power devices are required and for nine-level ten power devices are
required. Figure 3 shows the power circuit of single phase five level CHB-MLI Topology I.

Comparative Study of Various Cascaded H-Bridge Multilevel Inverter Topologies 53
www.tjprc.org [email protected]
V
V LOAD
S5S3
S1 S2
S4
S6
Figure 3: Five Level CHB-MLI Topology I
The switching of the power devices to obtain the same output voltage waveform as shown in Figure 2 is tabulated
in Table 2.
Table 2: Switching Table of the Five Level CHB-MLI Topology I
S. No. Stage Status of the Power Device
S1 S2 S3 S4 S5 S6
1. 2nd
(+)ve
1 0 1 0 0 1
2. 1st(+)
ve 1 0 1 0 1 0
3. 0 0 0 0 0 0 0
4. 1st(-)
ve 0 1 0 1 1 0
5. 2nd
(-)ve
0 1 0 1 0 1
CASCADED H-BRIDGE MULTILEVEL INVERTER - TOPOLOGY II
In topology II the conventional CHB-MLI is modified with the objective to further reduce the numbers of power
devices. As the three level inverter is increased to five level inverter then two additional switches are required, but after
fifth level by increasing two levels only one more switch is required. For example for three-level MLI four power devices
are required, where as for five-level six power devices are required, for seven-level seven power devices are required and
for nine-level eight power devices are required. Figure 4 shows the power circuit of single phase five level CHB-MLI
Topology II.
V
LOAD
S3
S1 S2
S4
S5
S6
V
Figure 4: Five Level CHB-MLI Topology II
The switching of the power devices to obtain the same output voltage waveform as shown in Figure 2 is tabulated
in Table 3.

54 Kavali Janardhan & Arvind Mittal
Impact Factor (JCC): 5.9638 Index Copernicus Value (ICV): 3.0
Table 3: Switching Table of the Five Level CHB-MLI Topology II
S. No. Stage Status of the Power Device
S1 S2 S3 S4 S5 S6
1. 2(+)ve
1 0 1 0 0 1
2. 1(+)ve
1 0 1 0 1 0
3. 0 0 0 0 0 0 0
4. 1(-)ve
0 1 0 1 1 0
5. 2(-)ve
0 1 0 1 0 1
SIMULATION RESULTS
The SIMULINK models of the five level conventional CHB-MLI, CHB-MLI topology I and CHB-MLI topology
II are shown in Figure 5, Figure 6, Figure 7 respectively and the output voltage waveform obtained is same for all the
topologies as shown in Figure 8. The SIMULINK models were made for seven level and nine level conventional
CHB-MLI and it is observed that the THD reduces as the level increases. The output voltage waveforms of seven and nine
level MLIs are shown in Figure 9 and Figure 10 respectively. THD with reference to fundamental component for five,
seven and nine levels are shown in Figure 11, Figure 12 and Figure 13 respectively.
Figure 5: SIMULINK Model of Conventional Five Level CHB-MLI
Figure 6: SIMULINK Model of Five Level CHB-MLI Topology I
Figure 7: SIMULINK Model of Five Level CHB-MLI Topology II

Comparative Study of Various Cascaded H-Bridge Multilevel Inverter Topologies 55
www.tjprc.org [email protected]
Figure 8: Output Waveform of a Five Level MLI
Figure 9: Output Waveform of a Seven Level MLI
Figure 10: Output Waveform of a Nine Level MLI
Figure 11: THD with Reference to Fundamental Component of a Five Level MLI
Figure 12: THD with Reference to Fundamental Component of a Seven Level MLI
Figure 13: THD with Reference to Fundamental Component of a Nine Level MLI
56 Kavali Janardhan & Arvind Mittal
Impact Factor (JCC): 5.9638 Index Copernicus Value (ICV): 3.0
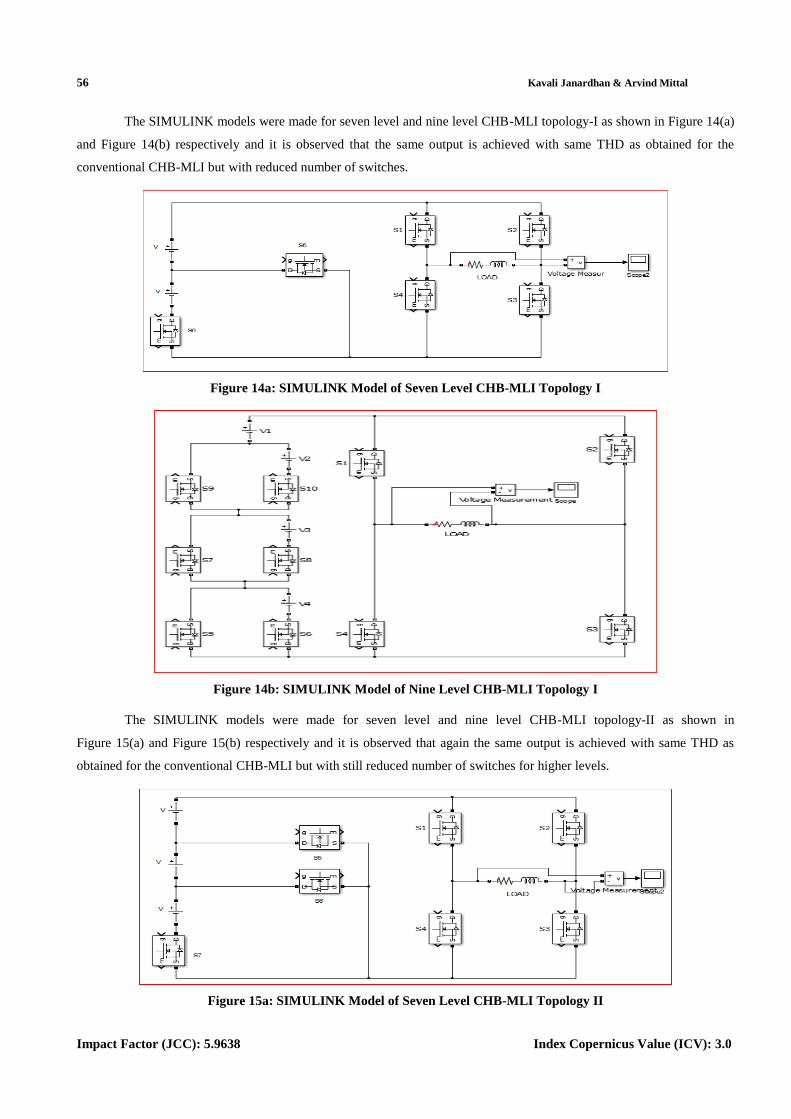
The SIMULINK models were made for seven level and nine level CHB-MLI topology-I as shown in Figure 14(a)
and Figure 14(b) respectively and it is observed that the same output is achieved with same THD as obtained for the
conventional CHB-MLI but with reduced number of switches.
Figure 14a: SIMULINK Model of Seven Level CHB-MLI Topology I
Figure 14b: SIMULINK Model of Nine Level CHB-MLI Topology I
The SIMULINK models were made for seven level and nine level CHB-MLI topology-II as shown in
Figure 15(a) and Figure 15(b) respectively and it is observed that again the same output is achieved with same THD as
obtained for the conventional CHB-MLI but with still reduced number of switches for higher levels.
Figure 15a: SIMULINK Model of Seven Level CHB-MLI Topology II

Comparative Study of Various Cascaded H-Bridge Multilevel Inverter Topologies 57
www.tjprc.org [email protected]
Figure 15b: SIMULINK Model of Nine Level CHB-MLI Topology II
COMPARATIVE ANALYSIS
The comparison of number of power devices required for conventional CHB-MLI, Topology I and Topology II
for five level, seven level and nine level are tabulated in Table 4. It can be depicted that Topology II is best suited with
reference to number of power devices required.
Table 4: Comparison of Number of Devices
MLI
Topology
Number of Devices
5
Level
7
Level
9
Level
Conventional
CHB 8 12 16
Topology I 6 8 10
Topology II 6 7 8
The basic switching strategy for five level inverter is (α - α - 2α -α -α), where α is the angle for the duration for
which the output voltage is zero in the first state. The THD with this particular strategy is quite high. In order to reduce the
THD, the switching strategy of (α - 2α - 4α - 2α - α) is used and same strategies used for seven and nine level too.
The switching strategy used in five, seven and nine level are tabulated in Table 5.
Table 5: Switching Strategies
Level Switching Strategy α in
Degrees
5 α - 2α - 4α - 2α - α 18
7 α - 2α - 2α - 4α - 2α - 2α -α 12.86
9 α - 2α - 2α -2α - 4α - 2α - 2α - 2α - α 10
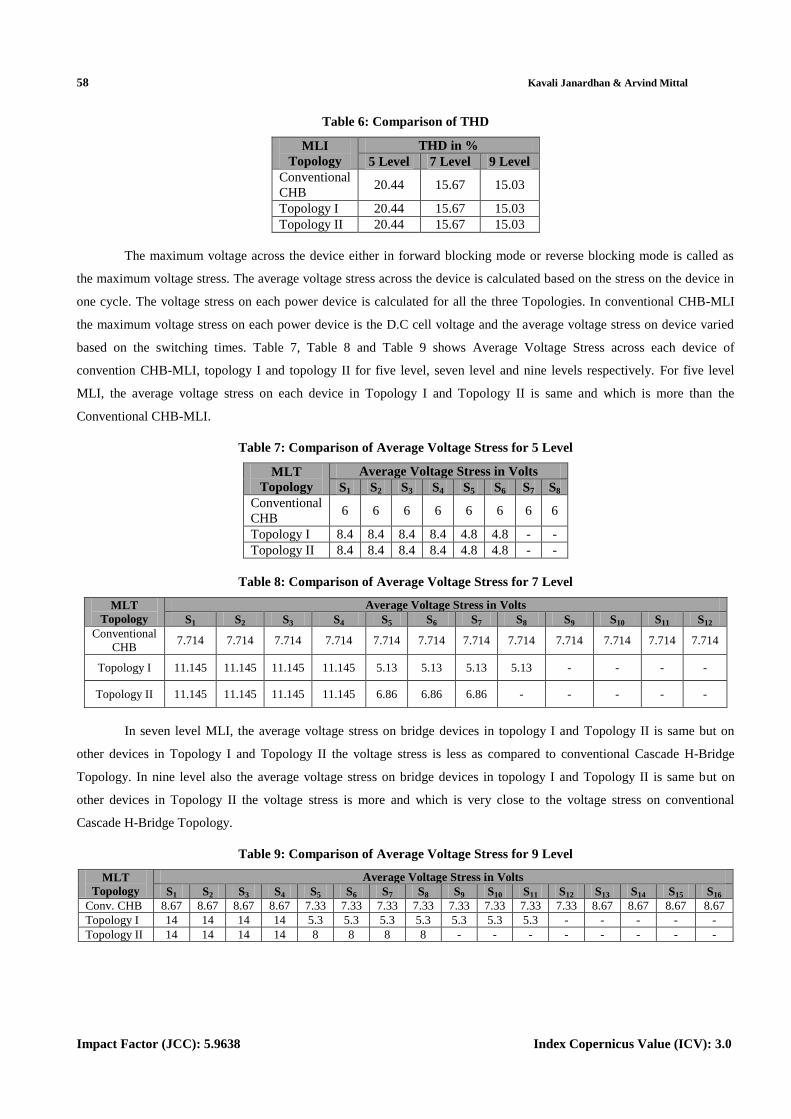
The THD is calculated for conventional CHB-MLI, Topology I and Topology II for five level, seven level and
nine level and is tabulated in Table 6. It is observed that THD reduces as the number of level increases but is same for all
the Topologies as the same control strategy is used.
58 Kavali Janardhan & Arvind Mittal
Impact Factor (JCC): 5.9638 Index Copernicus Value (ICV): 3.0
Table 6: Comparison of THD
MLI
Topology
THD in %
5 Level 7 Level 9 Level
Conventional
CHB 20.44 15.67 15.03
Topology I 20.44 15.67 15.03
Topology II 20.44 15.67 15.03
The maximum voltage across the device either in forward blocking mode or reverse blocking mode is called as
the maximum voltage stress. The average voltage stress across the device is calculated based on the stress on the device in
one cycle. The voltage stress on each power device is calculated for all the three Topologies. In conventional CHB-MLI
the maximum voltage stress on each power device is the D.C cell voltage and the average voltage stress on device varied
based on the switching times. Table 7, Table 8 and Table 9 shows Average Voltage Stress across each device of
convention CHB-MLI, topology I and topology II for five level, seven level and nine levels respectively. For five level
MLI, the average voltage stress on each device in Topology I and Topology II is same and which is more than the
Conventional CHB-MLI.
Table 7: Comparison of Average Voltage Stress for 5 Level
MLT
Topology
Average Voltage Stress in Volts
S1 S2 S3 S4 S5 S6 S7 S8
Conventional
CHB 6 6 6 6 6 6 6 6
Topology I 8.4 8.4 8.4 8.4 4.8 4.8 - -
Topology II 8.4 8.4 8.4 8.4 4.8 4.8 - -
Table 8: Comparison of Average Voltage Stress for 7 Level
MLT
Topology
Average Voltage Stress in Volts
S1 S2 S3 S4 S5 S6 S7 S8 S9 S10 S11 S12
Conventional
CHB 7.714 7.714 7.714 7.714 7.714 7.714 7.714 7.714 7.714 7.714 7.714 7.714
Topology I 11.145 11.145 11.145 11.145 5.13 5.13 5.13 5.13 - - - -
Topology II 11.145 11.145 11.145 11.145 6.86 6.86 6.86 - - - - -
In seven level MLI, the average voltage stress on bridge devices in topology I and Topology II is same but on
other devices in Topology I and Topology II the voltage stress is less as compared to conventional Cascade H-Bridge
Topology. In nine level also the average voltage stress on bridge devices in topology I and Topology II is same but on
other devices in Topology II the voltage stress is more and which is very close to the voltage stress on conventional
Cascade H-Bridge Topology.
Table 9: Comparison of Average Voltage Stress for 9 Level
MLT
Topology
Average Voltage Stress in Volts
S1 S2 S3 S4 S5 S6 S7 S8 S9 S10 S11 S12 S13 S14 S15 S16
Conv. CHB 8.67 8.67 8.67 8.67 7.33 7.33 7.33 7.33 7.33 7.33 7.33 7.33 8.67 8.67 8.67 8.67
Topology I 14 14 14 14 5.3 5.3 5.3 5.3 5.3 5.3 5.3 - - - - -
Topology II 14 14 14 14 8 8 8 8 - - - - - - - -
Comparative Study of Various Cascaded H-Bridge Multilevel Inverter Topologies 59
www.tjprc.org [email protected]
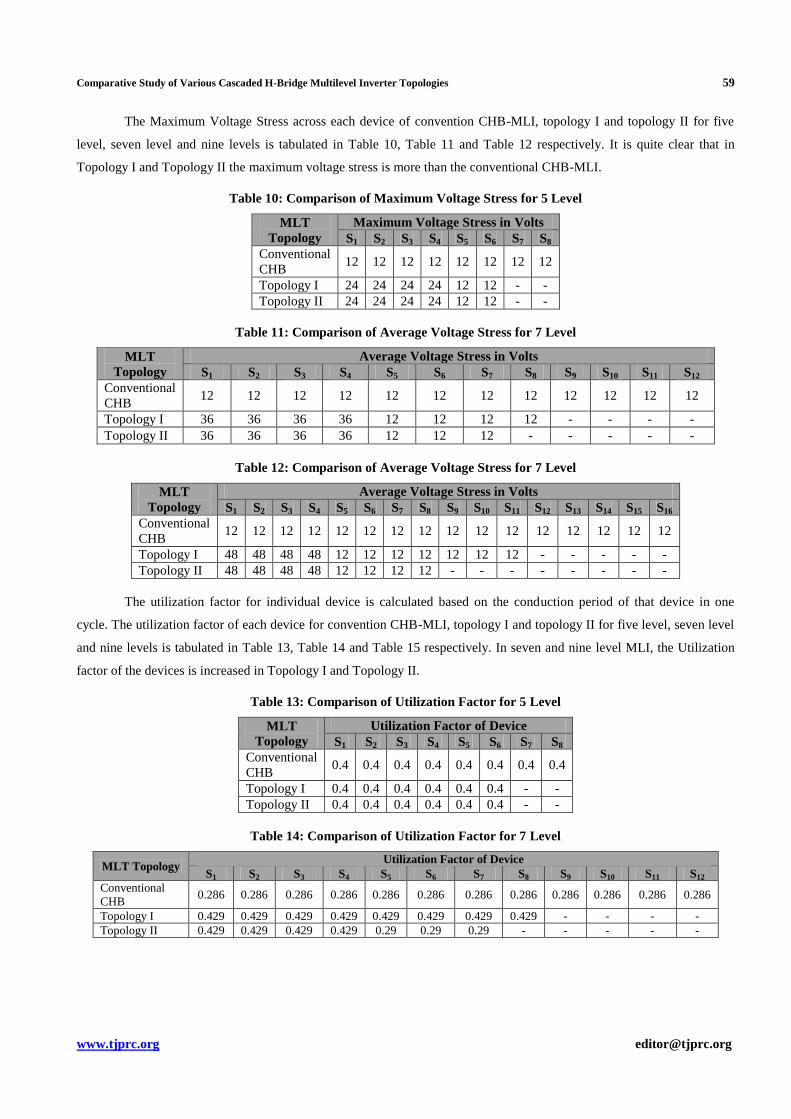
The Maximum Voltage Stress across each device of convention CHB-MLI, topology I and topology II for five
level, seven level and nine levels is tabulated in Table 10, Table 11 and Table 12 respectively. It is quite clear that in
Topology I and Topology II the maximum voltage stress is more than the conventional CHB-MLI.
Table 10: Comparison of Maximum Voltage Stress for 5 Level
MLT
Topology
Maximum Voltage Stress in Volts
S1 S2 S3 S4 S5 S6 S7 S8
Conventional
CHB 12 12 12 12 12 12 12 12
Topology I 24 24 24 24 12 12 - -
Topology II 24 24 24 24 12 12 - -
Table 11: Comparison of Average Voltage Stress for 7 Level
MLT
Topology
Average Voltage Stress in Volts
S1 S2 S3 S4 S5 S6 S7 S8 S9 S10 S11 S12
Conventional
CHB 12 12 12 12 12 12 12 12 12 12 12 12
Topology I 36 36 36 36 12 12 12 12 - - - -
Topology II 36 36 36 36 12 12 12 - - - - -
Table 12: Comparison of Average Voltage Stress for 7 Level
MLT
Topology
Average Voltage Stress in Volts
S1 S2 S3 S4 S5 S6 S7 S8 S9 S10 S11 S12 S13 S14 S15 S16
Conventional
CHB 12 12 12 12 12 12 12 12 12 12 12 12 12 12 12 12
Topology I 48 48 48 48 12 12 12 12 12 12 12 - - - - -
Topology II 48 48 48 48 12 12 12 12 - - - - - - - -
The utilization factor for individual device is calculated based on the conduction period of that device in one
cycle. The utilization factor of each device for convention CHB-MLI, topology I and topology II for five level, seven level
and nine levels is tabulated in Table 13, Table 14 and Table 15 respectively. In seven and nine level MLI, the Utilization
factor of the devices is increased in Topology I and Topology II.
Table 13: Comparison of Utilization Factor for 5 Level
MLT
Topology
Utilization Factor of Device
S1 S2 S3 S4 S5 S6 S7 S8
Conventional
CHB 0.4 0.4 0.4 0.4 0.4 0.4 0.4 0.4
Topology I 0.4 0.4 0.4 0.4 0.4 0.4 - -
Topology II 0.4 0.4 0.4 0.4 0.4 0.4 - -
Table 14: Comparison of Utilization Factor for 7 Level
MLT Topology Utilization Factor of Device
S1 S2 S3 S4 S5 S6 S7 S8 S9 S10 S11 S12
Conventional
CHB 0.286 0.286 0.286 0.286 0.286 0.286 0.286 0.286 0.286 0.286 0.286 0.286
Topology I 0.429 0.429 0.429 0.429 0.429 0.429 0.429 0.429 - - - -
Topology II 0.429 0.429 0.429 0.429 0.29 0.29 0.29 - - - - -

60 Kavali Janardhan & Arvind Mittal
Impact Factor (JCC): 5.9638 Index Copernicus Value (ICV): 3.0
Table 15: Comparison Utilization Factor of for 9 Level
MLT
Topology
Utilization Factor of Device
S1 S2 S3 S4 S5 S6 S7 S8 S9 S10 S11 S12 S13 S14 S15 S16
Conventional
CHB .22 .22 .22 .22 .22 .22 .22 .22 .22 .22 .22 .22 .22 .22 .22 .22
Topology I .44 .44 .44 .44 .44 .44 .44 .44 .44 .44 .44 - - - - -
Topology II .44 .44 .44 .44 .22 .22 .22 .22 - - - - - - - -
CONCLUSIONS
In this paper a detailed comparison of conventional CHB-MLI and cascaded H-Bridge MLI Topology I and
Topology II has been presented. The reduction in the number of devices goes on increasing as we increase the number of
levels for topology-II. The Topology I and II are more cheaper and efficient than the conventional because number of
conducting power devices are less. Maximum voltage stress on each device in conventional CHB-MLI is V, where as in
topology I and topology II voltage stress increases with increase in the number of levels. The cost of Topology I and
Topology II are lower than the conventional CHB-MLI. Utilization factor is increased in Topology I and Topology II as
compared to the conventional topology. The average voltage stress on devices in the basic bridge is more for Topology I
and II while for other switches the average voltage stress is less. By properly choosing the control strategy, the utilization
factor for each device can be increased and at the same time the THD and the average voltage stress can also be reduced.
ACKNOWLEDGEMENTS
The author is very grateful and would acknowledge the energy department, Maulana Azad National Institute of
Technology for providing all possible facilities for carrying out this research paper.
REFERENCES
1. Nabae, A., Takahashi, I., and Akagi, H., "A new neutral-point clamped PWM inverter", IEEE Transactions on
Industrial Applications, Vol. IA-17, pp. 518-523, September/October 1981.
2. Mahrous Ahmed, Maha G. Elsheikh, Mahmoud A. Sayed., "Single-Phase Five-Level Inverter with Less Number
of Power Elements for Grid Connection", IEEE conference 2012.
3. Ilhami Colak a, Ersan Kabalci b, Ramazan Bayindir," Review of multilevel voltage source inverter topologies and
control schemes", Energy Conversion and Management 52 (2011) 1114–1128.
4. Maha G. Elsheikh, Mahrous E. Ahmed, Emad Abdelkarem, Mohamed Orabi, " Single-Phase Five-Level Inverter
with Less Number of Power Elements" IEEE conference 2011.
5. S. S. Shema, I. Daut, M. Irwanto, Shatri C., N. Syafawati, N. Ashbahani, Study of inverter design and topologies
for photovoltaic system, International conference on electrical, control and computer engineering, june 21-22,
2011, 501-504.
6. P. K. Chaturvedi, Shailendra K. Jain, Pramod Agarwal, Investigations on different Multilevel Inverter Control
Techniques by simulation, IEEE trans. 2006, 2, 1-6.
7. Ned Mohan, Tore M. Undeland, William P. Robbins, Power Electronics- Converters, Applications and Design,
second edition, John Wiley & sons Inc., 1995.

Comparative Study of Various Cascaded H-Bridge Multilevel Inverter Topologies 61
www.tjprc.org [email protected]
8. Rashid MH. Power electronics handbook. Florida, USA: Academic Press; 2001.
9. Zhong Du1, Leon M. Tolbert 2,3, John N. Chiasson2, and Burak Özpineci3,” A Cascade Multilevel Inverter
Using a Single DC Source”, Applied Power Electronics Conference and Exposition, 2006. APEC '06.
Twenty-First Annual IEEE, PP-426-430.
10. ETSAP, "MARKAL", “Energy Technology Systems Analysis Programme,” Energy Research Centre of the
Netherlands (ECN), Petten, The Netherlands, December 2001.