
11. Electrical - IJEEER - -Electronic Waste Concerns of Lighting - Umesh Kumar - OPaid (1)
Upload
tjprc-publicationsCategory
view
220download
0
8/12/2019 2. Biotech - Ijbtr -Development and Kinetic Validation - Padmarajaiah Nagaraja - Opaid
http://slidepdf.com/reader/full/2-biotech-ijbtr-development-and-kinetic-validation-padmarajaiah-nagaraja 1/14
www.tjprc.org [email protected]
International Journal of Bio-Technology
and Research (IJBTR)
ISSN(P): 2249-6858; ISSN(E): 2249-796X
Vol. 4, Issue 3, Jun 2014, 9-22
© TJPRC Pvt. Ltd.
DEVELOPMENT AND KINETIC VALIDATION OF BIO-CATALATIC PATHWAY FOR
THE QUANTIFICATION OF CATALASE ACTIVITY USING 3-METHYL-2
BENZOTHIAZOLINEHYDRAZONE HYDROCHLORIDE AND PYROCATECHOL AS A
CHROMOGENIC CO-SUBSTRATES
PADMARAJAIAH NAGARAJA1, NELLIGERE ARKESWARAIAH CHAMARAJA
2, HONNUR KRISHNA
3,
NARAYANAN ARADHANA4 & ANANTHARAMAN SHIVAKUMAR
5
1,2,3,4Department of Studies in Chemistry, University of Mysore, Manasagangotri, Mysore, Karnataka, India
5ST. Philomena’s College, PG Department of Chemistry, Mysore, Karnataka, India
ABSTRACT
A kinetic model describing the assay of catalase (CAT) activity on hydrogen peroxide using pyrocatechol (PC)
and 3-methyl-2 benzothiazolinehydrazone hydrochloride (MBTH) is presented. This model is based on the oxidation of PC
by H2O2 in presence of catalase to form quinone, which couples with oxidized MBTH resulting in intense red chromogenic
product having maximum absorbance at 500 nm. Hence the activity of catalase was directly measured by the formation of
the coupled product. The catalase assay was drawn-out by the kinetic response of the MBTH-PC system.
The quantification of catalase was linear over 0.14 – 3.46 EU with a correlation coefficient of 0.996. This assay was adopted
for the quantification of H2O2 between 0.60 and 9.62 mM. The catalytic efficiency, catalytic power and catalytic constant
(k cat) of the catalase were 1.16 ×10⁶ M
-1 min
-1, 3.25×10
-5 min
-1and
0.1161 min
-1respectively. The method was tested with
some microbes and also compared with L. Goth system.
KEYWORDS: Pyrocatechol, 3-Methyl-2 Benzothiazolinehydrazone Hydrochloride, Catalase, Microorganisms
INTRODUCTION
Catalase (H2O2: H2O2 Oxidoreductase, EC1.11.1.6) is the enzyme commonly present in cells of plants, animals
and aerobic bacteria. It is a tetramer of polypeptide chain composed of more than 500 amino acids. Positioned within this
tetramer are four porphyrin heme groups, which are very similar to the familiar hemoglobin, cytochromes, chlorophylls
and nitrogen fixing enzymes. Catalase are closely related to peroxidases, both structurally and functionally having two
functions; it reacts ‘peroxidatically’ at low concentration of peroxide and ‘catalatically’ at high concentration of peroxide
(I. J. George Wang, et al, 1986). It promotes the conversion of H2O2; a powerful and potentially harmful oxidizing agent,
to water and molecular oxygen. It protects cells against potential oxidative damage from free radical formation and it has
one of the highest turnover rates compared to all enzymes [Van Lenteand, F, et al, 1990, Goth, L. et al, 2003].
Determination of catalase level in biological matrix is based on its activity measurement. In quantitative work,
this has referred to the activity of the purified enzyme. Several methods are available for measuring catalase activity and
most of them are modifications of the one reported by Chance and Herbert (Ukeda, H, et al, 2004). This method is based
on the amount of H2O2 decomposed by catalase, which is determined by measuring the decrease in the absorbance of H 2O2
at 240 nm, which is prone to interferences by other absorbers (Slaughter, M.R. et al, 2000). In this method the absorbance

8/12/2019 2. Biotech - Ijbtr -Development and Kinetic Validation - Padmarajaiah Nagaraja - Opaid
http://slidepdf.com/reader/full/2-biotech-ijbtr-development-and-kinetic-validation-padmarajaiah-nagaraja 2/14
10 Padmarajaiah Nagaraja, Nelligere Arkeswaraiah Chamaraja,
Honnur Krishna, Narayanan Aradhana & Anantharaman Shivakumar
Impact Factor (JCC): 2.8872 Index Copernicus Value (ICV): 3.0
is measured at very low wavelength region, hence correct absorbance value is not very often obtained due to interferences
by endogenous and exogenous UV-absorbing component present in or added to the biological sample. Regrettably, the UV
photometric method is also not straightforwardly applicable to complex samples displaying strong intrinsic absorption at
240 nm (Wu. Meng, et al, 2003). The catalase in blood and tissue is quantified by several methods, which include theconventional titrimetric method of analysis (Aebi, H. 1984), micro titer plate assay method (Humphreys, D.T et al, 1999),
amperometric method using Clark oxygen electrode (Yamazaki, S.I., et al, 2004), two-mixer quenched - flow technique of
Ogura (Ogura, Y. 1955), HPLC method (Bohmer, A. et al, 2011), chemiluminescence (Mueller, S. et al, 1997), cyclic
voltammetry (Huang, K. J. et al, 2011), polarographic (Rigo, A. et al, 1977), electrochemical impedance spectroscopy
(Shamsipur, M. et al, 2012) and manometric method (Siqueira, A.J.S. et al, 1999). The titrimetric and micro titer plate
assays lack accuracy and precession whereas the amperometric method is not economical and tedious. In quenched-flow
technique the reaction time is in the range of 0.1-0.4 sec with a very high enzyme concentration (0-12 µM) and in
manometric method, catalase activity is determined with a very low enzyme concentration.
The assay of catalase activity at very low catalase concentrations as per Jones and Suggett analysis (Jones, P. et al,
1968) presents severe difficulties, and the work by Irwin W. Sizer (Sizer, I. W., 1944) suggested substantial thermal
deactivation of catalase. A systematic kinetic study of catalytic action at high substrate concentration requires both
maximal precision in the estimation of extent of reaction and isothermal conditions. (Peter, J.A et al, 1968) Another
method developed (Lewis, E.M. et al, 2009) involved the catalytic decomposition of H2O2 by using a computer-interfaced
pressure sensor to follow the evolution of O2 (g) inside a closed reaction vessel. This required the electronic
pressure-sensor, which is not economical and not easy to handle. HPLC, chemiluminescence, cyclic voltammetry,
polarographic, electrochemical impedance spectroscopy and these experiments are either very expensive or less versatile,
and moreover the methods are often complicated and expensive to implement. The selectivity of the luminescence is poor.One of the drawbacks of electrochemical sensors is the interference by oxidation or reduction of other compounds at the
working potential and also, electro-analytical technique needs several steps to immobilize the enzyme on a solid support,
which may reduce the enzyme activity (15 %) resulting in the waste of expensive biocatalyst, and it is also a time
consuming process (Mueller, S. et al, 1997).
In the present investigation, an attempt was made to develop a simple, rapid, low cost and sensitive
spectrophotometric method for the assay and kinetic study of catalase present in some microbes, by using nontoxic
materials like MBTH and PC for the assay of catalase. Therefore this work was aimed at the assay of catalase and H 2O2 at
very narrow range of concentrations.
MATERIALS AND METHODS
Chemical Reagents and Their Preparation
All the chemicals used in the assay were of analytical grade. MBTH and PC were purchased from Sigma-Aldrich
and Merck, Germany respectively. MBTH (4.5 mM) and PC (18.0 mM) solutions were prepared by dissolving a requisite
quantity in distilled water. Catalase (bovine liver, EC 1.11.1.7, 4326 units/mg) was purchased from Sigma-Aldrich,
Germany and its solution was prepared by dissolving 10 mg in 5 mL of distilled water. It was used as a standard stock
solution and stored at 4oC. Further dilution was made with double distilled water when required. H2O2 (30%) was
purchased from E Merck, Mumbai, India. The 8% v/v H2O2 stock solution was prepared daily and its concentration was
standardized by titration with secondary standard potassium permanganate (Vogel, A.I. 2006). Tris buffer (0.5 M) of

8/12/2019 2. Biotech - Ijbtr -Development and Kinetic Validation - Padmarajaiah Nagaraja - Opaid
http://slidepdf.com/reader/full/2-biotech-ijbtr-development-and-kinetic-validation-padmarajaiah-nagaraja 3/14
Development and Kinetic Validation of Bio-Catalatic Pathway for the Quantification of Catalase Activity Using 3-Methyl-2 11
Benzothiazolinehydrazone Hydrochloride and Pyrocatechol as a Chromogenic Co-Substrates
www.tjprc.org [email protected]
pH 9.8 was prepared by dissolving 1.514 g of tris (hydroxyl methyl) methyl amine [2-amino, 2-(hydroxyl methyl)
propane-1-3-diol] in 25 mL using distilled water. Double-distilled water was used throughout the experiment. All solutions
were preserved under temperature range of 0-10oC.
Instrumentation
A Jasco model UVIDEC-610 ultraviolet – visible (UV – Vis) spectrophotometer with 1.0-cm matched cells was
used for all absorbance measurements. A water bath shaker (NSW 133, New Delhi, India) was used to maintain constant
temperature for color development. All pH measurements and adjustments were done by a digital pH meter
(model EQ-614, Equip-tronics, Mumbai, India).
Procedure for Inoculum Preparation
At least three to five well-isolated colonies having same morphological types were selected from agar plate culture
plates of Staphylococcus aureus, Bacillus subtilis, and Pseudomonas aeruginosa. The top of each colony was touched with a
sterilized loop, and the growth was transferred aseptically into a tube containing 4 to 5 mL of sterile Mueller-Hinton broth
medium. The broth culture was incubated at 35C until it achieved or exceeded the turbidity of 0.5 McFarland standards.
McFarland standards are used as a reference to adjust the turbidity of bacterial suspensions so that the number of bacteria will
be within a given range. The turbidity of the actively growing broth culture was adjusted with sterile Mueller-Hinton broth to
obtain turbidity optically comparable to that of 0.5 McFarland standards aseptically. This resulted suspension containing
1 to 2 × 10⁸ bacteria / mL
THEORY
Kinetic Model for the Evaluation of Michaelis-Menten Constant for MBTH and PC
To assess the kinetic parameters, the following experimental conditions were maintained in the reaction:
tris buffer of pH 9.8 (50.0 mM), temperature 30oC and reaction time 5 min. The enzyme concentration was maintained at
1.15 EU per 3 mL of reaction mixture. In the presented method, separate experiment for each H2O2 concentration was
performed with varying concentration of MBTH and PC. Michaelis - Menten constants at concentrations from 0.0570 to
0.1426 mM for MBTH and 0.1513 to 0.6054 mM for PC were determined. The H2O2 concentrations of 3.85, 5.77, 7.70 and
9.62 mM with MBTH and 2.40, 4.81, 7.21 and 9.62 mM with PC in the final volume of 3 ml were used for each kinetic
study. The pH and temperature were kept constant. The kinetic mechanism followed by catalase can be confirmed by the
plot of 1/ [H2O2] versus Vmax/V0 concentrations at different H2O2 concentrations. Assuming the initial rate as (V0), a
general equation for the mechanism in the forward direction is given as a function of all substrate concentrations. By
rearrangement of Henri-Michaelis-Menten equation into a linear form, we get
.11
max0max0max0max0
22
V P
K
V M
K
V H
K
V V
PC
m MBTH
m
O H
m
(1)
Rearranging the above equation we get,
.10000
max22
P
K
M
K
H
K
V
V PC
m
MBTH
mO H
m (2)

8/12/2019 2. Biotech - Ijbtr -Development and Kinetic Validation - Padmarajaiah Nagaraja - Opaid
http://slidepdf.com/reader/full/2-biotech-ijbtr-development-and-kinetic-validation-padmarajaiah-nagaraja 4/14
12 Padmarajaiah Nagaraja, Nelligere Arkeswaraiah Chamaraja,
Honnur Krishna, Narayanan Aradhana & Anantharaman Shivakumar
Impact Factor (JCC): 2.8872 Index Copernicus Value (ICV): 3.0
Evaluation of the Michaelis- Menten constant of the MBTH and PC were carried out by the plot of V max/V0 and
1/H0 with an intercept,
.100 P
K
M
K Intercept
PC
m MBTH
m (3)
The plot of corresponding intercept of MBTH versus 1/M0 resulted in slope MBTH
m K and the corresponding
intercept of PC versus 1/P0 resulted in slope PC
m K .
RESULTS
Experimental Protocol Conducted For the Quantification of Hydrogen Peroxide
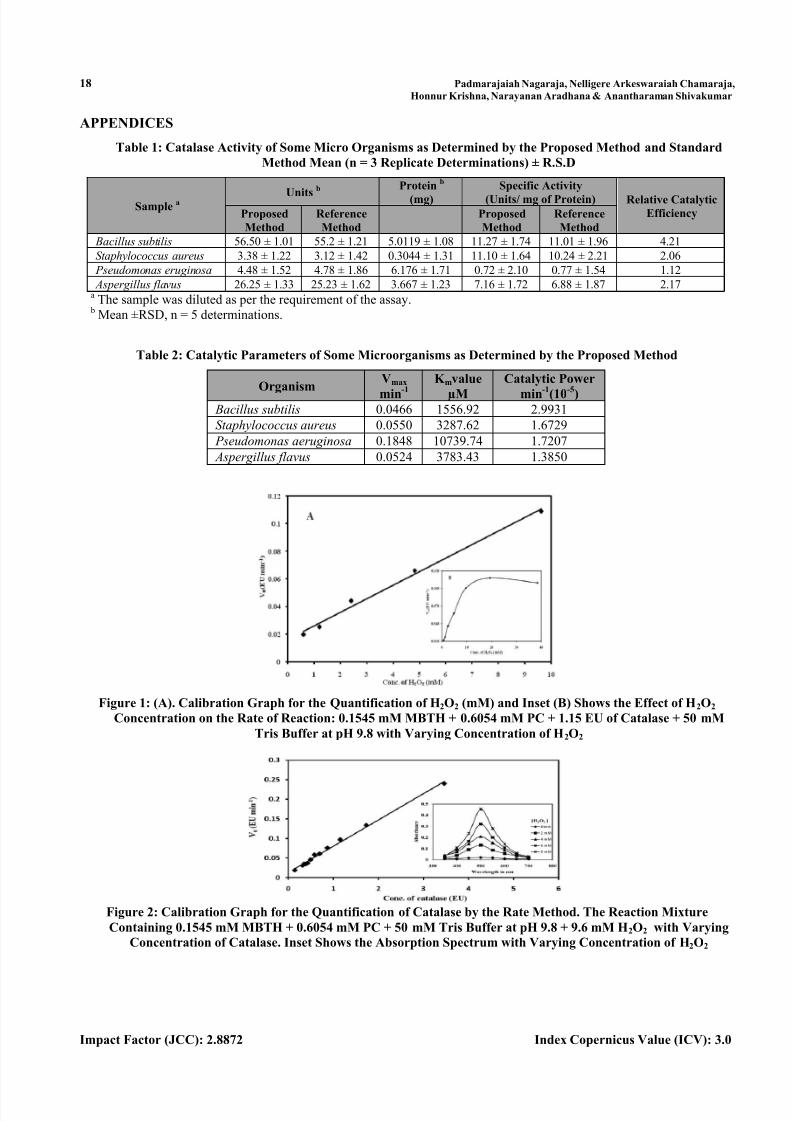
The linearity for the assay of H2O2 was determined in 3 mL of the solution containing 0.1545 mM MBTH,
0.6054 mM PC, and 1.15 EU of catalase in 50 mM tris buffer at pH 9.8. The reaction was initiated at 300
C by adding 100
μL of varying concentrations of H2O2 within the linearity range. The change in absorbance was continuously recorded at
500 nm. The initial rate was then plotted against the concentration of H2O2 resulted a straight line equation
V0 = 0.009 [H2O2] + 0.016 with a correlation coefficient of 0.992. The linearity of the graph was found between 0.6 and
9.62 mM H2O2. The calibration graph for the quantification of H2O2 is shown in Figure 1.
Experimental Protocol Conducted for the Quantification of Catalase
The change in absorbance with respect to time for the quantification of catalase was measured continuously for
5 min in a 3 mL reaction mixture containing 0.1545 mM MBTH, 0.6054 mM PC, and 9.620 mM H 2O2 in tris buffer at
pH 9.8 were taken. The reaction was initiated by adding 100 μM of varying concentrations of catalase enzyme. The change
in absorbance was continuously recorded at 30°C against the corresponding control containing all the reagents except
catalase. The initial velocity (V0 expressed in terms of EU min-1
) was recorded by the absorbance-time curve. The rate
verses the units of catalase followed a linearity equation V0 = 0.067 CAT units + 0.013 with a correlation coefficient
0.994. The calibration plot for the quantification of catalase is shown in Figure 2. The range for linear relationship between
the initial velocity and the concentration of catalase was 0.14-3.46 EU from the rate method. In fixed time method 10 min
of incubation of the reaction mixture containing all the reagents at the same pH at 30°C
allowed the catalase to be assayed
at concentration range of 0.03-0.35 EU. The linear relationships by the rate and fixed time methods are shown in Figure 3
Unit of Enzyme
One unit of enzyme is defined as that amount of enzyme, which utilizes 1 µmol of H2O2 for the coupling of
1 µmol of MBTH and 1 µmol of PC to form red colored coupled product per min under the standard assay conditions.
Protein Determination
The total protein concentration was determined in triplicate by Lowry method (Koc, O. et al, 2010), using bovine
serum albumin as standard.
DISCUSSIONS
Absorption Spectrum of Hydrogen Peroxide
The absorption spectrum of the colored solution produced at 2, 4 and 8 mM concentrations of H2O2 was measured
by the recommended general experimental protocol in a final 3 mL of reaction mixture and the spectrum was recorded at a
scan rate of 2 nm/s after incubating the reaction mixture for 5 min at 30 °C on a spectrophotometer in the wavelength range

8/12/2019 2. Biotech - Ijbtr -Development and Kinetic Validation - Padmarajaiah Nagaraja - Opaid
http://slidepdf.com/reader/full/2-biotech-ijbtr-development-and-kinetic-validation-padmarajaiah-nagaraja 5/14
Development and Kinetic Validation of Bio-Catalatic Pathway for the Quantification of Catalase Activity Using 3-Methyl-2 13
Benzothiazolinehydrazone Hydrochloride and Pyrocatechol as a Chromogenic Co-Substrates
www.tjprc.org [email protected]
400 – 800 nm against the corresponding reagent blank. The optimum wavelength for maximum absorption of the colored
product was 500 nm. The spectrum in the absence of H2O2 and enzyme showed negligible absorption. The result is
graphically presented as the inset in Figure 2.
Optimization of the Experimental Conditions for Maximum Activity of Enzyme Assay
Optimizations of experimental conditions parameters such as effect of substrates, co-substrates, different buffer
concentrations of pH 3.5 – 10.0, temperature and incubation period, which affect enzyme assay, have been studied.
Effect of Hydrogen Peroxide
The effect of different concentrations of H2O2 on the rate of reaction was studied, where rate increased linearly up
to 9.62 mM concentration of H2O2 beyond which the rate increases gradually and become independent of the concentration
due to the enzyme getting saturated. Although at higher concentration of H2O2, the reaction rate increased, but the change
in the rate was very small. Hence it is decided to have a final H 2O2 concentration of 9.62 mM in 3 mL of the reaction
mixture. The effect of H2O2 on the rate of reaction is shown as inset of Figure 1.
Effect of MBTH and PC
The effect of varying concentrations of MBTH and PC was studied and the results showed that the rate increased
on increasing the concentration of MBTH from 0.0193 mM to 0.1545 mM beyond which it inhibited the rate. Hence for all
further assays MBTH concentration of 0.1545 mM was selected. Similarly, the effect of PC concentration on the reaction
rate was studied from 0.0378 mM to 2.4216 mM. The linearity was observed up to 0.6054 mM, above this concentration
there was no effect on the rate. Hence 0.6054 mM was selected as the optimized concentration for all further analysis.
The plots of reaction rate versus concentration of MBTH and PC are shown in Figure 4
Effect of Temperature on the Sensitivity of Enzyme Assay
Temperature sensitivity was determined by pre-incubating 0.1545 mM MBTH, 0.6054 mM PC, 9.62 mM
H2O2, and 1.15 EU catalase in 50 mM tris buffer of pH 9.8 for 10 min at different temperatures (0-800C). The activity of
the enzyme was registered as a function of absorbance of the colored solution. The activity initially increased up to
300C and gradually decreased thereafter. Figure 5 depicts the percentage activity at different temperatures with reference
to the enzyme activity at 30◦C.
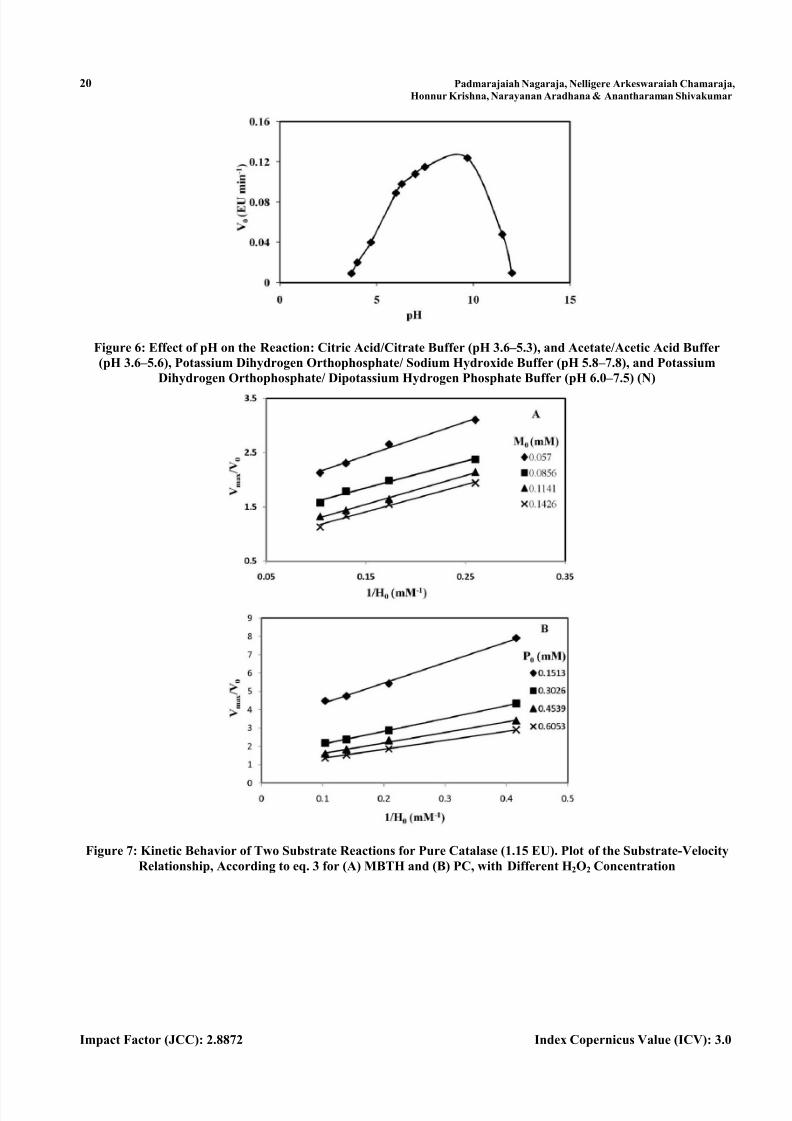
Effect of pH and Concentration of Buffer Solutions
Since the rate of color generation primarily depends on pH, we examined the following buffers at 0.5 M for the
assay namely, citric acid/potassium citrate at pH 3.6-5.6, acetate/acetic acid at pH 3.6-5.6, potassium dihydrogen phosphate/sodium hydroxide at pH 6.0-8.0, potassium dihydrogen orthophosphate/dipotassium hydrogen orthophosphate at
pH 6.0-7.5 and a tris buffer at pH 9.8. The highest activity of the enzyme was observed in 50 mM tris buffer of pH 9.8.
Hence, further studies were carried out at this pH. The response of the enzymatic activity with reference to pH is shown in
Figure 6.
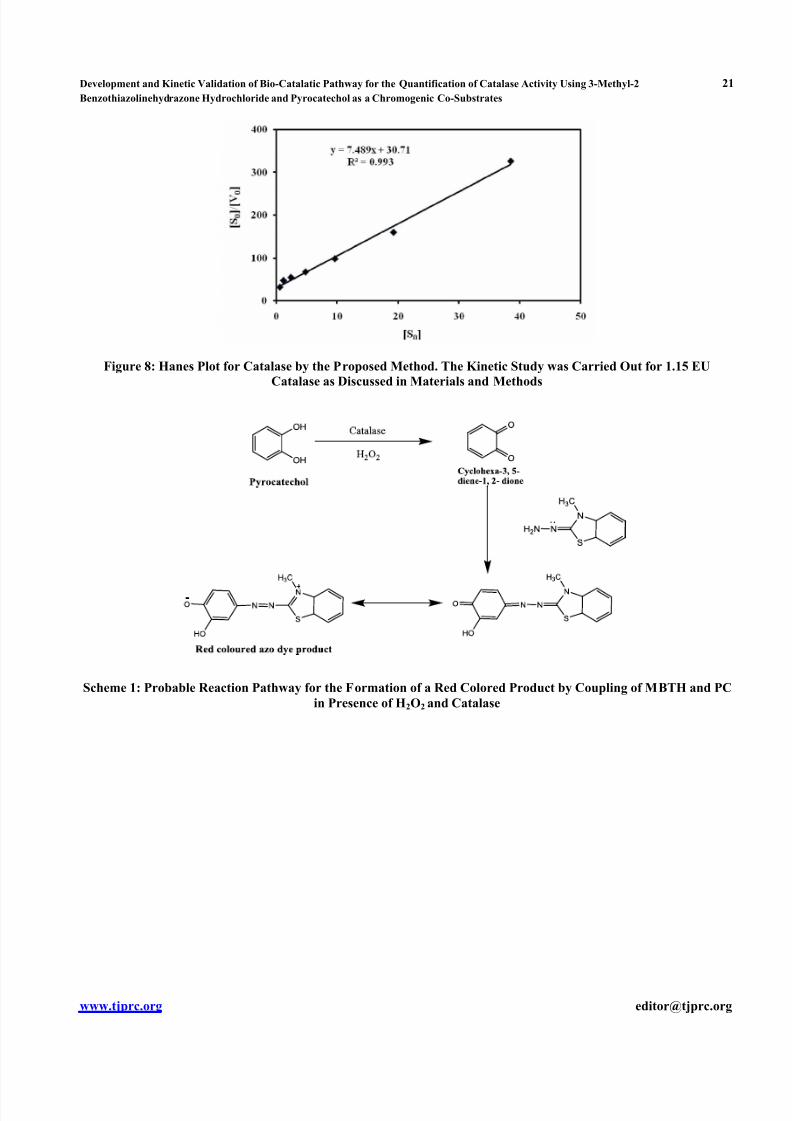
Discussion of Proposed Reaction Pathway for the Enzyme Activity Response
A possible mechanism for the catalase-catalyzed reaction of MBTH and PC in presence of H2O2 involved the
biocatalatic coupling of the reactants as proposed in Scheme 1. Catalase is relatively unique compared to other members of
the peroxidase family since it displays both catalase activity and peroxidase activity (Wu, M. et al, 2003) , hence the

8/12/2019 2. Biotech - Ijbtr -Development and Kinetic Validation - Padmarajaiah Nagaraja - Opaid
http://slidepdf.com/reader/full/2-biotech-ijbtr-development-and-kinetic-validation-padmarajaiah-nagaraja 6/14
14 Padmarajaiah Nagaraja, Nelligere Arkeswaraiah Chamaraja,
Honnur Krishna, Narayanan Aradhana & Anantharaman Shivakumar
Impact Factor (JCC): 2.8872 Index Copernicus Value (ICV): 3.0
enzymatic mechanism is analogous to that suggested by Setti et al (Setti, L. et al, 1998) for the HRP-catalyzed oxidative
coupling of MBTH and phenolic compounds with the formation of azo-dye. In the proposed reaction, the process involves
the double-displacement mechanism for the H2O2 and electron donating phenolic compound (Mello, L.D., et al, 2003).
The catalase is first oxidized by H2O2 and then reduced by phenolic compounds. The phenolic compounds are converted toquinones (Shivakumara, A., et al, 2011). In the presence of H2O2, MBTH undergoes peroxidation reaction to form MBTH
radical cation (Nagaraja, P., et al, 2009) which gets coupled with quinone to form a red colored azo-dye product
(scheme-1), showing a strong absorption at 500 nm. The kinetic mechanism in which catalytic coupling between
MBTH and PC involving different Michaelis-Menten values cannot over rule the activation of both by a bio catalytic
mechanism. Both MBTH and PC could be activated on the same or different catalytic sites through reduction, finally
involving the reaction between the two activated reactants. The bimolecular reaction catalyzed by an enzyme involves the
formation of an intermediate with any one of the reactants, followed by the reaction of the intermediate with another
reactant. Either of these two could become a rate-determining factor.
Evaluation of Kinetic Parameters for the Enzyme Assay
Kinetic parameters for the enzyme assay were studied under the optimized experimental conditions. Equation 1
was used to set up the kinetic mechanism and to obtain the Michaelis-Menten constant values for all the substrates. In the
proposed assay, evaluation of Michelis-Menten constant of MBTH, various H2O2 concentrations at different fixed
concentrations of MBTH were used. The MBTH concentrations that were used in the assay are 0.0570, 0.0856, 0.1141 and
0.1426 mM. The rates of the reaction were measured at different H2O2 concentrations namely 3.85, 5.77, 7.70 and
9.62 mM with a constant 0.6054 mM PC concentration. The rates of each of the H 2O2 concentration at one fixed
concentration of MBTH were evaluated. The intercept obtained by the plot of the 1/H 0 versus Vmax/V0 of the reaction at
different MBTH concentrations were evaluated according to the equation (2), as shown in the figure 7 (panel A). Similarlyfor the evaluation of Michaelis – Menten constant of PC, various H2O2 concentration at different fixed concentration of
PC were used. The PC concentrations that were used in the assay 0.1513, 0.3026, 0.4539 and 0.6053 mM. The rates of the
reaction were measured at different H2O2 concentrations namely 2.40, 4.81, 7.21 and 9.62 mM with a constant 0.1426 mM
MBTH concentration. The rates of each of the H2O2 at one fixed concentration of PC were evaluated. The intercept
obtained by the plot of the 1/H0 versus Vmax/V0 of the reaction at different PC concentration were evaluated according to
the equation (2), as shown in the figure 7 (panel B). The replots of the intercepts of panels A and B of Figure 7 versus the
reciprocal concentration of H2O2 also give a constant slope (figure not shown). The MBTH
m K and PC
m K were found to be 80
µM and 487 µM, respectively. The value of22O H
m K and Vmax was calculated from the Hanes plot (Figure 8), of
H2O2 concentration ranging from 0.6 to 38.49 mM. The Hanes plot starts with the Lineweaver – Burk equation,
max0max0
11.
1 22
V S V
K
V
O H
m Or
max
0
max0
0
22
][1][
V
K S
V V
S O H
m
Where slope = 1/ Vmax and intercept =
max
22
V
K O H
m .

8/12/2019 2. Biotech - Ijbtr -Development and Kinetic Validation - Padmarajaiah Nagaraja - Opaid
http://slidepdf.com/reader/full/2-biotech-ijbtr-development-and-kinetic-validation-padmarajaiah-nagaraja 7/14
Development and Kinetic Validation of Bio-Catalatic Pathway for the Quantification of Catalase Activity Using 3-Methyl-2 15
Benzothiazolinehydrazone Hydrochloride and Pyrocatechol as a Chromogenic Co-Substrates
www.tjprc.org [email protected]
According to Hanes the plot of [S0]/V0 versus [S0] gives a linear equation 71.30][489.7][
0
0
0 S
V
S with
regression co-efficient of 0.993. The 22O H
m K and Vmax values were found to be 4099 μM and 0.1335 EUmin-1
respectively.
The 22O H
m K value of the coupling reaction was 4099 µM, which reflects the higher number of interactions between MBTH
- PC and the heme group at the active site. The catalytic efficiency][
1
E slope, catalytic power
m K
V ma x
and catalytic
constant (k cat) =
t
m
E
V
][ of the proposed MBTH – PC system was calculated by a general kinetic procedure using
0.1545 mM MBTH, 0.6054 mM PC, 50 mM tris buffer of pH 9.8 and 1.15 EU catalase in 3 ml of reaction mixture were
found to be 0.11 × 10⁶ M
-1 min
-1, 3.26× 10
-5 min
-1and 0.1161 min
-1, respectively.
APPLICATION
The developed method was successfully applied to study catalase in some microbes such as Bacillus subtilis,
Staphylococcus aureus, Pseudomonas aeruginosa, and Aspergillus flavus. Microbial inoculums were prepared as described
earlier. For the assay of catalase in microbes, we took 0.1545 mM MBTH, 0.6054 mM PC, 9.620 mM H2O2 and
100 µL sample after proper dilution with 50 mM tris buffer of pH 9.8 in 3 ml of reaction mixture, as described in the
developed procedure, and absorbance was measured at 500 nm. The activity of the sample was quantified by considering
the standard absorbance. The accuracy of the proposed method was assessed by comparing the results obtained with a
reference CAT assay method (Góth, L., 1991). Also catalytic activity of CAT has been evaluated in the samples.
The results obtained by these two methods for the analysis of micro organism samples are indicated in Table 1. Catalytic
power, V max and K m values for the samples are shown in Table 2.
CONCLUSIONS
The developed method is simple, rapid, reliable, and highly sensitive for the assay of catalase in microbes which
involves coupling of oxidized PC and MBTH using H2O2. Co-substrates used are easily available, economical,
water-soluble, have good catalytic efficiency, and the coupled product gets absorbed at a longer wavelength (500 nm)
which enables to avoid the background interference caused by the biological constituents than the L. Goth method
(Góth, L.,1991). The kinetic study of the system showed instantaneous color formation, and it requires only small
quantities of colorimetric reagents. Optimization of the reaction conditions from the enzymatic oxidation allowed the
determination of H2O2 from 0.6 to 9.62 mM. This catalytic reaction in presence of peroxide allowed spectrophotometric
determination of catalase within the linearity range of 0.14-3.45 EU and 0.03 - 0.34 EU by the kinetic and fixed time
methods, respectively in 3 ml solution. This linear dependence between the concentration of catalase and the absorbance
over a narrow range is also an important feature for the practical application of the assay procedure. The proposed method
is more sensitive than the INH- PC system developed earlier by our group [27] in which the linearity of the catalase activity
and H2O2 were in the range of 0.2 – 7.0 units and 1.76 – 7.0 mM, respectively in 3 ml solution. The kinetic study shows that
the Michaelis – Menten constant 22O H
m K for the projected method is 4.09 mM which is less than our previous

8/12/2019 2. Biotech - Ijbtr -Development and Kinetic Validation - Padmarajaiah Nagaraja - Opaid
http://slidepdf.com/reader/full/2-biotech-ijbtr-development-and-kinetic-validation-padmarajaiah-nagaraja 8/14
16 Padmarajaiah Nagaraja, Nelligere Arkeswaraiah Chamaraja,
Honnur Krishna, Narayanan Aradhana & Anantharaman Shivakumar
Impact Factor (JCC): 2.8872 Index Copernicus Value (ICV): 3.0
INH – PC system. This indicates that there is stronger affinity of active site of PC and MBTH to that of H 2O2 molecules
which signifies selectivity and specificity of the proposed assay method. This method was successfully applied to the assay
of catalase in some selected microorganisms.
ACKNOWLEDGEMENTS
One of the authors (Chamaraja N.A) thanks university of Mysore, Mysore, Karnataka, India for providing
research facilities.
REFERENCES
1. George Wang, I. J. & Daniel Fung, Y. C. (1986). Significance of bacterial catalase in food microbiology:
A review, journal of food safety, 8, 47 - 67.
2. Van Lenteand, F. & Pepoy, M. (1990). Coupled-Enzyme Determination of Catalase Activity in Erythrocytes,
Clin. Chem., 36, 1339 – 1343.
3. Goth, L. & Vitai, M. (2003). The effects of hydrogen peroxide promoted by homocysteine and inherited catalase
deficiency on human hypocatalasemic paients. Free Radic. Biol. Med., 35, 882 – 888.
4. Ukeda, H., Adachi, Y. & Sawamura, M. (2004). Flow-injection assay of catalase activity, Anal. Sci., 20, 471- 474.
5. Slaughter, M.R. & P.J.O. Brien. (2000). Fully-automated spectrophotometric method for measurement of
antioxidant activity of catalase, Clin. Biochem. 33, 525 – 534.
6. Wu. Meng, Zhihong Lin, & Otto, S. W. (2003). Determination of the activity of catalase using a europium
(III) – tetracycline-derived fluorescent substrate, Anal.Biochem., 320, 129 – 135.
7. Aebi, H. (1984). Catalase in vitro, Methods Enzymol., 105, 121 – 126.
8. Humphreys, D.T, Carver, J.A., Smith, S.B.E. & Wilson, M.R. (1999). Clusterin has chaperone-like activity
similar to that of small heat shock proteins, J. Biol. Chem., 274, 6875 - 6881.
9. Yamazaki, S.I., Morioka, C. & Itoh, S. (2004). Kinetic evaluation of catalase and peroxygenase activities of
tyrosinase, Bio. Chem., 43, 11546 - 11553.
10. Ogura, Y. (1955). Catalase activity at high concentration of hydrogen peroxide, Arch. Biochem. Biophys.,
57, 288 – 300.
11. Bohmer, A., Jordan, J. & Tsikas, D. (2011). High-performance liquid chromatography ultraviolet assay for human
erythrocytic catalase activity by measuring glutathione aso-phthalaldehyde derivative, Anal. Biochem., 410
296 – 303.
12. Mueller, S., Riedel, H.D. & Stremmel, W. (1997). Determination of Catalase Activity at Physiological Hydrogen
Peroxide Concentrations, Anal. Biochem, 245, 55 - 60.
13. Huang, K. J., Niu, D.J. & Liu, X. (2011). Direct electrochemistry of catalase at amine-functionalized
graphene/gold nanoparticles composite film for hydrogen peroxide sensor. Electrochimica Acta; 56, 2947-2953.
14. Rigo, A., & Rotilio, G. (1977). Simultaneous determination of superoxide dismutase and catalase in biological
materials by polarography, Anal. Biochem., 81, 157 – 166.

8/12/2019 2. Biotech - Ijbtr -Development and Kinetic Validation - Padmarajaiah Nagaraja - Opaid
http://slidepdf.com/reader/full/2-biotech-ijbtr-development-and-kinetic-validation-padmarajaiah-nagaraja 9/14
Development and Kinetic Validation of Bio-Catalatic Pathway for the Quantification of Catalase Activity Using 3-Methyl-2 17
Benzothiazolinehydrazone Hydrochloride and Pyrocatechol as a Chromogenic Co-Substrates
www.tjprc.org [email protected]
15. Shamsipur, M., Asgari, M., Maragheh, M.G. & Moosavi-Movahedi, A.A. (2012). A novel impedimetric
nanobiosensor for low level determination of hydrogen peroxide based on biocatalysis of catalase,
Bioelectrochemistry, 83, 31 – 37.
16. Siqueira, A.J.S., Remião, J.O., Azevedo, A.M.P. & Azambuja, C.R.J. (1999). A gasometric method to determine
erythrocyte catalase activity, Braz. J. Med. Biol. Res., 32, 1089 – 1094.
17. Jones, P. & Suggett, A. (1968). The catalase – hydrogen peroxide system. Role of sub-units in the thermal
deactivation of bacterial catalase in the absence of substrate, Bio. Chem. J. 108, 833 – 838.
18. Sizer, I. W. (1944). Temperature Activation and inactivation of the crystalline catalase-hydrogen, peroxide
system, J. Biol. Chem. 154, 461-473.
19. Peter, J.A. & Suggett, A. (1968).The catalase – hydrogen peroxide system. Kinetics of catalatic action at high
substrate concentrations, Bio. Chem. J., 110, 617 – 620.
20. Lewis, E.M., Levine, R.M., York J.T. & Tandy Grubbs, W. (2009). A Quick and Accurate Oxygen- Based
Pressure-Sensor Assay for Catalase Activity, J. Chem. Educ. 86, 1227 – 1230.
21. Mueller, S., Riedel, H.D. & W. Stremmel, (1997). Determination of Catalase Activity at Physiological Hydrogen
Peroxide Concentrations, Anal. Biochem. 245, 55 – 60.
22. Vogel, A.I. (2006) Vogel’s Text Book of Quantitative Chemical Analysis, sixth ed, Pearson Education Ltd, New
Delhi,
23. Koc, O. & Metin, K. (2010). Purification and characterization of a thermostable glucoamylase produced by
Aspergillus flavus HBF34, Afr. J. Biotechnol. 9, 3414 – 3424.
24. Wu, M., Lin, Z. & Wolfbeis, O. S. (2003). Determination of the activity of catalase using a
europium(III) – tetracycline-derived fluorescent substrate, Analytical Biochemistry, 320, 129 – 135.
25. Setti, L., Scali, S., Angeli, I.D. & Pifferi, P.G. (1998). Horse radish peroxidase - catalysed oxidative coupling of
3- methyl, 2- benzothiazolinone hydrazone and methoxy phenols, Enzym. Microb.Technol. 22, 656 - 661.
26. Mello, L.D., Sotomayor, M.D.P.T. &. Kuboto, L.T. (2003). HRP-based amperometric biosensor for the
polyphenols determination in vegetables extract, Sen. Actuators B. 96, 636 – 645.
27. Shivakumara, A., Nagaraja, P., Chamaraja, N. A., Honnur Krishna & Avinash, K. (2011). Determination of
catalase activity using chromogenic probe involving iso-nicotinicacidhydrazide and pyrocatechol, J. Biotechnol.
155, 406 – 411.
28. Nagaraja, P., Shivakumar, A., & Ashwinee Kumar Shrestha. (2009). Quantification of hydrogen peroxide and
glucose using 3-methyl-2-benzothiazolinonehydrazone hydrochloride with 10,11-dihydro-5H-benz(b, f)azepine as
chromogenic probe, Anal. Biochem, 395. 231 – 236.
29. Góth, L. (1991). A simple method for determination of serum catalase activity and revision of reference range,
Clinica Chimica Acta, 196, 143 – 152.
8/12/2019 2. Biotech - Ijbtr -Development and Kinetic Validation - Padmarajaiah Nagaraja - Opaid
http://slidepdf.com/reader/full/2-biotech-ijbtr-development-and-kinetic-validation-padmarajaiah-nagaraja 10/14

8/12/2019 2. Biotech - Ijbtr -Development and Kinetic Validation - Padmarajaiah Nagaraja - Opaid
http://slidepdf.com/reader/full/2-biotech-ijbtr-development-and-kinetic-validation-padmarajaiah-nagaraja 11/14
Development and Kinetic Validation of Bio-Catalatic Pathway for the Quantification of Catalase Activity Using 3-Methyl-2 19
Benzothiazolinehydrazone Hydrochloride and Pyrocatechol as a Chromogenic Co-Substrates
www.tjprc.org [email protected]
Figure 3: Calibration Graph for the Quantification of Catalase by ▲Rate Method and ■Fixed Time Method
Figure 4: Effect of MBTH and PC on the Reaction Rate
Figure 5: Effect of Incubation Temperature on the Reaction Rate
8/12/2019 2. Biotech - Ijbtr -Development and Kinetic Validation - Padmarajaiah Nagaraja - Opaid
http://slidepdf.com/reader/full/2-biotech-ijbtr-development-and-kinetic-validation-padmarajaiah-nagaraja 12/14
20 Padmarajaiah Nagaraja, Nelligere Arkeswaraiah Chamaraja,
Honnur Krishna, Narayanan Aradhana & Anantharaman Shivakumar
Impact Factor (JCC): 2.8872 Index Copernicus Value (ICV): 3.0
Figure 6: Effect of pH on the Reaction: Citric Acid/Citrate Buffer (pH 3.6 – 5.3), and Acetate/Acetic Acid Buffer
(pH 3.6 – 5.6), Potassium Dihydrogen Orthophosphate/ Sodium Hydroxide Buffer (pH 5.8 – 7.8), and Potassium
Dihydrogen Orthophosphate/ Dipotassium Hydrogen Phosphate Buffer (pH 6.0 – 7.5) (N)
Figure 7: Kinetic Behavior of Two Substrate Reactions for Pure Catalase (1.15 EU). Plot of the Substrate-Velocity
Relationship, According to eq. 3 for (A) MBTH and (B) PC, with Different H2O2 Concentration
8/12/2019 2. Biotech - Ijbtr -Development and Kinetic Validation - Padmarajaiah Nagaraja - Opaid
http://slidepdf.com/reader/full/2-biotech-ijbtr-development-and-kinetic-validation-padmarajaiah-nagaraja 13/14
Development and Kinetic Validation of Bio-Catalatic Pathway for the Quantification of Catalase Activity Using 3-Methyl-2 21
Benzothiazolinehydrazone Hydrochloride and Pyrocatechol as a Chromogenic Co-Substrates
www.tjprc.org [email protected]
Figure 8: Hanes Plot for Catalase by the Proposed Method. The Kinetic Study was Carried Out for 1.15 EU
Catalase as Discussed in Materials and Methods
Scheme 1: Probable Reaction Pathway for the Formation of a Red Colored Product by Coupling of MBTH and PC
in Presence of H2O2 and Catalase

8/12/2019 2. Biotech - Ijbtr -Development and Kinetic Validation - Padmarajaiah Nagaraja - Opaid
http://slidepdf.com/reader/full/2-biotech-ijbtr-development-and-kinetic-validation-padmarajaiah-nagaraja 14/14