55 Positive movement NatStats Conference 21 November 2008 Matt Johnson Executive Director Office of...
26
55 Positive movement NatStats Conference 21 November 2008 Matt Johnson Executive Director Office of the Executive Committee of Cabinet
-
date post
22-Dec-2015 -
Category
Documents
-
view
213 -
download
0
Transcript of 55 Positive movement NatStats Conference 21 November 2008 Matt Johnson Executive Director Office of...

55 Positive movement
NatStats Conference21 November 2008
Matt JohnsonExecutive DirectorOffice of the Executive Committee of Cabinet
55 Positive movement
Portfolio accountability+
Responsibility for whole-of-government outcomes
=Sustainable, healthy community
South Australia’s approach:A whole of state Strategic Plan
The Challenge
55 Positive movement
The PlanA comprehensive Plan with 6 targets:
• Growing Prosperity• Improving Wellbeing• Attaining Sustainability• Fostering Creativity• Building Communities• Expanding Opportunity
55 Positive movement
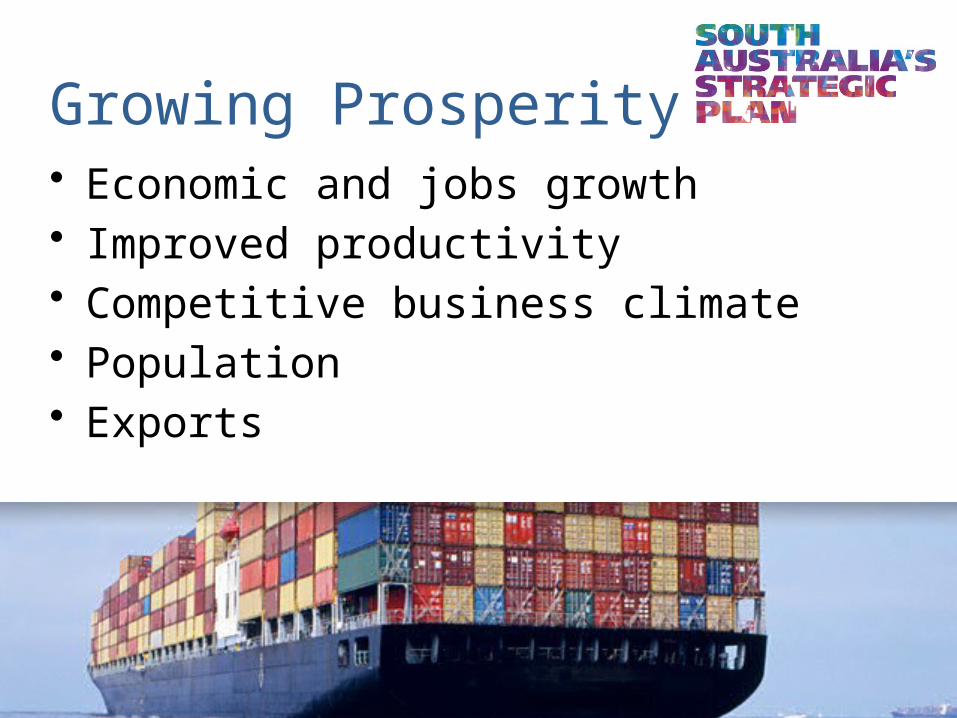
• Economic and jobs growth• Improved productivity• Competitive business climate• Population• Exports
Growing Prosperity

55 Positive movement
• Quality of life• Better health• Reduced crime• Better road safety
ImprovingWellbeing

55 Positive movement
• A healthier River Murray• Better managed water resources• Sustainable energy and reduced
greenhouse gas emissions• Protecting soil, plant, animal and
marine diversity
AttainingSustainability

55 Positive movement
Fostering Creativityand Innovation• Artistic creativity and participation• Technological innovation• Research and commercialisation• Promoting creative talent

55 Positive movement
• Strong and connected communities• Civic participation• Volunteering• Viability of regional communities
BuildingCommunities

55 Positive movement
• Ensuring all South Australians reach their potential
• Better housing, education, social inclusion, access and equity
ExpandingOpportunity
55 Positive movement
• The Plan is not a “magic wand”
• Strong supporting structures and a performance appraisal process
• Implementation plans and strategies for each target – fully costed, emphasising collaboration
Better PerformanceManagement

55 Positive movement
PublicAccountability• Measurement of progress against
targets: rigorous, regular and transparent
• Clear and accessible presentation of data
• Independent Audit Committee reports to the government and to the people of SA, every two years
55 Positive movement
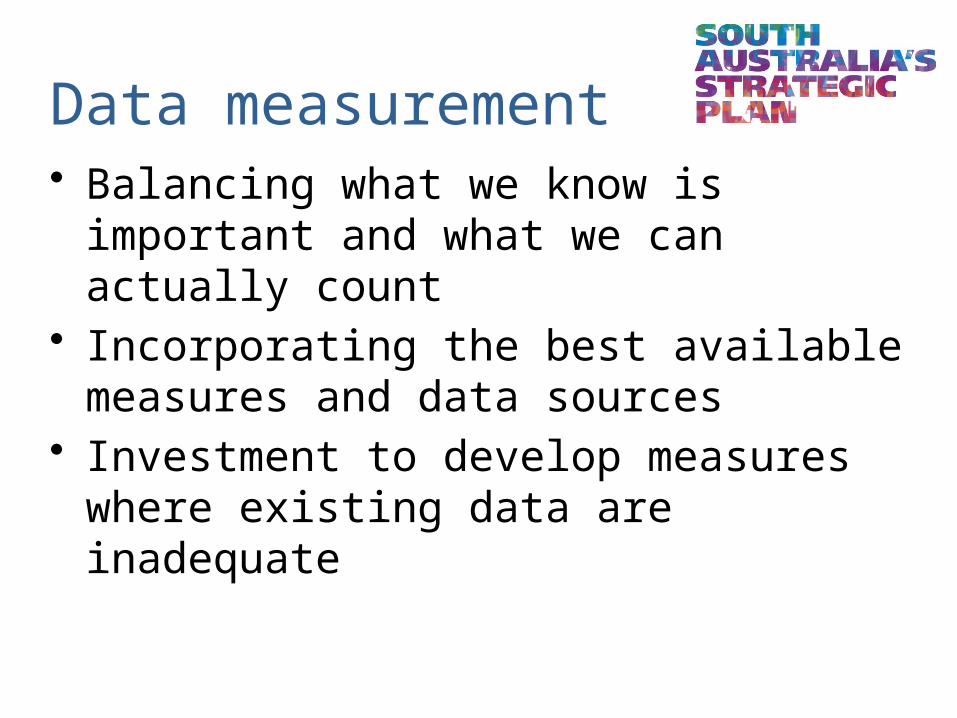
Data measurement• Balancing what we know is important
and what we can actually count• Incorporating the best available
measures and data sources• Investment to develop measures where
existing data are inadequate
55 Positive movement
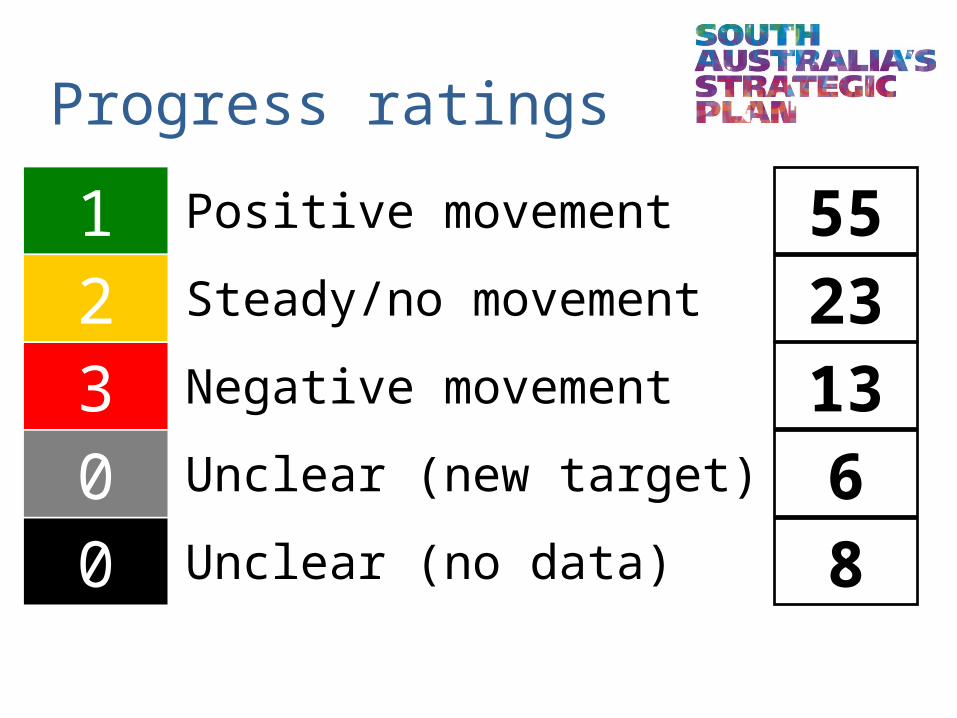
Progress ratings
21
300
2355
1368
Steady/no movement
Positive movement
Negative movement
Unclear (new target)
Unclear (no data)

55 Positive movement
Achievability ratings
32
400
348
26209
Within reach
On track
Unlikely
Unclear (new target)
Unclear (no data) 8
1 Achieved

55 Positive movement
Community Engagement• The Plan requires the involvement of
individuals, organisations and businesses beyond government
• Cultivating engagement through initiatives such as ‘Regionalisation’
• Disaggregated data helps us to engage specific communities

55 Positive movement
Growing ProsperityT1.18 Minerals production - Whole of State
Value of South Australian mineral production (2003 baseline)
0
500
1000
1500
2000
2500
3000
$ m
illi
on
Value 550.7 528.4 568.2 515.4 920.3 1261. 1023. 958.3 1012. 1584. 2370. 2496.
Target 3000
Baseline 2800
1995-96
1996-97
1997-98
1998-99
1999-00
2000-01
2001-02
2002-03
2003-04
2004-05
2005-06
2006-07
2007-08
2008-09
2009-10
2010-11
2011-12
2012-13
2013-14
55 Positive movement
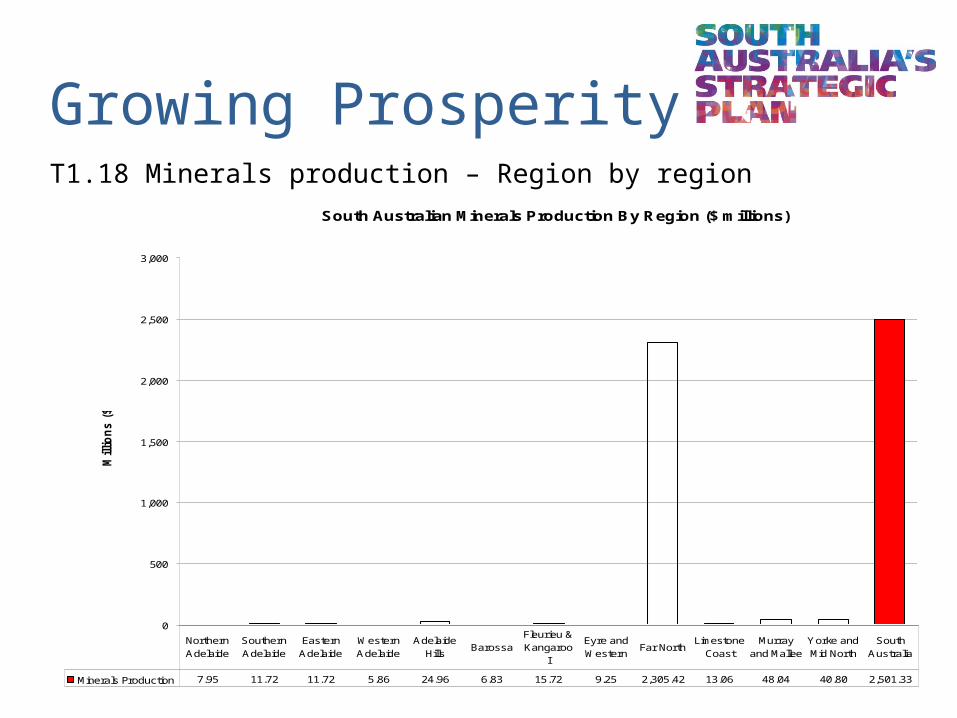
Growing ProsperityT1.18 Minerals production – Region by region
South Australian Minerals Production By Region ($ millions)
0
500
1,000
1,500
2,000
2,500
3,000
Millio
ns
($
)
Minerals Production 7.95 11.72 11.72 5.86 24.96 6.83 15.72 9.25 2,305.42 13.06 48.04 40.80 2,501.33
Northern Adelaide
Southern Adelaide
Eastern Adelaide
Western Adelaide
Adelaide Hills
BarossaFleurieu & Kangaroo
I
Eyre and Western
Far NorthLimestone
CoastMurray
and MalleeYorke and Mid North
South Australia

55 Positive movement
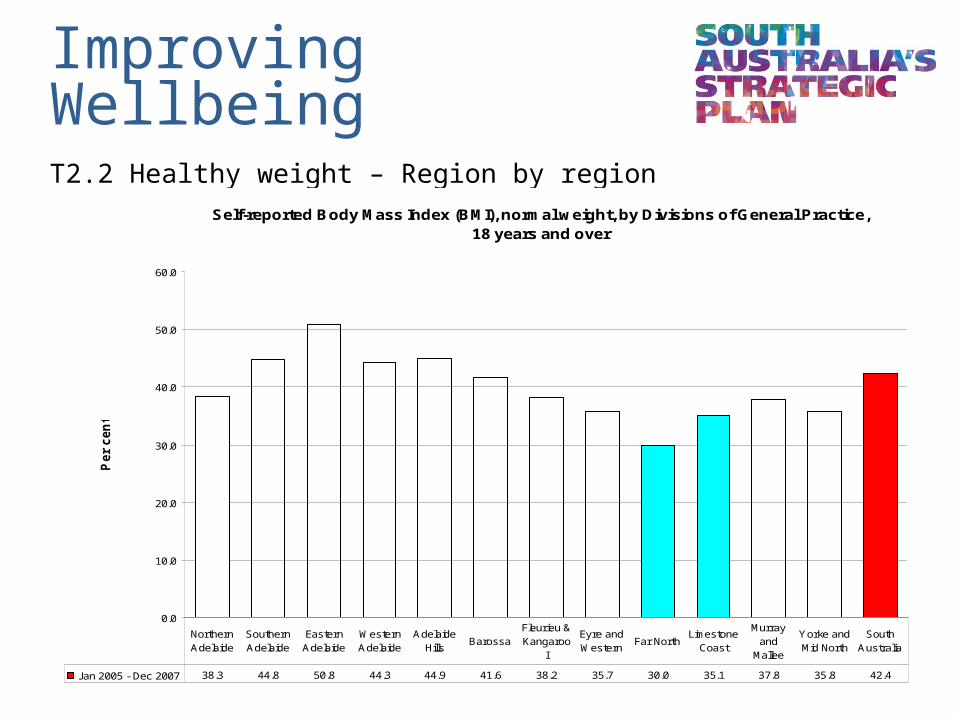
Improving Wellbeing
T2.2 Healthy weight – Whole of StatePrevalence of healthy weight for South Australians,
18 years and over (2003 baseline)
0
10
20
30
40
50
60
Pe
r c
en
t
Persons 42.0 42.5 43.6 42.5 41.0
Target 52.0
Baseline 60.0
2003 2004 2005 2006 2007 2008 2009 2010 2011 2012 2013 2014

55 Positive movement
Improving Wellbeing
T2.2 Healthy weight – Region by regionSelf-reported Body Mass Index (BMI), normal weight, by Divisions of General Practice,
18 years and over
0.0
10.0
20.0
30.0
40.0
50.0
60.0
Per
cen
t
Jan 2005 - Dec 2007 38.3 44.8 50.8 44.3 44.9 41.6 38.2 35.7 30.0 35.1 37.8 35.8 42.4
Northern Adelaide
Southern Adelaide
Eastern Adelaide
Western Adelaide
Adelaide Hills
BarossaFleurieu & Kangaroo
I
Eyre and Western
Far NorthLimestone
Coast
Murray and
Mallee
Yorke and Mid North
South Australia
55 Positive movement
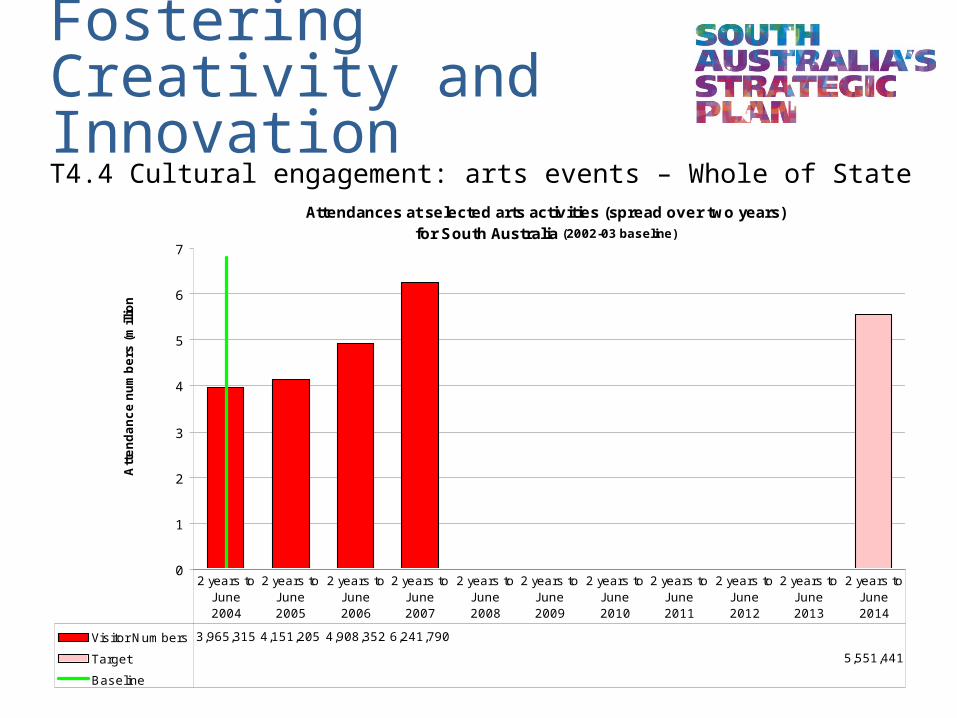
Fostering Creativity and InnovationT4.4 Cultural engagement: arts events – Whole of State
Attendances at selected arts activities (spread over two years)for South Australia (2002-03 baseline)
0
1
2
3
4
5
6
7
Att
en
da
nc
e n
um
be
rs (
mill
ion
s)
Visitor Numbers 3,965,315 4,151,205 4,908,352 6,241,790
Target 5,551,441
Baseline 5,800,000
2 years toJune 2004
2 years toJune 2005
2 years toJune 2006
2 years toJune 2007
2 years toJune 2008
2 years toJune 2009
2 years toJune 2010
2 years toJune 2011
2 years toJune 2012
2 years toJune 2013
2 years toJune 2014

55 Positive movement
Fostering Creativity and InnovationT4.4 Cultural engagement: arts events – Region by region
Attendance at a South Australian arts event, performance or festivalwithin the last 12 months, by region, 2008
0
10
20
30
40
50
60
Pro
po
rtio
n o
f re
sp
on
de
nts
Attended 31.2 42.4 53.9 42.1 46.1 25.8 23.8 19.3 19.7 13.7 13.8 14.3 35.7
Northern Adelaide
Southern Adelaide
Eastern Adelaide
Western Adelaide
Adelaide Hills
BarossaFleurieu
& Kangaroo
Eyre and Western
Far NorthLimestone Coast
Murray and
Mallee
Yorke and Mid North
SA total

55 Positive movement
The Plug
Fact sheets and graphs for all targets:
www.saplan.org.au

55 Positive movement
Conclusion• South Australia’s Strategic Plan is a
comprehensive strategy sitting at the centre of government activity
• Careful measurement and a commitment to public accountability is driving discipline in the public sector
• Four years into a 10-year process, SA’s Plan enjoys wide community support from all sectors across the state.