4th Annual Larrain Vial International Investors ... · 4th Annual Larrain Vial International...
41
4th Annual Larrain Vial International Investors’ Conference March, 2010
-
Upload
nguyennguyet -
Category
Documents
-
view
214 -
download
0
Transcript of 4th Annual Larrain Vial International Investors ... · 4th Annual Larrain Vial International...

4th Annual Larrain Vial International Investors’ ConferenceMarch, 2010

2
Company overview
Financial highlights
Earthquake effects in CAP
CAP – Mitsubishi Corporation transaction
Strategic considerations

3
Mining Steel production Steel processing
• Exports iron ore products, mainly to Asia
• Produces steel for the domestic market
• Processes value-added steel solutions in Chile, Peru and Argentina
11.5 million tonnes.
Production capacity1.45 million tonnes. 400 thousand tonnes.
Vertically integrated ferrous metal company

4
Steel ProcessingSteel ProductionIron Ore Mining
39.8%9.6% 19.3% 31.3%
Corporate structure
MCI 1
50.0%
5
Iron ore mining

6
Punta Totoralillo Port
Cerro Negro Norte
Copiapó
Magnetite Plant
Los ColoradosGuacolda II Port
Vallenar
El Algarrobo
Cristales
El Tofo
La SerenaGuayacán Port
El Romeral
Pellets Plant
Areas of operation

7
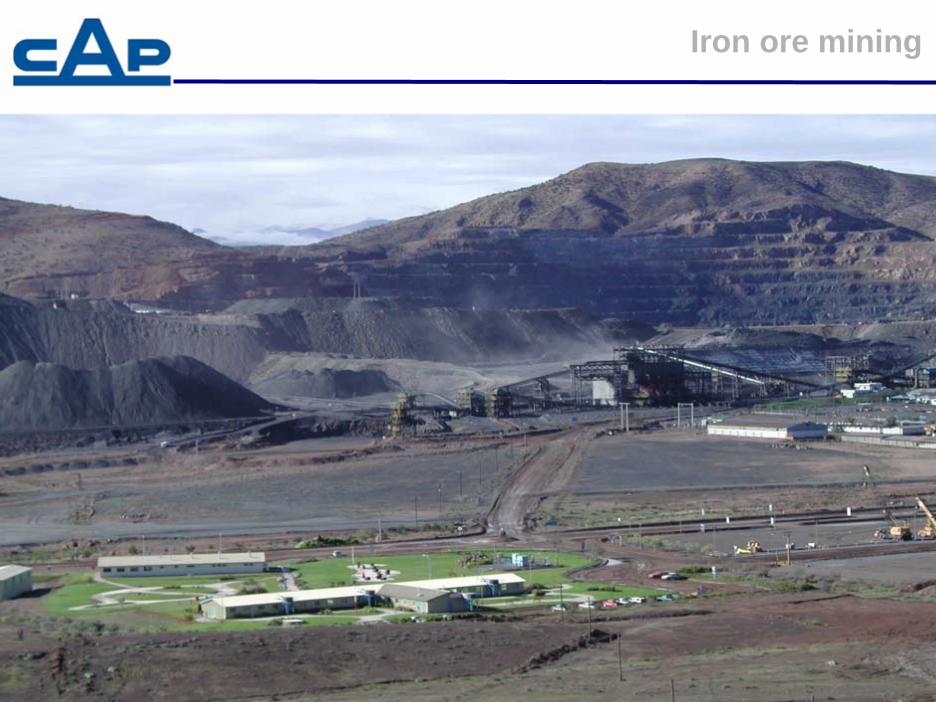
• Largest producer of iron ore and pellets on thePacific coast of South America with a productioncapacity of 11.5 million MT
• Ample resources and known reserves, togetherwith the expansion of its exploration activities, guarantee continuity of operations for manydecades
• Strong long-term commercial relations withcustomers in Asia
Iron ore mining
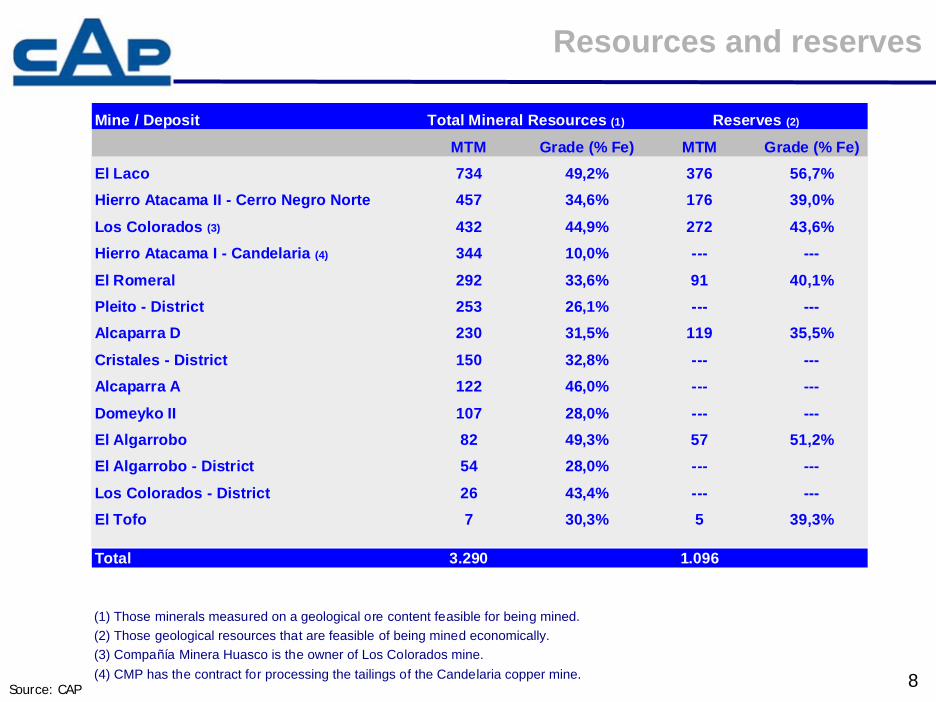
8Source: CAP
Resources and reserves
Mine / Deposit
MTM Grade (% Fe) MTM Grade (% Fe)El Laco 734 49,2% 376 56,7%Hierro Atacama II - Cerro Negro Norte 457 34,6% 176 39,0%
Los Colorados (3) 432 44,9% 272 43,6%Hierro Atacama I - Candelaria (4) 344 10,0% --- ---
El Romeral 292 33,6% 91 40,1%Pleito - District 253 26,1% --- ---Alcaparra D 230 31,5% 119 35,5%
Cristales - District 150 32,8% --- ---Alcaparra A 122 46,0% --- ---
Domeyko II 107 28,0% --- ---El Algarrobo 82 49,3% 57 51,2%El Algarrobo - District 54 28,0% --- ---
Los Colorados - District 26 43,4% --- ---El Tofo 7 30,3% 5 39,3%
Total 3.290 1.096
(1) Those minerals measured on a geological ore content feasible for being mined.(2) Those geological resources that are feasible of being mined economically.(3) Compañía Minera Huasco is the owner of Los Colorados mine. (4) CMP has the contract for processing the tailings of the Candelaria copper mine.
Total Mineral Resources (1) Reserves (2)
9
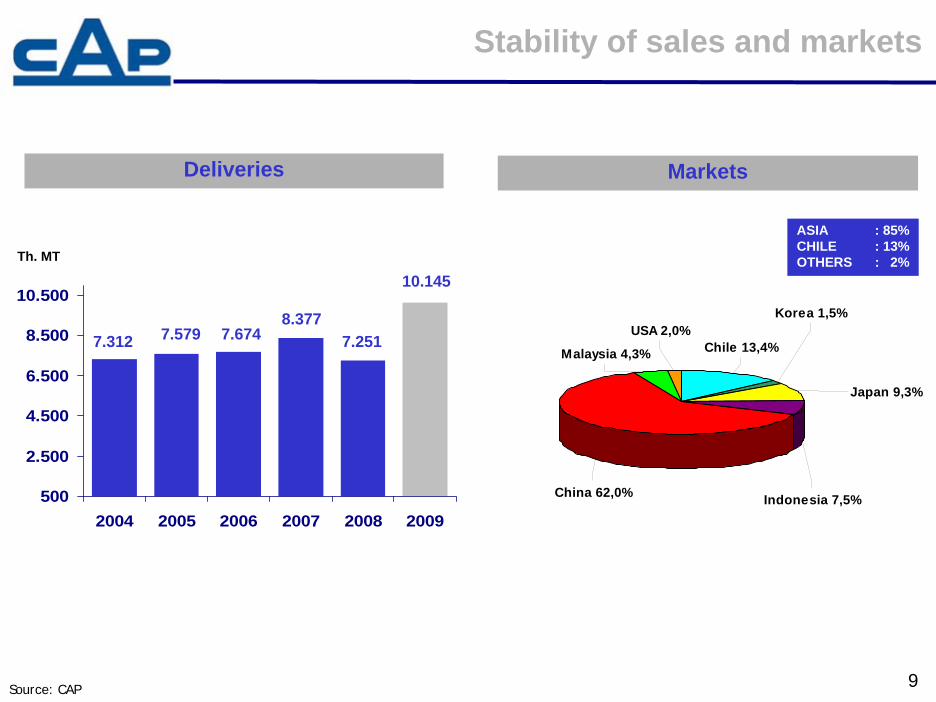
500
2.500
4.500
6.500
8.500
10.500
2004 2005 2006 2007 2008 2009
Th. MT
ASIA : 85%CHILE : 13%OTHERS : 2%
Deliveries Markets
Source: CAP
USA 2,0%Chile 13,4%
Korea 1,5%
Japan 9,3%
Indonesia 7,5%China 62,0%
Malaysia 4,3%7.312 7.579 7.674
8.3777.251
10.145
Stability of sales and markets

10
Steel production operations

11
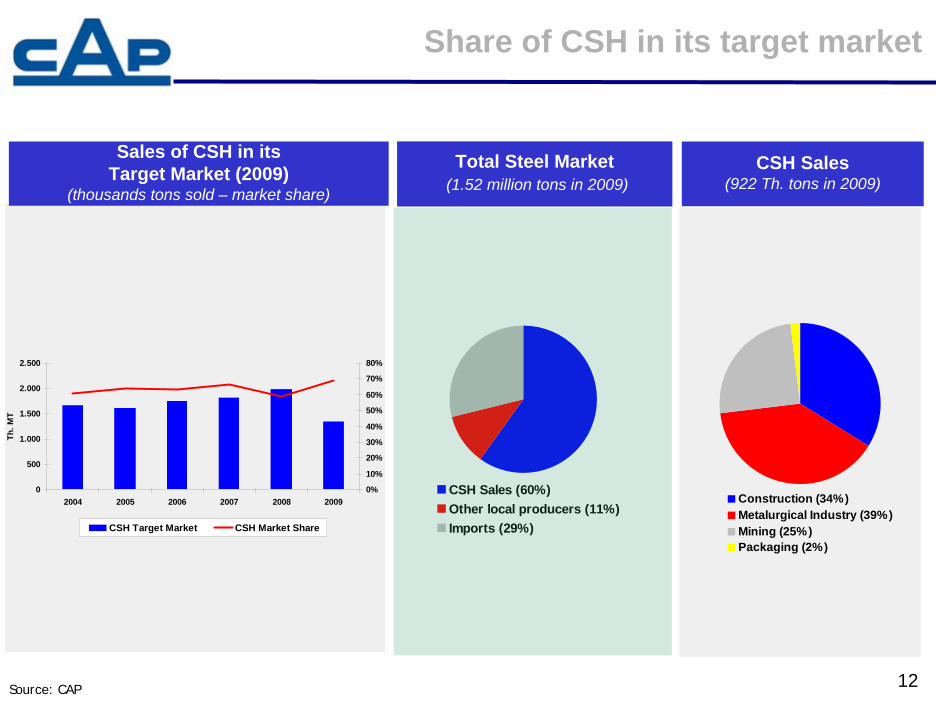
• Chile’s steel market leader
• 60% and 69% market share in total and targetmarkets respectively
• 1.45 million tons of annual liquid steel productioncapacity
• Strong long-term commercial relations withcustomers in Chile
• Vertical integration in iron and limestone providesadvantage in facing economic cycles
Steel production
12
CSH Sales (60%)Other local producers (11%)Imports (29%)
Sales of CSH in its Target Market (2009)
(thousands tons sold – market share)
Total Steel Market(1.52 million tons in 2009)
CSH Sales (922 Th. tons in 2009)
Source: CAP
Share of CSH in its target market
Construction (34%)Metalurgical Industry (39%)Mining (25%)Packaging (2%)
0
500
1.000
1.500
2.000
2.500
2004 2005 2006 2007 2008 2009
Th. M
T
0%
10%
20%
30%
40%
50%
60%
70%
80%
CSH Target Market CSH Market Share

13
Steel processing
14
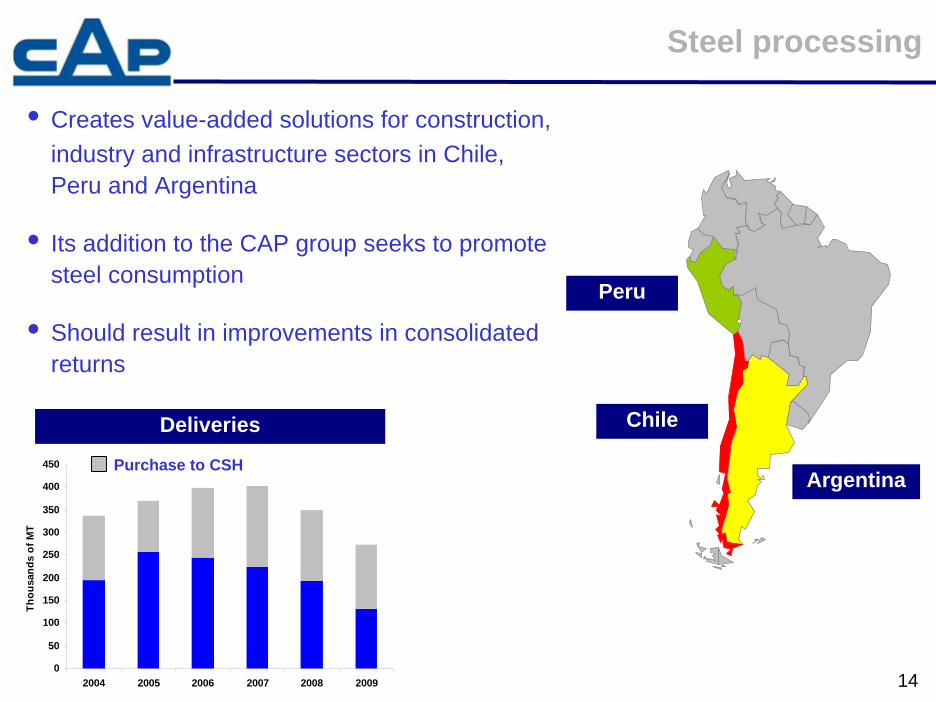
Peru
Argentina
Chile
• Creates value-added solutions for construction, industry and infrastructure sectors in Chile, Peru and Argentina
• Its addition to the CAP group seeks to promotesteel consumption
• Should result in improvements in consolidatedreturns
Steel processing
0
50
100
150
200
250
300
350
400
450
2004 2005 2006 2007 2008 2009
Thou
sand
s of
MT
Deliveries
Purchase to CSH

15
Company overview
Financial highlights
Earthquake effects in CAP
CAP – Mitsubishi Corporation transaction
Strategic considerations

16
Sales EBITDA (1)
Net Financial Debt Net Financial Debt / EBITDA
t twelve months(1) EBITDA = Operating Income + Depreciation + Dividends received in cash, over the las
725880
997
1.583
1.972
1.386
0200400600800
1.0001.2001.4001.6001.8002.0002.200
2004 2005 2006 2007 2008 2009
208255 247
336
534
186
050
100150200250300350400450500550
2004 2005 2006 2007 2008 2009
270 257
394439
502 482
050
100150200250300350400450500550
2004 2005 2006 2007 2008 2009
1,01
2,59
0,941,311,60
1,29
0,00
1,00
2,00
3,00
4,00
5,00
6,00
2004 2005 2006 2007 2008 2009
Financial highlights (US$ million)

17
EBITDA by business unit
Financial highlights
47%42%
77%
60%54% 52% 50%
18%8% 5%
24%
38% 36%40%
16%8%
13% 12%
0%
10%20%
30%40%
50%60%
70%80%
90%
2004 2005 2006 2007 2008 2009
CMP CSH SPG

18
(US$ million) 2004 2005 2006 2007 2008 2009
Sales 725 880 997 1.583 1.972 1.386
Operational Margin 180 185 170 301 454 172
EBITDA (1) 208 255 247 336 534 186
(million of US$) 2004 2005 2006 2007 2008 2009
Cash 62 154 242 184 379 387
Short Term Debt (2) 109 136 97 81 111 44
Long Term Debt 223 275 539 543 769 826
Financial Debt 331 411 636 623 880 870
Net Financial Debt 270 257 394 439 502 482
Equity 562 646 732 884 1.039 949
Investment (additions of fixed assets) 29 55 119 309 161 142
Net Financial Debt / EBITDA 1,29x 1,01x 1,60x 1,31x 0,94x 2,59x
(1) EBITDA = Operating Income + Depreciation + Dividends received in cash, over the last twelve months.(2) Includes portion of long term debt.
Financial evolution

19
0
50
100
150
200
250
2010 2011 2012 2013 2014 2015 2016 2017 2018 2019 2020 2021-2036
(mill
ion
of U
S$)
Banks Bonds
Debt maturity profile

20
Company overview
Financial highlights
Earthquake effects in CAP
CAP – Mitsubishi Corporation transaction
Strategic considerations
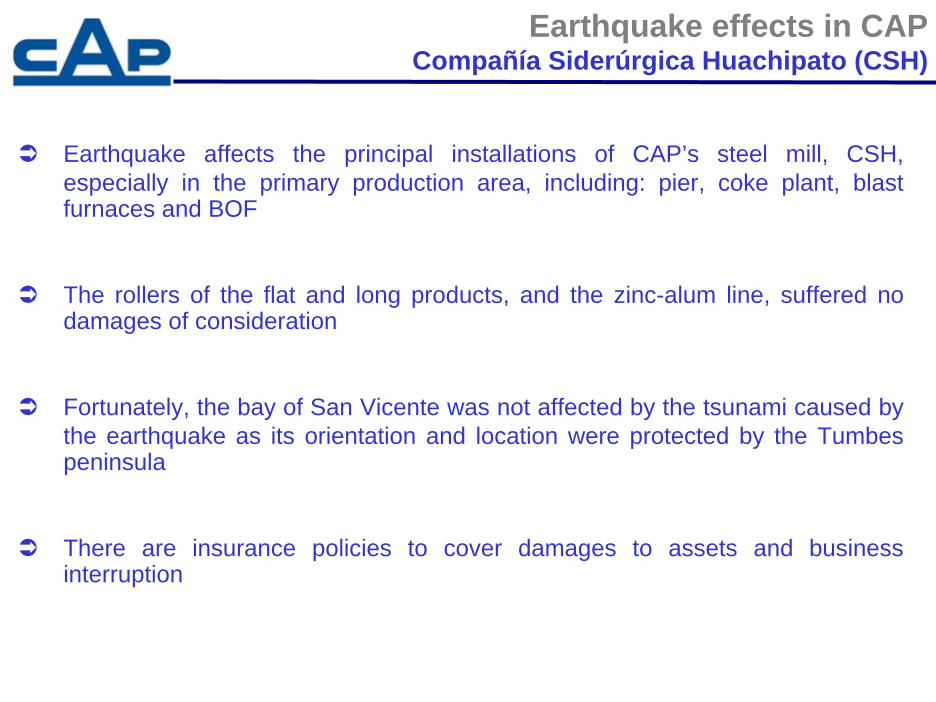
Earthquake effects in CAPCompañía Siderúrgica Huachipato (CSH)
y
Earthquake affects the principal installations of CAP’s steel mill, CSH, especially in the primary production area, including: pier, coke plant, blast furnaces and BOF
The rollers of the flat and long products, and the zinc-alum line, suffered nodamages of consideration
Fortunately, the bay of San Vicente was not affected by the tsunami caused bthe earthquake as its orientation and location were protected by the Tumbes peninsula
There are insurance policies to cover damages to assets and business interruption

Damages assessmentPier – Coke Plant
The pier structure shows no evident faults
Unloading towers Nbr. 1, 2 and 3 with different degrees of misalignment. Nbr. 2 inclined southward difficulties the use of the southern side for unloading raw materials
Furnace loading machine derailed and partially disconnected from its structure
Furnaces remain loaded and temperature maintained with natural gas
Estimated recovery time: 1 month (evaluation under way)

Damages assessmentBlast furnaces
Blast furnaces (BF) with some damage, with load solidified
Damages to anchoring of the BF heaters
Because of the long time they were without water, damage to the refrigeration elements are being evaluated
Estimated time for recovery: 3 months (evaluation under way)

Damages assessmentBOF
Liquid steel discharge area, from torpedo ladles to transfer cutters, affected due to the sinking of the rail by approximately 40 cms
Six cutters have steel inside. These cannot be emptied, they contain solidified steel
Estimated time for recovery: 2 months (evaluation under way)
25
Company overview
Financial highlights
Earthquake effects in CAP
CAP – Mitsubishi Corporation transaction
Strategic considerations

26
Steel ProcessingSteel ProductionIron Ore Mining
39.8%9.6% 19.3% 31.3%
Corporate structure
MCI 1
50.0%
27
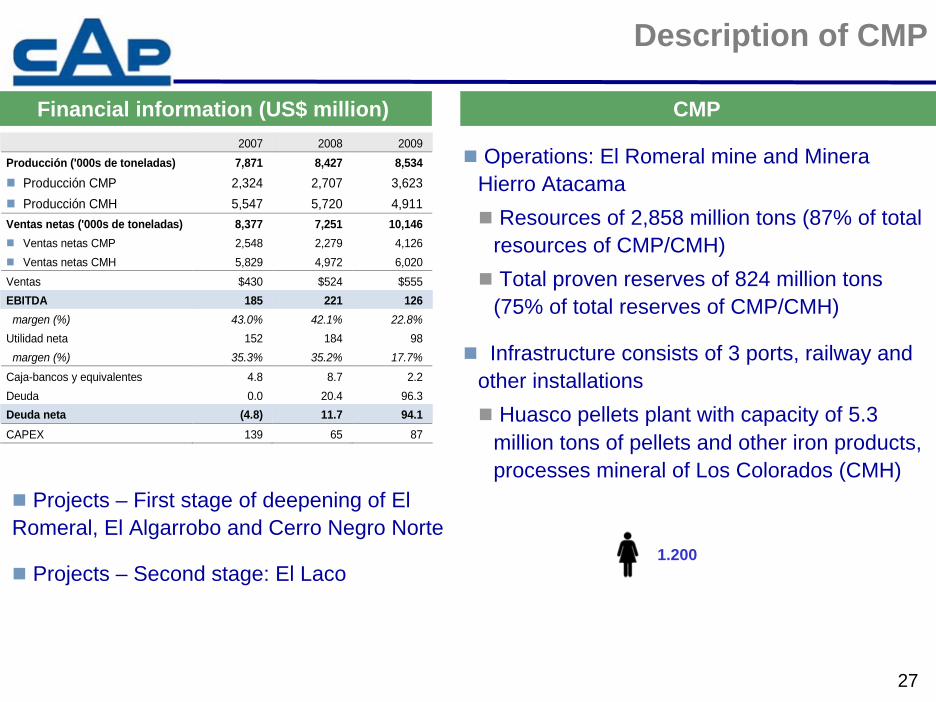
CMPCMP
Operations: El Romeral mine and MineraHierro Atacama
Resources of 2,858 million tons (87% of total resources of CMP/CMH)Total proven reserves of 824 million tons (75% of total reserves of CMP/CMH)
Infrastructure consists of 3 ports, railway and other installations
Huasco pellets plant with capacity of 5.3 million tons of pellets and other iron products, processes mineral of Los Colorados (CMH)
Financial information (US$ million)Financial information (US$ million)
Projects – First stage of deepening of El Romeral, El Algarrobo and Cerro Negro Norte
Projects – Second stage: El Laco 1.200
Description of CMP
2007 2008 2009 Producción ('000s de toneladas) 7,871 8,427 8,534
Producción CMP 2,324 2,707 3,623 Producción CMH 5,547 5,720 4,911
Ventas netas ('000s de toneladas) 8,377 7,251 10,146 Ventas netas CMP 2,548 2,279 4,126 Ventas netas CMH 5,829 4,972 6,020
Ventas $430 $524 $555 EBITDA 185 221 126 margen (%) 43.0% 42.1% 22.8% Utilidad neta 152 184 98 margen (%) 35.3% 35.2% 17.7% Caja-bancos y equivalentes 4.8 8.7 2.2 Deuda 0.0 20.4 96.3 Deuda neta (4.8) 11.7 94.1 CAPEX 139 65 87

28
CMHCMH
Company operated by CMP formed by a 50/50 JV between CMP and Mitsubishi (1996)
Los Colorados: only exploitation asset Total resources of 432 million tons (13% of total resources of CMP/CMH) Reserves of 272 million tons (25% of total reserves of CMP/CMH)
Project under study for expansion of the mine by 2 million tons / year
CAPEX estimated at US$ 325 million for the mine and pellets plantProduction by 2013 of 7.3 million tons Mining plan would last 23 years
Financial information (US$ million)Financial information (US$ million)
400
Description of CMH
2007 2008 2009 Producción ('000s de toneladas) 5,547 5,720 4,911 Ventas $392 $572 $418 EBITDA 173 306 153 Margen (%) 44.1% 53.6% 36.6% Utilidad neta 133 243 117 margin (%) 33.9% 42.5% 27.9%
Caja-bancos y equivalentes 31.9 48.3 39.4 Deuda 0.0 0.0 0.0 Deuda neta (31.9) (48.3) (39.4)

29
Objectives
Control of 100% of CMH’s cash flow
Consolidation of the EBITDA of CMH
Optimization of CMP’s capital structure and financial profile for potential transactions in the capital markets
Raise funds through a capital increase to contribute to the financing of the first part of the expansion projects that will permit a significant increase in the company’s present production capacity
Strengthen CMP as a company with independent access to the capital markets and allow CAP to focus its resources on its own financial strengthening, the development of CSH and other businesses and projects
In a second stage, continue toward the development of the world class El Laco mine
The transaction
30
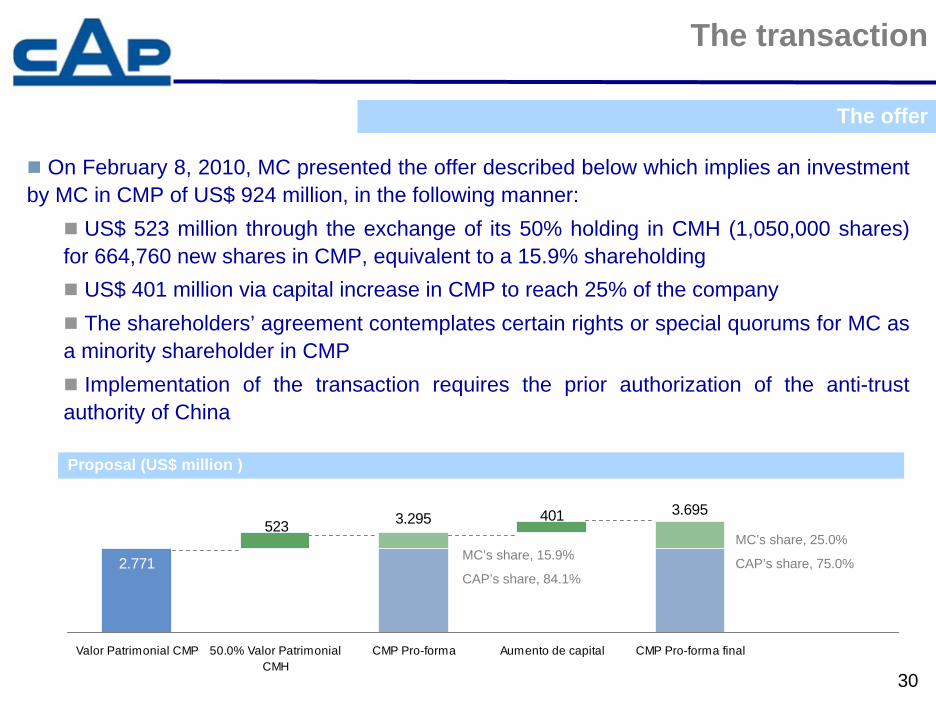
The offer
On February 8, 2010, MC presented the offer described below which implies an investment by MC in CMP of US$ 924 million, in the following manner:
US$ 523 million through the exchange of its 50% holding in CMH (1,050,000 shares) for 664,760 new shares in CMP, equivalent to a 15.9% shareholding
US$ 401 million via capital increase in CMP to reach 25% of the companyThe shareholders’ agreement contemplates certain rights or special quorums for MC as
a minority shareholder in CMPImplementation of the transaction requires the prior authorization of the anti-trust
authority of China
The transaction
Proposal (US$ million )
2.771
401523 3.295 3.695
Valor Patrimonial CMP 50.0% Valor PatrimonialCMH
CMP Pro-forma Aumento de capital CMP Pro-forma final
MC’s share, 15.9%
CAP’s share, 84.1%
MC’s share, 25.0%
CAP’s share, 75.0%

31
General terms and conditions
Special quorums for some decisions and formula for resolving disputes
Matters for special quorum
a. Approval of the F/S should the auditor not approve them without reservation
b. Change of the dividend policy from 75%
c. Payment of bonuses or salaries to directors of CMP exceeding US$1 million annually (individually)
d. New businesses outside the core business of CMP exceeding an investment of US$ 50 million
e. Approval and changes in annual budget
f. Contracts not in the ordinary course of business exceeding US$ 10 million or for more than 3 years, or exceeding US$ 100 million or for more than 5 years for contracts within the ordinary course of business
g. Financing that exceeds the debt of CMP by over 2.0x the NFD/EBITDA ratio, and the granting of guarantees to third parties
h. Asset sales of over US$ 50 million
i. Approval of new projects of over US$ 100 million
j. Other rights at the shareholder meeting level in some matters that require a larger majority according to the Corporations Law.
Shareholders' agreement
Generate put option for MC

32
MC
CMP
CMH
CAP
50.0%
100.0%50.0%
A B
MC
CMP / CMH
CAP
75.0%25.0%
New structure of mining business
33
Very attractive price for CAP
Improves the financial capacity of CMP
Acceleration of the development of the company’s projects portfolio
Consolidation of the alliance with a strategic partner with a global presence
Merits of the transaction
34
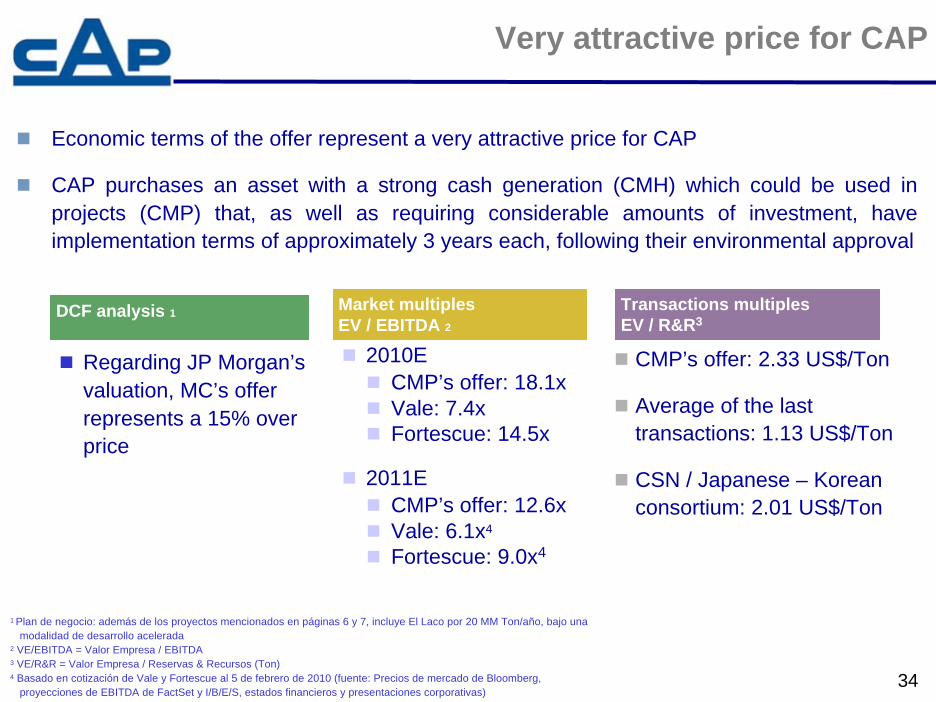
Economic terms of the offer represent a very attractive price for CAP
CAP purchases an asset with a strong cash generation (CMH) which could be used in projects (CMP) that, as well as requiring considerable amounts of investment, have implementation terms of approximately 3 years each, following their environmental approval
1 Plan de negocio: además de los proyectos mencionados en páginas 6 y 7, incluye El Laco por 20 MM Ton/año, bajo una modalidad de desarrollo acelerada
2 VE/EBITDA = Valor Empresa / EBITDA 3 VE/R&R = Valor Empresa / Reservas & Recursos (Ton)4 Basado en cotización de Vale y Fortescue al 5 de febrero de 2010 (fuente: Precios de mercado de Bloomberg,
proyecciones de EBITDA de FactSet y I/B/E/S, estados financieros y presentaciones corporativas)
Very attractive price for CAP
DCF analysis 1DCF analysis 1 Market multiplesEV / EBITDA 2Market multiplesEV / EBITDA 2
Transactions multiplesEV / R&R3
Transactions multiplesEV / R&R3
2010ECMP’s offer: 18.1xVale: 7.4xFortescue: 14.5x
2011ECMP’s offer: 12.6xVale: 6.1x4
Fortescue: 9.0x4
CMP’s offer: 2.33 US$/Ton
Average of the last transactions: 1.13 US$/Ton
CSN / Japanese – Korean consortium: 2.01 US$/Ton
Regarding JP Morgan’svaluation, MC’s offerrepresents a 15% overprice
35
JP Morgan’s valuation
2.429
2.280
2.252
2.182
2.292
2.846
1.873
1.809 2.752
1.579
1.954
1.576
1.481
1.697
2.104
2.522
1.000 1.500 2.000 2.500 3.000 3.500 4.000
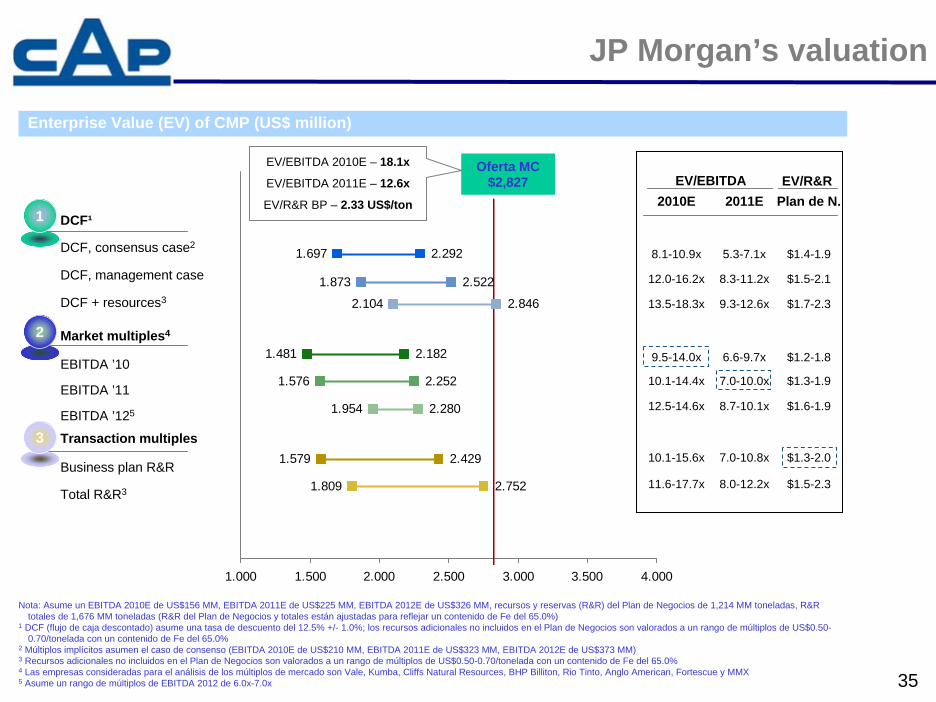
Enterprise Value (EV) of CMP (US$ million)
DCF¹
DCF, consensus case2
DCF, management case
DCF + resources3
Oferta MC $2,827
Nota: Asume un EBITDA 2010E de US$156 MM, EBITDA 2011E de US$225 MM, EBITDA 2012E de US$326 MM, recursos y reservas (R&R) del Plan de Negocios de 1,214 MM toneladas, R&Rtotales de 1,676 MM toneladas (R&R del Plan de Negocios y totales están ajustadas para reflejar un contenido de Fe del 65.0%)
1 DCF (flujo de caja descontado) asume una tasa de descuento del 12.5% +/- 1.0%; los recursos adicionales no incluidos en el Plan de Negocios son valorados a un rango de múltiplos de US$0.50-0.70/tonelada con un contenido de Fe del 65.0%
2 Múltiplos implícitos asumen el caso de consenso (EBITDA 2010E de US$210 MM, EBITDA 2011E de US$323 MM, EBITDA 2012E de US$373 MM)3 Recursos adicionales no incluidos en el Plan de Negocios son valorados a un rango de múltiplos de US$0.50-0.70/tonelada con un contenido de Fe del 65.0%4 Las empresas consideradas para el análisis de los múltiplos de mercado son Vale, Kumba, Cliffs Natural Resources, BHP Billiton, Rio Tinto, Anglo American, Fortescue y MMX5 Asume un rango de múltiplos de EBITDA 2012 de 6.0x-7.0x
Market multiples4
EBITDA ’10
EBITDA ’11
EBITDA ’125
Transaction multiples
Business plan R&R
Total R&R3
1
2
3
2011E2010EEV/EBITDA
8.3-11.2x 12.0-16.2x $1.5-2.1
Plan de N.EV/R&R
9.3-12.6x 13.5-18.3x $1.7-2.3
5.3-7.1x 8.1-10.9x $1.4-1.9
7.0-10.8x 10.1-15.6x $1.3-2.0
8.0-12.2x 11.6-17.7x $1.5-2.3
EV/EBITDA 2010E – 18.1x
EV/EBITDA 2011E – 12.6x
EV/R&R BP – 2.33 US$/ton
6.6-9.7x 9.5-14.0x $1.2-1.8
7.0-10.0x 10.1-14.4x $1.3-1.9
8.7-10.1x 12.5-14.6x $1.6-1.9
36
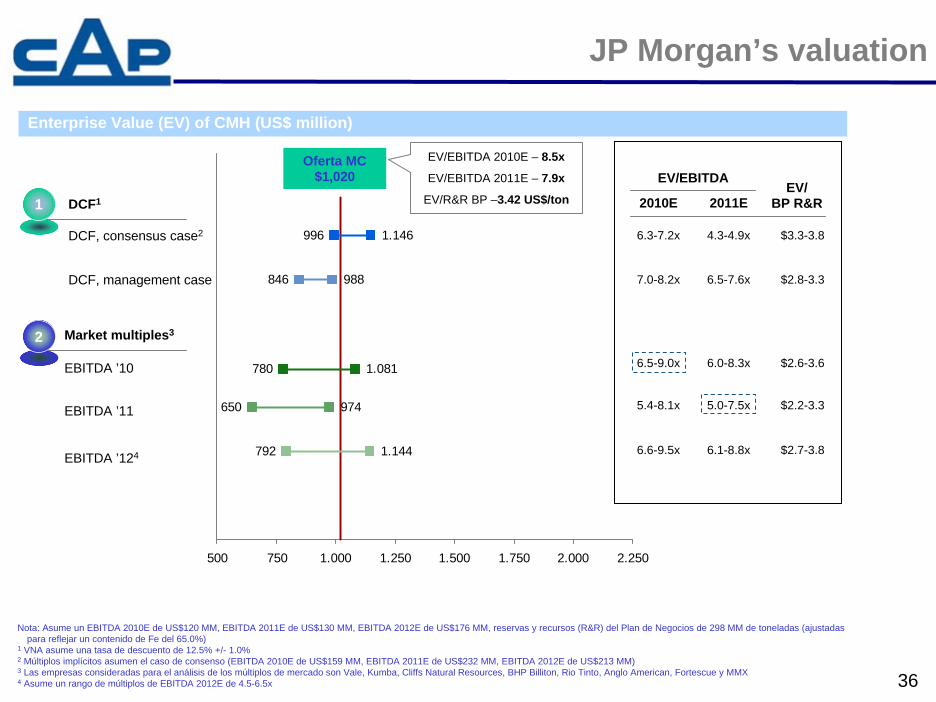
792
650
780
996
846
1.144
974
1.081
1.146
988
500 750 1.000 1.250 1.500 1.750 2.000 2.250
DCF1
DCF, consensus case2
DCF, management case
Oferta MC $1,020
Nota: Asume un EBITDA 2010E de US$120 MM, EBITDA 2011E de US$130 MM, EBITDA 2012E de US$176 MM, reservas y recursos (R&R) del Plan de Negocios de 298 MM de toneladas (ajustadas para reflejar un contenido de Fe del 65.0%)
1 VNA asume una tasa de descuento de 12.5% +/- 1.0%2 Múltiplos implícitos asumen el caso de consenso (EBITDA 2010E de US$159 MM, EBITDA 2011E de US$232 MM, EBITDA 2012E de US$213 MM)3 Las empresas consideradas para el análisis de los múltiplos de mercado son Vale, Kumba, Cliffs Natural Resources, BHP Billiton, Rio Tinto, Anglo American, Fortescue y MMX4 Asume un rango de múltiplos de EBITDA 2012E de 4.5-6.5x
Market multiples3
EBITDA ’10
EBITDA ’11
EBITDA ’124
1
2
2011E2010EEV/
BP R&R
EV/EBITDA
6.5-7.6x 7.0-8.2x $2.8-3.3
4.3-4.9x 6.3-7.2x $3.3-3.8
EV/EBITDA 2010E – 8.5x
EV/EBITDA 2011E – 7.9x
EV/R&R BP –3.42 US$/ton
6.0-8.3x 6.5-9.0x $2.6-3.6
6.1-8.8x 6.6-9.5x $2.7-3.8
5.0-7.5x 5.4-8.1x $2.2-3.3
Enterprise Value (EV) of CMH (US$ million)
JP Morgan’s valuation

37
February 8, 2010
“T” T + 30 T + 45
CAP received MC’s offer Board of Director’s approval Shareholders’ meeting
Anti-trust authority approval CMP – CMH merger Capital increase at CMP
February 9, 2010 March 10, 2010
Timetable for approval process

38
Company overview
Financial highlights
Earthquake effects in CAP
CAP – Mitsubishi Corporation transaction
Strategic considerations

39
• Investments plan in accordance with the new scenario, after the merger of CMP and CMH, and the capital increase in the new CMP
• This means brownfield projects will commence during 2010 and greenfieldCerro Negro Norte project to follow, after environmental approvals
• Continue investments in exploration of mining property to consolidate future developments
• Total value of brownfield projects: Romeral 1.0 million tpa, Algarrobo 2.0 million tpa and Colorados 2.0 million tpa, and greenfield projects Cerro Negro Norte 4.0 million tpa will reach US$ 1,384 million over the next five years
Mining business

40
Steel and Steel Processing
• Reconstruction and repair in CSH after the earthquake will last at least three months and production at full capacity in the steel processing business through the year
• Long term plan for the consolidation of the steel business in Chile and for the development of the steel processing business, on the Pacific coast countries of South America

41
www.cap.cl