
49803839
19
The Statistics Newsletter for the extended OECD statistical network Issue No. 55, March 2012 www.oecd.org/std/statisticsnewsletter Measuring Well-Being and Fostering Progress; an Asia-Pacific Perspective by the OECD Statistics Directorate Improving Official Statistics in Cambodia by the Statistics Bureau of Japan E N H A N C E M E N T S O N E C B M F I I N T E R E S T R A T E S T A T I S T I C S E u r o p e a n C e n t r a l B a n k R E C E N T F O R E I G N D I R E C T I N V E S T M E N T T R E N D S O E C D New European Indicators to Supplement the Unemployment Rate by Eurostat
-
Upload
kostas-georgioy -
Category
Documents
-
view
217 -
download
0
Transcript of 49803839
8/2/2019 49803839
http://slidepdf.com/reader/full/49803839 1/19
The Statistics
Newsletterfor the extended OECD statistical network
Issue No. 55, March 2012
www.oecd.org/std/statisticsnewsletter
Measuring Well-Being and Fostering Progress; an
Asia-Pacific Perspective
by the OECD Statistics Directorate
Improving Official Statistics in Cambodia
by the Statistics Bureau of Japan
E N H A
N C E M
E N T S
O N E C
B M F I
I N T E R E
S T R A T E
S T A T I S T I C S
E u r o p e a n
C e n t r
a l B a
n k
R E C E N T
F O R E I G
N D I R E
C T
I N V E
S T M E N
T T R E N
D S
O E C D
New European Indicators to Supplement the Unemployment Rate
by Eurostat
8/2/2019 49803839
http://slidepdf.com/reader/full/49803839 2/19
The Statistics Newsletter is published by the OECD Statistics Directorate.
This issue and previous issues can be downloaded rom the OECD website: www.oecd.org/std/statisticsnewsletter
Editor-in-Chie: Martine Durand
Editor: David Brackeld
Editorial and technical support: Sonia Primot
For urther inormation contact: the Editor, the Statistics Newsletter, [email protected]
Readers are invited to send their articles or comments to the email address above.
Deadline or articles or the next issue: 30th April 2012
Contents
3 Measuring Well-Being and Fostering Progress; an Asia-Pacic Perspective
Tim Clode, Household Statistics and Progress Measurement Division, OECD Statistics Directorate
6 New European Indicators to Supplement the Unemployment Rate
Arturo de la Fuente, Eurostat
9 Improving Ocial Statistics in Cambodia
F. Nishi, Statistics Bureau o Japan
12 Enhancements on ECB MFI Interest Rate Statistics
Javier Huerga, Josep Puigvert and Costanza Rodriguez, European Central Bank
15 Recent Foreign Direct Investment Trends
Ayse Bertrand and Emilie Kothe, OECD Directorate or Financial and Enterprise Aairs
17 Recent publications
18 Forthcoming meetings
2 THE STATISTICS NEWSLETTER - OECD - Issue No. 55, March 2012

8/2/2019 49803839
http://slidepdf.com/reader/full/49803839 3/19

8/2/2019 49803839
http://slidepdf.com/reader/full/49803839 4/19
Commission or Asia and the Pacic,
and the National Statistical Institute
o Korea).
Warm welcome
The ocial welcome was delivered
by Motohisa Furukawa, Japanese
Minister or Economic and Fiscal
Policy. Mr Furukawa emphasised
the signicance o Japan’s move
to establish its Commission on
Measuring Well-Being, in the
ollow-up to the Government’s
“New Growth Strategy”. The
Commission’s report which has just been completed, underscores
the importance o measures in three
critical elds: (1) economic and social
conditions; (2) physical and mental
health; and (3) relationships; all being
supported with long-term measures
o sustainability. In concrete terms,
the report proposed not only
indicators o lie-satisaction, but
also o relationships associated with
amily, community, and nature.
Increased relevance
In his opening address,
Rintaro Tamaki, OECD Deputy
Secretary-General, outlined the
importance o OECD’s work on
measuring well-being and its strong
relation to ongoing discussion on the
economic crisis and development.
He emphasised the shiting centre o
gravity resulting rom the emergence
o new poles o economic growth
in China and other countries in
Asia and Latin America, which has
made the prosperity o OECD and
non-OECD countries increasingly
intertwined. It in this context that theOECD is enhancing its engagement
with emerging economies such as
China, India and Indonesia, and is
developing close cooperation with
many other countries throughout the
region, and the world at large.
Regional initiatives
Japan’s “New Growth Strategy”
aims to create demand and jobs
through regulatory reorm and scalmeasures. The Strategy also ocuses
on key challenges, notably climate
change and population ageing, and
how to turn these into sources o
growth. Importantly, it links these
challenges to the issues o well-being
and happiness, and refects on how
the country should restore a sense
o shared values in the atermath o
the earthquake and nuclear accident
o March 2011.
Japan is not alone in Asia in bringing
well-being to the oreront o its
policies. In China, the 12th ve-
year plan reers to the notions o
well-being and o an harmonious
society, while a recently launched
National “Quality Index” measures
the economy not just by size, but
by sustainability, social equality and
ecological impact. Whilst not directly
aecting government priorities, the
index has provoked intense debate,
especially amongst provincial
leaders.
At the United Nations, ollowingan initiative by Bhutan, the
General Assembly has adopted a
resolution calling on United Nations
Member States to pay greater
importance to happiness and well-
being when implementing measures
to spur social and economic
development. The UN Assembly
invited countries to pursue the
elaboration o additional measures
that better capture the importance
o the pursuit o happiness and well-being in development with a view to
guiding their public policies.
Gross National Happiness
The keynote address rom
Karma Tshiteem, Secretary o
the Bhutanese Gross National
Happiness Commission, ocused
on Bhutan’s pursuit o Gross
National Happiness (GNH). Bhutan’sdevelopment approach seeks to
achieve a harmonious balance
between material well-being and
the spiritual, emotional and cultural
needs o society. It is based on the
belie that happiness is the ultimate
desire o every citizen, and that the
purpose o development is to enable
the conditions or happiness to be
realised.
Bhutan’s journey with GNH began
more than our decades ago and
more elaborate metrics to measure
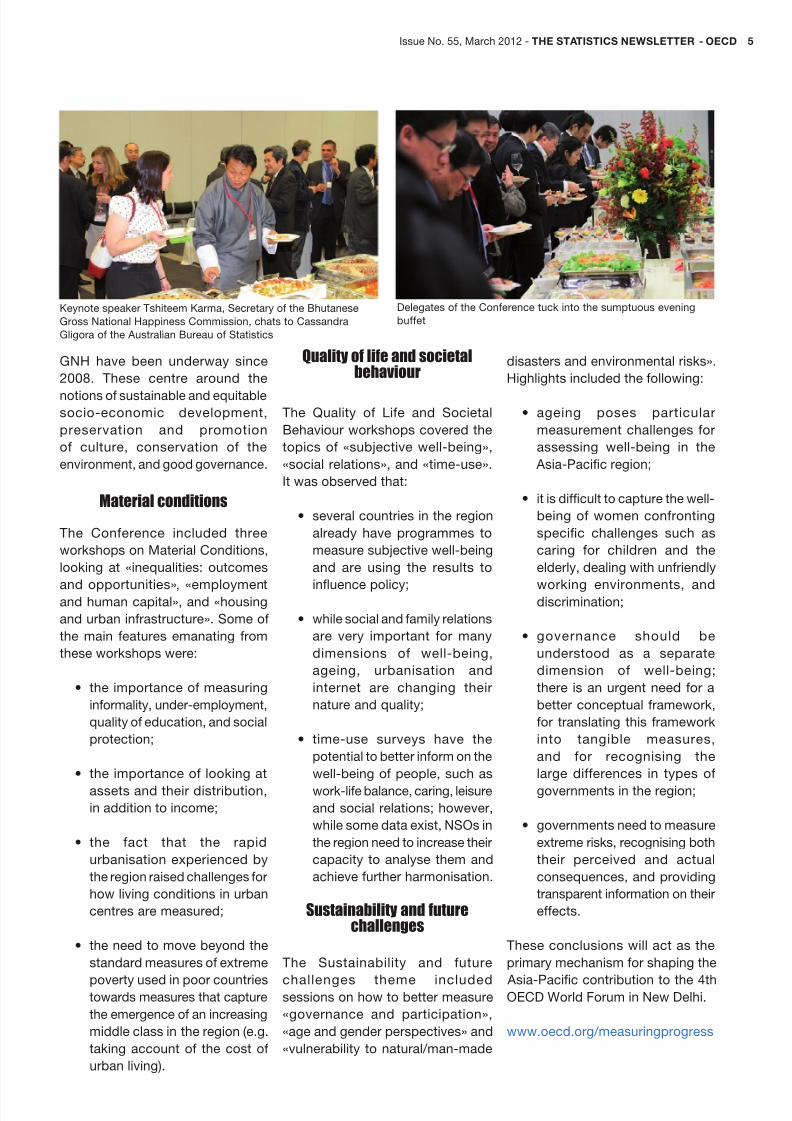
Deputy Secretary-General, Rintaro Tamaki, opens the Asia-
Pacic Conerence on behal o the OECD
Delegates o the Conerence listen attentively to the evening
toasts
4 THE STATISTICS NEWSLETTER - OECD - Issue No. 55, March 2012
8/2/2019 49803839
http://slidepdf.com/reader/full/49803839 5/19
disasters and environmental risks».
Highlights included the ollowing:
• ageing poses particular
measurement challenges or
assessing well-being in the
Asia-Pacic region;
• it is dicult to capture the well-
being o women conronting
specic challenges such as
caring or children and the
elderly, dealing with unriendly
working environments, anddiscrimination;
• governance should be
understood as a separate
dimension o well-being;
there is an urgent need or a
better conceptual ramework,
or translating this ramework
into tangible measures,
and or recognising the
large dierences in types o
governments in the region;
• governments need to measure
extreme risks, recognising both
their perceived and actual
consequences, and providing
transparent inormation on their
eects.
These conclusions will act as the
primary mechanism or shaping the
Asia-Pacic contribution to the 4thOECD World Forum in New Delhi.
www.oecd.org/measuringprogress
Quality of life and societalbehaviour
The Quality o Lie and Societal
Behaviour workshops covered the
topics o «subjective well-being»,
«social relations», and «time-use».
It was observed that:
• several countries in the region
already have programmes to
measure subjective well-being
and are using the results to
infuence policy;
• while social and amily relations
are very important or many
dimensions o well-being,
ageing, urbanisation and
internet are changing their
nature and quality;
• time-use surveys have the
potential to better inorm on the
well-being o people, such as
work-lie balance, caring, leisure
and social relations; however,
while some data exist, NSOs in
the region need to increase their
capacity to analyse them and
achieve urther harmonisation.
Sustainability and futurechallenges
The Sustainability and uture
challenges theme includedsessions on how to better measure
«governance and participation»,
«age and gender perspectives» and
«vulnerability to natural/man-made
GNH have been underway since
2008. These centre around the
notions o sustainable and equitablesocio-economic development,
preservation and promotion
o culture, conservation o the
environment, and good governance.
Material conditions
The Conerence included three
workshops on Material Conditions,
looking at «inequalities: outcomes
and opportunities», «employmentand human capital», and «housing
and urban inrastructure». Some o
the main eatures emanating rom
these workshops were:
• the importance o measuring
inormality, under-employment,
quality o education, and social
protection;
• the importance o looking at
assets and their distribution,
in addition to income;
• the act that the rapid
urbanisation experienced by
the region raised challenges or
how living conditions in urban
centres are measured;
• the need to move beyond the
standard measures o extreme
poverty used in poor countriestowards measures that capture
the emergence o an increasing
middle class in the region (e.g.
taking account o the cost o
urban living).
Keynote speaker Tshiteem Karma, Secretary o the Bhutanese
Gross National Happiness Commission, chats to Cassandra
Gligora o the Australian Bureau o Statistics
Delegates o the Conerence tuck into the sumptuous evening
buet
Issue No. 55, March 2012 - THE STATISTICS NEWSLETTER - OECD 5
8/2/2019 49803839
http://slidepdf.com/reader/full/49803839 6/19
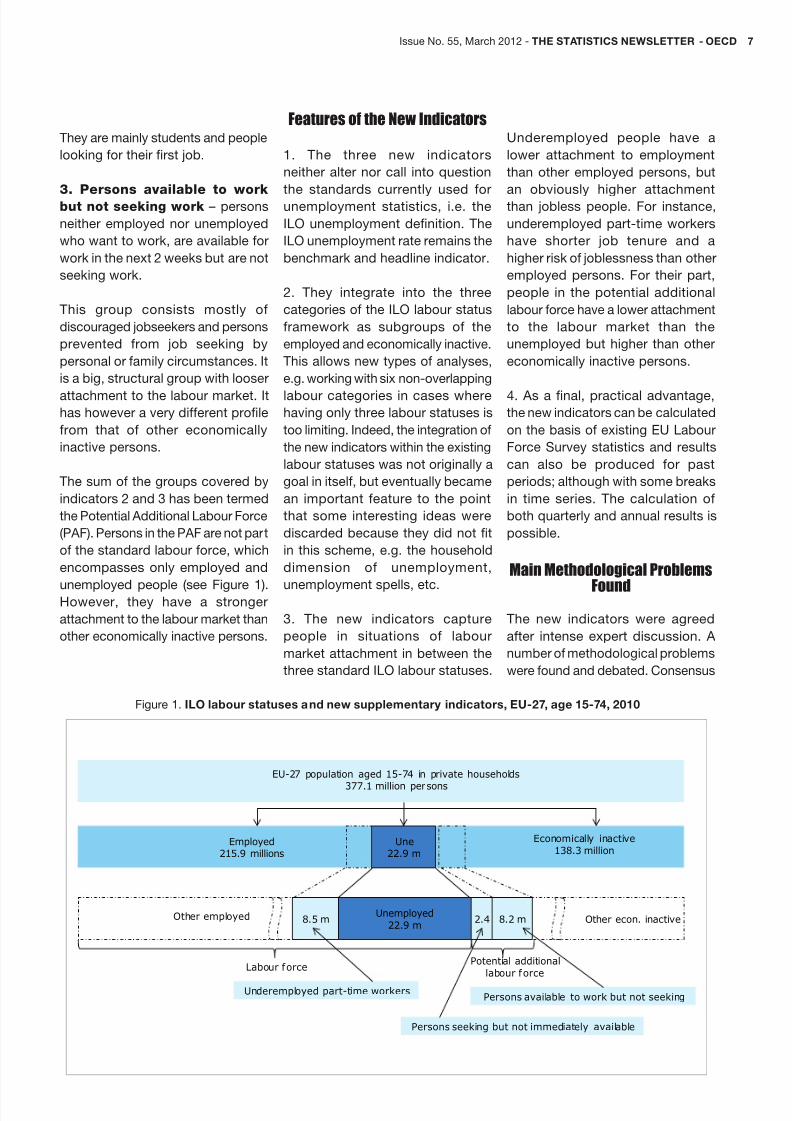
The International Labour
Organisation’s (ILO) labour
orce ramework is the
internationally agreed reerence or
comparable statistical reporting
on the (non-monetary dimension
o the) labour market. It providesor a division o the population into
three mutually exclusive groups:
employed, unemployed and
economically inactive persons.
The main indicator within this
ramework is the so-called ILO
unemployment rate (number
o unemployed persons as a
percentage o the labour orce). It
is the established headline measureor international comparisons, and is
thereore o central interest to policy
makers, the media and the public
at large. In the European Union,
the ILO denition o unemployment
is operationalised as ollows –
unemployed persons are those aged
15 to 74 who:
• are without (any) work
• are available to start work
within the next two weeks
• and have actively sought
employment at some time
during the previous our weeks.
Unemployment is the most widely
used labour market indicator,
refecting a range o aspects that
are both economic (e.g. labour
underutilisation, business cycle)and social (e.g. joblessness, risk
o poverty and social exclusion,
etc.). However, with an increasingly
ragmented and diversied labour
market and strongly varying
real breakthrough because past
attempts in the European Union
and in international ora had ailed to
produce tangible results in practice.
Additionally, the ILO is looking into
this work as part o an ongoing
discussion to create supplementaryindicators to be integrated within a
reviewed labour status ramework.
The three new indicators are the
ollowing:
1. Underemployed part-time
workers – are persons who are
employed working part-time who
wish to work additional hours and
are available to do so.
2. Persons seeking work but not
immediately available – the sum
o persons neither employed nor
unemployed who are in one o the
ollowing groups:
• Actively seeking work during the
last 4 weeks but not available
or work in the next 2 weeks
• Found a job to start in less than
3 months but not available or
work in the next 2 weeks
• Found a job to start in 3 months
or more
• Passively seeking work during
the last 4 weeks and available
or work in the next 2 weeks.
People covered by this indicator arein particular situations just outside the
labour market. It is a small population
and individuals do not stay long in it.
More than hal are young persons.
degrees o attachment to it, the
unemployment rate can on its own
no longer suciently describe all
those aspects. There is thereore
a pressing need or statistics that
supplement the ILO unemployment
rate to provide an enhanced, morenuanced picture o the labour market
status o people.
Work Towards Agreement Across the European Statistical
System
A debate on this matter was
launched in the European Statistical
System (ESS) in late 2008. The ESS
is a partnership between Eurostat(i.e. the statistical oce o the
European Commission) and the
national statistical institutes and
other national authorities responsible
in each EU Member State or the
development, production and
dissemination o European statistics.
A dedicated task orce was set
up in early 2009 to study how to
supplement the unemployment rate.
This task orce consisted o experts
rom the statistical oces o nine
European countries, the OECD, the
ILO, the European Central Bank and
Eurostat.
It delivered a report in June 2010,
which was urther discussed in other
high-level European ora, this time
with the participation o all member
countries o the ESS. Finally, ater
more than two years o discussion
and consensus-building, an ESS-wide agreement was reached in
March 2011 on three points: the
harmonised names, the denitions
and the underlying measurement
to be used. This agreement is a
eurostat
new european IndICators to supplement the
unemployment rate
Arturo de la Fuente, Eurostat
6 THE STATISTICS NEWSLETTER - OECD - Issue No. 55, March 2012
8/2/2019 49803839
http://slidepdf.com/reader/full/49803839 7/19
8/2/2019 49803839
http://slidepdf.com/reader/full/49803839 8/19
was not always possible, and the
ollowing three issues deserve
particular mention.
a. Underemployment o ull-time
workers. The main criteria
or underemployment are
the willingness to work more
hours and the availability to
do so. However part-time
workers meeting those criteria
seem to have a very dierent
prole rom the underemployed
working ull-time: the ormer
have a pattern similar to
involuntary part-time workerswhereas the latter can be seen
as having insucient income
despite working many hours. In
the ESS discussion there were
supporters o ocussing on part-
time workers and supporters o
a comprehensive measure o
labour underutilisation including
ull-timers. There was another
issue: underemployed ull-time
workers typically want to workvery ew additional hours: or
instance, in the EU in 2010, the
number o underemployed ull-
time workers was 110 % o the
number o underemployed part-
time workers, but the volume
o hours the ormer wanted
to work was only 55 % o the
volume desired by the latter.
This suggests that measures
in ull-time equivalents or in
volume o hours underutilised
could be more appropriate
or underemployed ull-time
workers. This approach
creates in turn other issues o
integration with labour status,
as the statistical unit o ull-
time equivalents or hours
is no longer the individual.
Eventually, it was agreed that
countries interested in the
number o underemployed ull-time workers could publish it on
a voluntary basis.
b. Indicator names. The adopted
indicator names are admittedly
not perect. They refect the
consensus reached in the quest
or ully accurate names, but
they are long and not catchy.Indeed, it was not possible to
coin short, accurate, telling
indicator names. There is hope
that better names will arise in
time as users and media put
the indicators to use. There
is also a need or a better
name or the indicators as
a set, as the currently used
‘supplementary indicators’ is
not a real standalone name.
c. Denominator or publication.
The most controversial point
was, however, not the indicator
denitions or names but the
denominator or publishing
the indicators in relative terms,
i.e. the choice to publish them
as shares or rates. Indeed,
no consensus on this point
was possible in any o the
ora discussing it. This issueis very controversial because
it crucially determines the
communication to users, in
particular as to the perceived
magnitude o the phenomenon
measured by the indicators,
whether they are presented
as independent indicators or
as constituents o a broader
overarching measure o labour
underutilisation, or whether the
sum o unemployment and the
new indicators is highlighted or
not (e.g. as would happen i they
all have the same denominator).
The denominators also dene
the approach or analysis, e.g.
it is quite dierent i a certain
target group is presented as
a percentage o the labour
orce or as a percentage o
the economically inactive
population.
The ollowing denominators
were discussed: working age
population; labour orce (i.e.
active population); the so-called
extended labour orce, meaning
the labour orce plus the potential
additional labour orce; persons
employed or part-time employed(only or underemployment); and
the economically inactive population
(only or the potential additional
labour orce). There was ultimately
no agreement on this point, which
could suggest that there is no single
best solution. Eurostat decided
to publish all three indicators
divided by the labour orce, i.e.
the same denominator as or the
unemployment rate.
Data Release
Eurostat and a number o European
national statistical oces issued a
coordinated release on 10 November
2011. Eurostat released annual data
or the year 2010 and previous years,
with breakdowns by sex, main age
groups, educational level attained
and nationality. In the uture, Eurostat
will streamline the new indicators inthe annual LFS data releases. 2011
data are scheduled or release on 19
April 2012. Publication o quarterly
data will be considered at a later
stage.
Statistics in Focus «8.5 million
underemployed part-time workers in
the EU27 in 2010» http://epp.eurostat.
ec.europa.eu/portal/page/portal/
product_details/publication?p_
product_code=KS-SF-11-056
Statistics in Focus «New measures
o labour market attachment»
http://epp.eurostat.ec.europa.
eu/portal/page/portal/product_
details/publication?p_product_
code=KS-SF-11-057
Data are available ree o charge in the
Eurostat online database http://epp.
eurostat.ec.europa.eu/portal/page/ portal/statistics/search_database ,
search or tables lsi_sup_age_a,
lsi_sup_edu_a and lsi_sup_nat_a.
8 THE STATISTICS NEWSLETTER - OECD - Issue No. 55, March 2012
8/2/2019 49803839
http://slidepdf.com/reader/full/49803839 9/19
The Statistics Bureau, Ministry
o Internal Aairs and
Communications, Japan
has been assisting the National
Institute o Statistics (NIS), Ministry
o Planning, Cambodia through the
Japan International Cooperation Agency (JICA) “Project or Improving
Ocial Statistics in Cambodia”. The
project runs rom August 2005 until
March 2015. The Statistics Bureau
has been playing the primary role in
the project by dispatching advisers
and experts to Cambodia, accepting
trainees every year rom the NIS, and
so on. Since its initiation, the project
provided technical assistance or:
• The 2008 Population Census;
• The 2009 Nation-wide
Establishment Listing;
• The 2011 Economic Census
(a irst-ever in Cambodia
and whose enumeration was
completed in March 2011).
The Government o Japan has also
been providing nancial assistance
or the project activities. For a project
outline: www.stat.go.jp/english/ino/
meetings/cambodia/phase3.htm.
Background until the project was commenced
In response to the request rom the
Royal Government o Cambodia, the
Ministry o Foreign Aairs o Japan,
ater consultations with the relatedorganisations in Japan, including
the Statistics Bureau, approved the
initiation o the project on 19 February
2010. The project activities have
been conducted based on the
Record o Discussion (R/D) signed
between the Royal Government o
Cambodia and the Government
o Japan on 14 June 2010. Beore
signing the R/D, three preliminary
study teams were dispatched rom
Japan to Cambodia, once by theStatistics Bureau and twice by JICA,
and careully considered the needs,
targets, and other relevant elements
o the project to conrm the requests
rom the NIS in detail.
The Statistics Bureau accepted the
primary role in the project with the
understanding that improvement
in the quality o Cambodian ocial
statistics would be indispensable orearly recovery rom the atermath o
the past political upheavals and the
economic and social development
o the country. The project was
also expected to promote goodwill
and riendship between Japan and
Cambodia in the elds o economy,
society, and culture. Furthermore, it
was hoped that through this project
the relationship would extend rom
the two countries to other East Asian
countries, and bring about positive
impacts on mutual economic
development in the region.
Project outline
The project period was initially set
or ve years (Phase I and II), and
then extended or another our years
(Phase III). The project ramework
was set up as ollows:
• Phase I. Provide statistical
training; August 2005 to
March 2007
• Phase II. Assist the 2008
Population Census; April 2007
to September 2010
• Phase III. Assist the 2011
Economic Census, 2013
Cambodia Inter-censalPopulation Survey and 2014
Cambodia Inter-censal
Economic Survey; October
2010 to March 2015.
This project is expected to contribute
to Cambodia in two ways. First,
more accurate demographic and
economic statistics obtained rom
the Population Census and the
Economic Census were expectedto contribute to the socio-economic
development o Cambodia.
Secondly, since these two censuses
will produce sampling rames or
demographic and economic surveys,
it was expected that a wider range
o more accurate and systematic
statistics would be obtained rom
the sample surveys. In particular,
the 2011 Economic Census was
considered essential or achieving
a ull coverage o the sampling
rame, because there was no reliable
business register with high coverage
in Cambodia, and eld enumeration
o all the establishments was
considered necessary or improving
such base inormation or economic
statistics.
In Phase I o the project, elementary
and intermediate courses o statistical
training were provided to the NIS andprovincial statistical sta to enhance
the statistical capacity o Cambodia
so that the 2008 Population Census
would be smoothly implemented. In
addition, since the statistical system
statIstICs Japan
ImprovIng offICIal statIstICs In CambodIa
F. Nishi, Statistics Bureau o Japan
Issue No. 55, March 2012 - THE STATISTICS NEWSLETTER - OECD 9
8/2/2019 49803839
http://slidepdf.com/reader/full/49803839 10/19
o Cambodia is decentralized, the
training courses were also provided to
the sta o line ministries to enhance
the overall statistical capacity o theCambodian Government, and to
strengthen the leading role o the
NIS as the central statistical oce.
In implementing the project, the
Statistics Bureau o Japan made
utmost eorts to honour the
ownership o the NIS in the project,
and decided to dispatch the experts
on a short-term basis with high
requencies to meet the needs o
the NIS. The NIS has been takingthe coordinating role in developing
the statistical capacity o the
government.
In assisting the execution o the 2008
Population Census, Japan worked
in partnership with UNFPA and
Germany. As Germany entrusted its
responsibilities to UNFPA, the roles
o assistance were shared between
UNFPA and Japan.
Technical Assistance for the2008 Population Census
To achieve better collaboration in
the technical assistance or the
2008 Population Census (PC2008),
oicial meetings such as the
Census Technical Committee were
established with the participation o
both UNFPA consultants and JICA
experts. Policy matters and other
relevant inormation was shared
and discussed, while both sides
assumed clear roles depending on
the eld o activities.
Since a population census requires
an enormous amount o human and
nancial resources and long time or
preparation, it is dicult or a singlecountry to support this huge task
in developing countries. Thereore,
collaboration between donors is
indeed necessary and eective as
well.
The outputs o the project in regard
to the Population Census are not
limited to national reports, provincial
reports, analytical reports, and
the census atlas, but also include
statistics and statistical maps on asmall area basis. In the project, Japan
also provided unds or constructing
a new building, complete with all
the required equipment or the NIS
in order to acilitate PC2008 data
processing, and to saely keep
the massive amount o PC2008
orms. For a PC2008 outline:
www.stat .go. jp/engl ish/ ino/
meetings/cambodia/census08.htm
Technical Assistance for the 2011
Economic Census
Since the implementation o the
economic census was a irst
experience or Cambodia, the
ollowing measures were taken in
the preparatory stages, starting in
2006 so that NIS and provincial sta
could accumulate knowledge and
techniques or the economic census:
1. Training or the NIS core sta
From 2006 to 2009, NIS core sta
were sent annually to Statistics
Indonesia (BPS) or advanced
training. Statistics Indonesia
has experience o conducting
the economic census, and has
undertaken three surveys in the past.
The training in Indonesia, to give the
core sta preparation or the 2011
Economic Census (EC2011), was
conducted (our times) with unding
assistance rom JICA. Training in
Indonesia was more eective than
in Japan, because the country
situation in Indonesia is more
similar to Cambodia than Japan.
Trainees rom the NIS learned rom
Indonesian experiences, and brought
the Census orms, manuals, and
other documents o the Indonesian
economic census back to Cambodia.
2. 2006 Establishment Listing in
Phnom Penh (sample survey)
3. 2007 Establishment Survey in
Phnom Penh (sample survey)
4. 2009 Nation-wide Establishment
Listing (complete count)
As a preliminary step toward EC2011,
this survey enumerated all existing
establishments in Cambodia,
produced an establishment
JICA Expert rom the Statistics Bureau o
Japan delivering statistical training
New building constructed or census data
processing
Activity Technical assistance Financial assistance
2008 Population Census UNFPA, JapanUNFPA, Germany,Japan
2009 Nation-wide Establishing Listing Japan Japan
2011 Economic Census Japan Japan
2013 Inter-censal Population Survey UNFPA, Japan UNFPA, Japan
2014 Inter-censal Economic Survey Japan Japan
Table 1. Shared roles among the partners
10 THE STATISTICS NEWSLETTER - OECD - Issue No. 55, March 2012
8/2/2019 49803839
http://slidepdf.com/reader/full/49803839 11/19
directory, and released the number o
establishments by area and industrial
sector. With this enumeration, it
became possible to plan EC2011
smoothly, since the picture o
establishments in Cambodia could
be more clearly grasped. Results
include statistics and statistical
maps on small-area basis in addition
to national reports.
5. 2010 Pilot Survey of EC2011
(sample survey)
This pilot survey was conducted
just one year beore EC2011 as a
dress rehearsal by using almostthe same orm as that o EC2011 so
that NIS and provincial sta could
acquire necessary knowledge
and experiences. 7,040 sample
establishments (199 villages) were
selected rom all 24 provinces
o Cambodia, and all the large
establishments with 100 persons
engaged or more were alsointerviewed.
6. 2011 Economic Census
The census was successully
conducted rom 01 to 31 March, 2011
as planned. The success owes to the
eorts o the NIS and provincial sta
with accumulated knowledge and
experiences through the preceding
our operations described in (2) to
(5) above.
Through these our actual surveys
and listings, the covered area has
gradually been expanded, and
the contents have also gradually
been upgraded to enhance skills
and knowledge o the sta. For
more details o the EC2011 outline:
www.stat .go. jp/engl ish/ ino/
meetings/cambodia/census11.htm
Conclusion
The 2008 Population Census
was successully implemented in
March 2008. The nal results were
released in September 2009 on
schedule, one year and six months
ater the reerence date. The total
population o Cambodia was
counted as 13.4 million. The 2009
nation-wide Establishment Listing
was also successully implemented
in February 2009. The nal results
were released in December 2009
on schedule, ten months ater the
reerence date. The total number o
establishments was 337 thousand.
Further, the 2011 Economic Census
was implemented successully in
March 2011.
Through Statistics Bureau o Japan’s
engagement in the project, the eelingrom the people involved is that
international cooperation in ocial
statistics is a rewarding experience,
as close personal relationships are
nurtured through the collaboration
among the proessionals o dierent
countries. International cooperation
can produce not only the planned
outcomes in ocial statistics butalso the mutual trust and riendship
among the proessionals involved in
the project.
On the occasion o the successul
completion o three huge tasks on
schedule, the Statistics Bureau o
Japan wishes to express its thanks
to the NIS and provincial sta who
made great eorts that led to the
success. We also wish to express
our appreciation to UNFPA and theGovernment o the Federal Republic
o Germany or the excellent
partnership in the 2008 Population
Census. Further, we express our
sincere thanks also to the Statistics
Indonesia which kindly devoted their
precious resources to provide the
training on the economic census or
the Cambodian statistical sta.
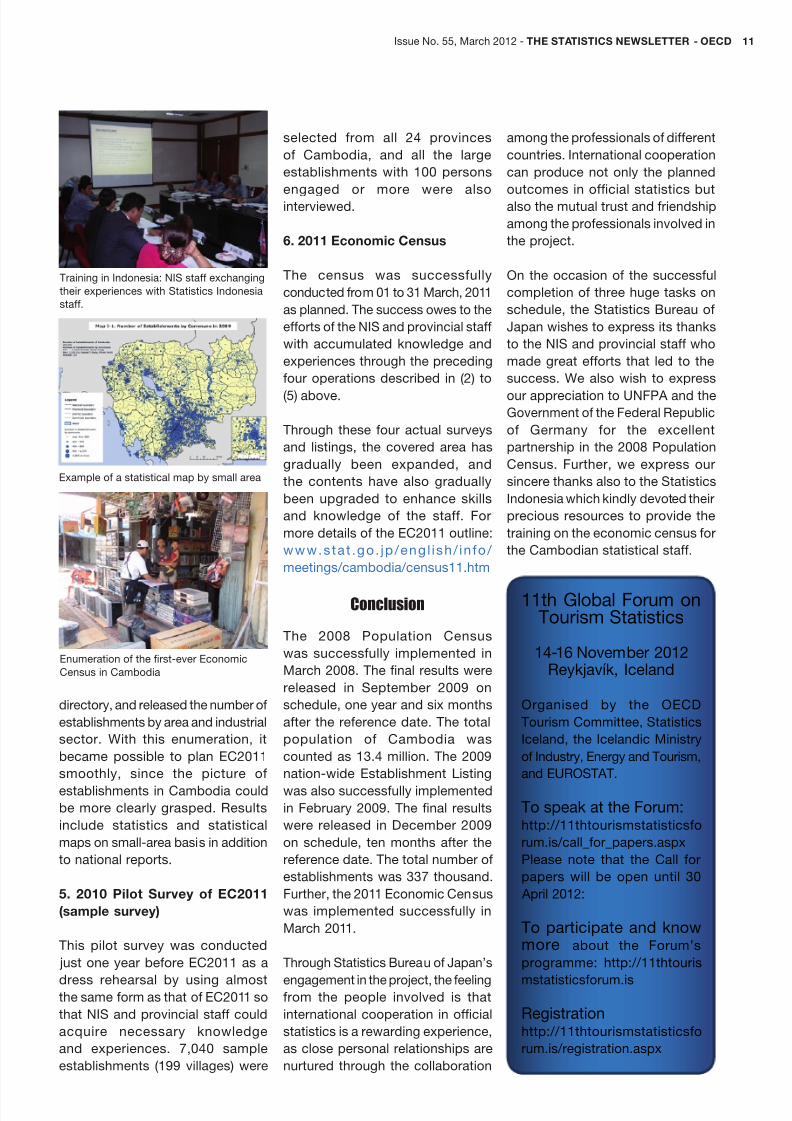
Example o a statistical map by small area
Enumeration o the rst-ever Economic
Census in Cambodia
Training in Indonesia: NIS sta exchanging
their experiences with Statistics Indonesia
sta.
11th Global Forum onTourism Statistics
14-16 November 2012Reykjavík, Iceland
Organised by the OECD
Tourism Committee, Statistics
Iceland, the Icelandic Ministry
o Industry, Energy and Tourism,
and EUROSTAT.
To speak at the Forum:http://11thtourismstatisticso
rum.is/call_or_papers.aspx
Please note that the Call or
papers will be open until 30
April 2012:
To participate and knowmore about the Forum’s
programme: http://11thtouris
mstatisticsorum.is
Registrationhttp://11thtourismstatisticso
rum.is/registration.aspx
Issue No. 55, March 2012 - THE STATISTICS NEWSLETTER - OECD 11
8/2/2019 49803839
http://slidepdf.com/reader/full/49803839 12/19
The Statute o the European
System o Central Banks
establishes that the ECB,
assisted by the national central
banks, shall collect the necessary
statistical inormation to undertake
the ESCB tasks. Since its inception,and even more in the atermath
o the nancial crisis, the ECB
has continuously sought ways o
improving the quality and provision
o such statistics. A major milestone
in this process has been the ECB’s
recent publication o improved
monetary nancial institutions (MFIs)
interest rate statistics in June 2011.
This article describes theimprovements made to the banking
interest rate statistics collected by
NCBs and compiled and published by
the ECB. Note that banks represent
by ar the largest component in the
MFI sector and MFI interest rate
statistics are entirely collected rom
credit institutions. This interest rate
dataset reers to eective interest
rates applied by credit institutions
resident in the euro area to deposits
and loans vis-à-vis households and
non-nancial corporations. Its aim
is to produce a comprehensive,
detailed and harmonised statistical
picture o the level and the changes
in interest rates applied by MFIs. The
collection o harmonised monetary
and nancial statistics is based on
Regulation ECB/2001/18 and the
latest enhancements stemming
rom ECB/2009/7 ( www.ecb.int/ecb/
legal/1005/1021/html/index.en.html ).
Background
MFI interest rate statistics are
collected or a number o purposes:
rstly, they provide an important
input in analysing the transmission o
monetary policy to the real economy.
In particular, they make it possible to
study the pass-through o changes
rom policy rates over market interest
rates to rates on loans and deposits;thus, these statistics enable the
ECB to assess the transmission
and impact o monetary policy on
the cost o borrowing, as part o
the cost o capital, to households
and non-inancial corporations.
Secondly, MFI interest rate statistics
enhance the monetary analysis o
euro area aggregates by providing
data which complement MFI balance
sheet statistics. MFI interest ratestatistics also provide inormation
on the degree o integration o
European nancial markets, thereby
allowing consumers to compare
the rates charged by MFIs across
countries. For more inormation on
the purposes o collecting interest
rates, see articles “Enhancements
to MFI balance sheet and interest rate
statistics”, Monthly Bulletin, ECB, April
2002, and “The use of harmonised
MFI interest rate statistics”, Monthly
Bulletin, ECB, July 2005.
In order to be able to perorm analyses
with reliable euro area aggregated
data, in turn enabling cross-country
comparisons, a harmonised reporting
ramework was set up (regulation
ECB/2001/18). Consequently, since
2003, harmonised data have been
available on interest rates and
business volumes or new businessagreements and outstanding
amounts. Inormation on outstanding
amounts is drawn rom MFI balance
sheet statistics, whereas inormation
on new business volumes is
collected together with interest
rate inormation. Inormation on
euro area interest rates relies on
the average o national interest rate
series, weighted by the respective
volumes and aggregated to calculate
euro area MFI interest rates. Thesestatistics are subdivided by sector
(i.e. households and non-nancial
corporations), split between deposits
and loans and broken down by initial
rate xation period and/or original
maturity.
Overview of the New Statisticson MFI Interest Rates
Financial innovation and experiencewith the rst harmonised ramework
or MFI interest rates or the euro
area highlighted the need or urther
enhancements and breakdowns in
order to keep these statistics t
or use, particularly with regard to
rates on new loans. For example,
the existing MFI interest rate
statistics were not detailed enough
to be able to answer questions on
the costs o unding or small and
medium-sized enterprises (SMEs)
nor on the comparability o loans
to households (or other purposes)
in light o the inclusion o statistics
on sole proprietors (e.g. doctors,
lawyers or architects) and their
dierent relevance across countries.
Consequently, in the enhanced
reporting ramework, the ollowing
aspects have been improved:
1. renements in the size classeso new loans to non-nancial
corporations;
2. rened breakdowns by period
o rate xation;
european Central bank
enhanCements on eCb mfI Interest rate statIstICs
Javier Huerga, Josep Puigvert and Costanza Rodriguez, European Central Bank
12 THE STATISTICS NEWSLETTER - OECD - Issue No. 55, March 2012
8/2/2019 49803839
http://slidepdf.com/reader/full/49803839 13/19
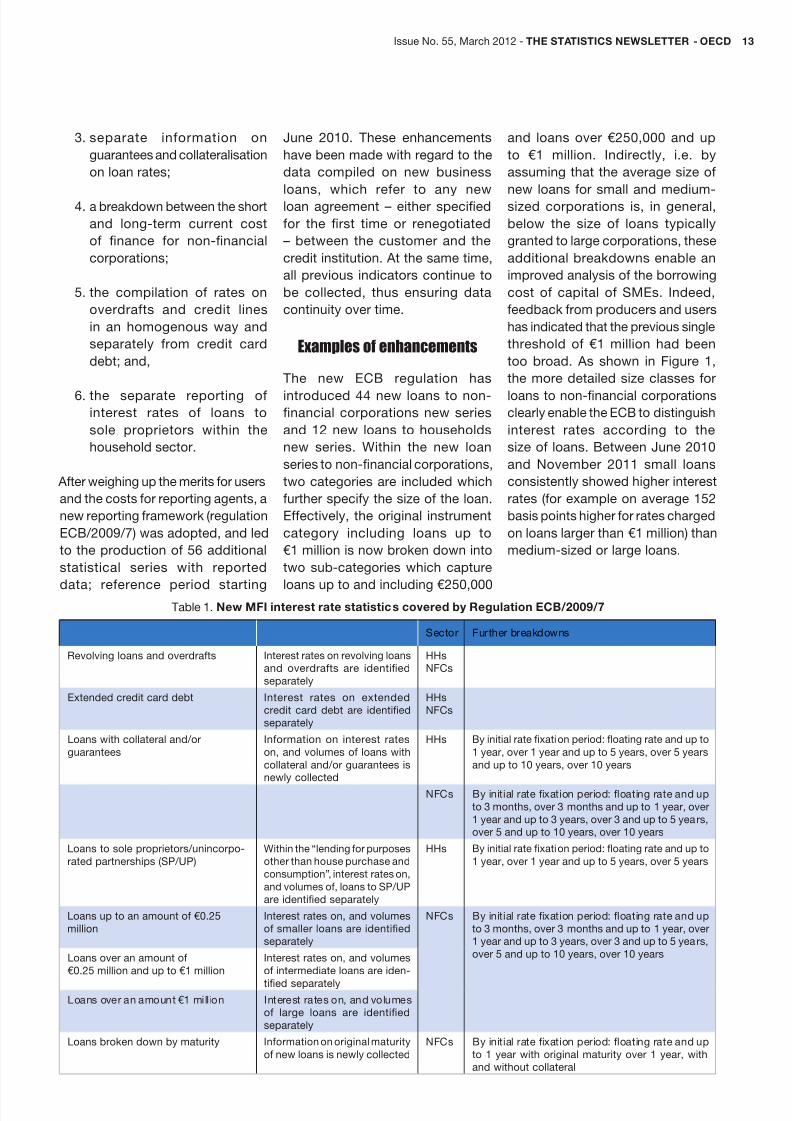
3. separate inormation on
guarantees and collateralisation
on loan rates;
4. a breakdown between the short
and long-term current cost
o nance or non-nancial
corporations;
5. the compilation o rates on
overdrats and credit lines
in an homogenous way and
separately rom credit card
debt; and,
6. the separate reporting ointerest rates o loans to
sole proprietors within the
household sector.
Ater weighing up the merits or users
and the costs or reporting agents, a
new reporting ramework (regulation
ECB/2009/7) was adopted, and led
to the production o 56 additional
statistical series with reported
data; reerence period starting
June 2010. These enhancements
have been made with regard to the
data compiled on new business
loans, which reer to any newloan agreement – either specied
or the rst time or renegotiated
– between the customer and the
credit institution. At the same time,
all previous indicators continue to
be collected, thus ensuring data
continuity over time.
Examples of enhancements
The new ECB regulation has
introduced 44 new loans to non-nancial corporations new series
and 12 new loans to households
new series. Within the new loan
series to non-nancial corporations,
two categories are included which
urther speciy the size o the loan.
Eectively, the original instrument
category including loans up to
€1 million is now broken down into
two sub-categories which capture
loans up to and including €250,000
and loans over €250,000 and up
to €1 million. Indirectly, i.e. by
assuming that the average size o
new loans or small and medium-sized corporations is, in general,
below the size o loans typically
granted to large corporations, these
additional breakdowns enable an
improved analysis o the borrowing
cost o capital o SMEs. Indeed,
eedback rom producers and users
has indicated that the previous single
threshold o €1 million had been
too broad. As shown in Figure 1,
the more detailed size classes or
loans to non-nancial corporationsclearly enable the ECB to distinguish
interest rates according to the
size o loans. Between June 2010
and November 2011 small loans
consistently showed higher interest
rates (or example on average 152
basis points higher or rates charged
on loans larger than €1 million) than
medium-sized or large loans.
Sector Further breakdowns
Revolving loans and overdrats Interest rates on revolving loans
and overdrats are identied
separately
HHsNFCs
Extended credit card debt Interest rates on extendedcredit card debt are identied
separately
HHs
NFCs
Loans with collateral and/or
guarantees
Inormation on interest rates
on, and volumes o loans with
collateral and/or guarantees isnewly collected
HHs By initial rate xation period: foating rate and up to
1 year, over 1 year and up to 5 years, over 5 years
and up to 10 years, over 10 years
NFCs By initial rate xation period: foating rate and up
to 3 months, over 3 months and up to 1 year, over
1 year and up to 3 years, over 3 and up to 5 years,over 5 and up to 10 years, over 10 years
Loans to sole proprietors/unincorpo-
rated partnerships (SP/UP)
Within the “lending or purposes
other than house purchase and
consumption”, interest rates on,
and volumes o, loans to SP/UP
are identied separately
HHs By initial rate xation period: foating rate and up to
1 year, over 1 year and up to 5 years, over 5 years
Loans up to an amount o €0.25
million
Interest rates on, and volumeso smaller loans are identied
separately
NFCs By initial rate xation period: foating rate and up
to 3 months, over 3 months and up to 1 year, over1 year and up to 3 years, over 3 and up to 5 years,
over 5 and up to 10 years, over 10 yearsLoans over an amount o
€0.25 million and up to €1 million
Interest rates on, and volumes
o intermediate loans are iden-
tied separately
Loans over an amount €1 mill ion Interest rates on, and volumeso large loans are identied
separately
Loans broken down by maturity Inormation on original maturity
o new loans is newly collected
NFCs By initial rate xation period: foating rate and upto 1 year with original maturity over 1 year, with
and without collateral
Table 1. New MFI interest rate statistics covered by Regulation ECB/2009/7
Issue No. 55, March 2012 - THE STATISTICS NEWSLETTER - OECD 13

8/2/2019 49803839
http://slidepdf.com/reader/full/49803839 14/19
Sole proprietors or unincorporated
partnerships represent an
economic group previously not
distinguishable within the householdsector. According to the new ECB
regulation, loans to small-scale
unincorporated businesses and
loans to sel-employed persons,
e.g. physicians or lawyers, are now
separately identied. The new data
thus show that the interest rate or
new loans or these micro-rms
ranged between that o small and
medium-sized loans or the period
rom June 2010 to November 2011
(gure 1).
Particularly when studying
renancing patterns, it is oten o
interest to understand the maturity
prole o new loans to non-nancial
corporations with short interest rate
xation periods. In this respect,
the new Regulation introduces a
new indicator which distinguishes
business volumes within the
category o new loans to non-nancial corporations with an initial
rate xation period o up to one year
that have an original maturity o up to
one year rom those with an original
maturity o over one year. Figure 2
shows that, on average, between July
2010 and November 2011, 81.75% o
loans to non-nancial corporations
(up to €250,000) had an original
maturity o less than one year.
Finally, new series ocusing on loans
with collateral and/or guarantees
have been made available to allow
the measurement o the amount and
dynamics o loan collateralisation.
Interest rates charged on loans with
collateral result rom the interaction
o opposite incentives: on the onehand, loans with collateral provide
banks with greater insurance, thereby
leading to lower rates, all other
eatures being equal; on the other
hand, when dealing with higher-risk
customers, lenders may be inclined
to reuse a loan unless guarantees
or collateral are provided. In those
cases, higher rates are charged
than other borrowers, however
reerring to customers who would
have otherwise not be granted loans.
Between June 2010 and November
2011 interest rates on collateralised
loans to non-nancial corporations
oten appear to be higher than
those on non-collateralised loans,
suggesting that the second incentivetends to dominate the rate-setting
behaviour o banks in the euro area.
Dissemination on MFI InterestRate Statistics
Aggregated euro area data, as
well as country-specic statistics
or participating Member States,
are published by the ECB on a
monthly basis and are ollowed by
the dissemination o a press release
( www.ecb.europa.eu/press/pr/stats/
m/html/index.en.html ). The ull set
o statistics can be downloaded
rom the “MFI interest rates” part o
the “Money, banking and nancial
markets” section o the ECB’s
Statistical Data Warehouse ( http://
sdw.ecb.europa.eu ). More detailed
inormation on MFI interest rate
statistics, including the release
calendar, is available rom the “Bankinterest rates” part o the “Monetary
and nancial statistics” section o
the ECB’s statistics website ( www.
ecb.europa.eu/stats/money/interest/
interest/html/index.en.html ).
1.5
2
2.5
3
3.5
4
4.5
5
Jun.10 Aug.10 Oct.10 Dec.10 Feb.11 Apr.11 Jun.11 Aug.11 Oct.11
up to an amount of € 0.25 million over an amount of € 1mill ion sole proprietors
0
5
10
15
20
25
30
35
Jun.10 Jul.10 Aug.10 Sep.10 Oct.10 Nov.10 Dec.10 Jan.11 Feb.11 Mar.11 Apr.11 May.11
original maturity of up to 1 year original maturity of over 1 year
Figure 1. Evolution o MFI interest rates on new loans to non-nancial
corporations with foating rate and up to three-month initial rate xation
by loan size and new loans to sole proprietors (percentages per annum
excluding charges; period averages)
Figure 2. New loans to non-nancial corporations up to €250,000 with
foating rate and up to one year initial rate xation, arranged by maturity
(EUR billions; non-seasonally adjusted)
14 THE STATISTICS NEWSLETTER - OECD - Issue No. 55, March 2012
8/2/2019 49803839
http://slidepdf.com/reader/full/49803839 15/19
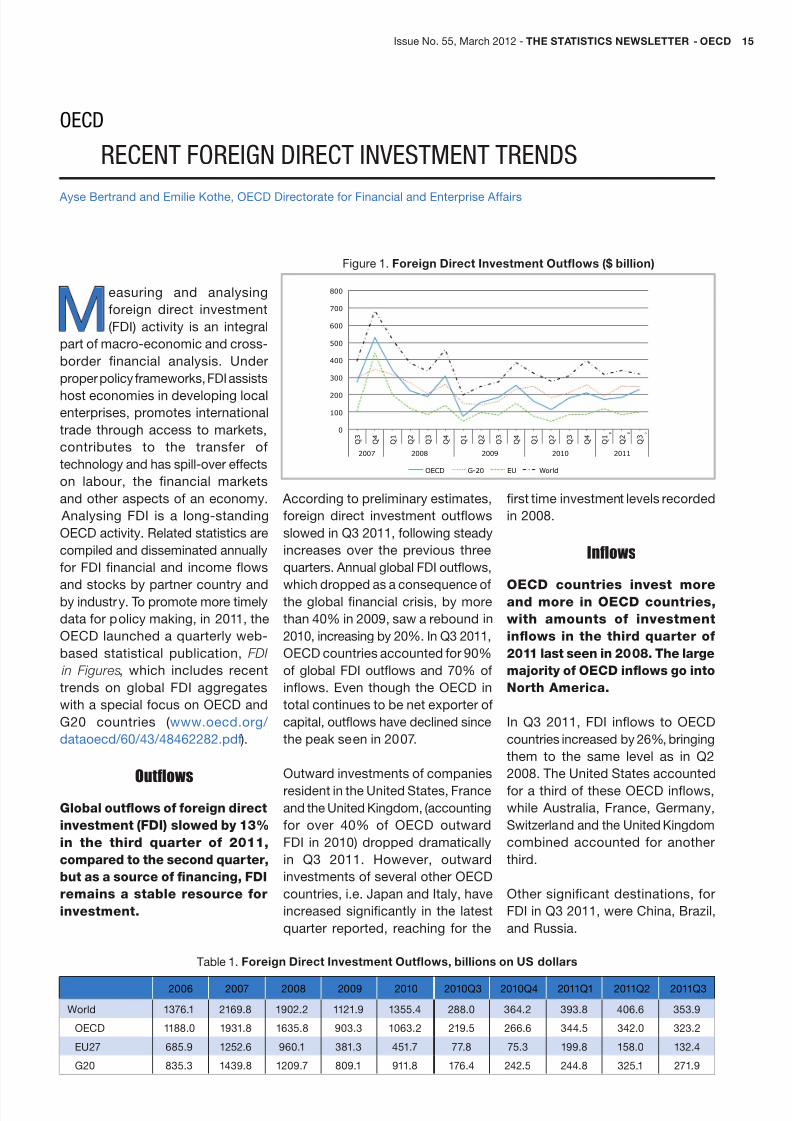
According to preliminary estimates,
oreign direct investment outfows
slowed in Q3 2011, ollowing steady
increases over the previous three
quarters. Annual global FDI outfows,
which dropped as a consequence othe global nancial crisis, by more
than 40% in 2009, saw a rebound in
2010, increasing by 20%. In Q3 2011,
OECD countries accounted or 90%
o global FDI outfows and 70% o
infows. Even though the OECD in
total continues to be net exporter o
capital, outfows have declined since
the peak seen in 2007.
Outward investments o companies
resident in the United States, France
and the United Kingdom, (accounting
or over 40% o OECD outward
FDI in 2010) dropped dramatically
in Q3 2011. However, outward
investments o several other OECD
countries, i.e. Japan and Italy, have
increased signicantly in the latest
quarter reported, reaching or the
rst time investment levels recorded
in 2008.
Inows
OECD countries invest moreand more in OECD countries,
with amounts o investment
infows in the third quarter o
2011 last seen in 2008. The large
majority o OECD inows go into
North America.
In Q3 2011, FDI infows to OECD
countries increased by 26%, bringing
them to the same level as in Q2
2008. The United States accounted
or a third o these OECD infows,
while Australia, France, Germany,
Switzerland and the United Kingdom
combined accounted or another
third.
Other signicant destinations, or
FDI in Q3 2011, were China, Brazil,
and Russia.
Measuring and analysing
oreign direct investment
(FDI) activity is an integral
part o macro-economic and cross-
border nancial analysis. Under
proper policy rameworks, FDI assists
host economies in developing localenterprises, promotes international
trade through access to markets,
contributes to the transer o
technology and has spill-over eects
on labour, the nancial markets
and other aspects o an economy.
Analysing FDI is a long-standing
OECD activity. Related statistics are
compiled and disseminated annually
or FDI nancial and income fows
and stocks by partner country andby industry. To promote more timely
data or policy making, in 2011, the
OECD launched a quarterly web-
based statistical publication, FDI
in Figures, which includes recent
trends on global FDI aggregates
with a special ocus on OECD and
G20 countries ( www.oecd.org/
dataoecd/60/43/48462282.pd ).
Outows
Global outows o oreign direct
investment (FDI) slowed by 13%
in the third quarter o 2011,
compared to the second quarter,
but as a source o fnancing, FDI
remains a stable resource or
investment.
oeCd
reCent foreIgn dIreCt Investment trends
Ayse Bertrand and Emilie Kothe, OECD Directorate or Financial and Enterprise Aairs
0
100
200
300
400
500
600
700
800
Q 3
Q 4
Q 1
Q 2
Q 3
Q 4
Q 1
Q 2
Q 3
Q 4
Q 1
Q 2
Q 3
Q 4
Q 1
Q 2
Q 3
2007 2008 2009 2010 2011
OECD G-20 EU World
p p p
Figure 1. Foreign Direct Investment Outfows ($ billion)
2006 2007 2008 2009 2010 2010Q3 2010Q4 2011Q1 2011Q2 2011Q3
World 1376.1 2169.8 1902.2 1121.9 1355.4 288.0 364.2 393.8 406.6 353.9
OECD 1188.0 1931.8 1635.8 903.3 1063.2 219.5 266.6 344.5 342.0 323.2
EU27 685.9 1252.6 960.1 381.3 451.7 77.8 75.3 199.8 158.0 132.4
G20 835.3 1439.8 1209.7 809.1 911.8 176.4 242.5 244.8 325.1 271.9
Table 1. Foreign Direct Investment Outfows, billions on US dollars
Issue No. 55, March 2012 - THE STATISTICS NEWSLETTER - OECD 15

8/2/2019 49803839
http://slidepdf.com/reader/full/49803839 16/19
FDI Stocks
Stocks o FDI, both inward
and outward, or most OECD
countries, both in terms o
US dollars and measured as apercentage o GDP, continued
to grow over the last fve years
to 2010.
The United States has by the ar the
largest amount o both inward and
outward stock o FDI as measured
in US dollars, or example in 2010
there was 2.7 trillion US dollars o
FDI stock in the United States while
US companies held FDI stock o
4.4 trillion US dollars. Only France,
Germany, the United Kingdom and
China (or inward investment) come
close to these very large amounts.
However, the relative importance
o FDI or the United States,
measured as a percentage o
GDP, was only 18 per cent in 2010
or inward investment and 31 per
cent or investments abroad. In
countries hosting Special Purpose
Entities this ratio is usually ar in
excess o OECD average or bothinward (30 per cent) and outward
investments ( 39 per cent). In the
same year, G-20 countries’ inward
investments were 24 per cent o their
GDP combined and 28 per cent o
outward investments.
Find up to date and detailed
FDI statistics at www.oecd.org/
investment/statistics
Defnition
Foreign Direct Investment is a category
o investment that refects the objective
of establishing a lasting interest by a
resident enterprise in one economy
(direct investor) in an enterprise
(direct investment enterprise) that is
resident in an economy other than
0
100
200
300
400
500
600
700
800
Q 3
Q 4
Q 1
Q 2
Q 3
Q 4
Q 1
Q 2
Q 3
Q 4
Q 1
Q 2
Q 3
Q 4
Q 1
Q 2
Q 3
2007 2008 2009 2010 2011
OECD G-20 EU World
p p p
Figure 2. Foreign Direct Investment Infows ($ billion) that of the direct investor. The lasting
interest implies the existence o a long-
term relationship between the direct
investor and the direct investment
enterprise and a signifcant degree
o inuence (not necessarily control)
on the management of the enterprise.
The direct or indirect ownership o
10% or more o the voting power o
an enterprise resident in one economy
by an investor resident in another
economy is the statistical evidence of
such a relationship.
FDI statistics are on a directional basis
(inward or outward) and relate to FDI
ows, FDI positions (stocks) and FDI
income. Outward investments are
cross-border investments by directinvestors resident in the reporting
country while inward investments are
investments by non-resident investors
in the reporting country.
FDI ows are cross-border fnancial
transactions within a given period
(e.g. year, quarter) between afliated
enterprises that are in a direct
investment relationship. FDI positions
relate to the stock of investments at a
given point in time (e.g. end o year,
end o quarter). FDI fows and positions
include equity (10% or more voting
shares), reinvestment of earnings and
inter-company debt. FDI income is the
return on direct investment positions
o equity (dividends and reinvested
earnings) and debt (interest).
Table 3. Foreign Direct Investment Stocks, as a percentage o GDP
Inwards Outwards
2006 2007 2008 2009 2010 2006 2007 2008 2009 2010
OECD Total 26.0 29.0 26.0 30.4 30.0 30.5 34.3 33.1 39.3 39.4
EU27 Total 41.0 44.4 38.1 46.2 46.0 45.2 48.2 44.6 55.2 56.4
G20 Total 20.7 22.4 19.4 23.4 23.6 23.7 26.5 24.1 28.3 27.8
2006 2007 2008 2009 2010 2010Q3 2010Q4 2011Q1 2011Q2 2011Q3
World 1453.6 1962.8 1745.8 1136.6 1244.7 306.0 395.1 314.1 336.6 317.0
OECD 1008.2 1354.8 1055.8 6663.1 659.8 178.0 208.9 171.1 181.8 228.3
EU27 562.9 856.6 537.1 371.8 291.6 84.3 87.1 116.8 82.9 99.1
G20 915.4 1194.4 1042.6 670.5 805.3 208.3 254.6 189.6 248.4 246.3
Table 2. Foreign Direct Investment Infows, billions o US dollars
16 THE STATISTICS NEWSLETTER - OECD - Issue No. 55, March 2012

8/2/2019 49803839
http://slidepdf.com/reader/full/49803839 17/19
publICatIons
reCent publICatIons
National Accounts at a Glance 2011
National Accounts at a Glance is designed to present the national accounts in a way that refects
the richness inherent in the data and the value it represents or analysts and policymakers. It
responds to the Stiglitz Commission’s recommendation that policymakers look beyond just
GDP when they assess material well-being o citizens.
In particular it uses national accounts data to show important ndings about households and
governments, including important series on gross adjusted household income and non-nancial
xed assets o households, and new series, among others, on general government expenditures by unction.
The publication is broken down into six key chapters, and provides indicators related to GDP, income, expenditure,
production, government and capital respectively.
OECD (2011), National Accounts at a Glance 2011, OECD Publishing.
www.oecd.org/statistics/nationalaccounts/ataglance
Latin American Economic Outlook 2012
Transorming the State or Development
Even in the midst o a global nancial crisis, Latin American and Caribbean economies nd
themselves in better condition than in years past. Latin America must seize this opportunity to
design and implement good public policies. The greatest o the long-term objectives o Latin
American states remains development: economic growth and structural change that is rapid,
sustainable and inclusive. In particular, governments must reduce inequalities in income, public-
service delivery and opportunities, as well as promote the diversication o economies, oten concentrated ona ew primary-product exports.
OECD/Economic Commission or Latin America and the Caribbean (2012), Latin American Economic Outlook
2012: Transforming the State for Development, OECD Publishing
www.oecd.org/document/41/0,3746,en_2649_33731_48925737_1_1_1_1,00.html
Southeast Asian Economic Outlook 2011/12
This edition o the Southeast Asian Economic Outlook examines the macroeconomic situation,
policies and medium-term growth prospects or countries in the region; structural challenges;
green growth strategies, policies and institutions; and environmental taxes. It nds that growth or
the region will moderate in the near term but solid growth perormance will continue until 2016.
To sustain this avourable outlook, countries need to meet considerable structural challenges.
Green growth oers an alternative growth strategy in the long term.
OECD (2012), Southeast Asian Economic Outlook 2011/12, OECD Publishing
www.oecd.org/document/40/0,3746,en_2649_33731_48965544_1_1_1_1,00.html
Issue No. 55, March 2012 - THE STATISTICS NEWSLETTER - OECD 17
8/2/2019 49803839
http://slidepdf.com/reader/full/49803839 18/19
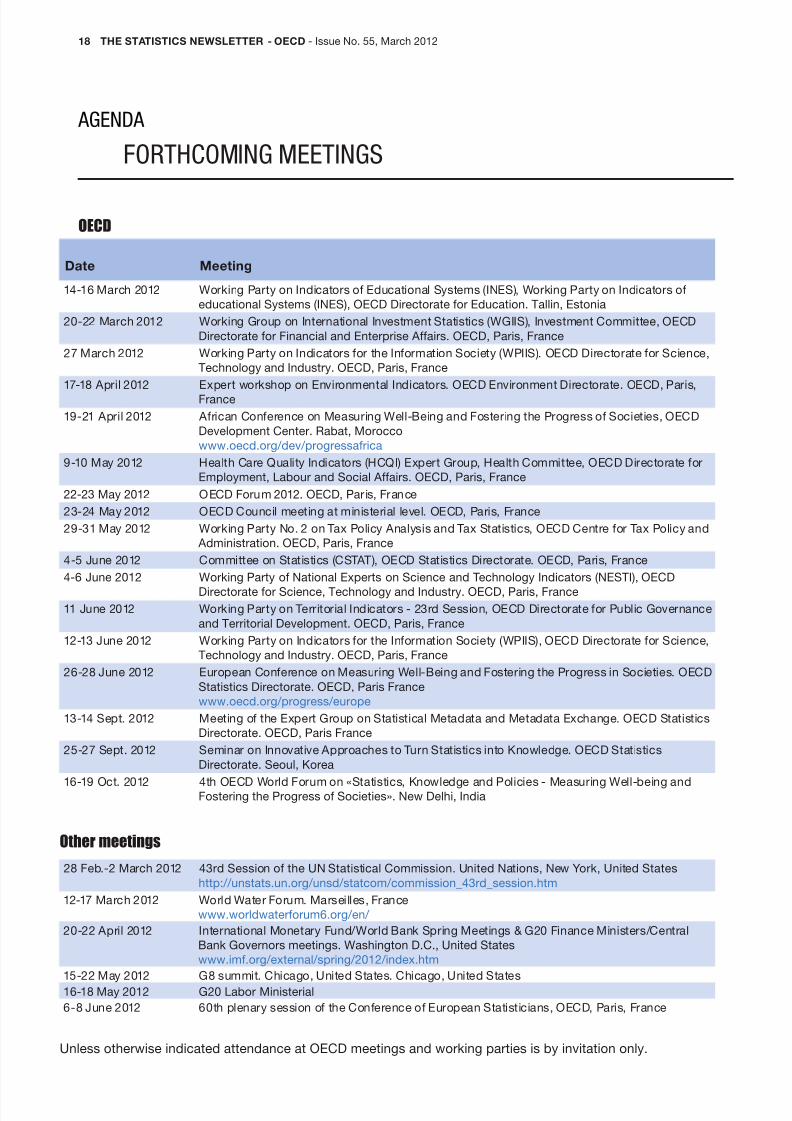
agenda
forthComIng meetIngs
Date Meeting
14-16 March 2012 Working Party on Indicators o Educational Systems (INES), Working Party on Indicators o
educational Systems (INES), OECD Directorate or Education. Tallin, Estonia
20-22 March 2012 Working Group on International Investment Statistics (WGIIS), Investment Committee, OECD
Directorate or Financial and Enterprise Aairs. OECD, Paris, France
27 March 2012 Working Party on Indicators or the Inormation Society (WPIIS). OECD Directorate or Science,
Technology and Industry. OECD, Paris, France
17-18 April 2012 Expert workshop on Environmental Indicators. OECD Environment Directorate. OECD, Paris,
France
19-21 April 2012 Arican Conerence on Measuring Well-Being and Fostering the Progress o Societies, OECD
Development Center. Rabat, Morocco
www.oecd.org/dev/progressarica
9-10 May 2012 Health Care Quality Indicators (HCQI) Expert Group, Health Committee, OECD Directorate or
Employment, Labour and Social Aairs. OECD, Paris, France
22-23 May 2012 OECD Forum 2012. OECD, Paris, France
23-24 May 2012 OECD Council meeting at ministerial level. OECD, Paris, France
29-31 May 2012 Working Party No. 2 on Tax Policy Analysis and Tax Statistics, OECD Centre or Tax Policy and
Administration. OECD, Paris, France
4-5 June 2012 Committee on Statistics (CSTAT), OECD Statistics Directorate. OECD, Paris, France
4-6 June 2012 Working Party o National Experts on Science and Technology Indicators (NESTI), OECD
Directorate or Science, Technology and Industry. OECD, Paris, France
11 June 2012 Working Party on Territorial Indicators - 23rd Session, OECD Directorate or Public Governance
and Territorial Development. OECD, Paris, France
12-13 June 2012 Working Party on Indicators or the Inormation Society (WPIIS), OECD Directorate or Science,
Technology and Industry. OECD, Paris, France
26-28 June 2012 European Conerence on Measuring Well-Being and Fostering the Progress in Societies. OECD
Statistics Directorate. OECD, Paris France
www.oecd.org/progress/europe
13-14 Sept. 2012 Meeting o the Expert Group on Statistical Metadata and Metadata Exchange. OECD Statistics
Directorate. OECD, Paris France
25-27 Sept. 2012 Seminar on Innovative Approaches to Turn Statistics into Knowledge. OECD Statistics
Directorate. Seoul, Korea
16-19 Oct. 2012 4th OECD World Forum on «Statistics, Knowledge and Policies - Measuring Well-being andFostering the Progress o Societies». New Delhi, India
Other meetings
28 Feb.-2 March 2012 43rd Session o the UN Statistical Commission. United Nations, New York, United States
http://unstats.un.org/unsd/statcom/commission_43rd_session.htm
12-17 March 2012 World Water Forum. Marseilles, France
www.worldwaterorum6.org/en/
20-22 April 2012 International Monetary Fund/World Bank Spring Meetings & G20 Finance Ministers/Central
Bank Governors meetings. Washington D.C., United States
www.im.org/external/spring/2012/index.htm
15-22 May 2012 G8 summit. Chicago, United States. Chicago, United States
16-18 May 2012 G20 Labor Ministerial
6-8 June 2012 60th plenary session o the Conerence o European Statisticians, OECD, Paris, France
Unless otherwise indicated attendance at OECD meetings and working parties is by invitation only.
OECD
18 THE STATISTICS NEWSLETTER - OECD - Issue No. 55, March 2012

8/2/2019 49803839
http://slidepdf.com/reader/full/49803839 19/19
The Statistics Newsletteror the extended OECD statistical network
Issue 55 - March 2012
www.oecd.org/std/statisticsnewsletter


