459 TheThermal Conductivities of Certain...
12
459 TheThermal Conductivities of Certain Liquids. By G. W. C. K aye , O.B.E., M.A., D.Sc., and W. F. H iggins , M.Sc ., Physics Department, The National Physical Laboratory. (Communicated by Sir Joseph Petavel, F.R.S.—Received September 14, 1927.) The determination of the thermal conductivity of liquids and the variation with temperature has received the attention of a number of workers in the past, notably, Lees in 1898, R. Weber in 1903, and Goldschmidt in 1911. In general, however, the temperature ranges explored were somewhat restricted, and the present work was accordingly directed to determining the conductivities of a number of the more common liquids up to the highest temperatures feasible. In measuring the thermal conductivity of a liquid it is, of course, essential that convection effects should be reduced to a minimum. This may be effected by employing small temperature differences across a thin horizontal layer of the liquid, the heat flow being directed downwards. Apparatus. An apparatus was accordingly designed in which a thin horizontal layer of the liquid was sandwiched between two aluminium blocks, the upper “ hot block ” containing an electric heating coil and the lower “ cold block ” being provided with radiating fins. Escape of heat from the hot block in an upward direction was prevented by mounting above the hot block, and separated from it by a thin film of air, an aluminium “ guard plate ” containing a subsidiary heating coil.* The current through the subsidiary coil was then adjusted until there was no temperature drop across the air film, so that apart from a small loss from the sides of the hot block, the energy supplied to the main heating coil was all transmitted downwards through the test liquid. The apparatus was completely enclosed in a thermostatically controlled oven which was raised to the appropriate temperature for the purpose of the test in hand. By this means the unavoidable surface losses were reduced as the oven temperature was usually only some 10° C. below that of the hot block. The apparatus is shown diagrammatically to scale in fig. 1. The aluminium blocks were cylindrical and 5 cms. in diameter, so that the area of the test layer of liquid was about 20 sq. cms. The temperatures at the faces of the two * We find that a similar device was employed by Hercus and Laby in measuring the conductivity of air. ‘ Roy. Soc. Proc.,’ A., vol. 95, p. 190 (1918). YOL. CXVII.—A. 2 I on June 18, 2018 http://rspa.royalsocietypublishing.org/ Downloaded from
Transcript of 459 TheThermal Conductivities of Certain...

459
The Thermal Conductivities o f Certain Liquids.By G. W. C. K a y e , O.B.E., M.A., D.Sc., and W. F. H ig g in s , M.Sc., Physics
Department, The National Physical Laboratory.
(Communicated by Sir Joseph Petavel, F.R.S.—Received September 14, 1927.)
The determination of the thermal conductivity of liquids and the variation with temperature has received the attention of a number of workers in the past, notably, Lees in 1898, R. Weber in 1903, and Goldschmidt in 1911. In general, however, the temperature ranges explored were somewhat restricted, and the present work was accordingly directed to determining the conductivities of a number of the more common liquids up to the highest temperatures feasible.
In measuring the thermal conductivity of a liquid it is, of course, essential that convection effects should be reduced to a minimum. This may be effected by employing small temperature differences across a thin horizontal layer of the liquid, the heat flow being directed downwards.
Apparatus.An apparatus was accordingly designed in which a thin horizontal layer of
the liquid was sandwiched between two aluminium blocks, the upper “ hot block ” containing an electric heating coil and the lower “ cold block ” being provided with radiating fins. Escape of heat from the hot block in an upward direction was prevented by mounting above the hot block, and separated from it by a thin film of air, an aluminium “ guard plate ” containing a subsidiary heating coil.* The current through the subsidiary coil was then adjusted until there was no temperature drop across the air film, so that apart from a small loss from the sides of the hot block, the energy supplied to the main heating coil was all transmitted downwards through the test liquid. The apparatus was completely enclosed in a thermostatically controlled oven which was raised to the appropriate temperature for the purpose of the test in hand. By this means the unavoidable surface losses were reduced as the oven temperature was usually only some 10° C. below that of the hot block.
The apparatus is shown diagrammatically to scale in fig. 1. The aluminium blocks were cylindrical and 5 cms. in diameter, so that the area of the test layer of liquid was about 20 sq. cms. The temperatures at the faces of the two
* We find th a t a similar device was employed by Hercus and Laby in measuring the conductivity of air. ‘ Roy. Soc. Proc.,’ A., vol. 95, p. 190 (1918).
YOL. CXVII.—A. 2 I
on June 18, 2018http://rspa.royalsocietypublishing.org/Downloaded from

460
blocks between wbich the liquid was held were measured by thermocouples of which the aluminium blocks each served as one arm, the other being of con-
G. W. C. Kaye and W. F. Higgins.
Guord Plate Heater Lead Hoi’ Block Current’& (-oieniiai i_eads
%}:__guar d _; • ^V^AAAAAAAA/vVA^/w4" ftr?
PlateGailerq J[or.
excess liqui4vwwvvwv̂
stantan.* For the purpose, holes of small diameter were drilled from the sides of the blocks in a slanting direction until the test faces were reached at the appropriate points. Constantan wires were then inserted through the holes and provided with thin glass sheaths to insulate them from the aluminium, except at the actual faces where they were held in firm contact by small aluminium pegs. The faces of the blocks with the couples in position were then ground flat to a high degree of accuracy.
Bound the upper end of the cold block a small trough or gallery was affixed to hold the test liquid during assembly and to provide sufficient surplus to ensure that the space between the cold and hot blocks was always filled. It was obviously desirable that this gallery should be of material of low thermal conductivity, and it was, of course, essential that it should not be attacked by any of the liquids to be investigated, and, further, that its junction with the aluminium should remain liquid-tight as the temperature was raised. After some trials, asbestos paper was eventually chosen. This was moulded into shape while damp and secured to the aluminium block by a few turns of
* The use of alum inium -constantan couples for the measurement of tem peratures has been discussed in a previous paper by the present authors ; see “ Thermal Conductivity of Vitreous Silica,” ‘ Roy. Soc. P roc.,’ A, vol. 113, p. 335 (1926).
on June 18, 2018http://rspa.royalsocietypublishing.org/Downloaded from

Thermal Conductivities o f Certain Liquids. 461
wire pressing the asbestos into a shallow groove in the side of the cold block. After being allowred to dry it was treated with bakelite varnish and heated to the appropriate temperature, the process being repeated several times. This method of construction proved fully satisfactory. The gallery was finally fitted with a loose mica cover.
The hot block wras made np of two parts which screwed together and enclosed an electric heating grid of nichrome wire wound oil mica. A similar construction was adopted for the guard plate. The temperature of the hot block ranged between about 20° C. and 200° C. (wdiere feasible), and the power inputs were varied over a range of from 3 to 20 watts.
To separate the hot and cold blocks at a known distance three short lengths of glass rod, resting on their sides and of suitable diameter, were interposed. In the case of water, however, it was found more convenient to use three tiny pieces of silica plate cemented by a trace of bakelite varnish to the surface of the cold block, as it was found that the glass rods tended to float away during assembly. Preliminary tests had shown that the thickness of the liquid should not exceed 0*5 mm., and accordingly the experiments were conducted with thicknesses ranging from 0 • 25 to 0 • 5 mm. The operation of assembling the apparatus so that no air bubbles were trapped between the two surfaces was a matter of some practice. The hot block was gradually lowered in a tilted position into the liquid and was gently brought into the horizontal position, the air being swept to one side as more and more of the hot block became wetted by the liquid. The blocks were then aligned axially by means of centering screws which were withdrawn during the course of an experiment. The guard plate and hot block were similarly separated by glass distance pieces and a differential couple served to indicate whether their surfaces were at the same temperature. It may be added that the various test liquids were freed from air by pre-heating to as high a temperature as was feasible.
The apparatus was surrounded by a metal enclosure, the intervening space being packed with asbestos wool, and the whole was contained in the oven already referred to. The oven was heated electrically and a fan was provided to circulate the air, baffles being introduced to secure uniformity of temperature around the apparatus.
Corrections to be Applied to Experimental Data.{a) Lateral loss of heat.—As already mentioned, heat loss from the hot block
in an upward direction was prevented by the guard plate ; there was, however,2 i 2
on June 18, 2018http://rspa.royalsocietypublishing.org/Downloaded from

a small loss of heat from the sides of the hot block which had to be allowed for. The surrounding space being closely packed with asbestos wool, this side loss was due to conduction and not to radiation or convection, and should, therefore, depend directly upon the difference of temperature between the hot block and the metal enclosure. The magnitude of the correction was determined experimentally by taking observations under normal conditions when the test liquid was replaced by a material of known conductivity between the hot and cold blocks. Balsa wood was chosen for the purpose, as its conductivity is low and consequently the side loss becomes relatively more pronounced and so more readily measurable. A series of observations were made for different power inputs and different thicknesses of balsa wood, and it was found that the lateral loss was proportional, as was anticipated, to the temperature difference between the hot block and the surrounding metal enclosure. Quantitatively, the loss amounted to 0 • 0234 watts per °C. difference in temperature. This wTould include any loss of heat along the leads of the heating coil which, however, would be small in amount.
(b) Heat transferred through liquid in gallery.—By reference to fig. 1, it will be noted that, apart from the heat passing directly across the test layer of liquid, it was possible for heat to be transmitted from the hot to the cold block via the surplus liquid in the gallery. As in the case of the lateral loss, steps were taken to enhance the effect in order to obtain a more accurate estimate of its magnitude. This was done by increasing the thermal resistance of the test layer by inserting a disc of ebonite (1 mm. thick) between the test faces, and observations were then made for a series of temperature differences between the hot and cold blocks, first with the gallery full of liquid and then empty. I t was found that the correction to be subtracted from the power input, on this score, was proportional to the temperature difference, and to the conductivity of the liquid, and was given numerically (when the gallery was full, as under normal conditions of experiment) by the expression K X 42*0 watts per °C. difference between the blocks (K being the approximate conductivity of the liquid under test). The magnitude of this correction found in no case to exceed 3 per cent.
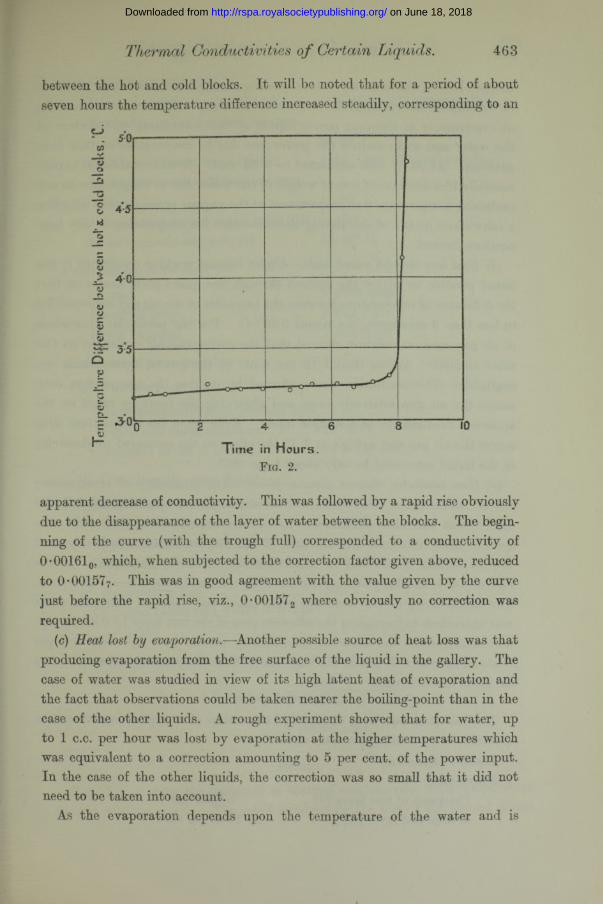
As an independent check on the above, the following experiment was carried out. The apparatus was set up in the normal way with water as the liquid under test. Observations were made at constant power input, first with the gallery full and afterwards from time to time as evaporation gradually lowered the level of the water, until ultimately the test layer itself began to disappear. Fig. 2 shows the gradual change with time in the temperature difference
462 G. W. C. Kaye and W. F. Higgins.
on June 18, 2018http://rspa.royalsocietypublishing.org/Downloaded from
Thermal Conductivities o f Certain Liquids. 463
between the hot and cold blocks. I t will be noted that for a period of about seven hours the temperature difference increased steadily, corresponding to an
w-f3
Z 4 5
“5 -C5051£
Ide
>
>
o c
6 0
Time in Hours.Fig. 2.
apparent decrease of conductivity. This was followed by a rapid rise obviously due to the disappearance of the layer of water between the blocks. The beginning of the curve (with the trough full) corresponded to a conductivity of 0-001610, which, when subjected to the correction factor given above, reduced to 0*001577. This was in good agreement with the value given by the curve just before the rapid rise, viz., 0*001572 where obviously no correction was required.
(c) Heat lost by evaporation.—Another possible source of heat loss was that producing evaporation from the free surface of the liquid in the gallery. The case of water was studied in view of its high latent heat of evaporation and the fact that observations could be taken nearer the boiling-point than in the case of the other liquids. A rough experiment showed that for water, up to 1 c.c. per hour was lost by evaporation at the higher temperatures which was equivalent to a correction amounting to 5 per cent, of the power input. In the case of the other liquids, the correction was so small that it did not need to be taken into account.
As the evaporation depends upon the temperature of the water and is
on June 18, 2018http://rspa.royalsocietypublishing.org/Downloaded from

464 G. W. C. Kaye and W. F. Higgins.
independent of the amount of heat passing through the test layer, the most direct way of ascertaining the correction necessary was to carry out a series of experiments at different power inputs at the same mean temperature of the water and so to deduce the power loss due to evaporation at that temperature. At 60° C. this amounted to 0-53 watt. I t was established experimentally that the rate of loss of weight of the water due to evaporation at any particular temperature was proportional to the vapour pressure, thus affording a convenient means of calculating the correction for evaporation at any temperature desired.
(d) Heat loss through guard plate.—Under normal working conditions it was found possible to adjust the current through the guard-plate heater so that the difference of temperature between the two sides of the air gap corresponded to less than 3 microvolts, i.e. about 0-07° C. For the particular dimensions of air gap used, calculation showed that the corresponding correction on this score amounted to less than 1/10 per cent, of the power input, which was negligible. This conclusion was confirmed by making the temperature drop across the air gap relatively large and observing the resulting effect on the apparent conductivity of a sample liquid. Even when the temperature drop across the air gap was as high as 2° C. the effect on the measured conductivity of the liquid amounted to only about 4 per cent.
(e) Heat conducted through distance-pieces.—The possibility of error arising out of conduction of heat through the distance-pieces separating the hot and cold blocks was also considered. As already stated, short glass rods were used in most instances, and the area of the contact between their sides and the aluminium blocks was so small that the effect was negligible. In the case of water, the flat plates of vitreous silica used had a total area 0-05 sq. cm. The conductivity of vitreous silica being about twice that of water, the effect was equivalent to increasing the effective area of the test layer by 0*05 sq. cm. and consequently the observed conductivity was in error by about 0-2 per cent. This was well within the experimental accuracy and so did not need to be taken into account.
Typical Experiment.The following data were obtained in the course of a typical experiment on
glycerine at a mean temperature of 50° C. :—Liquid: Glycerine.Dimensions :—-
Thickness of test layer (d) .. .. 0*0357 cm.Area of test layer (A) . . .. 20*27 sq. cms.
on June 18, 2018http://rspa.royalsocietypublishing.org/Downloaded from

Thermal Conductivities Certain 465
Temperature measurements:—Hot-face thermocouples (three) Equivalent mean hot-face tempera
ture
2134, 2132, 2133 microvolts.
52-20° C.Cold-face thermocouples (three) .. Equivalent mean cold-face tempera
ture. . . . . . . . .Temperature drop over test layer (80) Mean temperature of liquid
1945, 1943, 1945 microvolts.
47-80° C.4-40°C.
50-00° C.
Power supply to hot block :—Current Potential drop Power supplied
Corrections to power supply:—
1-0709 amp. 7-072 volts. 7-574 watts.
(a) Side loss :—
Temperature difference between hot block and metal enclosure .. 10 • 53° C.
Correction 10-53 X 0-0234 .. = 0-246 watt.
(b) Loss through excess liquid :—
Temperature difference between hot and cold blocks .. .. .. 4 • 40° C.
Approximate conductivity .. 0-00068.Correction 0-00068 x 4-40 X 42-0 =0-126 watt.
(c) Evaporation loss .. .. .. Nil.Corrected power (W), 7 • 574 — 0 • 246
— 0-126 .. .. .. .. =7-202 watts.
Thermal conductivity of glycerine at 50-0° C.W d_ 7-202 X 0-0357
~ 4-18A80 " 4-18 x 20-27 X 4-40
= 0* 000690 c.g.s.
Results.Figs. 3 to 5 show the variation of thermal conductivity with temperature
for the various liquids. The small numbers by the side of the plotted points
on June 18, 2018http://rspa.royalsocietypublishing.org/Downloaded from

46G G. W. C. Kaye and W. F. Higgins.
indicate the sequence in which the observations were made. If more than one thickness of liquid was experimented with, the observations are suitably identified. In all cases the results can bo represented by straight lines from which the bulk of the individual observations do not depart by more than 1 per cent. I t will be seen that water and glycerine, the two liquids with the
000075
000070
000065
ij 000045
• 000040
o 000035.
000045
^ 000040
000035
000045
000040
0 00035
Glucerine.50 * «>_
Aniline.
• 0 0255 cm Thickness m ~po 0 0328 » •• •• "lean iemperalure L.g 0 0357 ..................* 0 0445 " " -
F ig. 3.
highest conductivities, were unique in exhibiting an increase of conductivity with temperature. In the case of water (fig. 5), the divergences from the mean straight line are slightly larger, as the method is not quite so well adapted for the measurement of conductivities as high as that of water which in this physical constant, as in many others, is anomalous. As previously mentioned, the experiments on water involved an additional correction for evaporation which further reduced the accuracy. For the sake of comparison, the results of Jakob and Bridgman are added to fig. 5.
on June 18, 2018http://rspa.royalsocietypublishing.org/Downloaded from
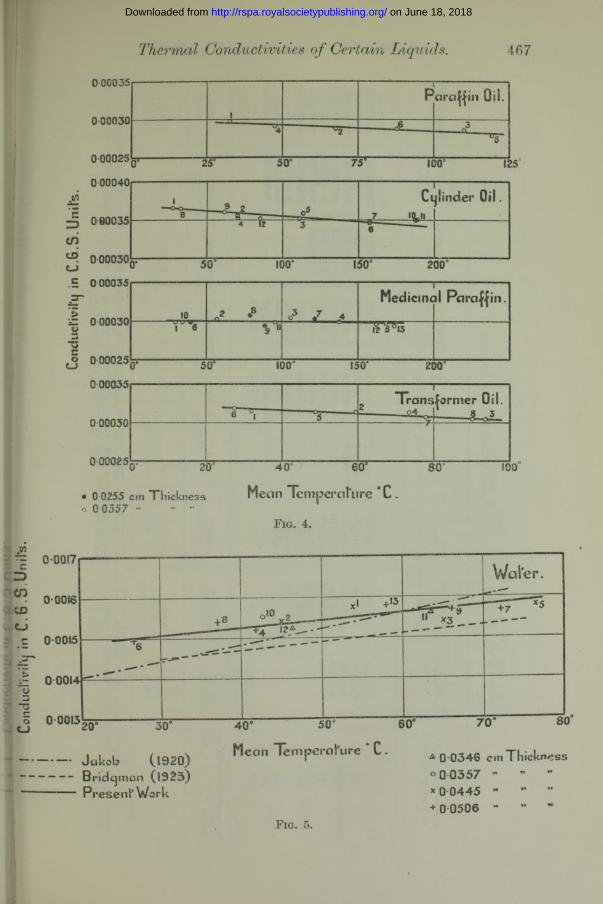
Thermal Conductivities of Certain Liquids. 467
C 00035
000030
000025
000040
000035
.£ 000035
000030
o 0 0Q025
000035
000030
0 00025
Cujinder Oil.
ormcr
• 0 0255 cm Thickness Mean Temperature 0 C . O 0 0357 ....................
Fig. 4.
0 0017
0 0016
0 0013
f t - - - - - - - - - - - - - - - - - — n
Water.
+ 8 O 1 0 . f g" “T 7 I 2 A_--
x , + I 5
-5 - - - - - - - - - —
4 - - - - - - - - - - - - - - - - - - - -
A » O l
------- Jakob (,1920)--------Bridgman (1923)---- ---- Present Work
Mean Tem perature * C . A 0 0 346 cmThickn«as® 0 0357 "* 0 0445 - + 0 0506 -
F ig. 5.
on June 18, 2018http://rspa.royalsocietypublishing.org/Downloaded from

Tabl
e I.
—Th
erm
al C
ondu
ctiv
ity o
f Li
quid
s.
Con
duct
ivity
(c.g
.s.)
at a
tem
pera
ture
of
Dis
tille
dw
ater
.G
lyce
rine
(Bri
t,Ph
arm
.)C
asto
r oi
l.A
nilin
e.O
live
oil.
Cyl
inde
r oi
l (m
ediu
m).
Tra
nsfo
rmer
oil.
Med
icin
alpa
raff
in(B
rit.
(Pha
rm.).
Para
ffin
oil
(Aci
d fr
ee).
° c. 0
0-00
145
0-00
0673
0-00
0437
0*00
0412
0-00
0405
0-00
0370
0-00
0324
0-00
0301
0-00
0300
200-
0014
90-
0006
800-
0004
320*
0004
120-
0004
020-
0003
660-
0003
200-
0003
000-
0002
9740
0-00
153
0-00
0687
0-00
0428
0*00
0412
0-00
0399
0-00
0363
0-00
0316
0-00
0300
0-00
0294
600-
0015
60-
0006
95
j0-
0004
24—
0-00
0397
0-00
0360
0-00
0312
0-00
0300
0-00
0291
800-
0016
00-
0007
020-
0004
20—
0-00
0394
0-00
0357
0-00
0308
0-00
0299
0-00
0288
100
—0-
0007
090-
0004
15—
! 0-
0003
910-
0003
540-
0003
040-
0002
990-
0002
8412
0—
0-00
0716
,
0-00
0411
—i
0-00
0388
0-00
0351
—0-
0002
990-
0002
8114
0—
0-00
0723
|
0-00
0406
—0-
0003
850-
0003
48—
0-00
0298
—
160
——
0-00
0402
—-
! 0-
0003
820-
0003
45—
0-00
0298
—18
0—
——
—0-
0003
790-
0003
42—
0-00
0298
—20
00-
0003
760-
0003
39“
Tem
pera
ture
coe
ffici
ent
a j
[Kt =
K0
(1 +
oi)]
+0
• 001
24-
0-00
053
—0-
0005
00-
0000
—0-
0003
5-0
-000
4!—
0-00
062
-0-0
0007
—0-
0005
5
Den
sity
at
18°
C...
...1-
000
l-25
6!
0-96
41 -
022
0-91
,0-
894
0 -8
4x0-
882
0-81
2
No
te
.—Th
e da
ta in
the
abov
e ta
ble
are
give
n to
thr
ee s
igni
fican
t fig
ures
, bu
t it
is n
ot c
laim
ed t
hat
the
accu
racy
of
the
dete
rmin
atio
ns in
gen
eral
ex
ceed
s ± 1
per
cen
t., w
hile
in th
e ca
se o
f wat
er th
e ac
cura
cy is
pro
babl
y sl
ight
ly lo
wer
. Fu
rthe
r, th
e va
lues
giv
en a
t 0° C
. are
obt
aine
d by
ext
rapo
latio
n of
the
grap
hs.
on
June
18,
201
8ht
tp://
rspa
.roy
also
ciet
ypub
lishi
ng.o
rg/
Dow
nloa
ded
from

Tabl
e II
.—C
ompa
rison
of
Res
ults
with
Pub
lishe
d D
ata.
Liqu
id.
Lees
1(1
898)
.M
ilner
and
C
hatto
ck2.
(189
9).
R. W
eber
3 (1
903)
.G
olds
chm
idt4
(191
1).
Jako
b5(1
920)
.B
ridg
man
6(1
923)
.D
avis
7(1
924)
.Pr
esen
tw
ork.
Wat
er ..
.. ....
K25
0-00
136
0-00
144*
0-00
131
0-00
155*
0-00
143
0-00
143
0-00
144
0-00
150
a-0
-005
5Po
sitiv
e—
—+0
-003
0+0
-001
5+
0-00
2+0
-001
2
Gly
cerin
e ....
K25
0-0
068
__0-
0006
60-
0073
*—
——
0-00
0682
a-0
-004
4—
——
——
—+0
-000
53
Ani
line
.... K
25_
__
0-00
0434
*__
__0-
0004
40-
0004
12a
——
——
——
-0-0
00
30-
0000
Oliv
e oi
l ....
K25
__
___
____
0-00
040
0-00
0401
a—
——
——
—-0
-000
8-0
-000
35
Tran
sfor
mer
oil
K25
__
„___
____
0-00
032
0-00
0319
a—
——
——
—N
egat
ive
-0-0
0062
Para
ffin
oil
.... K
25_
__0-
0003
46__
____
0-00
030
0-00
0297
a—
——
——
Neg
ativ
e—
0-00
055
* R
esul
ts r
educ
ed to
25°
C. u
sing
pre
sent
aut
hors
’ tem
pera
ture
coe
ffic
ient
.1
Lees
, 4 P
hil.
Tra
ns.,’
A, v
ol.
191,
p. 3
99 (
1898
).2
Miln
er &
Cha
ttock
, 4 P
hil.
Mag
.,’ v
ol. 4
8, p
. 46
(189
9).
2 R
. Web
er, 4
Ann
. d.
Phys
ik,’
vol.
11, p
. 10
47 (
1903
).4
Gol
dsch
mid
t, 4 P
hys.
Zei
ts.,5
vol
. 12
, p. 4
17 (
1911
).5
Jako
b, 4
Ann
. d. P
hysi
k,’ v
ol.
63, p
. 537
(19
20).
6 B
ridgm
an,
4 Nat
. A
cad.
Sci
. Pr
oe.,’
vol
. 9,
p.
341
(192
3).
7 D
avis
, 4 P
hil.
Mag
.,’ v
ol. 4
7, p
. 10
57 (
1924
).
<s>.
I- s •
a s *
on
June
18,
201
8ht
tp://
rspa
.roy
also
ciet
ypub
lishi
ng.o
rg/
Dow
nloa
ded
from
470 Thermal Conductivities Certain Liquids.
The results for the various liquids are also summarised in Table I (p. 468), which gives the conductivities read off from the curves at each 20° C. The values of the coefficient a in the expression K< = K0 (1 -f- are also tabulated together with the densities at 18° C.
Comparison of Results with Published Data.A comparison of some of the results of the present work with previously
published data is given in Table II (p. 469), where the values of the conductivity at 25° C. are tabulated, together with the temperature coefficients. In general, the agreement of the present results with the more recent data is good, particularly in the case of the results published by Davis which, however, are comparative and rest on Goldschmidt’s value for toluol at air temperature. I t may be remarked that Davis used the capillary-tube and heated-wire method of Goldschmidt which differs fundamentally from that employed in the present work.
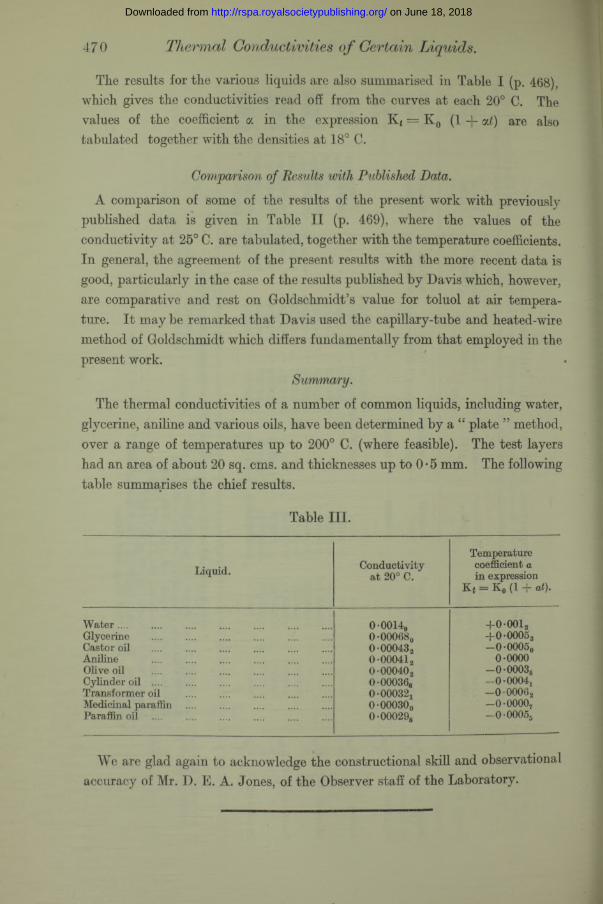
Summary.
The thermal conductivities of a number of common liquids, including water, glycerine, aniline and various oils, have been determined by a “ plate ” method, over a range of temperatures up to 200° C. (where feasible). The test layers had an area of about 20 sq. cms. and thicknesses up to 0-5 mm. The following table summarises the chief results.
Table III.
Liquid. Conductivity a t 20° C.
Temperature coefficient a in expression
K t = K 0 (1 + at).
W ate r............................................................................ 0-00149 +0-0012Glycerine ................................................................ 0-000680 +0-00053Castor oil 0-000432 —0-0005eAniline ................................................................ 0-000412 0-0000Olive oil ................................................................ 0-000402 —0-00035Cylinder oil ................................................................ 0-000366 -0-0004xTransformer oil 0-00032, —0-00062Medicinal paraffin .................................................... 0•00030„ -0-00007Paraffin oil ................................................................ 0-000298 —0-0005s
We are glad again to acknowledge the constructional skill and observational accuracy of Mr. I). E. A. Jones, of the Observer staff of the Laboratory.
on June 18, 2018http://rspa.royalsocietypublishing.org/Downloaded from