
40 Parks in 40 Days - Amazon S3€¦ · on a TDY, and traversing the sub-network that exists at...
27
40 Parks in 40 Days A paper submitted to the 29th Annual ESRI International User Conference By Bernard R. Traphan July 14, 2009
Transcript of 40 Parks in 40 Days - Amazon S3€¦ · on a TDY, and traversing the sub-network that exists at...

40 Parks in 40 Days
A paper submitted to the 29th Annual ESRI International User Conference
By Bernard R. Traphan
July 14, 2009

ii

iii
ABSTRACT
40 Parks in 40 Days By
Bernard R. Traphan
In a traveling salesman problem variant, GIS is leveraged to produce aggressive travel itineraries, including visiting over 61 points of interest covering 8000 miles in 24 days. This paper presents ArcGIS Server enhancements to online travel tools in support of the Joint Information Operations Warfare Command’s (JIOWC) worldwide mission requiring large amounts of temporary duty (TDY) travel. The Field Operating Guide (FOG) application prototype developed identifies travel problems along three functional components and provides spatial solutions to them. A proof of concept is demonstrated to optimize travel decisions in regards to cost, congestion, and time. This is accomplished along the spatial components of finding lodging on a TDY, organizing stops on the TDY, and traversing the sub-network that exists at each TDY stop. By engaging in pre-trip planning on these components, particular aspects of travel can be up to 30 times more efficient in regards to both time and cost.

iv
Table of Contents 1. Introduction ................................................................................................................. 1
1.1. Background ...................................................................................................................... 1
1.2. Goals and Objectives ........................................................................................................ 1
2. Case Study .................................................................................................................. 3
2.1. Cartographic examples of where online travel sites have room for GIS improvement ... 3
2.1.1. Finding lodging on a TDY inadequacies .................................................................. 3
2.1.2. Organizing stops on a TDY inadequacies ................................................................. 5
2.1.3. Traversing the sub-network at each TDY stop inadequacies .................................... 6
2.2. How aggressive can trip itineraries be (i.e. Can you visit 40 parks in 40 days?) ............. 8
3. Proof of Concept Prototype ...................................................................................... 10
3.1. Finding lodging on a TDY GIS enhancements .............................................................. 11
3.2. Organizing stops on a TDY GIS enhancements ............................................................. 13
3.3. Traversing the sub-network at each TDY stop GIS enhancements ............................... 15
4. Summary and Conclusions ....................................................................................... 17
4.1. Project Findings .............................................................................................................. 17
4.2. Wish List ........................................................................................................................ 18
4.3. Author Information ........................................................................................................ 19
5. References ................................................................................................................. 20

v
Table of Figures
Figure 1: MapQuest Route from Sheraton Suites, Weehawken, NJ to Empire State Building ...... 4
Figure 2: Google Route from Green Bay, WI to Muskegon, MI .................................................... 6
Figure 3: Microsoft Live Route to parking within Knott’s Berry Farm sub-network .................... 7
Figure 4: Itinerary Route for visiting over 40 Parks in less than 40 Days ...................................... 9
Figure 5: Point A to B Travel Time ArcGIS Engine Application ................................................ 10
Figure 6: ArcGIS Server web application to locate nearby lodging in Washington DC .............. 12
Figure 7: Microsoft imagery of InTown Suites at 6451 Bandera Rd, San Antonio, TX 78238 ... 13
Figure 8: Organizing stops itinerary map overview ..................................................................... 14
Figure 9: Traversing a sub-network map overview ...................................................................... 16

vi
List of Tables
Table 1: Ordered list by total cost for lodging near the Empire State Building ........................... 12
Table 2: Detailed itinerary for traversing a sub-network .............................................................. 16

1
1. Introduction
The Joint Information Operations Warfare Command (JIOWC) frequently performs temporary duty (TDY) travel as part of its worldwide mission in support of United States Combatant Commands. Successfully continuing to fund TDY missions in spite of rising costs and budget cuts require the JIOWC to be more efficient in managing this activity. Although online travel tools currently exist, few provide the kind of information that would truly enhance travel to a destination and within a destination. For instance, no online tools guide travelers as to how to combine trips, maximize the proximity of locations, or how to mitigate traffic and improve travel time.
Due to such online travel constraints and lack of pertinent information, to accomplish this goal, JIOWC personnel and project management systems require enhanced geographic information system (GIS) functionality specifically designed to optimize travel. This project will assess JIOWC TDY travel, explore the spatial problems that exist with current online travel services, and demonstrate how a web-based GIS prototype can mitigate travel time constraints through optimized pre-trip planning.
1.1. Background
Travel is more expensive these days due to rising fuel and lodging costs. In areas the JIOWC typically travels to, lodging costs increase by over 10 % annually (Kaufman, 2008). According to the U.S. Dept. of Energy (2009), in San Bernardino County, the cost of fuel tripled from 2002 – 2008, hitting a high of $ 4.58 for the average cost of regular unleaded on June 22, 2008. While fuel prices have come down over two dollars during the last year, other economic problems have led to the suggestion of combining trips to keep costs down (Sharkey, 2008). There is already much interest from commercial GIS providers in optimizing travel. Environmental Systems Research Institute, Inc. (ESRI) gave thousands of evaluation copies of ArcLogistics (their tool marketed to save businesses/travelers money) at the 2008 International User Conference (UC) demonstrating their willingness as a GIS provider to aid the traveler. Each day new GIS tools are available that never were before, such as GPS units that market the ability to give drivers near-real-time data about the cheapest gas prices. Despite these tools, JIOWC travelers still need answers to the spatial questions of what travel makes sense, what can be combined, and how is this more efficient.
1.2. Goals and Objectives
The JIOWC’s goal is for this project is to reduce financial constraints that threaten its strategic objectives and prevent it from supporting as many TDY missions as JIOWC customers’ desire. Achieving this goal will allow the JIOWC to reverse a growing trend of having to under-support or decline to support mission requests from its Combatant Command customers. The JIOWC is greatly concerned that if this trend continues that the JIOWC’s existence will be at risk as it will begin to lose relevancy with its customers.
Each of the three components for the project has its own set of specific functional objectives. For finding lodging on a TDY, it is to provide a list ordered by ascending price, ascending commute time, and ascending arrival time respectively for the following spatial

2
parameters: A person departing from origin O at time TO would like to find a place to stay A near destination B such that it takes less than time TC to reach B from A when departing at time TD. For organizing stops on a TDY, it is to provide an itinerary optimized on time, distance, cost, or avoiding congestion with the following spatial parameters: A person departing from origin O at time TO has a prioritized list of stops each of which has a minimum and maximum duration Dmin/Dmax that they would like to complete by TC. Each of those stops also has operating hours which must be accounted for in that the stop can only begin/end during that time window. For traversing the sub-network at each stop on a TDY, it is to provide an itinerary optimized on time, distance, or avoiding congestion with the following spatial parameters: A person traversing a network N at time TO has a prioritized list of stops each of which has a minimum and maximum duration Dmin/Dmax that they would like to complete by TC. Each of those stops also has operating hours which must be accounted for in that the stop can only begin/end during that time window. Sub-networks are defined small enough so that there are no transit costs for any of the nodes so there is no need to optimize the list on cost.
The outcome of this project is a proof of concept that online trip planning tools can aid JIOWC travelers in being up to 30 times more efficient in particular aspects of their TDYs. This figure is based upon combining three stops into one trip and avoiding the severe congestion that can degrade gas mileage by 90 % and costs the average driver $ 710 annually (Amend, 2007; Sasena, Paplambros, & Goovaerts, 2002; HowStuffWorks, 2000). The ideas and spatial concepts of the prototype could then be extended for use in other government/commercial online applications, such as Department of Transportation traveler information systems and Google maps. A byproduct should be an increase in governmental transportation departments partnering with private enterprise and some of this project’s functionality becoming incorporated into online travel sites. At this point the functionality will transition from government off-the-shelf to commercial off-the-shelf (COTS). This aligns with the long term IT strategic goals of the JIOWC to prefer utilizing COTS for cost/maintainability considerations. When enhanced GIS functionality makes its way into COTS online sites, planning travel will be easier and some of the 4.2 billion hours and $ 7.8 billion lost annually to congestion can be alleviated for the traveler by making their travel more efficient (U.S. Dept. of Energy, 2009; Amend, 2007; Texas Transportation Institute, 2007).

3
2. Case Study
The functions of travel, both for business and pleasure, have not changed much despite the influx of information technology capabilities, such as GIS. The internet and online travel sites did not exist when Lewis and Clark explored the western US, but in trying to make their excursion as efficient as possible they too had to find lodging, organize the stops for each day, and traverse the sub-network at each stop. For them finding lodging meant finding the best spots for campsites, organizing stops meant choosing what to explore in the most efficient route, and traversing the sub-network included such considerations as difficulty of terrain navigation plus potential hazards from native human as well as wildlife population. This project’s case study looked at experience the JIOWC had in making use of online travel sites, specifically areas where results were erroneous or inadequate in order to highlight where enhanced GIS could add value. Experience in creating highly aggressive itineraries utilizing all source GIS software was leveraged in an attempt to bring enhanced GIS web functionality in a tailored user experience that demonstrated specific GIS travel planning functions.
2.1. Cartographic examples of where online travel sites have room for GIS improvement
The JIOWC has experienced many instances where online travel sites have produced less than ideal results when attempting to use them for finding lodging on a TDY, organizing stops on a TDY, and traversing the sub-network that exists at each stop on a TDY. These inadequacies in online travel site GIS products have caused the JIOWC to expend more time and money on TDY travel than would have been required if their TDY travel had been performed optimally.
2.1.1. Finding lodging on a TDY inadequacies
When traveling on TDY, JIOWC members are supposed to have their lodging be below a specific location specific nightly rate called per diem. At the hotels at per diem site (OAG, 2009) government workers can find which hotels will honor the per diem rate in a particular city. Until recently this site would only provide a simple list of the hotels, thus making the user open other sites in another web browser to perform the spatial comparison of where hotels were in relation to their destination and what amenities they had. The site does now list hotel amenities and the user can plot individual hotels one by one on a map, however an ordered proximity list of what hotels are closest to the destination is still not provided. If the JIOWC user goes the extra step of opening a second web site to locate lodging near a point of interest (POI) that site will still make use of “inside out” Euclidean distance for a measure of how far that lodging is from the POI that one is traveling to. This is in opposition to “outside in” travel time to the POI that Mitchell (1997) emphasized in ESRI press over eleven years ago was a more relevant measure than distance for choosing a best route.
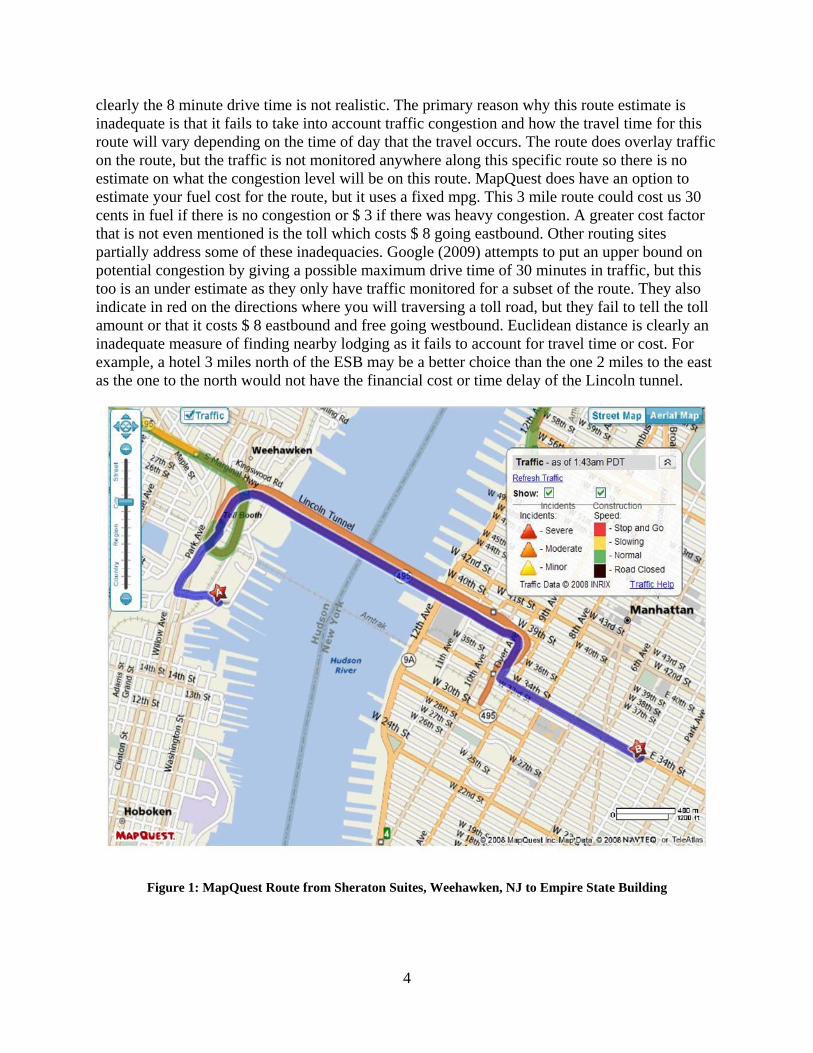
The MapQuest (2009) driving directions for finding nearby lodging from an example provider website illustrate the inadequacies in their functionality. Figure 1 on the following page shows the driving route to travel from the Sheraton Suites in Weehawken, NJ to the Empire State Building (ESB). This hotel is only 2 miles from the ESB in terms of Euclidean distance and MapQuest estimates the route to be 3.3 miles long and take 8 minutes. As this route traverses the Lincoln tunnel where 30 minute delays are the norm and one hour waits are not uncommon,
4
clearly the 8 minute drive time is not realistic. The primary reason why this route estimate is inadequate is that it fails to take into account traffic congestion and how the travel time for this route will vary depending on the time of day that the travel occurs. The route does overlay traffic on the route, but the traffic is not monitored anywhere along this specific route so there is no estimate on what the congestion level will be on this route. MapQuest does have an option to estimate your fuel cost for the route, but it uses a fixed mpg. This 3 mile route could cost us 30 cents in fuel if there is no congestion or $ 3 if there was heavy congestion. A greater cost factor that is not even mentioned is the toll which costs $ 8 going eastbound. Other routing sites partially address some of these inadequacies. Google (2009) attempts to put an upper bound on potential congestion by giving a possible maximum drive time of 30 minutes in traffic, but this too is an under estimate as they only have traffic monitored for a subset of the route. They also indicate in red on the directions where you will traversing a toll road, but they fail to tell the toll amount or that it costs $ 8 eastbound and free going westbound. Euclidean distance is clearly an inadequate measure of finding nearby lodging as it fails to account for travel time or cost. For example, a hotel 3 miles north of the ESB may be a better choice than the one 2 miles to the east as the one to the north would not have the financial cost or time delay of the Lincoln tunnel.
Figure 1: MapQuest Route from Sheraton Suites, Weehawken, NJ to Empire State Building

5
2.1.2. Organizing stops on a TDY inadequacies
JIOWC members can be reimbursed for TDY travel either by reimbursement of fuel charges for a rental car or by standard mileage when using a personal vehicle. As such it is of benefit to the JIOWC for the TDY POI stops to be organized in the most efficient manner. If multiple stops can be accomplished on one TDY than total TDY cost can be reduced as less TDY’s are required. If multiple stops can be accomplished on each day of a TDY than total TDY cost is reduced as less lodging nights are required. In the scenario that appears on the following page in Figure 2, an early evening stop is occurring on Sunday night in Green Bay, WI followed by a late morning stop on Monday in Muskegon, MI. Quite a few inadequacies are apparent when looking for locations for lodging on the route generated by Google (2009).
Most of the problems with this route are due to the fact that it takes a ferry across Lake Michigan from Manitowoc, WI to Ludington, MI (Lake Michigan Carferry, 2009). The schedule for the ferry departs Manitowoc at 12:30 am and arrives in Ludington at 5:30 am. This schedule would not realistically allow for making use of lodging on the route. The Google output does not mention this schedule aspect nor does it indicate that the ferry would cost $ 247 for a car and three passengers. Perhaps Google chose this route rather than one that drove around Lake Michigan because it would be 227 miles less in driving distance and would avoid any congestion issues in Milwaukee or Chicago. However, for this scenario a route driving around Lake Michigan is vastly superior to taking the ferry across Lake Michigan as:
• Traveling on a Sunday evening there would not be much traffic on the route so congestion is not much of an issue.
• The total travel time of 6 hour 15 minutes for the non-ferry route is much less than total travel time for the ferry route as it does not involve waiting five hours until 12:30 am for an additional four hour ferry ride that goes at a much slower rate of speed than driving on the highway.
• The non-ferry route would allow for acquiring lodging near Michigan City which is more restful for the travelers than spending the night on the ferry.
• Lodging near Michigan City can be acquired for less than the cost of a stateroom on the ferry, and the cost of gas for 227 miles of driving even at $ 4 a gallon is much less than the minimum $ 151 the ferry would cost for one car and passenger.
If the inadequacies discussed in section 2.1.1 for finding lodging within a certain travel time from a POI were resolved then online lodging sites could indicate that the lodging in Michigan City would get to the POI in Muskegon, MI by the required time even accounting for losing an hour due to crossing into a new time zone:

6
Figure 2: Google Route from Green Bay, WI to Muskegon, MI
2.1.3. Traversing the sub-network at each TDY stop inadequacies
At each stop on a TDY JIOWC members must account for the time it takes to traverse each stop’s sub-network. This time can include the time it takes to park, the time it takes to walk from parking to the facility, the time it takes to pass through security, and as sub-network can have multiple POI’s within it (e.g. visiting multiple offices within one building) then one must account for both wait and activity time at each stop. The activity, travel, and wait time for each stop within a sub-network will vary depending on what time of day they occur. It would be of benefit to the JIOWC for POI stops within each sub-network to be organized in the most efficient manner as this will reduce the total amount of time required for the TDY and thus decrease its cost. In the scenario that appears on the following page in Figure 3, a stop is occurring to the Independence Hall brick by brick replica that is located in Buena Park, CA. Inadequacies are apparent when looking at the Knott’s Berry Farm (2009) Parking & Directions page. It shows a map, but it inadequate in that it does not show where parking is located nor does it mention that Independence Hall is located across the street from where the address geo-codes to.

7
At their mapping site, Microsoft (2009) has done some mapping of the sub-network which is illustrated in Figure 3 below. Knott’s Berry Farm may very well be unaware this mapping is done as they do not mention or link to it from their website. Pushpin 1 is where the address geo-codes to. Below it there are arrows on some of the roads and parking lots within the sub-network. What this means is that a pushpin can be put along these arrows and turn by turn directions can be generated. A number of issues are noticeable from looking at this imagery and directions. Not all of the parking lots have had vector lines generated within them as pushpin 2 has vector lines for its rows, but push pin 3 does not. The vector lines have not been named as the directions say to turn left on an unnamed road. The directions do not account for how travel and wait time will vary depending upon what time of day they occur. For example, the 4 minute travel time to the parking lot does not account for the how long it will take to get through the parking gate. It also doesn’t account for the fact that at a certain time of day this parking lot will fill up and parking will not be available at it. Lastly, it is inadequate in estimating sub-network traversal as it can’t give any estimate on how long it will take to walk from parking to Independence Hall.
Figure 3: Microsoft Live Route to parking within Knott’s Berry Farm sub-network

8
2.2. How aggressive can trip itineraries be (i.e. Can you visit 40 parks in 40 days?)
The answer to this section’s title question is YES, one can visit 40 parks in 40 days. This is demonstrated by looking at a highly aggressively itinerary that was successfully accomplished in August of 2007 by a JIOWC member. In this itinerary 61 amusement parks were visited in 24 days covering a distance of 8,000 miles. Rides were ridden in at least one amusement park on every day of the trip with 5 being the most parks where rides were rode in one day and 10 being the most parks that were visited in one day. While amusements parks visits were the primary purpose of the trip, numerous other non-amusement park POIs were included. For example on Wednesday August 22nd, visits were made to10 POIs in the Washington DC area and only one of them was an amusement park. This trip’s itinerary is impressive when you consider how many total POIs it included. What is of even greater note is to compare it to similar itineraries created by professional organizations. A similar excursion from Theme Park Review (2009) will cost more, yet include less days and visit less POIs, both in total and per day.
The motivation for making such a trip was an attempt to see if it was possible to visit all the amusement parks in North America. This quest seemed feasible after researching amusement parks around North America and realizing that the total number was getting smaller and smaller as numerous parks went out of business (O’Brien, 2003). From having a goal of visiting all the parks in North America, then creating an aggressive trip itinerary is simple economic theory of the more aggressive the itinerary is, the more utility will be maximized. The same economics that leads Sears to utilize GIS to enable their delivery men to schedule as many deliveries in a day as possible is the motivation to schedule as many parks in a day as possible (Mitchell, 1997). All source GIS (e.g. congestion patterns, desktop GIS software, ground truth knowledge, imagery, maps, online GIS sites, personal experience, traffic flow patterns, etc.) can then be utilized to build the most aggressive itinerary possible. The more parks that can be scheduled in one day the lower the cost will be for the quest as a whole in terms of both cost and time. The fruit of a successful itinerary is illustrated in Figure 4 which shows the route for visits to 61 parks (and over 100 POIs) in 24 days.

9
Figure 4: Itinerary Route for visiting over 40 Parks in less than 40 Days

10
3. Proof of Concept Prototype
The intent of this project is to build prototypes that provide a proof of concept for enabling increased pre-trip planning that would yield more optimized itineraries. The specific components to optimize are finding lodging on a TDY, organizing stops on a TDY, and traversing the sub-network that exists at each stop on a TDY. This is accomplished by leveraging off of the JIOWC lessons learned in creating all-source GIS enhanced itineraries. ArcGIS Server is utilized to create web deployable applications that non-GIS experts could easily use. The main thing lacking in present applications is the planning aspect in terms of the spatial aspect of where you will be and the time aspect of when you will be there. Current applications focus on the here and now which precludes many aspects of trip planning. One of the main premises of trip planning is that congestion and cost will vary depending on what time of day you travel as well as what route you take.
To illustrate making use of this premise for trip planning an application was created (Figure 5) using ArcGIS Engine to allow the user to indicate their planned travel time and the application would output actual travel time for that time of day. The application would also look at adjacent time slots and see if the hour before or after was more than 50 % shorter in duration. If it was over 50 % shorter, then traveling at a better time would be suggested. ArcGIS Engine was chosen to develop the application as it gave the ability to create a simple focused user experience that clearly demonstrate the enhanced GIS functionality sans distractions. Microsoft’s ClickOnce technology was used to deploy the application via the web.
Figure 5: Point A to B Travel Time ArcGIS Engine Application

11
3.1. Finding lodging on a TDY GIS enhancements
Finding lodging can achieve GIS enhancement by taking into account how congestion and cost will vary. Queries can be performed to find nearby lodging with the definition of nearby being enhanced to being lodging that is within a certain travel time of the destination. Knowing the spatial and time particulars of the situation, in terms of when travel is occurring and from where, a more exact total cost can be calculated of the lodging that includes all costs (lodging rate, parking cost, and travel cost). Nearby lodging based upon travel time can be determined by each lodging location having drive time polygons for predetermined drive times (e.g. 5, 10, and 15 minutes) and at predetermined times of day (e.g. hourly from 500 – 1800). The appropriate polygon can then be generated by either using congestion constraints based upon time of day in the road network, a different road network based upon time of day, or modifying the analysis setting default break appropriately (e.g. if average road congestion is 10 % then substituting 9 instead of 10 for default break would produce the corresponding 10 % constrained service area polygon). Having these polygons pre-calculated will speed processing of the web application as then finding nearby lodging will merely be choosing the appropriate set of polygons based upon drive time and time of day. Using the appropriate set of polygons, it is a simple matter of determining which lodging service area polygons the destination falls within.
. A published geo-processing task can perform the mechanics for finding nearby lodging. The geo-processing task can be included in a web application allowing the end user to execute GIS enhanced lodging functionality via the web without having any additional GIS software loaded on their computer. Figure 6 on the following page demonstrates a web application that makes use of a published geo-processing task to locate nearby lodging in Washington DC. For this example a destination point was clicked on the map and lodging within 2 miles of that point was symbolized in red. A Euclidean distance geo-processing task was used on this dataset as this dataset did not have the drive time polygons already pre-calculated. Once the polygons have been calculated, the web application can be modified to make use of a geo-processing model based upon drive time polygons instead of Euclidean distance.
After nearby lodging has been located on the map, the main enhanced GIS output is an ordered list. Its default sort order is on total cost with the desired option of letting the user change the field the list is sorted on. On the following page is an example in Table 1, showing the output for a person departing from origin LaGuardia (LGA) airport at 5 pm looking for a place to stay near the destination of the Empire State Building (ESB) such that it takes less than 40 minutes to reach the ESB when departing lodging at 8 am. One lodging provider may have multiple route choices based upon mode of travel (e.g. car, foot, mass transit) which will be ordered in the list depending on sort preference (congestion, cost, distance, or time). Fields calculated, but not shown are Commute Distance, Commute Cost and Total Travel Cost. Total cost includes the nightly lodging rate plus total travel cost (gas, tolls, parking, etc.). Commute travel allows multi modal in this scenario while arrival travel assumes operator motorized transport.

12
Figure 6: ArcGIS Server web application to locate nearby lodging in Washington DC
.
Table 1: Ordered list by total cost for lodging near the Empire State Building
Name Total Cost
Commute Time
Arrival Time
Travel Congestion
Nightly Rate Mode
Euclidean Distance
The GEM Hotel-SoHo $196 38 min 5:25 PM 0.3 $194 Walk 1.9 miles
The GEM Hotel-SoHo $198 15 min 5:25 PM 0.33 $194 Subway 1.9 miles
The GEM Hotel-SoHo $219 10 min 5:25 PM 0.5 $194 Drive 1.9 miles
Sheraton Suites $219 30 min 5:45 PM 0.75 $180 Drive 2.5 miles

13
3.2. Organizing stops on a TDY GIS enhancements
Organizing stops on a TDY can achieve GIS enhancements by making use of a primary advantage of computers, namely to automate repetitive tasks. In this case, the repetitive task is to cycle through all possible start times and all possible ordering of stops to see which itinerary produces the best results. The act of traveling between two stops is impacted by the available routes and how they may be degraded by congestion/cost based upon the time of day the route occurs. Varying congestion factors impact a stop as well. For example, a one hour meeting could take two hours due to delays getting through security. From running all of the scenarios, the optimal itinerary can be obtained based on personal preferences (time, distance, cost, and congestion aversion).
A scenario where a JIOWC strategic partner is TDY at the JIOWC in San Antonio is used to illustrate this functionality. The lodging for this TDY is at the In Town Suites located at 6451 Bandera Rd, San Antonio, TX 78238. It is Friday afternoon and acquiring food for the weekend is being investigated to possibly make use of the refrigerator and stove that the lodging has. The nearby Wal-Mart Supercenter located at 8030 Bandera Rd, San Antonio, TX 78250 has an entire frozen salmon on sale for only $ 3. In researching going to Wal-Mart from the In Town Suites after work at 6 pm it is observed that Google (2009) gives a drive time estimate of 2.3 miles and 3 minutes with no mention of traffic impacts. The Microsoft (2009) bird’s eye 6 inch per pixel imagery of the In Town Suites shown below in Figure 7 does not seem to show much congestion so without enhanced GIS it could be falsely concluded that the 3 minute drive time estimate is realistic.
Figure 7: Microsoft imagery of InTown Suites at 6451 Bandera Rd, San Antonio, TX 78238

14
The imagery in Figure 7 was most likely taken a few years ago and at a time of week when there was little congestion on Bandera road. If this imagery was more up to date it would show the ongoing construction for an elevated toll road where drivers will pay a dollar a mile to avoid the congestion that can exist on Bandera road. At the time of day the drive to Wal-Mart is being considered the congestion is extreme and the round trip excursion to Wal-Mart could cost nearly 2 gallons of gas and take an hour and a half. This cost and time outlay negates most if not all of the savings from getting the salmon on sale. Looking at how the travel time varies with time of day this trip could be scheduled at a less congested time of day. Additionally, to further optimize the trip rather than making one stop on the trip, multiple stops could be scheduled. For this scenario the additional stops will be The UPS Store located at 5804 Babcock RD, San Antonio, TX 78240 and the US Post Office located at 6825 Huebner Rd, Leon Valley, TX 78238. From running the various scenarios it is determined that by making the trip Saturday morning at 9:30 am all three stops can be made with a round trip distance of 10.2 miles and only take about a half hour. This trip would have an approximate total cost in time (depending on salary) and gas (at two dollars a gallon) of approximately $ 11 as opposed to costing around $ 77 if the three trips were made separately during more congested times of day. This yields a significant 7 to 1 total savings by combining trips and avoiding congestion. Figure 8 below shows a map of this itinerary that travels round trip along the path from push pin 1 to 3 to 2 to 4 and back to 1.
Figure 8: Organizing stops itinerary map overview

15
3.3. Traversing the sub-network at each TDY stop GIS enhancements
The GIS enhancements that can be made to traversing the sub-network at each TDY stop are very similar to those for organizing stops on a TDY as the case of traversing the sub-network is essentially a simplification where the user will not be using operator motorized transport (OMT). Just like in the previous section, the automated repetitive task is to cycle through all possible start times and all possible ordering of stops to see which itinerary produces the best results. One difference is that the user sort preferences will not include an option for cost because the routes will not traverse any OMT networks and the sub-networks are defined small enough so that there are no transit costs for any of the nodes. While there are cost factors associated with walking such as slope and walking time, for this project cost means financial costs. Each stop’s sub-network can contains one to more internal stops. The act of traveling between two stops is impacted by the available routes and how they may be degraded by congestion based upon the time of day the route occurs. Congestion values impact a stop as well and could lengthen the time it takes to complete an activity. A major difference though is that all the potential stops within a sub-network are known so the owner of the sub-network can pre-calculate the Origin-Destination (OD) matrix for all the stops at predetermined times of day (e.g. hourly for each hour the sub-network operates during the day). Having the OD matrix pre-calculated will greatly increase the speed of operation for a web application associated with a sub-network. By running all of the scenarios, the optimal itinerary can be obtained based on personal preferences (time, distance, and congestion aversion).
In this last scenario, a JIOWC member is TDY in Redlands, CA on a long term training assignment. The instructor for one of the classes is attempting to create an itinerary to meet 3 of their students individually at their on-site residences. Figure 9 on the following page shows a map overview for this itinerary in which the instructor’s path will go from Parking to Student A to Student B to Student C and back to Parking. Also, on the following page, Table 2 shows the optimized itinerary with detailed information for each step. For each activity (driving, walking, and meeting) information is shown to indicate step number, activity information, activity occurrence time, activity duration time, distance traveled, average congestion encountered, and maximum congestion encountered, This itinerary has been optimized on total time so that the instructor could complete all three meetings within one hour.

16
Figure 9: Traversing a sub-network map overview
Table 2: Detailed itinerary for traversing a sub-network
Step Activity Time (military)
Duration (min)
Distance (ft)
Average Congestion
Maximum Congestion
1 Drive to Parking 1108 1 375 0.05 0.1
2 Walk to Student A 1109 1 50 0 0
3 Meet with Student A 1110 17 0 0.15 0.15
4 Walk to Student B 1127 2 130 0.05 0.05
5 Meet with Student B 1129 15 0 0.05 0.05
6 Walk to Student C 1144 2 150 0.05 0.05
7 Meet with Student C 1146 13 0 0 0
8 Walk to Car 1159 1 75 0 0
9 End Total 1200 52 780 6.83% 15%
17
4. Summary and Conclusions
This project highlighted the benefits of engaging in pre-trip planning in order to optimize travel along the functional lines of finding lodging on a TDY, organizing stops on a TDY, and traversing the sub-network that exists at each stop on a TDY. Pre-trip planning web applications are now more feasible to create, as demonstrated by the proof of concept prototypes developed in this project. This increase in feasibility is enabled by the increased amount of rich historical data for congestion (e.g. traffic variability by time of day) and cost (e.g. route tolls/fares). The usefulness of trip pre-planning tools is supported by the fact that when JIOWC users avoid congestion and combine trips they can make parts of their travel up to 30 times more efficient (a figure arrived at by simple mathematics of combining three stops into one trip with the 10 fold efficiency gain by avoiding severe congestion).
The tangible benefits of this theoretical figure come from alleviating some of the $ 710 lost annually to congestion by the average driver (which costs the nation as a whole $ 7.8 billion as well as 4.2 billion hours each year). These benefits can be realized by the JIOWC for in-house applications and by society as a whole when GIS enhanced pre-trip planning functionality becomes engrained within COTS applications. The benefits have a potential multiplicative effect in that when one traveler modifies their behavior to travel at a less congested time they benefit all drivers as they leave behind a less congested transportation network. A less congested network may mean having to spend less on transportation projects, which cost the nation $ 194 billion in 2005 (Research and Innovative Technology Administration, 2007). An additional economic benefit of pre-trip planning tools is that an optimized trip has more value to the traveler which may encourage economic growth when the traveler engages in travel they would have not otherwise made. Lastly, pre-trip planning tools enhanced by GIS will further the “democratizing” of GIS, a goal of ESRI president Jack Dangermond to have people exposed to GIS that previously haven’t been (ESRI, 2008).
4.1. Project Findings
Rich historical data is available now from a variety of sources that enable pre-trip planning application that can both inform and account for the affect of congestion/cost on available routes. TomTom’s speed profile data is the newest and most promising addition to a set that includes Google’s historical traffic, MapQuest’s INRIX, Microsoft’s Clearflow, and Yahoo’s use of TrafficCast. At the writing of this report though, none of these four providers can output accurate travel times in their web applications that account for how travel time varies with time of day (Google, 2009; MapQuest, 2009; Microsoft, 2009; TomTom, 2009; Yahoo, 2009). The Speed profile database has half a trillion speed measurements covering 25 countries and claims to have data for 90 % of the roads in the US having average speeds down to a 5 minute granularity (Forrest, 2008). At present though, while the data exists to expand the functionality that this project requires, that data is not being shared across the geo-data market or is not in a format that can be directly accessed in a GIS. With a lack of data, the JIOWC will have to either convert what data it can acquire or create data sets. Datasets would have to be developed worldwide for cost/congestion constraints for all transportation networks. Linkage would need to be in place to access lodging data from all providers and integrate with existing Department of Defense (DOD) systems such as Defense Travel System (DTS). Each sub-network would have to

18
have a defined network in place for the robust network analysis desired by this project. The JIOWC simply does not have the manpower to undertake such a data conversion effort.
The U.S. Dept. of Transportation (1998) and other departments of transportation (DOT) should continue advocating investing in Traveler Information Systems (TIS). There are numerous benefits for having robust TIS, including increased throughput, reduced travel time, lower emissions, and decreased stress on the driver. A Harris Research group survey was cited that showed 78 % of travelers would be willing to pay to access improved TIS, including 64 % willing to pay 50 cents a call; and 56 % willing to pay five dollars a month. In light of the recommendation to form DOT partnerships with private enterprise it is surprising that online travel sites don't have more of the pre trip planning tools DOT endorses. Based upon the Harris poll, a site that offered users planning tools of value would see a definitive increase in web traffic and corresponding advertising revenue.
This project’s ultimate success relies on JIOWC partners taking what the JIOWC develops and running with it. It is imperative that future work make a persuasive case for how what is developed enhances pre-trip planning with GIS by leveraging off the JIOWC’s proof of concept and follow on in house efforts. The JIOWC needs to engage its partners. It needs to get lodging partners to see the value of providing customers with accurate service area travel times so that the lodging providers generate this data rather than the JIOWC. Likewise, the JIOWC needs to get sub-networks that they traverse to see the value in defining their sub-network so that customers can more easily do business with them. Lastly, it is vital that providers like Google and their DOT partners continue to see the value of enhancing the GIS functionality they provide so that the frontier work the JIOWC has done in advancing pre-trip planning in web applications becomes common place functionality.
4.2. Wish List
ESRI projects that version 9.4 of their software will have a road network that has four different speed limits for four different times of day so you can choose the appropriate one for your Network Analyst solver. While four time-based speed impedances are better than one, why stop there, especially if data exists down to a five minute granularity. A greater limitation with the ESRI software is that the ESRI Network Analyst solver can only have a singular impedance variable. Thus, even if your data has four different impedances variables you can only use one at a time in your calculations. Enhancing the solver so that impedance follows a similar moving time counter, such as the time windows the software already has for stops on a route, would be of great value. A time based impedance then could optimize a route in a predictive manner. For example, if 15 minutes along your route is a bottleneck that clears up at 9 am then the optimal route could depart as early as 8:45 am, as opposed to departing at 9 am for routes optimized on a single impedance time.
Crowdsourcing of geodata is becoming a common business practice so it would be beneficial to have a consensus on format of data, such as the method used in this project where each road segment in a network would have a mph speed and then time based congestion constraints on that speed (e.g. 17 hourly values from 500 – 2100). ESRI as the leader in GIS software can help lead the effort in coming up with these data format standards. Once the data format is in place, then the software that performs the network analysis can make use of

19
congestion constraints to whatever granularity the data contains. ESRI would also be well served to have a greater involvement in DOT partnerships. As much money as DOTs already spend on transportation projects, it would seem that there would be adequate funding to enable GIS enhancements to pre-trip planning web applications, especially since such projects may have a greater return on investment to the DOT than other projects in terms of congestion reduction. Such projects could enable all consumers of the transportation network to have access to congestion/cost data with the highest granularity. This would provide the capability for software providers to create rich pre-trip planning web applications through API or web service calls to online mapping functionality
4.3. Author Information
Bernard Traphan
Joint Information Operations Warfare Command/J62
5804 Babcock RD. # 266
San Antonio, TX 78240
Phone: 210-414-5226
Fax: 888-678-7315
Email: [email protected]

20
5. References
Amend, J. M. (2007). Traffic Congestion Costly for Motorists, Auto Makers. Retrieved 12/9/2008, from http://wardsauto.com/ar/traffic_congestion_costly/.
ESRI (2008). Interview with Barbara Shields. Redlands, Calif.: ESRI Reporter quote attributed to Jack Dangermond on 9/9/2008
Forrest, B. (2008, October 1). Tele Atlas Customers Get Tomtom Data; Let the Crowdsourcing Begin. O’Reilly Radar. Retrieved 5/9/2009, from http://radar.oreilly.com/2008/10/tele-atlas-customers-get-tomto.html.
Google Inc. (2009). Google Maps. Retrieved 5/6/2009, from http://maps.google.com/.
HowStuffWorks.com. (2000). What speed should I drive to get maximum fuel efficiency?. Retrieved 12/9/2008, from http://auto.howstuffworks.com/question477.htm.
Kaufman, D. (2008, January 20). Number of Rooms Can’t Meet Surging Demand. The New York Times. Retrieved 10/20/2008, from http://www.nytimes.com/2008/01/20/travel/20headsup.html/.
Knott’s Berry Farm. (2009). Parking & Directions. Retrieved 5/6/2009, from http://www.knotts.com/park/guest/parking.shtml.
Lake Michigan Carferry. (2009). S.S. Badger Schedule & Fares. Retrieved 5/6/2009, from http://www.ssbadger.com/content.aspx?Page=Schedule.
MapQuest Inc. (2009). MapQuest Directions. Retrieved 5/9/2009, from http://www.mapquest.com/.
Microsoft Corp. (2009). Virtual Earth. Retrieved 5/4/2009, from http://maps.live.com/.
Mitchell, A. (1997). Zeroing In (1st ed.). Redlands, Calif.: ESRI Press.
OAG Worldwide Inc. (2009). Hotels At Per Diems. Retrieved 5/4/2009, from http://www.hotelsatperdiem.com/.
O’Brien, T. (2003). The Amusement Park Guide (5th ed.). Nashville, TN: Casa Flamingo Literary Arts.
Research and Innovative Technology Administration. (2007). Transportation Statistics Annual Report. Retrieved 5/8/2009, from http://www.bts.gov/publications/transportation_statistics_annual_report/2007/.
Sasena, M. J., Paplambros, P. & Goovaerts, P. (2002). Exploration of Metamodeling Sampling Criteria for Constrained Global Optimization. Ann Arbor, MI: University of Michigan.

21
Sharkey, J. (2008, October 20). The Credit Squeeze Compresses Travel, Too. The New York Times. Retrieved 10/21/2008, from http://www.nytimes.com/2008/10/21/business/21road.html/.
Texas Transportation Institute. (2007). 2007 Annual Urban Mobility Report. College Station, TX: Texas A&M University.
Theme Park Review. (2009). Events. Retrieved 5/6/2009, from http://www.themeparkreview.com/events/.
TomTom International. (2009). Route Planner. Retrieved 5/9/2009, from http://routes.tomtom.com/.
U.S. Dept. of Energy. (2009) Gasoline Prices. Retrieved 5/9/2009, from http://www.fueleconomy.gov/feg/gasprices/.
Yahoo! Inc. (2009). Yahoo Maps. Retrieved 5/9/2009, from http://maps.yahoo.com/.