4-Years Development of EU-Funded Agricultural...
20
4-Years Development of EU-Funded Agricultural Cooperatives across Georgia Preliminary Results of Annual Cooperative Survey ENPARD I Consortia Joint Closure Event Irakli Kochlamazashvili, ISET 1 December, 2017
Transcript of 4-Years Development of EU-Funded Agricultural...

4-Years Development of EU-Funded Agricultural Cooperatives across Georgia
Preliminary Results of Annual Cooperative Survey
ENPARD I Consortia Joint Closure Event
Irakli Kochlamazashvili, ISET1 December, 2017

Methodology
• Annual Cooperative Survey
o In the beginning of 2015, the Monitoring and Evaluation (M&E) Working Group was established with
the involvement of 4 ENPARD implementer consortia (led by CARE, Oxfam, Mercy Corps, and PIN);
o The survey questionnaire was developed by the M&E Working Group led by ISET Policy Institute
(partner in CARE consortium); 4 consortia use the same questionnaire since 2015;
o Each consortium collects data by itself and submits to ISET;
o ISET then consolidates, cleans, checks, and transfers data into STATA usable format;
o ISET analyses the data and delivers the results.
2
Research Limitations• Data is self-reported by cooperatives (not verified by official documents in most cases);
• UNDP-supported cooperatives were surveyed retrospectively regarding the years 2014-2016 in March-April 2017;
• Survey regarding the fiscal year of 2017 was conducted in October-November 2017, so most of the data is projection
made by the cooperatives.
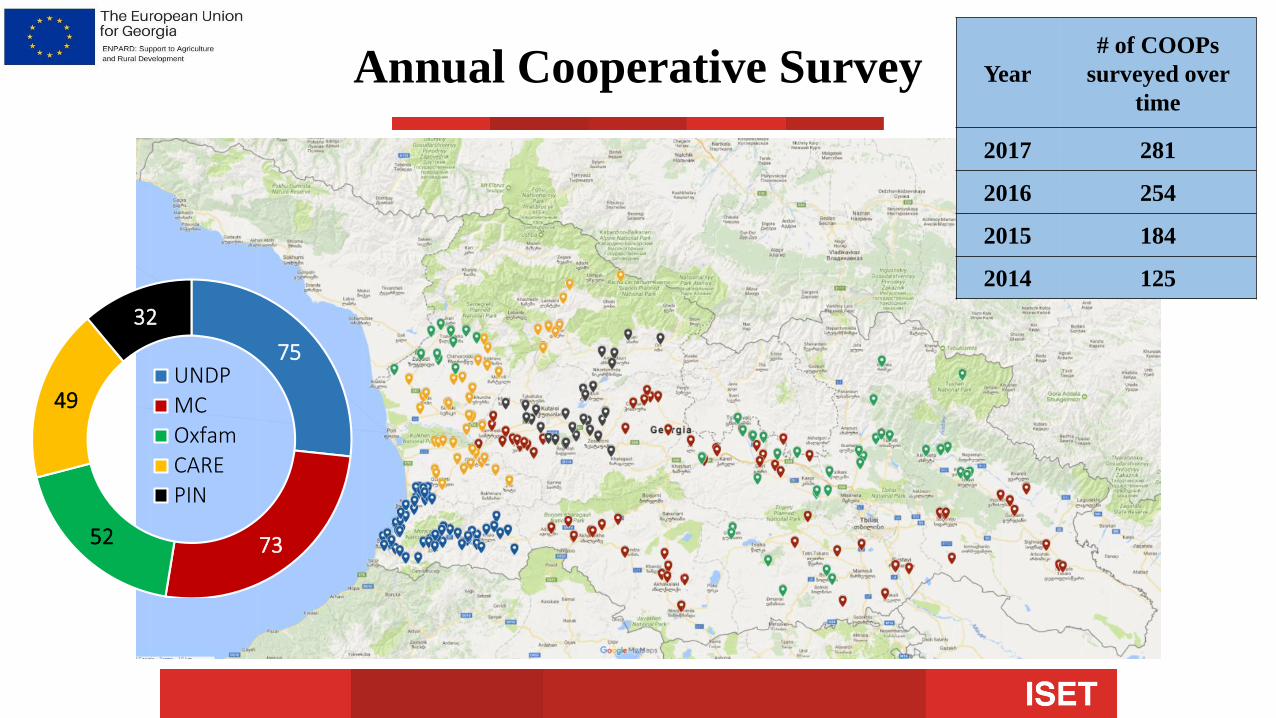
Annual Cooperative Survey
75
7352
49
32
UNDP
MCOxfam
CARE
PIN
Year
# of COOPs
surveyed over
time
2017 281
2016 254
2015 184
2014 125

ENPARD-supported Agricultural Cooperatives
More than 280 Agricultural Cooperatives supported by ENPARD Georgia;
Initial Investment:
➢GEL 13.6 Million was invested by ENPARD and GEL 4.4 Million was co-financed by cooperatives as of initial investment (Total: GEL 18 Million). 65 thousand GEL per COOP.
Additional Investment:
➢GEL 8 Million was invested by cooperatives during last four years (from Gov’t and non-Gov’t sources).
•Total Investment: ➢Roughly, GEL 26 Million was invested in those cooperatives during last 4 years (GEL
92 thousand per COOP)

5
Sectorial Diversity
111
333344566778
1316161718
212122
2550
0 10 20 30 40 50 60
Rabbit
Tangerine
Dry Fruits
Beef/Offal
Flower
NTFP
Tea
Greens
Mushroom
Fruit
Nursery
Sheep/Goat
Animal Feed
Poultry
Fishery
Multi-sectorial
Service
Berry
Diary
Vegetable
Potato
Viticulture
Hazelnut
Cereals
Apiculture

Membership
6
53
41
22
61 1 1
72
57
42
8
1 3 1
84 82
67
7 62
6
8388
77
11 94
9
0
10
20
30
40
50
60
70
80
90
100
3 ≤ n ≤ 5 5 < n ≤10 10 < n ≤ 15 15 < n ≤ 20 20 < n ≤ 25 25 < n ≤ 30 n > 30
2014 2015 2016 2017
YearTotal # of Members
Average # of Members per COOP
Average # of members excluding the largest two
COOPs
2017 4666 16.6 10.2
2016 2955 11.6 9.6
2015 1568 8.5 8.5
2014 1019 8.2 8.2
• Largest cooperative has 1303 members and the smallest - 3 members;
• Less than 10 families are represented in more than 70% of cooperatives (however, the
number of families per cooperative has increased compared to 2014 year).
• 77% of cooperative members indicated that agriculture is their main source of
income.

Membership Diversity
7
46%
25%
26%
3%
Education
Higher
Secondary
Vocational
Primary
97%
2% 1% 0%
Ethnicity
Georgian
Armenian
Azeri
Other% of Higher
2014 2015 2016 2017
50% 52% 47% 46%
% of Georgians
2014 2015 2016 2017
96% 96% 96% 97%
48%
30%
14%
8%
Age
40-59
26-39
60+
18-25
% share of members in a range of 18-39
2014 2015 2016 2017
41% 37% 35% 38%

Women Participation
Year# of
cooperatives surveyed
Total # of members
Share of women
members
Share of women representatives at
management board
# of coops with at least one female member
Share of women in total employees
2017 281 4666 34% 21% 222 53%
2016 254 2955 32% 23% 196 51%
2015 184 1568 30% 20% 133 45%
2014 125 1019 30% 32% 89 44%
• In total, women participation in cooperatives (being members or employees) was 33-33% in 2014 and in 2015, 37% in 2016, and 38% in 2017.
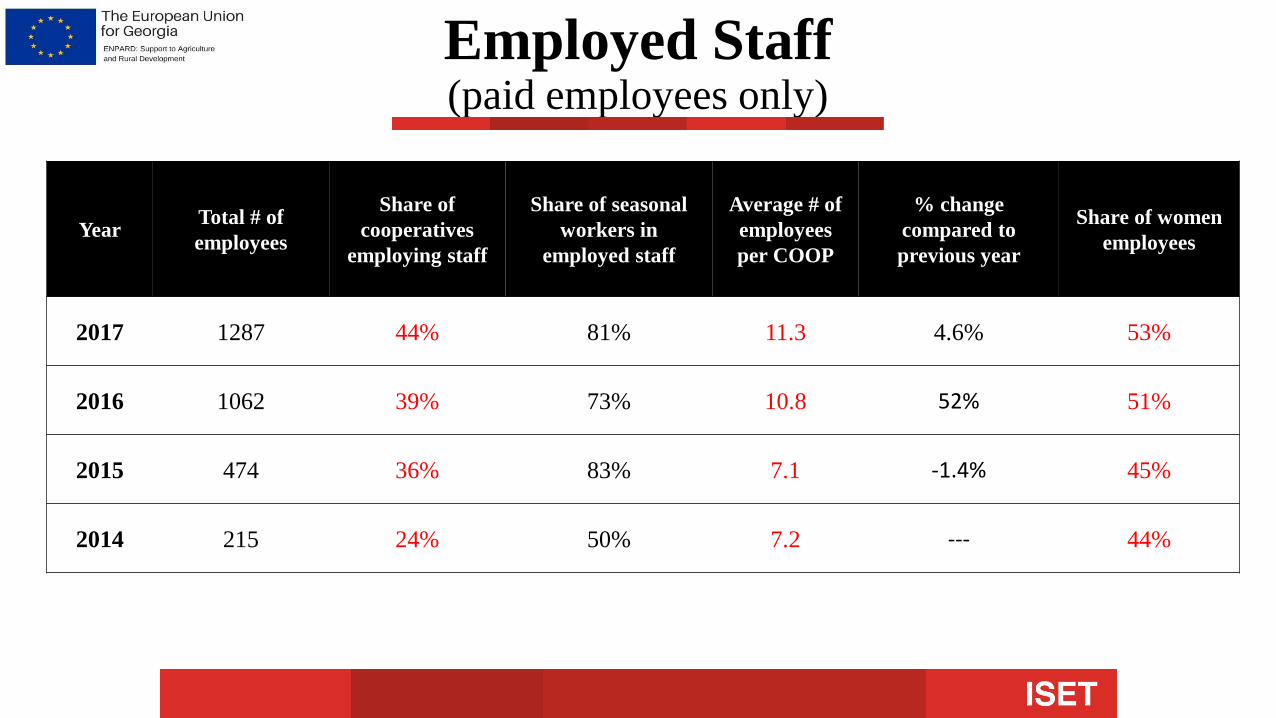
Employed Staff (paid employees only)
YearTotal # of
employees
Share of
cooperatives
employing staff
Share of seasonal
workers in
employed staff
Average # of
employees
per COOP
% change
compared to
previous year
Share of women
employees
2017 1287 44% 81% 11.3 4.6% 53%
2016 1062 39% 73% 10.8 52% 51%
2015 474 36% 83% 7.1 -1.4% 45%
2014 215 24% 50% 7.2 --- 44%

Total Fixed Assets Used by Cooperatives
10
43%
17%
14%
11%
15%
Agricultural Land
Buildings (factory, stables, storage, greenhouses, etc.)
Movable Machinery and Attachhments (tractor, harvester, pick-up)
Stationary Machinery and Equipment (processing machines, etc.)
Other Assets
YearMean
(GEL)
Median
(GEL)
Total Value
(GEL)
2017 227 K 138 K 62.3 mln.
2016 162 K 119 K 40,4 mln.
2015 104 K 80 K 12,3 mln.
2014 55 K 28 K 3,3 mln.

11
Year# of COOPs reported
production value
Mean
(GEL)
Median
(GEL)
Total Value
(GEL)
2017 275 55 K 30 K 15.0 mln.
2016 222 57 K 24 K 12.8 mln.
2015 141 59 K 20 K 8.4 mln.
2014 87 40 K 18 K 3.5 mln.
Production Value
• Compared to 2014, the production value per cooperative increased by 37% on average in 2017.
• However, 2015 year was better than 2016 and 2017, when production value has decreased slightly compared to previous year.
39,882
59,448 57,673 54,640
0
10,000
20,000
30,000
40,000
50,000
60,000
70,000
2014 2015 2016 2017
GE
L
YEAR
PRODUCTION VALUE PER COOP

12
Financial Performance
• Initial Investment on Average: 65 thousand GEL
• Average Profit per COOP: 17 500 GEL
• Payback Period of Initial Investment: Less than 4 Years
• Total Investment on Average: 92 thousand
• Expected Payback Period of Total Investment: 6-7 Years
0%
5%
10%
15%
20%
25%
30%
35%
40%
45%
2014 2015 2016 2017
Per
can
tag
e
Average Profit Margin per COOP
0
10,000
20,000
30,000
40,000
50,000
60,000
70,000
2014 2015 2016 2017
GE
L
ALL COOPs
(financial performance)
Profit Production Value

13
Stinkbug Effect?!
0
10,000
20,000
30,000
40,000
50,000
60,000
70,000
2014 2015 2016 2017
GE
L
ALL COOPs
(financial performance)
Profit Production Value
0
10,000
20,000
30,000
40,000
50,000
60,000
70,000
2014 2015 2016 2017
GE
L
WITHOUT HAZELNUT COOPs(financial performance)
Profit Production Value

14
Constraints to the Success of Cooperative
0
0.1
0.2
0.3
0.4
0.5
0.6
Access to
Finance
Unfavourable
Weather
Conditions
Access to Assets
(land,
machinery, etc.)
Access to Inputs
(seeds,
fertilizers, etc.)
Access to
Markets (incl.
infrastructure)
Government
Regulations
(taxes, business
environment,
food safety, etc.)
Access to
Skilled Labor
Access to
Information
Market
Instability (incl.
price
fluctuation)
Deseases and
pests
Other
Sca
led
Sco
re
2014 2015 2016 2017 Average

from non-Gov’t sources
15
• Besides ENPARD grant, 23% of cooperatives
received additional financial support from non-
government sources in 2017;
• In total, additional finances comprised GEL 2,418,179
from Gov’t sources
Additional Support
• Besides ENPARD grant, 10% of cooperatives
received additional financial support from the
government in 2017;
• In total, additional finances comprised GEL 1,690,486
0
200
400
600
800
1000
1200
NGO Grants Financial Support
from New Ordinal
Members
Regular Credit Additional
Investments from
Original Members
Thousand GEL
2014 2015 2016 2017
0 100 200 300 400 500 600 700 800
Viticulture (ACDA)
Cheap Loan (APMA)
Dairy Production (ACDA)
Beekeeping (ACDA)
Plant the Future (APMA)
Produce in Georgia (APMA)
Agro Technics (ACDA)
Agro-Insurance (APMA)
Other Program by APMA
Other / Non-specified
Thousand GEL
2014 2015 2016 2017

Markets & Marketing
16
• Most of the cooperatives sell their products at the local market (within own region);
• Products of 31% of cooperatives were sold outside of the region (at the national market);
• Products of 14 cooperatives were exported in 2017 (mostly via exporter);
• Three main channels of marketing are used:
o Directly to local consumerso Via wholesalerso Via city [super]markets
85122 201 230
1845 61
86
5 5 9 14
0%
10%
20%
30%
40%
50%
60%
70%
80%
90%
100%
2014 2015 2016 2017
Geographical Area where Cooperatives’ Products were
Sold in 2017
Local Market (inside the region) National Market Export

Collaboration with Local Service Providers
17
0 0.5 1 1.5 2 2.5 3 3.5 4
ENPARD Implementers
Local Farmers
Regional Information Consultation Center
Non-local Farmers
Agricultural Cooperative Agency
Service Providers
Municipal Government
Sectoral Associations
Other NGOs
Regional Government
FREQUENCY of Collaboration with the Institutions / Agencies
2014 2015 2016 2017
Scaled score

18
40%
17%
9%
32%
1%
41%
18%
11%
26%
4%
39%
21%
13%
26%
2%
40%
22%
18%
17%
3%
Benefits from joint purchase & usage of machinery
Benefits from joint post-harvest treatment
Benefits from gained knowledge / contacts
Benefits from joint purchase of inputs
Other benefits
Benefits from Cooperation (as seen by cooperative members)

Thank you!
19
Nino Kakulia
Daviti Zhorzholiani
Irakli Kochlamazashvili
ISET Policy Institute - Agricultural Policy Research Center
Special Thanks
toM&E Coordinators:
Natia Katsia (CARE)
Medea Ioseliani (Oxfam)
Merab Svanidze (UNDP)
Sophie Putkaradze (PIN)
Rusudan Nadiradze (Mercy Corps)
20
This presentation was produced with the assistance of the European Union, Austrian Development Cooperation, CARE, Mercy Corps, Oxfam, PIN and UNDP. The contents
are the sole responsibility of the ISET Policy Institute and can in no way be taken to reflect the views of the European Union, Austrian Development Cooperation, or CARE,
Mercy Corps, Oxfam, PIN or UNDP.