3D Finite Element Modeling and Analysis of Micromechanical Sensors · 2012-12-05 · 3D Finite...
12
3D Finite Element Modeling and Analysis of Micromechanical Sensors Alexey I. Borovkov, Eugeny V. Pereyaslavets Computational Mechanics Laboratory, St. Petersburg State Technical University, Russia Abstract This work is dedicated to finite element (FE) 3D structural and modal analysis of various micromechanical sensors. All researched objects are made of silicon by means of formation technology methods. During the research 3D close-to-reality mathematical models have been created. The analysis performed allows us with a high degree of accuracy to determine stresses, strains and deflections appearing both in manufacture and operation of researched devices. The modal analysis allows obtaining operational frequencies. As the result of the research performed the new parameters of micromechanical sensors have been determined which can be used to improve their characteristics. Strain-gage pressure sensor with plane membrane and rigid center Object and goal of research Silicon pressure sensors are the first and mostly mass, commercially-successful product of microsystem technologies. Microelectromechanical pressure sensors find new spheres of application in such important branches of industry as automotive and aerospace. For these and some other applications, it is necessary to provide high dependability, longevity and functioning stability together with minimal outline dimensions and high dynamic characteristics. Parameters of a developed sensor shall meet requirements of automotive and aerospace applications. It shall be highly sensitive and sufficiently resistant to pressure overloading. For solution of these problems it is necessary to carry out a preliminary research of stress-strain state and natural vibrations of a sensor sensitive element. The considered sensitive element of a strain-gage type microsensor presents a rectangular chip with a square membrane and a rigid center (Figure 1). The technology of manufacturing this sensitive element is not essentially different from that for silicon membrane sensors production [1, 2]. The only difference is the template configuration for anisotropic etching of the under-membrane cavity. The outline size of the sensor is 3×3×0.4 mm, a membrane plane being 1×1 mm in size with 1µm- thickness. Rigid center size is varied from 0.2×0.2×0.1 mm to 0.5×0.5×0.1 mm with a 0.1mm-step. The main goal of the design is optimization of the rigid center dimensions.
Transcript of 3D Finite Element Modeling and Analysis of Micromechanical Sensors · 2012-12-05 · 3D Finite...

3D Finite Element Modeling and Analysis of Micromechanical Sensors
Alexey I. Borovkov, Eugeny V. Pereyaslavets
Computational Mechanics Laboratory, St. Petersburg State Technical University, Russia
Abstract This work is dedicated to finite element (FE) 3D structural and modal analysis of various micromechanical sensors. All researched objects are made of silicon by means of formation technology methods. During the research 3D close-to-reality mathematical models have been created. The analysis performed allows us with a high degree of accuracy to determine stresses, strains and deflections appearing both in manufacture and operation of researched devices. The modal analysis allows obtaining operational frequencies. As the result of the research performed the new parameters of micromechanical sensors have been determined which can be used to improve their characteristics.
Strain-gage pressure sensor with plane membrane and rigid center
Object and goal of research Silicon pressure sensors are the first and mostly mass, commercially-successful product of microsystem technologies. Microelectromechanical pressure sensors find new spheres of application in such important branches of industry as automotive and aerospace. For these and some other applications, it is necessary to provide high dependability, longevity and functioning stability together with minimal outline dimensions and high dynamic characteristics.
Parameters of a developed sensor shall meet requirements of automotive and aerospace applications. It shall be highly sensitive and sufficiently resistant to pressure overloading. For solution of these problems it is necessary to carry out a preliminary research of stress-strain state and natural vibrations of a sensor sensitive element. The considered sensitive element of a strain-gage type microsensor presents a rectangular chip with a square membrane and a rigid center (Figure 1). The technology of manufacturing this sensitive element is not essentially different from that for silicon membrane sensors production [1, 2]. The only difference is the template configuration for anisotropic etching of the under-membrane cavity. The outline size of the sensor is 3×3×0.4 mm, a membrane plane being 1×1 mm in size with 1µm-thickness. Rigid center size is varied from 0.2×0.2×0.1 mm to 0.5×0.5×0.1 mm with a 0.1mm-step. The main goal of the design is optimization of the rigid center dimensions.

Figure 1 - Geometrical model of the strain-gage pressure sensor sensitive element
Analysis results and discussion A substrate provides the rigid fixing of the membrane along the perimeter. It allows using simpler model, which represents the membrane with all edges clamped. As the pressure sensor has two planes of symmetry, only its quarter was considered. The 3D FE model of the membrane is shown in Figure 2. Characteristics of the given FE model are the following: number of elements NE = 875, number of degrees of freedom NDF = 17844 (the elements used were SOLID95). Figure 3 demonstrates dependence of maximal membrane deflection on static load − uniformly distributed pressure P0 – for different rigid centers; stress state, originating as a result of membrane forming at 1473 K, being taken into account. For comparison, the results for a plane membrane (without rigid center) of the same size are also presented. A natural result is diminution of a slope angle of the linear relations obtained with the decrease of rigid center size, what leads to increasing the measured pressure range. Thus, a membrane with the largest rigid center exhibits the widest measured pressure range. At the next stage, it is necessary to determine the geometry of the sensor providing its maximal sensitivity. With this end in view, let us consider the dependence of equivalent (von Mises) strains of the membrane εi on operating loads for various sizes of the rigid center (Figure 4). From graphs in Figure 4 one may conclude that the membranes with rigid center size of 0.3×0.3×0.1 mm and 0.5×0.5×0.1 mm are most sensible. Comparing these two membranes with each other, one may see that the membrane with the rigid center 0.5×0.5×0.1 mm in size has the following advantage: the deflection increase with the pressure rise proceeds slower owing to maximal rigidity, resulting in expansion of the measured pressure range.
Figure 2 - 3D FE model of the sensitive element membrane

Figure 3 - Dependence of the maximal membrane deflection on the static load
Figure 4 - Dependence of von Mises equivalent strains of the membrane on operating loads
The investigation of the membrane sensitive element natural vibrations is needed to be performed for determination of operation frequency range of the pressure sensor as a whole. Natural frequency computation within the ANSYS FE software [3] was implemented with the use of the block Lanczos method. Owing to the symmetry of the system considered, multiple natural frequencies appear in the spectrum. Rigid center size was varied from 0.2×0.2×0.1 mm to 0.5×0.5×0.1 mm. Figure 5 shows dependence of the first natural frequency of the membrane on rigid center size, from where it is seen that the membranes with rigid center size 0.2×0.2×0.1 mm and 0.5×0.5×0.1 mm expose the best spectrum properties.

Figure 5 - Dependence of the first natural frequency of the membrane on rigid center size
Thus, basing on the research performed, one may conclude that the optimal sensitive element configuration for the given geometry is a sensitive element with the most rigid center from the given size set, although not possessing maximal sensitivity within some load range.
Catheter pressure sensor
Object and goal of research For biomedical investigations it is important to decrease size of sensors implanted in experimental animals, keeping sufficiently high dependability and low costs. The developed sensor with a corrugated membrane is intended for pressure measurement, being a part of a telemetric capsule or a catheter. Aiming to optimize its design, it is necessary to simulate effect of design and technological parameters on corrugated membrane characteristics.
A microsensor is produced in the shape of rectangular plate with a hollow covered with a corrugated membrane. Outline dimensions of the rectangular plate – 4×1×0.4 mm, membrane area –1×0.2 mm, corrugation pitch – 80 µm, corrugation length – 40 µm; number of corrugations – 12. A half of the sensor is depicted in Figure 6. A silicon plate of N-type (100) is used for sensor sensitive element manufacture. Sequence of the process of membrane formation is the following: isotropic etching of grooves, semi-circular in projection, from the upper side of a silicon plate; creation of silicon dioxide film of 1µm-thickness by thermal oxidation; anisotropic etching of the under-membrane hollow up to breaking up oxide film. The thickness of silicon crosspieces between semi-circular grooves – 5 µm. Thermal oxide film is formed at 1323 K. This causes emergence of thermal stresses in the plate during its cooling and significantly affects membrane characteristics.
Analysis results and discussion Inasmuch as the base provides rigid fastening of the membrane, it was considered a simplified model: a membrane rigidly fixed along the outline (correctness of using this model was established by multivariant FE computations). As the membrane has two planes of symmetry, only one fourth of it was considered in computations (Figure 6). The 3D FE model of the corrugated membrane contains 7168 20-node elements SOLID95 (NDF = 112749). In the FE research the membrane was loaded by uniformly distributed pressure P0 within the operation range 0…300 mm MC. At this pressure range a microsensor signal is read with

account of minor membrane strains. Therewith, the stress-strain state originating in the process of membrane formation was taken into account. Figure 7 demonstrates a displacement (uz) field emerging during formation of the corrugated membrane. Sensor sensitivity was estimated by maximal equivalent (von Mises) strains. The comparative analysis of the results obtained for corrugated and plane membranes allows making the following conclusions:
1) Deflections of a corrugated membrane increase under the pressure rise slower than in the case of a plane membrane; this result allows substantial expansion of sensor operation range in its using for measuring higher pressure.
2) In the case of the same geometrical dimensions, sensitivity of the sensor with the corrugated membrane noticeably increases compared to that of the sensor with the plane membrane (that is the main advantage of the corrugated membrane).
Figure 6 - Geometrical model of the catheter pressure sensor sensitive element and 3D FE model of the sensitive element membrane

Figure 7 - Displacement field emerging during formation of the corrugated membrane
For estimation of operation frequency range of the catheter pressure sensor, lowest natural frequencies of the membrane were determined using the block Lanczos method. The values of the first natural frequency occurred to be F1 = 1.19 MHz. The first natural mode of the corrugated membrane is shown in Figure 8. This result shows that the corrugated membrane possesses rather good spectrum characteristics and provides sufficiently high dependability of the sensor as a whole.
Figure 8 - The first natural mode of the corrugated membrane
Micromechanical vibrogyroscope
Statement of problem At present, micromechanical vibrogyroscopes find more and more wide application. One of the most active consumers of microgyroscopes is automotive industry (navigation, control and automatic braking systems, supporting structures and safety systems). A multitude of problems are being solved with the use of microgyroscopes in medicine industry, in development of computer equipment and automatic devices, in creation of miniature systems of orientation and controls of pilotless aircraft, etc. Attractive qualities of these devices, which defined their fast development are low costs, high dependability and extremely small dimensions.
In micromechanical device manufacture, the technology “Silicon-on-glass” is often used. In particular, this method is applied for manufacture of vibration resonance sensors with an electrostatic drive [4, 5]. One of

the constructive peculiarities of these sensors is a quasi-2D geometry and presence of cantilever fastening of vibrating parts. The technology of manufacturing such structures comprises several successive operations resulting in creation of a monocrystal silicon structure 10-20 µm in thickness cantileveredly fixed to protuberances of the glass base (a fragment of silicon structure is exhibited in Figure 9). However, in creation of these structures it was found out that if cantilever length is about 1 mm, a thin silicon structure buckles, and electrostatic drive teeth come out of a stator plane by about 10 µm (Figure 10). The experiments performed showed that strain values were the same in the structures welded to the glass substrate and in unwelded vibrator samples. Therefore, the reason of the strain appearance cannot be connected with the difference in values of thermal expansion coefficients of silicon and glass. Most probably, its cause is the Twaiman’s effect, connected with different prehistory of manufacture and treatment of two surfaces: the initial polishing of planar surfaces and the deep etching of the opposite side of the silicon plate during the process of silicon remnants removal. Inasmuch as it is extremely difficult to eliminate this reason by technological means, it was suggested to change the topology of the structure with the requirement of retention of main mechanical parameters: resonance frequencies and vibration modes. Thus, the objective of the present research was the comparing of the original construction with a new design of the vibrogyroscope.
Figure 9 - SEM-photo one of fragments of the silicon structure
Figure 10 - Deformed state of the silicon structure emerging in manufacturing
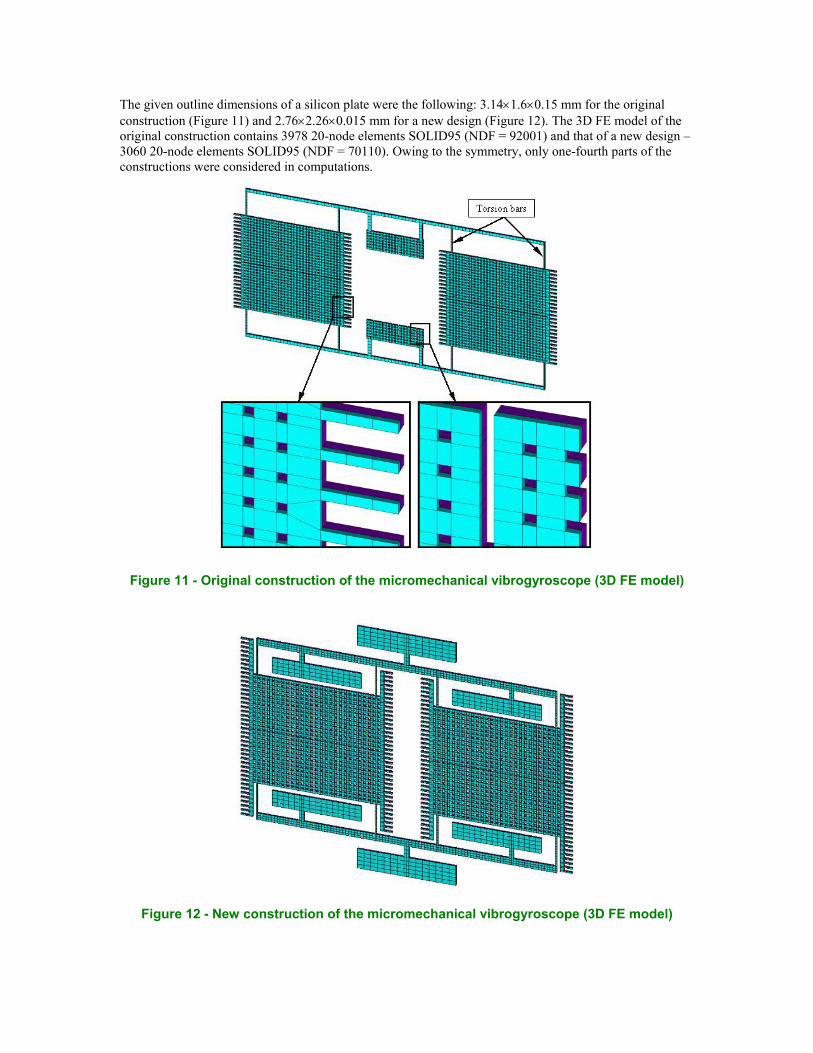
The given outline dimensions of a silicon plate were the following: 3.14×1.6×0.15 mm for the original construction (Figure 11) and 2.76×2.26×0.015 mm for a new design (Figure 12). The 3D FE model of the original construction contains 3978 20-node elements SOLID95 (NDF = 92001) and that of a new design – 3060 20-node elements SOLID95 (NDF = 70110). Owing to the symmetry, only one-fourth parts of the constructions were considered in computations.
Figure 11 - Original construction of the micromechanical vibrogyroscope (3D FE model)
Figure 12 - New construction of the micromechanical vibrogyroscope (3D FE model)

Analysis results and discussion For comparing a new design with the original construction, a strain state was modeled, in which maximal deflection in the original model was taken equal to 10.7 µm. This strain state was obtained by creating a two-layer model with different linear coefficients of thermal expansion for each layer, i.e. α1 = 3.3⋅10-6 K-1, α2 = 2.8⋅10-6 K-1. The thickness of the first layer was taken h1 = 10 µm and that of the second layer – h2 = 5 µm. This structure was supposed to be cooled from 543 to 273 K. Calculations performed showed that maximal deflection in a new design came to 3.5 µm (Figure 13), what in 2.7 times lower compared with deflection in the original construction. This result gives evidence of reaching the goal of the present research.
Figure 13 - Deformed state of the micromechanical vibrogyroscope new construction originating in manufacturing
For determination of the optimal operational mode of the investigated sensor, the natural frequency spectrum of a vibrogyroscope sensitive element was analyzed. Determination of natural frequencies was carried out for a new (improved) design. There were obtained the following values of the first four natural frequencies: F1 = 12.6 kHz, F2 = 12.9 kHz, F3, 4 = 17.7 kHz. The presence of multiple frequencies in the spectrum should be noticed. Natural modes are presented in Figures 14 through 17. The second and the third natural frequencies comply with two operational modes of the sensor. According to the principle of vibrogyroscope functioning, it was required that the values of these two frequencies should be near to each other. To provide it, width of torsion bars was decreased from 10 to 8 µm. It is evident that such a decrease substantially affects the third and the fourth natural frequencies, bringing them closer to the two first ones (see Table 1).

Figure 14 - The first natural mode of the vibrogyroscope
Figure 15 - The second natural mode of the vibrogyroscope

Figure 16 - The third natural mode of the vibrogyroscope
Figure 17 - The fourth natural mode of the vibrogyroscope
Table 1
Torsion bar width, µm Natural frequency, kHz
10 F1 = 12.6 F2 = 12.9 F3, 4 = 17.7
8 F1 = 12.2 F2 = 12.5 F3, 4 = 12.9
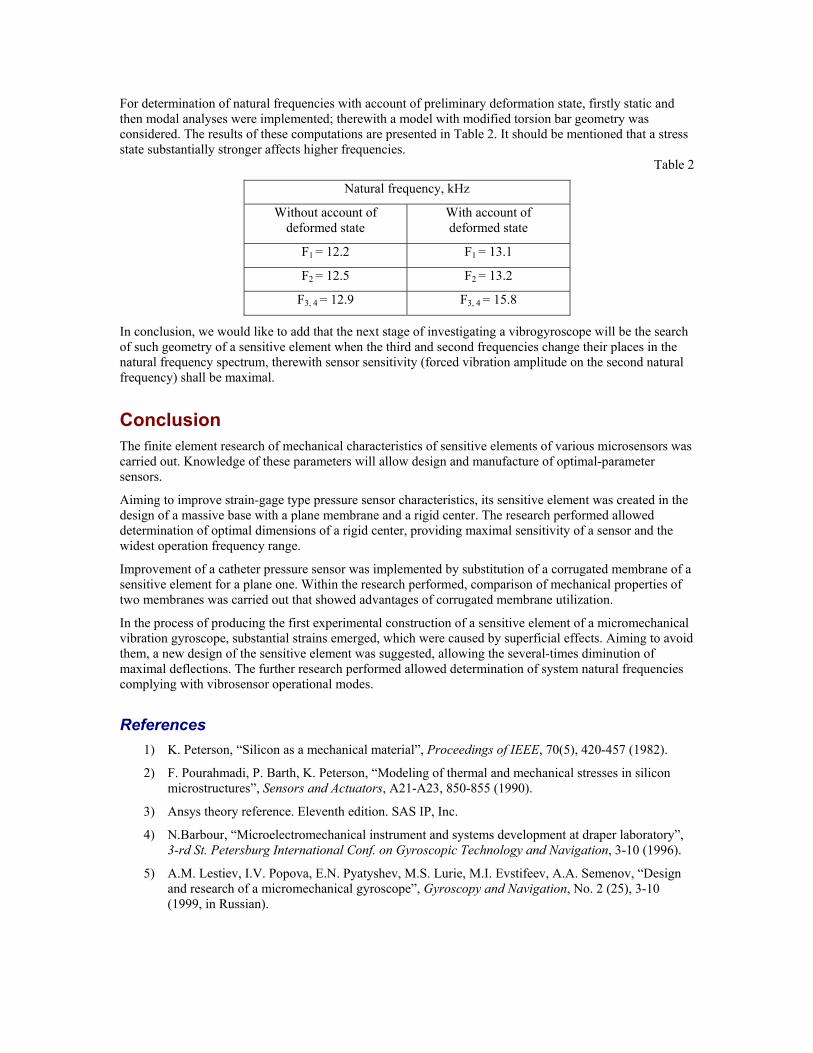
For determination of natural frequencies with account of preliminary deformation state, firstly static and then modal analyses were implemented; therewith a model with modified torsion bar geometry was considered. The results of these computations are presented in Table 2. It should be mentioned that a stress state substantially stronger affects higher frequencies.
Table 2
Natural frequency, kHz
Without account of deformed state
With account of deformed state
F1 = 12.2 F1 = 13.1
F2 = 12.5 F2 = 13.2
F3, 4 = 12.9 F3, 4 = 15.8
In conclusion, we would like to add that the next stage of investigating a vibrogyroscope will be the search of such geometry of a sensitive element when the third and second frequencies change their places in the natural frequency spectrum, therewith sensor sensitivity (forced vibration amplitude on the second natural frequency) shall be maximal.
Conclusion The finite element research of mechanical characteristics of sensitive elements of various microsensors was carried out. Knowledge of these parameters will allow design and manufacture of optimal-parameter sensors.
Aiming to improve strain-gage type pressure sensor characteristics, its sensitive element was created in the design of a massive base with a plane membrane and a rigid center. The research performed allowed determination of optimal dimensions of a rigid center, providing maximal sensitivity of a sensor and the widest operation frequency range.
Improvement of a catheter pressure sensor was implemented by substitution of a corrugated membrane of a sensitive element for a plane one. Within the research performed, comparison of mechanical properties of two membranes was carried out that showed advantages of corrugated membrane utilization.
In the process of producing the first experimental construction of a sensitive element of a micromechanical vibration gyroscope, substantial strains emerged, which were caused by superficial effects. Aiming to avoid them, a new design of the sensitive element was suggested, allowing the several-times diminution of maximal deflections. The further research performed allowed determination of system natural frequencies complying with vibrosensor operational modes.
References 1)
2)
3)
4)
5)
K. Peterson, “Silicon as a mechanical material”, Proceedings of IEEE, 70(5), 420-457 (1982). F. Pourahmadi, P. Barth, K. Peterson, “Modeling of thermal and mechanical stresses in silicon microstructures”, Sensors and Actuators, A21-A23, 850-855 (1990). Ansys theory reference. Eleventh edition. SAS IP, Inc. N.Barbour, “Microelectromechanical instrument and systems development at draper laboratory”, 3-rd St. Petersburg International Conf. on Gyroscopic Technology and Navigation, 3-10 (1996).
A.M. Lestiev, I.V. Popova, E.N. Pyatyshev, M.S. Lurie, M.I. Evstifeev, A.A. Semenov, “Design and research of a micromechanical gyroscope”, Gyroscopy and Navigation, No. 2 (25), 3-10 (1999, in Russian).