31-00036—01 - Power Software Configuration tool · 2014-09-22 · Power Software Configuration...
16
INSTALLATION INSTRUCTIONS 31-00036-01 Power Software Configuration tool POWER SOFTWARE FOR WINDOWS TABLE OF CONTENTS Introduction Installation ......................................................................... 2 File Formats ...................................................................... 2 Automatic Data Retrieving................................................. 2 Embedded Communication Test ....................................... 2 Preprogrammed Data Sets................................................ 2 Communicating with Your Meters Creating a New Site .......................................................... 3 Setting up Communications .............................................. 3 Selecting a Protocol for a Serial Port/Modem ................... 3 Communicating through a Serial Port ............................... 4 Communicating through a Modem .................................... 4 Communicating through Internet ....................................... 4 Programming Your Meters Creating Setups for Your Meters Off-Line.......................... 5 Downloading Setups to Your Meters ................................. 5 Uploading Setups from Your Meters.................................. 5 Monitoring Your Meters Viewing Real-time Data ..................................................... 6 Changing the Data View.................................................... 6 Adjusting the Number of Rows in a Multi-Record View ..... 6 Saving Data to a File ......................................................... 6 Printing Data to a Printer ................................................... 6 Copying Data to Another Application ................................ 6 Real-time Data Logging..................................................... 7 Viewing Real-time Min/Max Log ........................................ 7 Viewing Real-time Waveforms........................................... 7 Updating the Clock in Your Meters .................................... 7 Remote Relay Operations on Your Meters ........................ 7 Retrieving Historical Data from Your Meters Uploading Historical Data on Demand ..............................8 Using the Upload Scheduler ..............................................8 Adding a New Site to the Schedule ...................................8 Configuring a Schedule for the Meter ................................8 Activating a Schedule for the Meter ...................................9 Suspending the Scheduler ................................................9 Running the Scheduler on Demand ..................................9 Recording Upload Problems ..............................................9 Viewing Historical Data On-line .........................................9 Viewing Log Files Opening a Log File ............................................................10 Exporting Data to Another Application...............................10 Saving Data to a File .........................................................10 Printing Data to a Printer ...................................................10 Viewing the Event Log .......................................................10 Sorting Events ...................................................................10 Filtering Events ..................................................................10 Viewing the Data Log.........................................................10 Viewing the Waveform Log ................................................11 Selecting Waveform Channels...........................................11 Customizing Line Colors and Styles ..................................11 Viewing Phasor Diagrams .................................................12 Viewing Symmetrical Components ....................................12 Selecting Primary and Secondary Units ............................12 Using the Marker Lines......................................................12 Using a Zoom ....................................................................12 Viewing Waveforms ...........................................................13 Viewing an RMS Plot .........................................................13 Viewing a Spectrum Chart .................................................13 Viewing a Spectrum Table .................................................14 Customizing Your Views Customizing Date Format ..................................................15 Customizing Timestamp ....................................................15 Selecting Voltage Disturbance Units..................................15
-
Upload
hoangtuyen -
Category
Documents
-
view
243 -
download
0
Transcript of 31-00036—01 - Power Software Configuration tool · 2014-09-22 · Power Software Configuration...
INSTALLATION INSTRUCTIONS
31-00036-01
Power Software Configuration toolPOWER SOFTWARE FOR WINDOWS
TABLE OF CONTENTSIntroduction
Installation ......................................................................... 2File Formats ...................................................................... 2Automatic Data Retrieving................................................. 2Embedded Communication Test ....................................... 2Preprogrammed Data Sets................................................ 2
Communicating with Your Meters
Creating a New Site .......................................................... 3Setting up Communications .............................................. 3Selecting a Protocol for a Serial Port/Modem ................... 3Communicating through a Serial Port ............................... 4Communicating through a Modem .................................... 4Communicating through Internet ....................................... 4
Programming Your Meters
Creating Setups for Your Meters Off-Line.......................... 5Downloading Setups to Your Meters ................................. 5Uploading Setups from Your Meters.................................. 5
Monitoring Your Meters
Viewing Real-time Data..................................................... 6Changing the Data View.................................................... 6Adjusting the Number of Rows in a Multi-Record View.....6Saving Data to a File ......................................................... 6Printing Data to a Printer................................................... 6Copying Data to Another Application ................................ 6Real-time Data Logging..................................................... 7Viewing Real-time Min/Max Log........................................ 7Viewing Real-time Waveforms........................................... 7Updating the Clock in Your Meters .................................... 7Remote Relay Operations on Your Meters ........................ 7
Retrieving Historical Data from Your Meters
Uploading Historical Data on Demand ..............................8Using the Upload Scheduler..............................................8Adding a New Site to the Schedule ...................................8Configuring a Schedule for the Meter ................................8Activating a Schedule for the Meter...................................9Suspending the Scheduler ................................................9Running the Scheduler on Demand ..................................9Recording Upload Problems..............................................9Viewing Historical Data On-line .........................................9
Viewing Log Files
Opening a Log File ............................................................10Exporting Data to Another Application...............................10Saving Data to a File .........................................................10Printing Data to a Printer ...................................................10Viewing the Event Log .......................................................10Sorting Events ...................................................................10Filtering Events ..................................................................10Viewing the Data Log.........................................................10Viewing the Waveform Log ................................................11Selecting Waveform Channels...........................................11Customizing Line Colors and Styles..................................11Viewing Phasor Diagrams .................................................12Viewing Symmetrical Components ....................................12Selecting Primary and Secondary Units............................12Using the Marker Lines......................................................12Using a Zoom ....................................................................12Viewing Waveforms ...........................................................13Viewing an RMS Plot .........................................................13Viewing a Spectrum Chart.................................................13Viewing a Spectrum Table .................................................14
Customizing Your Views
Customizing Date Format ..................................................15Customizing Timestamp ....................................................15Selecting Voltage Disturbance Units..................................15
POWER SOFTWARE CONFIGURATION TOOL
31-00036—01 2
INTRODUCTIONThe following paragraphs outline some of the differences between this version of Power Software in comparison to previous versions you may have used.
InstallationIf you install the new Power Software into the same directory where your current version of Power Software is installed, it is recommended that you do not uninstall your old Power Software before installing this version; otherwise, your present Power Software configuration database will be destroyed. Your current configuration database and all data files you have are still functional in the new Power Software.
File FormatsAlthough Power Software allows you to open ASCII log files created by previous Power Software versions, and even to store data from the screen to ASCII files, most new features will only use the Microsoft Access .mdb database format. This
format allows you to store different types of logs to a single database as separate tables, and makes it easy to transport your databases onto other PCs.
Automatic Data RetrievingPower Software allows you to retrieve all data logs from your meters at once and store them to a database, either on demand or on a time basis (e.g., daily or weekly) using a predefined schedule.
Embedded Communication TestPower Software incorporates the test features that were previously included in the DOS-based PComTest program, allowing you to test communication with your meters.
Preprogrammed Data SetsAny data sets you have prepared for the RT Data Monitor and RT Min/Max Log are still functional in the new Power Software, although they need to undergo a simple procedure before you can use them: open the Data Set dialog and scroll through all active data sets, and then save them. Perform this procedure for both the RT Data Monitor and RT Min/Max Log.
POWER SOFTWARE CONFIGURATION TOOL
3 31-00036—01
COMMUNICATING WITH YOUR METERS
Creating a New SiteIn order to communicate with your meters, you should create a separate site database for each one where all meter settings are stored. Power Software keeps all site settings in a file with a name you give it and the extension .mdb. When you install Power Software on your computer, a directory named "Sites" is created in the Power Software installation directory. It is advised to keep all your site databases in this directory.
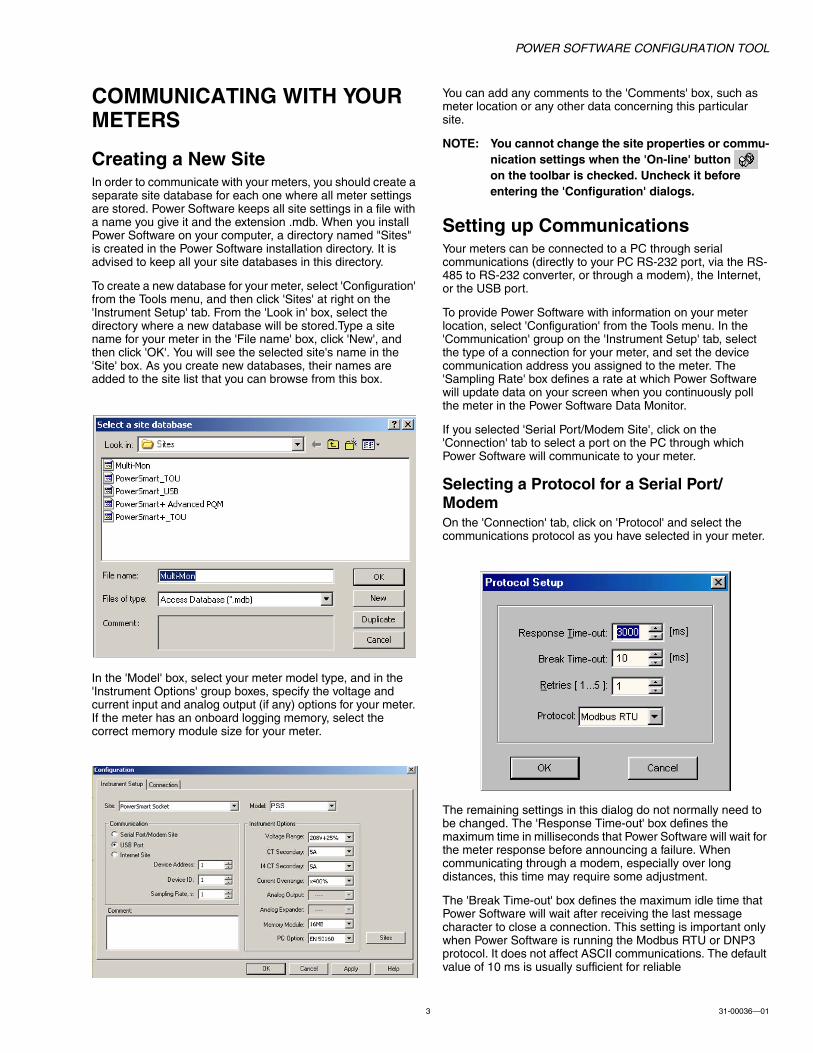
To create a new database for your meter, select 'Configuration' from the Tools menu, and then click 'Sites' at right on the 'Instrument Setup' tab. From the 'Look in' box, select the directory where a new database will be stored.Type a site name for your meter in the 'File name' box, click 'New', and then click 'OK'. You will see the selected site's name in the 'Site' box. As you create new databases, their names are added to the site list that you can browse from this box.
In the 'Model' box, select your meter model type, and in the 'Instrument Options' group boxes, specify the voltage and current input and analog output (if any) options for your meter. If the meter has an onboard logging memory, select the correct memory module size for your meter.
You can add any comments to the 'Comments' box, such as meter location or any other data concerning this particular site.
NOTE: You cannot change the site properties or commu-nication settings when the 'On-line' button on the toolbar is checked. Uncheck it before entering the 'Configuration' dialogs.
Setting up CommunicationsYour meters can be connected to a PC through serial communications (directly to your PC RS-232 port, via the RS-485 to RS-232 converter, or through a modem), the Internet, or the USB port.
To provide Power Software with information on your meter location, select 'Configuration' from the Tools menu. In the 'Communication' group on the 'Instrument Setup' tab, select the type of a connection for your meter, and set the device communication address you assigned to the meter. The 'Sampling Rate' box defines a rate at which Power Software will update data on your screen when you continuously poll the meter in the Power Software Data Monitor.
If you selected 'Serial Port/Modem Site', click on the 'Connection' tab to select a port on the PC through which Power Software will communicate to your meter.
Selecting a Protocol for a Serial Port/ModemOn the 'Connection' tab, click on 'Protocol' and select the communications protocol as you have selected in your meter.
The remaining settings in this dialog do not normally need to be changed. The 'Response Time-out' box defines the maximum time in milliseconds that Power Software will wait for the meter response before announcing a failure. When communicating through a modem, especially over long distances, this time may require some adjustment.
The 'Break Time-out' box defines the maximum idle time that Power Software will wait after receiving the last message character to close a connection. This setting is important only when Power Software is running the Modbus RTU or DNP3 protocol. It does not affect ASCII communications. The default value of 10 ms is usually sufficient for reliable
POWER SOFTWARE CONFIGURATION TOOL
31-00036—01 4
communications, but it can be affected by the load on your PC. If there are many applications running on your PC, Power Software might be prevented from responding to received characters fast enough, so it might close the communication while the meter is still transmitting its response message. If you frequently receive the message 'Communication failed', this could mean that 'Break Time-out' should be increased. Note that this time is added to the message transfer time, and increasing it excessively will slow communications.
The 'Retries' box defines the number of attempts that Power Software will use to receive a response from the meter in the event the communication fails before announcing a communication failure.
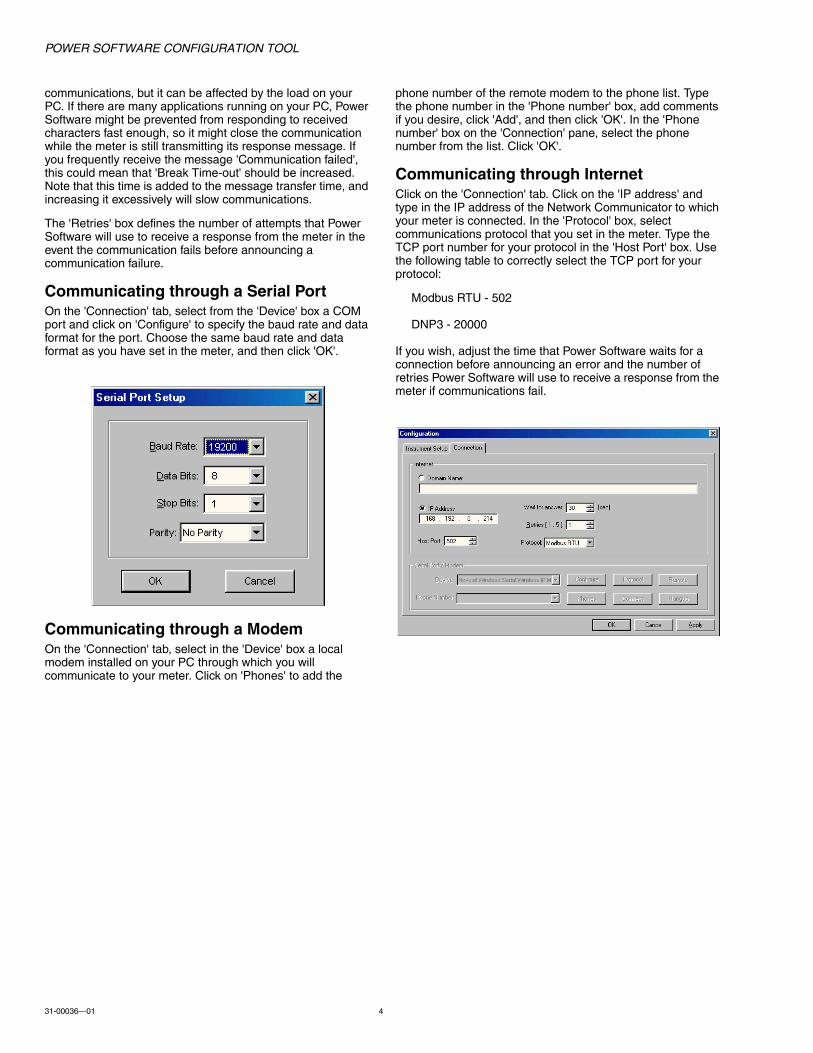
Communicating through a Serial PortOn the 'Connection' tab, select from the 'Device' box a COM port and click on 'Configure' to specify the baud rate and data format for the port. Choose the same baud rate and data format as you have set in the meter, and then click 'OK'.
Communicating through a ModemOn the 'Connection' tab, select in the 'Device' box a local modem installed on your PC through which you will communicate to your meter. Click on 'Phones' to add the
phone number of the remote modem to the phone list. Type the phone number in the 'Phone number' box, add comments if you desire, click 'Add', and then click 'OK'. In the 'Phone number' box on the 'Connection' pane, select the phone number from the list. Click 'OK'.
Communicating through InternetClick on the 'Connection' tab. Click on the 'IP address' and type in the IP address of the Network Communicator to which your meter is connected. In the 'Protocol' box, select communications protocol that you set in the meter. Type the TCP port number for your protocol in the 'Host Port' box. Use the following table to correctly select the TCP port for your protocol:
Modbus RTU - 502
DNP3 - 20000
If you wish, adjust the time that Power Software waits for a connection before announcing an error and the number of retries Power Software will use to receive a response from the meter if communications fail.

POWER SOFTWARE CONFIGURATION TOOL
5 31-00036—01
PROGRAMMING YOUR METERS
Creating Setups for Your Meters Off-LinePower Software allows you to prepare setup data for your meters off-line without the need to have the meter connected to your PC. You can save these data in the meter's site database, and then recall and download it to the meter when you have the meter on-line.
To prepare a setup for your meter, select a meter site from the list box on the toolbar, and then select the desired setup group from the 'Meter Setup' menu.
Click on the tab with the name of the setup you want to create and fill in the boxes with the desired configuration data for your meter.
After you have completed the setup, click on the 'Save as...' button. The name of the selected site database appears in the 'File name' box by default. If you want to save your setup into another site database, select it from the file pane. Click on 'OK'.
NOTE: Power Software uses the Basic Setup data as a reference in all setup dialogs. Create the Basic Setup configuration for your meter first and save it to the site database before preparing other meter setups.
If you want to reuse setups from another site, you can simply copy setups from that site to your present site database. Click 'Open', select the desired site database, and then click 'OK'. The opened setup will be copied to your site database.
You can also copy all setups from one site database into another site's database. Select a meter site from the list box on the toolbar from which you want to reproduce setups, and then select 'Copy to...' from the 'Meter Setup' menu. Select the site database to which to copy setups from the present database, and then click 'OK'.
Downloading Setups to Your MetersPower Software allows you to update each setup in your meter one at time or to download all setups together from the site database.
To update a particular setup in your meter, check the 'On-line' button on the toolbar, select a meter site from the list box on the toolbar, and then select the desired setup group from the 'Meter Setup' menu. Click on the pane with the name of the setup you want to download to the meter, and then click 'Send'.
To download all setups to your meter at once, check the 'On-line' button on the toolbar, select a meter site from the list box on the toolbar, and then select 'Download Setups' from the 'Meter Setup' menu. Reply 'Yes' to the Power Software warning message.
Uploading Setups from Your MetersPower Software allows you to update the site databases with the setups currently presented in your meters.
To upload the setups from the meter to the site database, check the 'Online' button on the toolbar, select a meter site from the list box on the toolbar, and then select 'Upload Setups' from the 'Meter Setup' menu. Reply 'Yes' to the Power Software warning message.
POWER SOFTWARE CONFIGURATION TOOL
31-00036—01 6
MONITORING YOUR METERS
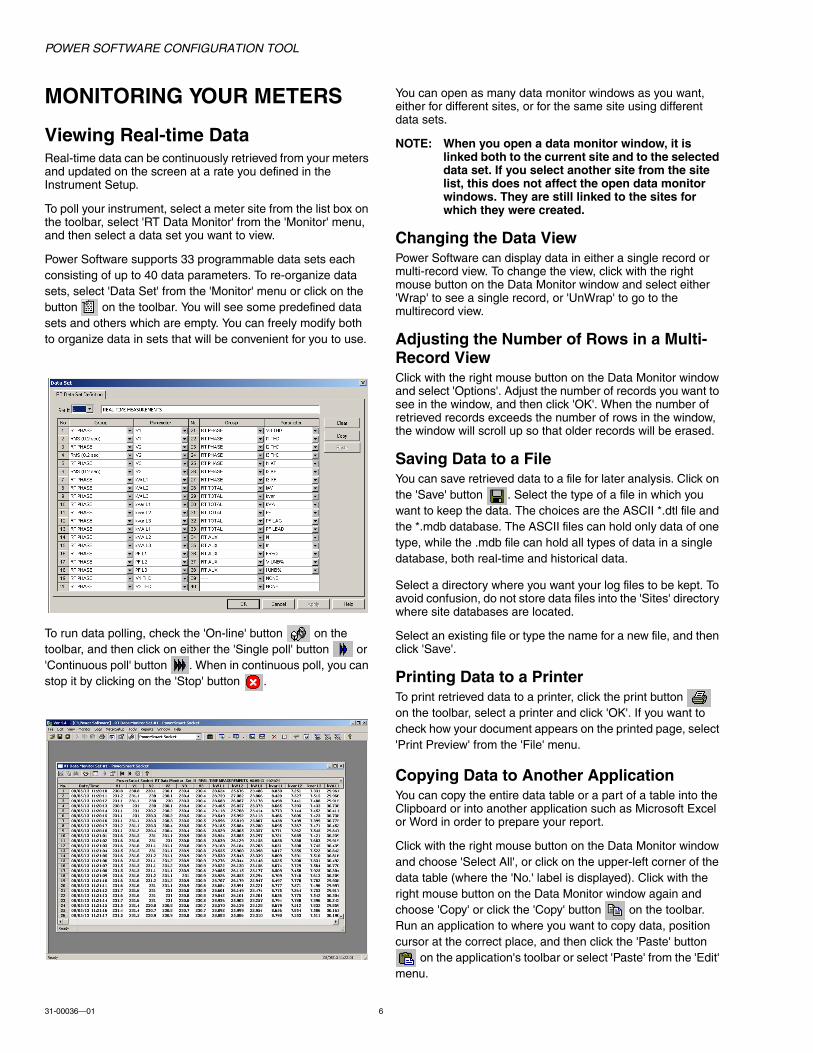
Viewing Real-time DataReal-time data can be continuously retrieved from your meters and updated on the screen at a rate you defined in the Instrument Setup.
To poll your instrument, select a meter site from the list box on the toolbar, select 'RT Data Monitor' from the 'Monitor' menu, and then select a data set you want to view.
Power Software supports 33 programmable data sets each consisting of up to 40 data parameters. To re-organize data sets, select 'Data Set' from the 'Monitor' menu or click on the button on the toolbar. You will see some predefined data sets and others which are empty. You can freely modify both to organize data in sets that will be convenient for you to use.
To run data polling, check the 'On-line' button on the toolbar, and then click on either the 'Single poll' button or 'Continuous poll' button . When in continuous poll, you can stop it by clicking on the 'Stop' button .
You can open as many data monitor windows as you want, either for different sites, or for the same site using different data sets.
NOTE: When you open a data monitor window, it is linked both to the current site and to the selected data set. If you select another site from the site list, this does not affect the open data monitor windows. They are still linked to the sites for which they were created.
Changing the Data ViewPower Software can display data in either a single record or multi-record view. To change the view, click with the right mouse button on the Data Monitor window and select either 'Wrap' to see a single record, or 'UnWrap' to go to the multirecord view.
Adjusting the Number of Rows in a Multi-Record ViewClick with the right mouse button on the Data Monitor window and select 'Options'. Adjust the number of records you want to see in the window, and then click 'OK'. When the number of retrieved records exceeds the number of rows in the window, the window will scroll up so that older records will be erased.
Saving Data to a FileYou can save retrieved data to a file for later analysis. Click on the 'Save' button . Select the type of a file in which you want to keep the data. The choices are the ASCII *.dtl file and the *.mdb database. The ASCII files can hold only data of one type, while the .mdb file can hold all types of data in a single database, both real-time and historical data.
Select a directory where you want your log files to be kept. To avoid confusion, do not store data files into the 'Sites' directory where site databases are located.
Select an existing file or type the name for a new file, and then click 'Save'.
Printing Data to a PrinterTo print retrieved data to a printer, click the print button on the toolbar, select a printer and click 'OK'. If you want to check how your document appears on the printed page, select 'Print Preview' from the 'File' menu.
Copying Data to Another ApplicationYou can copy the entire data table or a part of a table into the Clipboard or into another application such as Microsoft Excel or Word in order to prepare your report.
Click with the right mouse button on the Data Monitor window and choose 'Select All', or click on the upper-left corner of the data table (where the 'No.' label is displayed). Click with the right mouse button on the Data Monitor window again and choose 'Copy' or click the 'Copy' button on the toolbar. Run an application to where you want to copy data, position cursor at the correct place, and then click the 'Paste' button
on the application's toolbar or select 'Paste' from the 'Edit' menu.

POWER SOFTWARE CONFIGURATION TOOL
7 31-00036—01
If you want only a part of data to be copied, select with the mouse cursor while holding the left mouse button the rows or columns in the table you want to copy, and then click the 'Copy' button on the toolbar.
Real-time Data LoggingPower Software allows you to log polled data records to a database automatically at the time it updates the Data Monitor window on the screen.
To setup the real-time logging options:1. Open the Data Monitor window.2. Click on the 'RT Logging On/Off' button on the tool-
bar, or select 'RT Logging Options' from the 'Tools' menu.
3. Select an existing database, or type the name for a new database and select a directory where you want to save it.
4. Select the number of tables, and the number of records in each table you want recorded.
5. Adjust the file update rate for automatic recording. It must be a multiple of the sampling rate that you defined in the Instrument Setup dialog.
6. Click Save.
When you run real-time data polling, Power Software automatically saves retrieved records to the database at the rate you specified. The 'RT Logging On/Off' button on the toolbar should be checked all the time to allow Power Software to perform logging. You can suspend logging by un-checking this button, and then resume logging by checking it again.
Viewing Real-time Min/Max LogTo retrieve the real-time Min/Max log data from the meter, select a meter site from the list box on the toolbar, select 'RT Min/Max Log' from the 'Monitor' menu, and then select a data set you want to view.
Power Software supports nine programmable data sets each consisting of up to 40 data parameters. To re-organize data sets, select 'Data Set' from the 'Monitor' menu or click the button on the toolbar. You will see some predefined data sets and others being empty. You can freely modify both to organize data in sets that will be convenient for you to use.
To retrieve the selected Min/Max log data, check the 'On-line' button on the toolbar, and then click on the 'Single poll' button
.
You can save retrieved data to a file or print it in the same manner as described in the previous section.
Viewing Real-time WaveformsTo retrieve the real-time waveforms from the meter, select a meter site from the list box on the toolbar, and then select 'RT Waveform Monitor' from the 'Monitor' menu.
To run polling waveforms, check the 'On-line' button on the toolbar, and then click on either the 'Single poll' button or 'Continuous poll' button . When in continuous poll, you can stop it by clicking on the 'Stop' button .
By default, Power Software retrieves six 4-cycle waveforms (V1-V3 and I1-I3) sampled at a rate of 128 samples per cycle. If you want to retrieve waveforms only for selected phases, select 'Customize' from the 'Tools' menu, click on the 'Preferences' tab, check phases you want polled, and then click 'OK'.
Retrieved waveforms can be viewed in different windows as overlapped or nonoverlapped waveforms, as RMS cycle-by-cycle plot, or as a harmonic spectrum chart or table. For information on using different waveform views, see “Viewing Log Files” on page 10.
Updating the Clock in Your MetersTo update clock (RTC) in the meter, select a meter site from the list box on the toolbar, check the 'On-line' button on the toolbar, and then select 'RTC ' from the 'Monitor' menu.
The RTC dialog displays the current PC time and the time in the meter. To synchronize the meter clock with the PC time, click 'Set'.
Remote Relay Operations on Your MetersTo perform remote control operations on the relays, or to check their present status, select a meter site from the list box on the toolbar, check the 'On-line' button on the toolbar, and then select 'Remote Control' from the 'Monitor' menu.
The dialog shows you present forced relay status. To force a relay to operate or release, select a command for the relay and click 'Send'.
POWER SOFTWARE CONFIGURATION TOOL
31-00036—01 8
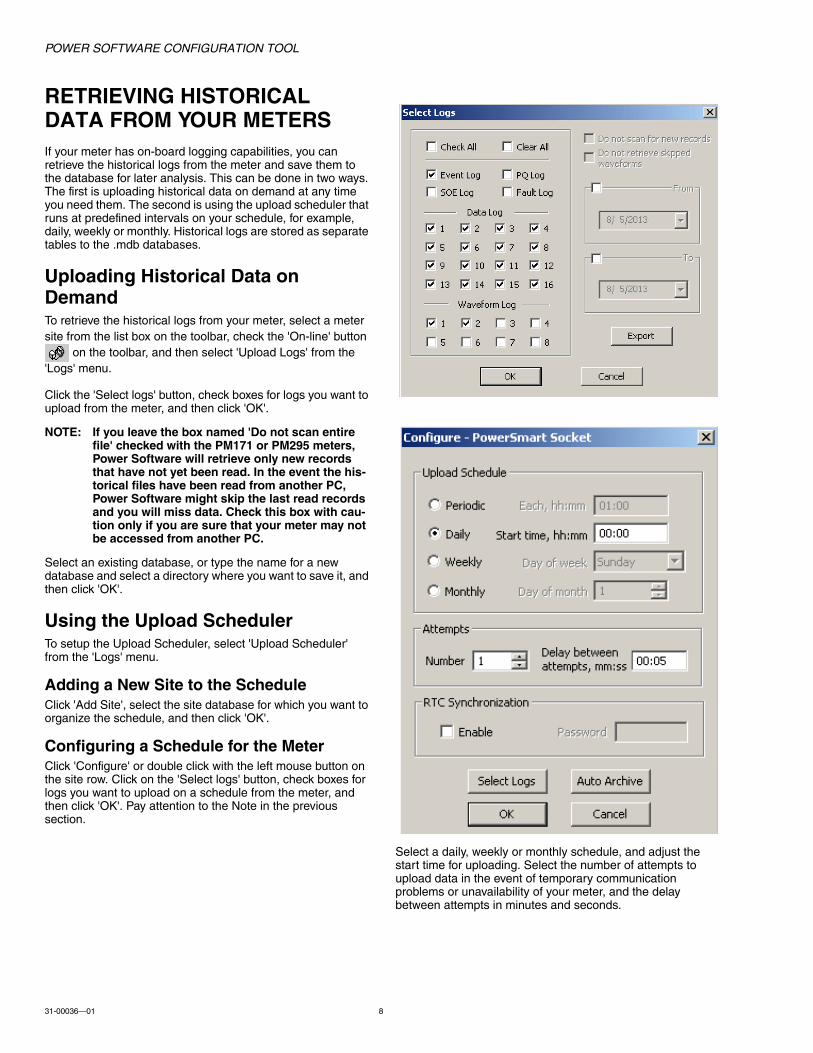
RETRIEVING HISTORICAL DATA FROM YOUR METERSIf your meter has on-board logging capabilities, you can retrieve the historical logs from the meter and save them to the database for later analysis. This can be done in two ways. The first is uploading historical data on demand at any time you need them. The second is using the upload scheduler that runs at predefined intervals on your schedule, for example, daily, weekly or monthly. Historical logs are stored as separate tables to the .mdb databases.
Uploading Historical Data on DemandTo retrieve the historical logs from your meter, select a meter site from the list box on the toolbar, check the 'On-line' button
on the toolbar, and then select 'Upload Logs' from the 'Logs' menu.
Click the 'Select logs' button, check boxes for logs you want to upload from the meter, and then click 'OK'.
NOTE: If you leave the box named 'Do not scan entire file' checked with the PM171 or PM295 meters, Power Software will retrieve only new records that have not yet been read. In the event the his-torical files have been read from another PC, Power Software might skip the last read records and you will miss data. Check this box with cau-tion only if you are sure that your meter may not be accessed from another PC.
Select an existing database, or type the name for a new database and select a directory where you want to save it, and then click 'OK'.
Using the Upload SchedulerTo setup the Upload Scheduler, select 'Upload Scheduler' from the 'Logs' menu.
Adding a New Site to the ScheduleClick 'Add Site', select the site database for which you want to organize the schedule, and then click 'OK'.
Configuring a Schedule for the MeterClick 'Configure' or double click with the left mouse button on the site row. Click on the 'Select logs' button, check boxes for logs you want to upload on a schedule from the meter, and then click 'OK'. Pay attention to the Note in the previous section.
Select a daily, weekly or monthly schedule, and adjust the start time for uploading. Select the number of attempts to upload data in the event of temporary communication problems or unavailability of your meter, and the delay between attempts in minutes and seconds.

POWER SOFTWARE CONFIGURATION TOOL
9 31-00036—01
If you want to use this schedule to synchronize the clock in the meter with the PC time, check the 'RTC Synchronization Enable' box. If your meter is secured by the communications password, type in the password you set in the meter to allow Power Software to update the clock.
After you have configured a schedule for the site, click 'OK'.
Click 'Browse' at right and select an existing database for storing retrieved data, or type the name for a new database and select a directory where you want to save it, and then click 'OK'.
Activating a Schedule for the MeterTo activate a schedule for the meter, check the 'Enabled' box at left on the meter site row.
KEEPING IT RUNNINGTo keep the Upload Scheduler running, the 'On-line' button
on the toolbar must be checked all the time. If you uncheck it, the scheduler will stop operations. This will not cause loss of data, since the scheduler will resume operations when you check this button again.
Suspending the SchedulerTo suspend the Upload Scheduler, check the 'Suspend Scheduler' box at right. To activate the Upload Scheduler, leave this box unchecked.
Running the Scheduler on DemandYou can run the scheduler at any time outside the schedule by checking the 'Start Now' box at right. This is a one-time action. After uploading is completed, the Upload Scheduler will uncheck this box automatically.
Recording Upload ProblemsWhen the Upload Scheduler fails to retrieve data from the meter, or some data is missing, or another problem occurs, it records an error message to the log file. To review this file, select 'Log Window' from the 'View' menu.
Viewing Historical Data On-lineSometimes, it is useful to review a particular historical data on-line at the time you expect the new events to appear in the log. Power Software allows you to retrieve historical data from a particular log without storing it to a file. The data appears only in the window on your screen. If you want, you can save it manually to the database.
To view a historical log on-line, select from the 'Logs' menu the log you want to retrieve, check the 'On-line' button on the toolbar, and then click on the 'Single poll' button . Only new log records will be retrieved from the meter. If you want to review the log from the beginning, click on the 'Restore Log' button on the toolbar, and then click on the 'Single poll' button
.
There is a difference between retrieving waveform logs on-line and viewing waveforms from a file. The waveforms are read one record a time, so that a multirecord waveform series may not be viewed in this mode as a single waveform.
For information on using different log views, “Viewing Log Files” on page 10.
NOTE: If you decide to view historical data on-line, make sure you leave unchecked the box 'Do not scan entire file' in the 'Select Logs' dialog when con-figuring the automatic uploading (see Note in section 'Uploading Historical Data on Demand'); otherwise, you may discover that the last logs are missing from your log files.

POWER SOFTWARE CONFIGURATION TOOL
31-00036—01 10
VIEWING LOG FILESData stored into data files can be viewed on the screen in different formats. You can see how they look on your screen and check different options by opening sample files you received with Power Software. They are located on your disk in the 'Samples' directory under the Power Software installation directory.
Opening a Log Fileo open a log file, click on the 'Open' button at left of the toolbar, or select 'Open...' from the 'File' menu. In the 'Files of type' box, select the type of files you want to view, enter the directory where your files are located and select a file you want to open. If this is an .mdb database, click once on the file name with the mouse to receive the database contents on the right pane, select a desired table from this pane, and then click 'Open'.
The following operations are available in all log views regardless of the particular log you are viewing.
Exporting Data to Another ApplicationYou can copy the entire data table or graph, or part of the data into the Clipboard or into another application such as Microsoft Excel or Word in order to expand your report.
Click with the right mouse button on the data window and choose 'Select All'. If your current view represents a table, click on the upper-left corner of the table (where the 'No.' label is commonly displayed). Click with the right mouse button on the window again and choose 'Copy' or click the 'Copy' button
on the toolbar. Run the application to which you want to copy data, position the cursor at the correct place, and then click the 'Paste' button on the application's toolbar or select 'Paste' from the 'Edit' menu.
Saving Data to a FileTo save data to a file, click on the 'Save' button . Select the type of a file in which you want to keep the data. The choices are commonly the ASCII file with a log-specific extension and the *.mdb database.
Select a directory where you want your log file to be stored. To avoid confusion, do not store data files into the 'Sites' directory where site databases are located.
Select an existing file or type the name for a new file, and then click 'Save'.
Printing Data to a PrinterTo print data to a printer, click the print button on the toolbar, select a printer and click 'OK'. If you want to check how your document appears on the printed page, select 'Print Preview' from the 'File' menu.
Viewing the Event LogEvent log files are displayed in a tabular view, one event per row. Power Software loads the entire log file (or database table) to a window, so that you can scroll through the entire log to view its contents.
Sorting EventsNormally, event records are shown in the order based on the date and time of the event appearance. Power Software can rearrange records in the order based on a cause of the event, and then sort records within each group according to the event time. To change the sorting order, click with the right mouse button on the Event Log window, select 'Sort...', check a desired sort order, and then click 'OK'.
Filtering EventsThe event log usually contains a large amount of records that concern events caused by different sources. You can use filtering to find and work with a subset of events that meet the criteria you specify. Power Software will temporary hide rows you do not want displayed. You can use a filter along with sorting to rearrange filtered records in the desired order.
To filter events, click with the right mouse button on the Event Log window, select 'Filter...', check the causes of events you want to display, and then click 'OK'.
Viewing the Data LogData log files are displayed in a tabular view, one data record per row. Power Software loads the entire data log file (or database table) to a window. There are no any specific controls available for data log views.
POWER SOFTWARE CONFIGURATION TOOL
11 31-00036—01
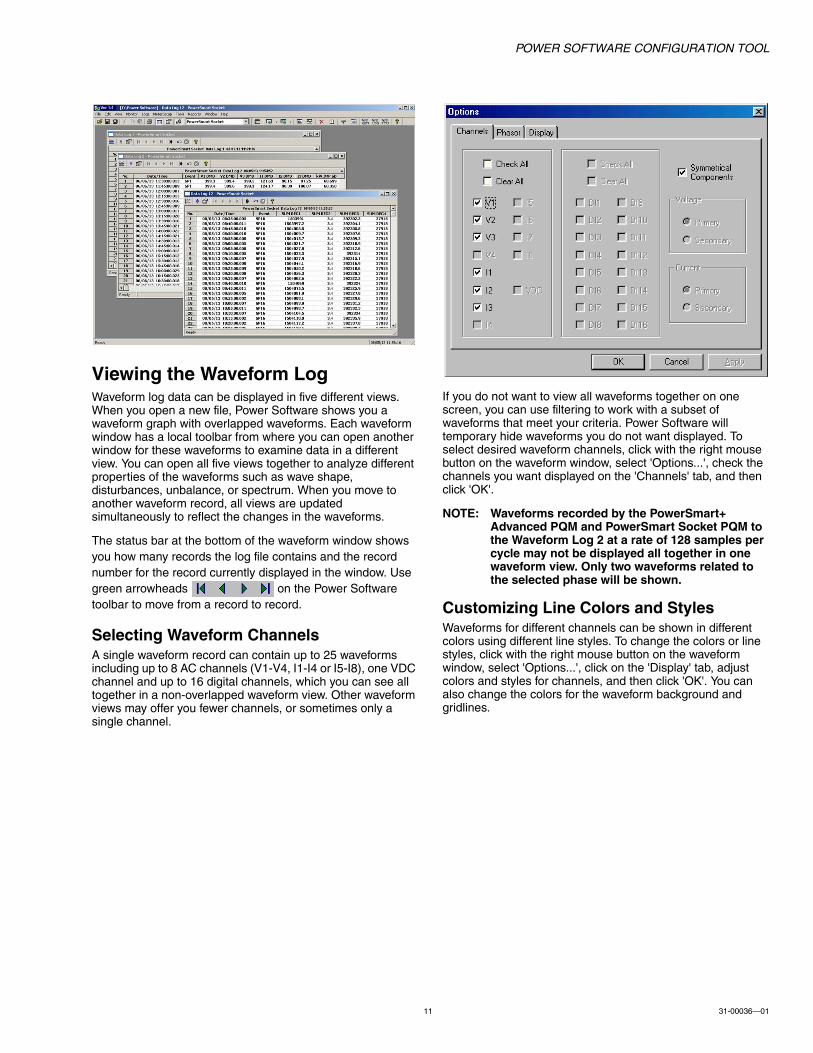
Viewing the Waveform LogWaveform log data can be displayed in five different views. When you open a new file, Power Software shows you a waveform graph with overlapped waveforms. Each waveform window has a local toolbar from where you can open another window for these waveforms to examine data in a different view. You can open all five views together to analyze different properties of the waveforms such as wave shape, disturbances, unbalance, or spectrum. When you move to another waveform record, all views are updated simultaneously to reflect the changes in the waveforms.
The status bar at the bottom of the waveform window shows you how many records the log file contains and the record number for the record currently displayed in the window. Use green arrowheads on the Power Software toolbar to move from a record to record.
Selecting Waveform ChannelsA single waveform record can contain up to 25 waveforms including up to 8 AC channels (V1-V4, I1-I4 or I5-I8), one VDC channel and up to 16 digital channels, which you can see all together in a non-overlapped waveform view. Other waveform views may offer you fewer channels, or sometimes only a single channel.
If you do not want to view all waveforms together on one screen, you can use filtering to work with a subset of waveforms that meet your criteria. Power Software will temporary hide waveforms you do not want displayed. To select desired waveform channels, click with the right mouse button on the waveform window, select 'Options...', check the channels you want displayed on the 'Channels' tab, and then click 'OK'.
NOTE: Waveforms recorded by the PowerSmart+ Advanced PQM and PowerSmart Socket PQM to the Waveform Log 2 at a rate of 128 samples per cycle may not be displayed all together in one waveform view. Only two waveforms related to the selected phase will be shown.
Customizing Line Colors and StylesWaveforms for different channels can be shown in different colors using different line styles. To change the colors or line styles, click with the right mouse button on the waveform window, select 'Options...', click on the 'Display' tab, adjust colors and styles for channels, and then click 'OK'. You can also change the colors for the waveform background and gridlines.

POWER SOFTWARE CONFIGURATION TOOL
31-00036—01 12
Viewing Phasor DiagramsWaveform views have an additional pane at the lower right, where Power Software draws phasor diagrams for displayed waveforms. The phasor diagrams show you the relative magnitude and angle of the fundamental harmonic for the selected voltage and current channels. All angles are taken relative to the reference voltage channel.
To change the reference channel, click with the right mouse button on the waveform window, select 'Options...', click on the 'Phasor' tab, check the channel you want to make a reference channel, and then click 'OK'. If you leave the 'Triangle' box checked, Power Software will connect the ends of the voltage and current vectors by lines showing you tree-phase voltage and current triangles. This may be useful when analyzing voltage and current unbalances.
Phasor diagrams are calculated for one waveform cycle pointed to by the left marker line. As you move the marker, the phasor diagrams are updated reflecting the new marker position.
Viewing Symmetrical ComponentsWaveform views have an additional pane at the right where Power Software can display the symmetrical components for voltages and currents, which are calculated for the point indicated by the left marker line. To enable or disable the symmetrical components, click with the right mouse button on the waveform window, select 'Options...', check or uncheck the symmetrical components on the 'Channels' tab, and then click 'OK'.
Selecting Primary and Secondary UnitsVoltages and currents can be displayed in primary (default) or secondary units. To select primary or secondary units for your waveforms, click with the right mouse button on the waveform window, select 'Options...', select the desired units for voltages and currents on the 'Channels' tab, and then click 'OK'.
NOTE: ASCII waveform files logged by previous releases of Power Software do not contain infor-mation on the secondary voltage or current set in the waveform recorder. These waveforms will always shown in primary units.
Using the Marker LinesWaveform and RMS panes have two blue dashed marker lines. The left marker indicates the position from where data will be taken to calculate the harmonics spectrum and phasor diagrams, and also the starting position for calculating the RMS, average and peak values. The right marker indicates the end position for calculating the RMS, average and peak values. The minimum distance between the two markers is exactly one cycle.
To change the marker position, click with the right mouse button on the waveform window, select 'Set Marker', and then click with left mouse button on the point where you want to put the marker. You can also drag both markers with the mouse, or use the right and left arrow keys on your keyboard to change the marker position. Before using the keyboard, click on the waveform pane with the mouse, to allow the keyboard to get your input.
Using a ZoomYou can use a horizontal and a vertical zoom to change size of your waveforms. Use the buttons on you local toolbar representing green arrowheads to zoom in or out of the waveform graph. Every click on these buttons gives you a 100-percent horizontal or 50-percent vertical zoom. Two buttons representing a magnifying glass give you a proportional zoom in both directions.
When in the overlapped waveform view, you can zoom in on a selected waveform region. Click with the right mouse button on the waveform window, click 'Zoom', point onto one of the corners of the region you want to zoom in, press and hold the left mouse button, then point to another corner of the selected region and release the mouse button.

POWER SOFTWARE CONFIGURATION TOOL
13 31-00036—01
Viewing WaveformsWaveforms can be displayed in two views: overlapped and non-overlapped. To select the first view, click on the button
representing a single waveform on the local toolbar; to select a non-overlapped view, click on the button showing two waveforms.
Waveform data are recorded to files in series that may contain many cycles of the sampled waveforms. A waveform window can display up to 64 waveform cycles. If the waveform contains more than 64 cycles, the scroll bar appears under the waveform pane allowing you to scroll through the entire waveform.
Viewing an RMS PlotPower Software can show you the cycle-by-cycle RMS plot of the sampled AC waveforms. To open the RMS view, click on the button representing two curves above horizontal axes. The RMS view displays the RMS measured over one cycle and updated each half cycle of the sampled waveforms as per IEC 61000-4.
Viewing a Spectrum ChartTo view the spectrum chart for the selected waveform channel, click on the button representing a spectrum graph. The spectrum is calculated over four cycles of the selected waveform beginning from the point where the left marker line is located in the open waveform view. If both waveform views are open, Power Software gives the priority to the overlapped waveform view.
The highest number of the spectrum harmonic that will be calculated is equal to the half sampling rate at which the waveforms were sampled minus one. For example, if the sampling made at a rate of 128 samples per cycle, 63 harmonics are available. With 32 samples per cycle, only 15 harmonics will be calculated, while others will be zeros.

POWER SOFTWARE CONFIGURATION TOOL
31-00036—01 14
Viewing a Spectrum TableTo view the harmonics spectrum in a table view, click on the button on the local toolbar. Power Software allows you to view either a spectrum table for the selected channel, or all
channels (V1-V3 and I1-I3) in a single table. Refer to section 'Selecting Waveform Channels' above for instructions on how to select waveform channels.

POWER SOFTWARE CONFIGURATION TOOL
15 31-00036—01
CUSTOMIZING YOUR VIEWS
Customizing Date FormatTo change the way Power Software displays the date, select 'Customize' from the 'Tools' menu, click on the 'Preferences' tab, select the preferred date order, and then click 'OK'.
Customizing TimestampThe timestamp is normally recorded in the data log files and displayed on the screen at a 1-ms resolution. If you have an application that does not support this format, you can instruct Power Software to drop the milliseconds.
To change the way Power Software records and displays the timestamp, select 'Customize' from the 'Tools' menu, click on the 'Preferences' tab, select the preferred timestamp format, and then click 'OK'.
Selecting Voltage Disturbance UnitsWhen programming a voltage disturbance trigger in your meter, the operate limit for the trigger can be set as a percent of the nominal voltage, in RMS units or in amplitude units.
To change the disturbance units, select 'Customize' from the 'Tools' menu, click on the 'Preferences' tab, select the preferred units, and then click 'OK'.

POWER SOFTWARE CONFIGURATION TOOL
Automation and Control SolutionsHoneywell International Inc.
1985 Douglas Drive North
Golden Valley, MN 55422
customer.honeywell.com
® U.S. Registered Trademark© 2014 Honeywell International Inc.31-00036—01 M.S. 02-14 Printed in United States
By using this Honeywell literature, you agree that Honeywell will have no liability for any damages arising out of your use or modification to, the literature. You will defend and indemnify Honeywell, its affiliates and subsidiaries, from and against any liability, cost, or damages, including attorneys’ fees, arising out of, or resulting from, any modification to the literature by you.