302 - American Society of Mining and Reclamation (ASMR)
29
302 PRIORITIZING ABANDONED URANIUM MINE LAND RECLAMATION USING A GIS MODEL 1 Linda S. DeLay 2 , Susan A. LucasKamat, and James R. Smith Abstract: Abandoned uranium mines left a legacy of probable contamination in New Mexico. The New Mexico Mining and Minerals Division is collaborating with state, federal and tribal agencies to inventory and prioritize the reclamation of abandoned uranium mines. As a pilot project, the New Mexico Abandoned Mine Land Program sampled data from 38 abandoned uranium mine disturbances. Mine attributes, including radiation readings, mine disturbance areas, waste pile volumes, shaft and adit dimensions, cultural features and mine access roads, were collected using Trimble Pro XRS and XH GPS units utilizing a Pathfinder data dictionary. Radiation measurements were collected using Ludlum Model 14-C and Model 19 survey meters. Data of the various mine attributes were integrated into a personal geodatabase. ESRI ArcGIS Spatial Analyst was used to build a model to prioritize the 38 abandoned uranium mines for remedial action. Mines were ranked by potential risk exposure to populations. Model inputs included the mine locations and proximity to dwellings, domestic wells and watercourses, density of mine openings and presence of high radiation readings. Thirty-five percent of the sites were less than 1.2 kilometers (0.7 miles) from a domestic well and less than 16 meters (52.5 feet) from watercourses. Sixteen percent were within 8 kilometers (5 miles) of a densely populated area; two sites were surrounded by dwellings. ESRI ArcGIS Spatial Analyst was used to reanalyze the model with additional data for 108 abandoned uranium mine disturbances. Changes in priority ranking of mine sites are examined and discussed. Additional Key Words: geodatabase, ArcGIS, Spatial Analyst, model _______________________________ 1 Poster was presented at the 2009 National Meeting of the American Society of Mining and Reclamation, Billings, MT, Revitalizing the Environment: Proven Solutions and Innovative Approaches May 30 – June 5, 2009. R.I. Barnhisel (Ed.) Published by ASMR, 3134 Montavesta Rd., Lexington, KY 40502. 2 Linda S. DeLay is a GIS Analyst Specialist, Coal Mine Reclamation Program, New Mexico Mining and Minerals Division, 1220 S. St. Francis Dr., Santa Fe, NM 87505, Susan A. LucasKamat is a Geologist, Mine Registration Program, New Mexico Mining and Minerals Division, James R. Smith is a Reclamation Designer, Abandoned Mine Land Program, New Mexico Mining and Minerals Division. Proceedings America Society of Mining and Reclamation, 2009 pp 302-330 DOI: 10.21000/JASMR09010302
Transcript of 302 - American Society of Mining and Reclamation (ASMR)

302
PRIORITIZING ABANDONED URANIUM MINE LAND RECLAMATION
USING A GIS MODEL1
Linda S. DeLay2, Susan A. LucasKamat, and James R. Smith
Abstract: Abandoned uranium mines left a legacy of probable contamination in
New Mexico. The New Mexico Mining and Minerals Division is collaborating
with state, federal and tribal agencies to inventory and prioritize the reclamation
of abandoned uranium mines. As a pilot project, the New Mexico Abandoned
Mine Land Program sampled data from 38 abandoned uranium mine disturbances.
Mine attributes, including radiation readings, mine disturbance areas, waste pile
volumes, shaft and adit dimensions, cultural features and mine access roads, were
collected using Trimble Pro XRS and XH GPS units utilizing a Pathfinder data
dictionary. Radiation measurements were collected using Ludlum Model 14-C
and Model 19 survey meters. Data of the various mine attributes were integrated
into a personal geodatabase.
ESRI ArcGIS Spatial Analyst was used to build a model to prioritize the 38
abandoned uranium mines for remedial action. Mines were ranked by potential
risk exposure to populations. Model inputs included the mine locations and
proximity to dwellings, domestic wells and watercourses, density of mine
openings and presence of high radiation readings. Thirty-five percent of the sites
were less than 1.2 kilometers (0.7 miles) from a domestic well and less than
16 meters (52.5 feet) from watercourses. Sixteen percent were within 8
kilometers (5 miles) of a densely populated area; two sites were surrounded by
dwellings.
ESRI ArcGIS Spatial Analyst was used to reanalyze the model with additional
data for 108 abandoned uranium mine disturbances. Changes in priority ranking
of mine sites are examined and discussed.
Additional Key Words: geodatabase, ArcGIS, Spatial Analyst, model
_______________________________
1 Poster was presented at the 2009 National Meeting of the American Society of Mining and
Reclamation, Billings, MT, Revitalizing the Environment: Proven Solutions and Innovative
Approaches May 30 – June 5, 2009. R.I. Barnhisel (Ed.) Published by ASMR, 3134
Montavesta Rd., Lexington, KY 40502. 2 Linda S. DeLay is a GIS Analyst Specialist, Coal Mine Reclamation Program, New Mexico
Mining and Minerals Division, 1220 S. St. Francis Dr., Santa Fe, NM 87505, Susan A.
LucasKamat is a Geologist, Mine Registration Program, New Mexico Mining and Minerals
Division, James R. Smith is a Reclamation Designer, Abandoned Mine Land Program, New
Mexico Mining and Minerals Division.
Proceedings America Society of Mining and Reclamation, 2009 pp 302-330
DOI: 10.21000/JASMR09010302
rbarn
Typewritten Text
http://dx.doi.org/10.21000/JASMR09010302

303
Introduction
Over 333 million pounds of uranium yellow cake (U3O8) was mined in New Mexico on
private, state, federal, and Indian lands from 1940 to 2002 (McLemore, 2007a; Mine Registration
Program, 1989-2002). Most of the production was from the Grants uranium (U) district in
McKinley and Cibola (formerly Valencia) counties. These two counties produced more U than
any other district in the United States during the period of 1951 to 1980 (McLemore, 2007a).
Mines ranged in size from small dog holes and surface mines, with one to three workers, to large
underground operations, employing hundreds of miners. Uranium ore was last mined in New
Mexico in January 1990; U production continued via mine water recovery and ion exchange
processing until December 2002 (Mine Registration Program, 1989-2008).
The abandoned U mines left a legacy of radiological contamination throughout New Mexico.
Mining activities, such as the discharge of mine water, the use of unlined containment ponds, and
the crushing and transportation of ore, dispersed contamination. With the recent renewed
interest in U exploration and mining in New Mexico, there has been a push from the public to
clean up the legacy of past U mining practices. A systematic analysis of the former U mining
sites is required to prioritize the abandoned U mines by potential or existing environmental harm.
Abandoned U mines include all U mines that have been deserted and are no longer maintained,
or are inactive.
Purpose
The New Mexico Mining and Minerals Division (MMD) is collaborating with state, federal,
and tribal agencies to survey, prioritize, and clean up the abandoned U sites. The purpose of the
New Mexico Abandoned Uranium Mine (AUM) Inventory Project is to ascertain the extent and
magnitude of the occurrence of abandoned U mines in New Mexico, especially those mines that
have not been previously addressed by a tribal, federal, or state entity. The AUM inventory is a
database of information on mine location, reclamation status, mining history, physical and
radiological hazards, and production history. A goal of the inventory is to determine the
appropriate means and remedy for rendering these sites safe to humans and returning the sites to
beneficial use, including, but not limited to, a self sustaining ecosystem. The AUM inventory
project was initiated in December 2006.
The AUM Prioritization Model is an attempt to create a spatial analysis model that represents
and quantifies possible impacts of abandoned U mines for decision-makers to use in the

304
reclamation and remediation planning process. The analytical and visual capabilities of
geographic information systems (GIS) can be a useful tool in qualifying and quantifying spatial
relationships for determining the priorities in addressing which abandoned U mines should be
reclaimed first. The model described in this paper is a pilot project and is in the test phase. The
model will not be finalized without further analysis and review, including consultation with
appropriate agencies and tribal governments.
Methodology
Abandoned Uranium Mine Inventory Geodatabase
The Mining and Minerals Division created the abandoned U mine inventory as a collection of
tabular data of geographic locations (latitude and longitude, UTM, and Public Land Survey
System), mining methods, mining features, mining history, surface and mineral ownership,
production statistics, approximate disturbance areas, reclamation activities, radiological hazards,
post-mining land use, and regulatory/jurisdictional agencies. The first step in creating the
database was to define a U mine. The definition of U mine has two extremes: 1.) a property with
verifiable U production, or 2.) any prospect, exploration project or a property that was developed
to produce U. Verifiable U production at mines created extensive surface disturbances that
increased potential exposure and risk to human health. Development projects and prospect
properties did not create extensive surface disturbances. Therefore, only mines that have
verifiable U production are included in the AUM inventory.
To create the AUM inventory, MMD started with the two New Mexico Bureau of Geology
and Mineral Resources publications: “Database of the U mines, prospects, occurrences, and
mills in New Mexico” (McLemore, 2007b; McLemore, et. al., 2002) and “Uranium mines and
deposits in the Grants district” (McLemore and Chenoweth, 1992). This database was created
for use in U resource analysis on a section and quarter-section basis. According to McLemore
(2007b), there are 1,534 occurrences, prospects, deposits, and mines in New Mexico that have U
mineralization, exploration or production associated with them. Of those 1,534 records,
approximately 330 occurrences have verifiable U production and 466 disturbances have no
verifiable production. The database records were analyzed and combined to create one
abandoned U mine per shaft/pit complex. The Mining and Minerals Division identified 259
AUMs (Fig. 1) with verifiable production.

305
Figure 1. Distribution of abandoned uranium mines in New Mexico.
The tabular records were supplemented with details from mining company registrations and
field investigation reports. The New Mexico State Mine Inspector has mining company
registrations for U mines that operated from the 1950’s to 1980’s (State Mine Inspector, 1954-
1980). The primary source for field data is the 1981 AUM survey (Anderson, 1981). The
Bureau of Land Management (BLM) completed field investigations of selected U mines on

306
federal lands in the 1980’s and 2000’s (Schuster, 1985; BLM, 1987; BLM, 2002). Cultural
resources reports and project files from past New Mexico Abandoned Mine Land Program
construction projects were also used as references (Fuller, 1989; Drake and Fuller, 1990;
Abandoned Mine Land Program, 1981-2008a).
Starting in July 2007, mine feature attributes were collected during field visits to the
abandoned mine sites by both MMD staff and contractors (Abandoned Mine Land Program,
1981-2008b; Souder, Miller & Associates, 2008). Mine feature attributes (Fig. 2), including
radiation readings, mine disturbance areas, waste pile volumes, shaft and adit dimensions, roads,
and cultural features, were collected using Trimble Pro XRS and GeoExplorer XH GPS units
utilizing Pathfinder data dictionaries (Fig. 3). Radiation measurements were collected at both
ground contact and at 1 meter height using Ludlum Model 14-C and Model 19 survey meters and
recorded using the GPS units.
Figure 2. Example of field data collected for each AUM disturbance.
307
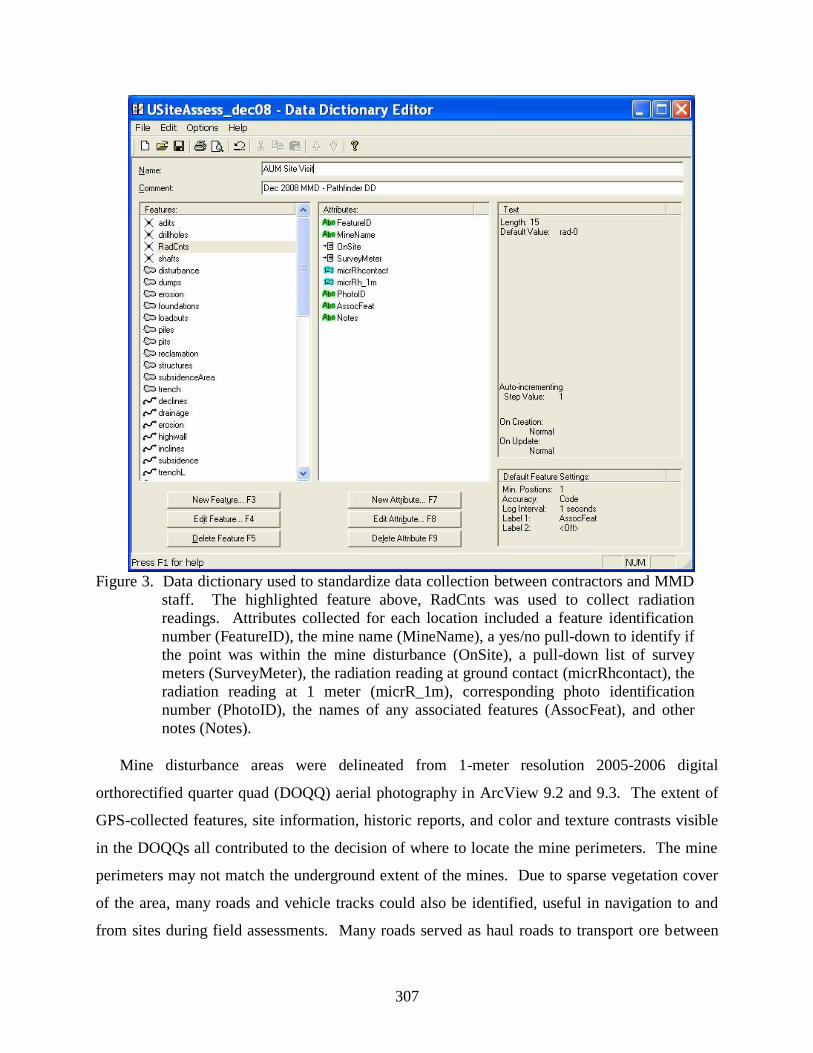
Figure 3. Data dictionary used to standardize data collection between contractors and MMD
staff. The highlighted feature above, RadCnts was used to collect radiation
readings. Attributes collected for each location included a feature identification
number (FeatureID), the mine name (MineName), a yes/no pull-down to identify if
the point was within the mine disturbance (OnSite), a pull-down list of survey
meters (SurveyMeter), the radiation reading at ground contact (micrRhcontact), the
radiation reading at 1 meter (micrR_1m), corresponding photo identification
number (PhotoID), the names of any associated features (AssocFeat), and other
notes (Notes).
Mine disturbance areas were delineated from 1-meter resolution 2005-2006 digital
orthorectified quarter quad (DOQQ) aerial photography in ArcView 9.2 and 9.3. The extent of
GPS-collected features, site information, historic reports, and color and texture contrasts visible
in the DOQQs all contributed to the decision of where to locate the mine perimeters. The mine
perimeters may not match the underground extent of the mines. Due to sparse vegetation cover
of the area, many roads and vehicle tracks could also be identified, useful in navigation to and
from sites during field assessments. Many roads served as haul roads to transport ore between

308
the U mines and mills. The road data provides additional information on the possible extent of
mine disturbances and possible contamination pathways.
The GPS data (features and feature attributes) collected over a period of several months were
converted into feature classes within an ESRI personal geodatabase. Digitized information,
supplementary field note data, and hyperlinks to digital photos were standardized and integrated
using ESRI ArcInfo 9.2 and 9.3 software. Shapefiles were converted to feature classes within an
ESRI geodatabase. The geodatabase offers many advantages over shapefiles by providing better
organization, attribute management, geometry editing and analysis capabilities.
Prioritization Model
The goal was to prioritize AUM sites based on several variables that could represent possible
impacts to human and ecological health through exposure to U waste. Field survey data from 38
AUM disturbances (Fig. 4) were analyzed as a ranking pilot project to study how the AUMs
could be prioritized. Because AUMs are distributed throughout the state, the analysis and
priority model were run on the state as a whole and on specific watersheds.
After the initial pilot analysis, we reanalyzed the GIS priority model with an additional 70
AUM sites (Fig. 5). We were interested in discovering which AUM sites would be classified as
high and low priorities. At this time, there are no radiation measurements available for the
additional 70 mines; therefore, the second model was run on the superset disturbances (n=108)
without the radiation reading variable. The analyses involved 90 watershed sub-basins (HUC
12-digit).
Each mine was scored according to measurements of five separate variables: the number of
open / unsafeguarded mine hazards, radiation readings (R/hour) at 1 meter distance from the
ground, the distance to nearest well, the distance to and spatial clustering of the nearest drainage,
and the proximity, number and spatial clustering of dwellings within a 5-mile radius of each
mine site (Fig. 6). The scores from the five variables were combined for each mine. Priority
was based on the ranking of the scores for each mine site. The largest score was ranked the
highest in priority and given a ranking of one. The second largest score was given a rank of two;
the third, three. Ranks were assigned to all scores so that the lowest score had the highest rank.
Ranks were assigned to a priority based on natural breaks in the scores. Priorities were classified
into 4 groups: high (1), medium (2), medium-low (3) and low (4). Spatial Analyst in ArcInfo
9.2 and 9.3 was used to calculate statistics and metrics.

309
Figure 4. Thirty-eight abandoned uranium mines in New Mexico with radiation readings
included in the ranking pilot study.

310
Figure 5. One hundred eight abandoned uranium mines in New Mexico in the expanded data
set. Radiation readings were not included in the superset analysis.

311
Figure 6: Abandoned uranium mine prioritization model schematic.
Open hazards. Open hazards at the mine sites include adits, shafts, inclines, pits, and trenches
that are open and may present a physical hazard to people passing through the sites. The scores
are based on the total number of open unsafeguarded hazards at each site; ten points were
assigned per unsafeguarded feature (Fig. 7). The number of open hazards was based on
observations of open features found during survey work and features that were recorded in
project files and past survey reports. The cultural resources reports (Fuller, 1989; Drake and
Fuller, 1990), Anderson (1981), and Abandoned Mine Land Program project files were used to
locate features that had been reclaimed, that were still visible or that required safeguarding at a
future date.
Radiation readings. Radiation readings within the mine boundaries were selected using the
ArcInfo Intersect tool. This prevented background readings of off-site areas from being
weighted in the analysis. ArcInfo’s spatial analyst tool for descriptive statistics supplied a table
of statistics. Preliminary sampling of general mine disturbances, waste piles, mine openings
(shafts, adits, holes and wells), and mine access roads at AUM sites in the San Mateo Creek
watershed (n=15) shows a wide range of radiation values at ground contact (Table 1). The
average background radiation reading was 18.8 R/hr (n = 5).

312
Figure 7. Method used to calculate open hazard priority. The rank of open
hazards range between 1 and 6. Natural breaks in the data were used
to classify these values into 4 priority groups.
Table 1. Radiation readings at ground contact (R/h) at 15 mine sites.
Feature General Mine
Disturbance
Waste
Piles
Shaft, Adit
or Well
Mine
Road
Sample size (n) 5 47 10 9
Average (R/h) 297.8 387.7 197.0 159.5
Range (R/h) 17 to 457 32 to 2857 21 to 486 26 to 400
The preliminary sampling ranges were used to set scoring ranges for radiation readings
(Fig. 8 and Table 2). Scores were applied to sites based on the maximum radiation value.
Readings above 450 R/hr were labeled “hotspots” and given an added weighted value. The
radiation scores were an attempt to classify the AUMs for the purposes of the priority model.
They are not an established or cited standard by regulatory agencies.

313
Figure 8. Method used to calculate radiation reading priority. The rank of
radiation readings ranged between 1 and 7. Geometric intervals in the
data were used to classify these values into 4 priority groups.
Table 2. Scores applied to radiation readings.
Radiation reading (R/hr) Description Score
< 15 Background 0
15 – 20 Background to Low 10
20 – 100 Low to Moderate 20
100 – 300 Moderate 30
300 – 450 Moderate to High 40
> 450 High Additional weight
Well locations. Proximity of each AUM to wells is a possible contamination pathway and
represents a possible risk to drinking water. Well locations were queried from the New Mexico
Office of the State Engineer’s database (iWaters database, 2008). Depth to water is not available
for all wells. Wells are classified in the iWaters database by their end-use. Examples of those
classifications include, but are not limited to, public utility, domestic, multi-residence,
mining/milling, industrial, livestock, irrigation, sanitation, and recreation. The Spatial Analyst

314
Near tool was used to calculate the perpendicular distance from the centroid of the mine
boundary to the nearest well location (Fig. 9). Physical distances between mines were compared.
Based on the distance, a score of 40, 30, 20, or 10 was assigned to each mine, where near
distances were given the larger score.
Figure 9: Method used to calculate proximity to wells priority. The rank of
distance to nearest ranged between 1 and 6. Natural breaks in the
data were used to classify these values into 4 priority groups.
For the first ranking pilot study of the 38 disturbances only domestic wells were queried from
the iWaters database and used in the first pilot study analysis. The second analysis of the 108
AUM disturbances in the data superset used a larger set of wells that included multi-residence,
community system, agricultural, and livestock related water wells.
Drainages. Proximity of each AUM site to the nearest drainage (streams, arroyos, or erosion
features) also could represent a possible contamination pathway for drinking water supplies. The
National Hydrographic Dataset (United States Geologic Survey) was used to locate streams and
rivers in New Mexico. The layer was supplemented by digitizing additional drainages
(predominantly arroyos) observed in the 1-meter resolution aerial photography. Erosion features

315
collected with GPS were merged with the polylines from the hydrographic dataset and digitized
drainages. The distance between the mine disturbance polygons and the drainage polylines
cannot be measured with ArcGIS 9.2 calculation tools, therefore we created points along the
polygon perimeter from which to measure proximity. Xtools was used to create a point shapefile
of the mine perimeter polygon: every 30 meters along the mine disturbance perimeter a point
was created. These points were used in the proximity calculations using the ArcGIS Near tool.
The resulting values were analyzed with the Statistical Summary tool. Scores of 10, 20, 30, or
40 were assigned to each AUM based on the calculated minimum distance of the mine boundary
perimeter points to the nearest drainage polyline.
Preliminary sampling of 15 AUM mine disturbances in the Ambrosia Lake region shows that
5 of the sites are within 8.5 to 68 meters (27.9 to and 223.1 feet ) of a major drainage and all are
within 471 meters (0.3 miles) of a drainage (Figure 10). Since one or more drainages can
surround a mine, a separate field was created to hold scores indicating the measure of spatial
clustering. This field adds additional points to a site’s score. A mine gets a higher score,
indicating a higher probability of possible contamination risk, if it is close to multiple drainages
and / or surrounded by a drainage. Spatial clustering of drainage around a mine disturbance was
measured by creating a pie feature with eight slices. The pie shapefile center was placed on the
mine polygon center. The pie has a 1.5-miles radius to reflect average distances to nearest
drainages. Each pie slice that intersected a drainage was assigned an additional 5-point score. A
spatial clustering score of forty meant that the mine was completely surrounded by drainage
(Fig. 11).

316
Figure 10. Method used to calculate proximity to the nearest drainage
priority. Preliminary sampling (n=15) of distance of
abandoned uranium mine to the nearest major stream.
Figure 11: Method used to calculate spatial clustering of the nearest drainage
priority. Drainages occur in three pie slices around the mine. The
rank of spatial clustering ranged between 1 and 6. Natural breaks in
the data were used to classify these values into 4 priority groups.

317
Dwellings. Proximity of abandoned U mines to dwellings and populated areas may increase the
probability that people may visit or travel through the sites and be exposed to mine site waste
products and contamination. Wind-blown materials from the sites are also likely to affect
populations in close proximity. The 2005-2006 DOQQ aerial photos were used to detect
dwellings and more densely populated areas within a 5-mile radius of each mine disturbance. A
feature class was created based on the 5-mile buffered distance from the mine site centers. This
was the search extent for image interpretation of dwellings. A feature class was created of all the
single dwellings (houses, hogans, trailer homes, and general buildings) and a polygon file was
created of groups of dwellings (any cluster of approximately 10 or more dwellings). One point
represented any cluster of buildings related to a ranch complex. Points were assigned for each
dwelling/populated area that fell within the 5-mile buffer (Fig. 12). The count of single
dwellings was summed for each AUM with the use of the Spatial Join Analysis Tool.
Figure 12: Method used to calculate the proximity, number and spatial clustering
of dwellings priority. The 5-mile buffer is used to score proximity and
density of population. The 1.5-mile radius buffer is used to score
spatial clustering. The rank of dwellings measurements ranged
between 1 and 6. Natural breaks in the data were used to classify these
values into 4 priority groups.

318
The distance from each AUM center to densely populated areas and the percent of the search
area that those populated areas covered was also calculated and included in the scoring. A
separate field was created to hold scores that indicate the measure of spatial clustering of
dwellings around each mine site. Again, the 1.5-mile radius 8-piece pie was used to measure the
spatial clustering.
Final priority. Each variable’s table was joined (tabular join) to the mine boundary shapefile for
classification and for map layout display. The Calculator tool in the ArcInfo was used to
combine the scores. Ranks for the combined scores were assigned and added to the mine
boundary shapefile. Priority was assigned based on a range of values. Priority ranges were
based on Jenks natural breaks or geometric intervals in the continuous data, with some subjective
score assignments based on high or low end values. Data distributions were viewed in ArcInfo
and used in the scoring decisions. Ties were also used in scoring. The priority values were
appended to the mine boundary feature class so that maps of the resulting priority for each of the
five variables and final score could be created.
Results and Conclusions
Of the 38 pilot study AUMs, thirty-five percent of the sites were less than 1.2 kilometers (0.7
miles) from a domestic well and less than 16 meters (52.5 feet) from watercourses. Sixteen
percent were within 8 kilometers (5.0 miles) of a densely populated area; and 2 sites were
surrounded by dwellings. Seventeen of the 38 AUMS in the pilot project are located in the
Ambrosia Lake Mining District in the San Mateo Creek watershed, a tributary of Rio Grande
(Fig. 13). Figures 14 through 18 illustrate the changes in ranking depending on the individual
variable mapped. Figure 19 is a map of final priority ranking that reflects the sum of all variable
scores.

319
Figure 13. San Mateo Creek watershed includes 17 of the 38 mines included
in the pilot study.
Figure 14. Priority ranking of abandoned uranium mines in the San Mateo Creek
watershed based on the number of open hazards.

320
Figure 15. Priority ranking of abandoned uranium mines in the San Mateo Creek
watershed based on scores radiation readings (R/hr) at 1 meter.
Figure 16. Priority ranking of abandoned uranium mines in the San Mateo Creek
watershed based on distance to nearest domestic well.

321
Figure 17. Priority ranking of abandoned uranium mines in the San Mateo Creek
watershed based on distance to and spatial clustering of the nearest drainage.
Figure 18. Priority ranking of abandoned uranium mines in the San Mateo Creek
watershed based on proximity, number and spatial clustering of
dwellings within a 5-mile radius.

322
Figure 19. Final priority ranking of abandoned uranium mines (n=38) in the San
Mateo Creek watershed.
In the San Mateo Creek watershed, the Dog, Moe No. 4, and Barbara J No. 3 mines all rank
high-priority in the pilot study. The second analysis of the expanded superset set of AUMs
(n=108) within the San Mateo Creek watershed shows these three mines move to a medium-high
priority. Three different sites, not included in the first model, are a high priority in the second
model: the Section 25 open pit, Section 25 decline, and Haystack Section 31 mines (Fig. 20).
The Flea, Mesa Top, Barbara J No. 1, Barbara J No. 2, Barbara J No. 3a, Piedra Trieste, T-20,
and Flat Top mines are medium-high priority in both models. The Blue Peak and Malpais mines
moved from medium-low rank in the first model to medium-high rank in the second model. The
Beacon Hill-Gossett, Beacon Hill, Davenport, and Red Bluff No. 1 mines all maintained a
medium-low priority in both models. The absence of radiation readings and inclusion of
additional wells in the second model caused the changes in priority.

323
Figure 20. Final priority ranking of abandoned uranium mines (n=108) in the San
Mateo Creek watershed.
Figure 21 displays a comparison of two high priority mines (Floyd Collins and Diamond No.
2) based on the sum of all five variables of the pilot model (n=38). The Floyd Collins mine,
located in the Cow Spring Draw watershed, ranks high in the variables of open mine hazards and
nearness to domestic wells. It also ranks moderately high in containing maximum radiation
readings and proximity to dwellings and drainage. The map for the second model (n=108) shows
that all the mines found within close proximity of each other in the Cow Spring Draw watershed
are also high-priority sites (Fig. 22).

324
Figure 21. Two mine sites scoring high priority for all model variables in the
pilot study (n=38). The Floyd Collins is located southwest of Silver
City; the Diamond No. 2 is located southeast of Gallup.
Figure 22. Two regions with high priority in terms of all model variables
combined using the expanded superset data (n=108).

325
The Diamond No. 2 and Floyd Collins mines are both high priority reclamation candidates
(total scores) based on both of our analyses. Floyd Collins retained the higher overall scores in
both analyses, though variables in the models contributed differently to the ranking. All
variables contributing to the total priority rank for Floyd Collins were moderate high to high.
Two variables, the proximity to dwellings and the number of open hazards, were high ranking
for the Diamond No. 2 Mine. If we only examine the proximity to dwellings, the Diamond No. 2
Mine gets a higher score. Close proximity to high density dwellings contributed the most to its
score. If we decide that close proximity and clustering of single dwellings is of more concern,
we could give more weight to that aspect in the model, and the Floyd Collins would gain a
higher score than that of Diamond No. 2.
The consistency of priority results was examined for each variable of the final high- and low-
priority sites among the 108 abandoned U mine disturbances. We specifically wanted to
investigate two trends: 1.) the high-priority mine sites that consistently ranked high among all
four variables, and 2.) the low-priority mine sites that maintained their low-priority status for all
four variables. A matrix of high- and low-priority status may help to narrow the list of potential
reclamation candidates (Tables 3 and 4). Twenty-three percent of the 22 top-ranking mines
(ranks 1 to 9) maintained a high-priority rank in terms of the number of open hazards. Seventy-
seven percent of high-priority AUMs maintained their status when examining proximity to wells,
and 50% of the sites maintained high-priority status when examining their proximity to drainages
or dwellings. From this analysis, the proximity of abandoned U mines to wells appears to have
more influence in determining a high-priority site. If a decision was made that a mine site should
be consistent in their status in two or more of the four variables to be considered a candidate for
reclamation, then the list would decrease from 22 to 18. Using the same criteria of consistent
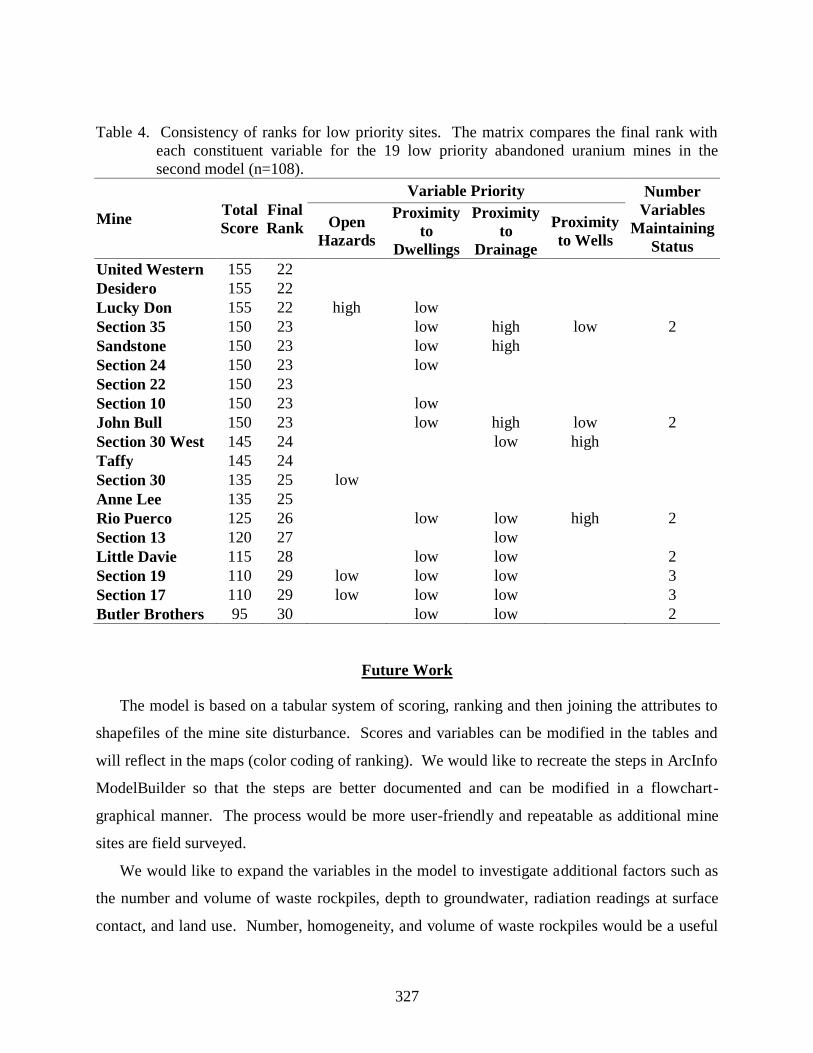
status for the low-priority sites (ranks 22 to 30), the list would decrease from 19 to 7. The low-
priority candidates overall remained low priority depending on the variable. At most, 16 percent
of the 19 low-priority sites jumped to a high priority status based on their proximity to drainage;
11 percent jumped based on proximity to wells; and 6 percent based on number of open hazards.

326
Table 3. Consistency of ranks for high priority sites. The matrix compares the final rank with
each constituent variable for the 22 high priority abandoned uranium mines in the
second model (n=108).
Mine Total
Score
Final
Rank
Variable Priority Number
Variables
Maintaining
Status
Open
Hazards
Proximity
to
Dwellings
Proximity
to
Drainage
Proximity
to Wells
Floyd Collins 265 1 high high high 3
Billy the Kid 260 2 high high 2
Merry Widow 250 3 high high high 3
F33 250 3 low high high 2
Mount Taylor 245 4 high high 2
Blackhawk Bunney 240 5 high high high 3
Diamond No. 2 240 5 high high low 2
Eugenie 235 6 high high 2
Maddox & Teague 230 7 high high 2
Section 25 Open
Pit 230 7 high high 2
Section 18 225 8 high high low 2
Inez 225 8 high 1
Zia 225 8 high 1
Haystack Section
31 220 9 high high 2
San Mateo Mine 220 9 high high 2
Tom 220 9 low high high 2
Section 9 220 9 high high 2
Section 25 Decline 220 9 high high 2
Cedar 220 9 high high low high 3
Glover 220 9 high low high 2
Yucca 220 9 high 1
Silver Bit 220 9 high 1
327
Table 4. Consistency of ranks for low priority sites. The matrix compares the final rank with
each constituent variable for the 19 low priority abandoned uranium mines in the
second model (n=108).
Mine Total
Score
Final
Rank
Variable Priority Number
Variables
Maintaining
Status
Open
Hazards
Proximity
to
Dwellings
Proximity
to
Drainage
Proximity
to Wells
United Western 155 22
Desidero 155 22
Lucky Don 155 22 high low
Section 35 150 23 low high low 2
Sandstone 150 23 low high
Section 24 150 23 low
Section 22 150 23
Section 10 150 23 low
John Bull 150 23 low high low 2
Section 30 West 145 24 low high
Taffy 145 24
Section 30 135 25 low
Anne Lee 135 25
Rio Puerco 125 26 low low high 2
Section 13 120 27 low
Little Davie 115 28 low low 2
Section 19 110 29 low low low 3
Section 17 110 29 low low low 3
Butler Brothers 95 30 low low 2
Future Work
The model is based on a tabular system of scoring, ranking and then joining the attributes to
shapefiles of the mine site disturbance. Scores and variables can be modified in the tables and
will reflect in the maps (color coding of ranking). We would like to recreate the steps in ArcInfo
ModelBuilder so that the steps are better documented and can be modified in a flowchart-
graphical manner. The process would be more user-friendly and repeatable as additional mine
sites are field surveyed.
We would like to expand the variables in the model to investigate additional factors such as
the number and volume of waste rockpiles, depth to groundwater, radiation readings at surface
contact, and land use. Number, homogeneity, and volume of waste rockpiles would be a useful
328
variable to quantify radiological hazards for a mine site. Depth to groundwater would allow
modeling of potential pathways for ground water contamination. Land use could be used to
determine risk exposures to open hazards and radiological hazards. And surface / ground contact
radiation readings can be calibrated to radiological soil activity.
After the AUM site ranking priorities have been assigned based on the model variables, we
would like to investigate and include the variables of site accessibility, land ownership, and
geographic proximity. For example, the cost of staging a reclamation project, moving equipment
into place, and gaining site access are important to consider in reclamation cost estimations.
With limited funding, costing factors are important variables in the AUM reclamation priorities.
Between both models runs, six AUMs are ranked high priority in the San Mateo Creek
watershed. Because the six mines are close in proximity to each other, it may be more cost
effective to work on them together and then move on to the next high-priority site. It may also
be more cost effective to mobilize equipment to reclaim the San Mateo watershed AUMs before
addressing the Floyd Collins mine, which ranks as a high priorities but is geographically isolated
in relation to other AUMs in the state. If the cost and efficiency of moving equipment is not a
high priority, it may be better to travel around the state and reclaim only the mines ranking high
priority, then medium-high, etc. There also may be more motivation to reclaim areas that are the
closest to, or are surrounded by, populations and dwellings, regardless of their priority ranking
system. While modeling costs is difficult due to the complexities of bid and contract documents,
we could model a cost risk factor to identify mines or reclamation projects with high risks
associated with costs.
Acknowledgements
We would like to thank the Navajo Abandoned Mine Land Reclamation Department for
sponsoring several training sessions on health physics, radiation meter calibration and radiation
meter field practice.
We would like to thank Rio Algom Mining LLC and Schmidtt Ranch for allowing us access
through their Ambrosia Lake properties.
Literature Cited
Abandoned Mine Land Program. 1981-2008a. Hyde/Wingate, Wingate Hogback, Grants
Uranium Phases I to III, San Mateo Mine project files. New Mexico Energy. Minerals and
Natural Resources Department, Mining and Minerals Division, Santa Fe, New Mexico.

329
Abandoned Mine Land Program. 1981-2008b. Reconnaissance files. New Mexico Energy.
Minerals and Natural Resources Department, Mining and Minerals Division, Santa Fe, New
Mexico.
Anderson, O.J. 1981. Abandoned or inactive uranium mines in New Mexico. New Mexico
Bureau of Mines and Mineral Resources. Open-File Report 148. Socorro, New Mexico
Bureau of Land Management. 1987. Uranium mine inventory inspections. United States
Department of the Interior, Bureau of Land Management, New Mexico Office. Santa Fe,
New Mexico.
Bureau of Land Management. 2002. Mining claim site inspections. United States Department
of the Interior, Bureau of Land Management, New Mexico Office. Santa Fe, New Mexico
Drake, L. M. and K. H. Fuller. 1990. A cultural resource inventory of eight uranium mines near
Grants, New Mexico. Submitted by Y. R. Oakes. Laboratory of Anthropology Notes No.
511. Santa Fe, New Mexico
Fuller, K. H. 1989. An archaeological survey of six uranium mines near Grants, New Mexico.
Submitted by Y. R. Oakes. Laboratory of Anthropology Notes No. 488. Santa Fe, New
Mexico.
McLemore, V. T., K. Donahue, C. B. Krueger, A. Rowe, L. Ulbricht, M. J. Jackson, M. R.
Breese, G. Jones, and M. Wilks. 2002. Database of the uranium mines, prospects,
occurrences, and mills in New Mexico. New Mexico Bureau of Geology and Mineral
Resources. Open file Report 461. Socorro, New Mexico
McLemore, V. T. and W. L. Chenoweth. 1992, Uranium mines and deposits in the Grants
district, Cibola and McKinley Counties, New Mexico, New Mexico Bureau of Geology and
Mineral Resources, Open-File Report 353. Socorro, New Mexico
McLemore, V. T. 2007a. Uranium resources in New Mexico. Proceedings of the Society of
Mining, Metallurgy and Exploration Annual Meeting. (February 25-28, 2007) Denver,
Colorado.
McLemore, V. T. 2007b (unpublished). Database of the uranium mines, prospects, occurrences,
and mills in New Mexico. New Mexico Bureau of Geology and Mineral Resources.
Socorro, New Mexico.

330
Mine Registration Program. 1989-2008. Mine registration, annual reports, suspension and
inspection files. New Mexico Energy, Minerals and Natural Resources Department, Mining
and Minerals Division. Santa Fe, New Mexico.
Schuster, F. P. 1985. Pilot Project Field Report: Hazardous waste inventory, abandoned uranium
mines, McKinley County, New Mexico. United States Department of the Interior, Bureau of
Land Management, New Mexico Office. Santa Fe, New Mexico.
Souder, Miller & Associates. 2008. Abandoned uranium mine field survey project. Souder,
Miller & Associates. Albuquerque, New Mexico.
State Mine Inspector. 1954-1980. Inactive uranium mines card file. New Mexico Institute of
Mining and Technology, New Mexico Bureau of Mine Safety. Socorro, New Mexico.
Published GIS Datasets Used in the Personal Geodatabase
U.S. Bureau of Land Management. New Mexico State Office, Santa Fe, New Mexico. 2006.
Land Surface Ownership shapefiles.
Mineral Ownership shapefiles.
Public Land Survey System shapefiles.
U.S. Department of Agriculture. Natural Resources Conservation Service, Fort Worth,
Texas. 2005.
Subwatershed Hydrologic Unit Boundaries (10-digit) of New Mexico shapefiles.
New Mexico Resource Geographic Information System. Albuquerque, New Mexico.
Digital Orthophoto Quarter-Quadrangles aerial imagery for the State of New
Mexico. 1 meter resolution, flown 2005-2006. Compressed ECW format.
Processing by Bohannan-Huston, Inc. Albuquerque, New Mexico.
U.S. Geological Survey. Reston, Virginia
USGS Digital Raster Graphics (DRG). U.S. 7.5min Topographic Map. GeoTIF
files and mosaics.
USGS National Hydrographic Dataset shapefile. 1999-2001.
New Mexico Office of the State Engineer. 2008.
iWATERS Well data shapefile, iWATERS database.