Lecture 3: Flow, Level, Temperature and Light Measurement 1.

7/22/2019 3. FLOW-measurement
http://slidepdf.com/reader/full/3-flow-measurement 1/41
FLUID FLOWME SUREMENTBy N. Asyiddin

7/22/2019 3. FLOW-measurement
http://slidepdf.com/reader/full/3-flow-measurement 2/41
EMPTY PAGE
7/22/2019 3. FLOW-measurement
http://slidepdf.com/reader/full/3-flow-measurement 3/41
TABLE OF CONTENTS
FLUID FLOW MEASUREMENT ..................................................................................................... 1
WHAT IS FLOW?............................................................................................................................. 1
UNDERSTANDING
FLOW
.................................................................................................................. 3 The Flow Law ........................................................................................................................... 3 Energy Balance in Flow............................................................................................................ 4 Physical Nature of Flow............................................................................................................ 7 Minimum and Maximum Volumetric Flow (Qmin /Qmax ) Calculation ........................................... 8
UNITS OF FLOW ............................................................................................................................. 9 Conversions between Units...................................................................................................... 9
MEASURING THE FLOW................................................................................................................. 10 A. Head Type, or Differential Meter .................................................................................... 11
Orifice Plates................................................................................................................. 12 Venturi Tube.................................................................................................................. 14 Pitot tubes ..................................................................................................................... 15 Flow Nozzle................................................................................................................... 16 Special DP meter - Rosemount’s Probar
® .................................................................... 17
B. Turbine Meters................................................................................................................. 19 C. Positive Displacement Meter (PD) ................................................................................. 20
i. Rotating or sliding vane meter.................................................................................. 20 ii. Rotating impeller meter............................................................................................. 21 iii. Rotating piston meter................................................................................................ 21 iv. Nutating-disk meter................................................................................................... 21
D. Magnetic Flowmeter ........................................................................................................ 22 E. Ultra-Sonic Flowmeter..................................................................................................... 23 F. Vortex Flowmeter............................................................................................................. 27
G. Coriolis-Effect meter ....................................................................................................... 29 H. Rotameter (Variable Area Flow Meter)........................................................................... 36
COMPARISON OF METER CLASSES......................................................................................... 37

7/22/2019 3. FLOW-measurement
http://slidepdf.com/reader/full/3-flow-measurement 4/41
EMPTY PAGE
7/22/2019 3. FLOW-measurement
http://slidepdf.com/reader/full/3-flow-measurement 5/41
FFLLUUIIDD FFLLOOWW MMEEAASSUURREEMMEENNTT
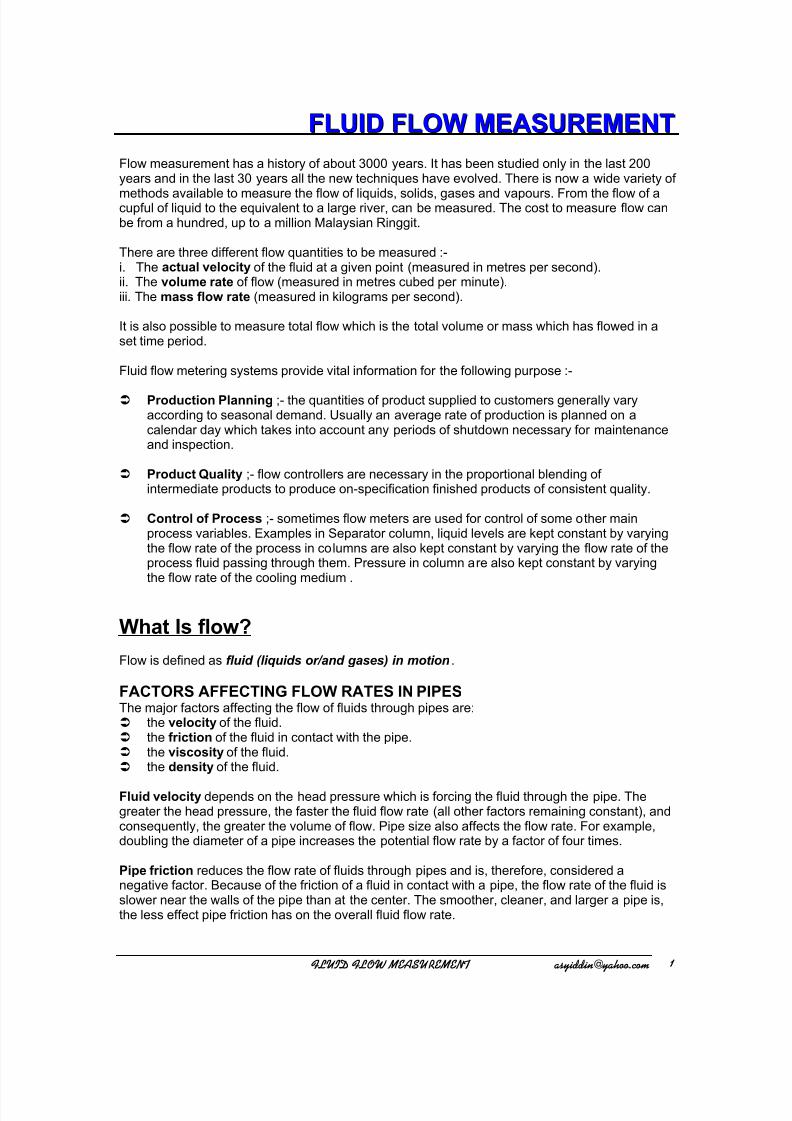
Flow measurement has a history of about 3000 years. It has been studied only in the last 200years and in the last 30 years all the new techniques have evolved. There is now a wide variety of
methods available to measure the flow of liquids, solids, gases and vapours. From the flow of acupful of liquid to the equivalent to a large river, can be measured. The cost to measure flow canbe from a hundred, up to a million Malaysian Ringgit.
There are three different flow quantities to be measured :-i. The actual velocity of the fluid at a given point (measured in metres per second).ii. The volume rate of flow (measured in metres cubed per minute).iii. The mass flow rate (measured in kilograms per second).
It is also possible to measure total flow which is the total volume or mass which has flowed in aset time period.
Fluid flow metering systems provide vital information for the following purpose :-
Production Planning ;- the quantities of product supplied to customers generally varyaccording to seasonal demand. Usually an average rate of production is planned on acalendar day which takes into account any periods of shutdown necessary for maintenanceand inspection.
Product Quality ;- flow controllers are necessary in the proportional blending ofintermediate products to produce on-specification finished products of consistent quality.
Control of Process ;- sometimes flow meters are used for control of some other mainprocess variables. Examples in Separator column, liquid levels are kept constant by varyingthe flow rate of the process in columns are also kept constant by varying the flow rate of theprocess fluid passing through them. Pressure in column are also kept constant by varyingthe flow rate of the cooling medium .
What Is flow?
Flow is defined as fluid (liquids or/and gases) in motion.
FACTORS AFFECTING FLOW RATES IN PIPES The major factors affecting the flow of fluids through pipes are: the velocity of the fluid. the friction of the fluid in contact with the pipe. the viscosity of the fluid. the density of the fluid.
Fluid velocity depends on the head pressure which is forcing the fluid through the pipe. Thegreater the head pressure, the faster the fluid flow rate (all other factors remaining constant), andconsequently, the greater the volume of flow. Pipe size also affects the flow rate. For example,doubling the diameter of a pipe increases the potential flow rate by a factor of four times.
Pipe friction reduces the flow rate of fluids through pipes and is, therefore, considered anegative factor. Because of the friction of a fluid in contact with a pipe, the flow rate of the fluid isslower near the walls of the pipe than at the center. The smoother, cleaner, and larger a pipe is,the less effect pipe friction has on the overall fluid flow rate.
GMVJE GMPX NFBTVSFNFOU btzjeejoAzbipp/dpn 2
7/22/2019 3. FLOW-measurement
http://slidepdf.com/reader/full/3-flow-measurement 6/41
Viscosity (η), or the molecular friction within a fluid, negatively affects the flow rate of fluids.Viscosity and pipe friction decrease the flow rate of a fluid near the walls of a pipe. Viscosityincreases or decreases with changing temperature, but not always as might be expected. Inliquids, viscosity typically decreases with increasing temperature. However, in some fluidsviscosity can begin to increase above certain temperatures. Generally, the higher a fluid’s
viscosity, the lower the fluid flow rate (other factors remaining constant). Viscosity is measured inunits of centipoise. Another type of viscosity, called kinematic viscosity , is measured in units ofcentistokes. It is obtained by dividing centipoise by the fluid’s specific gravity.
Density (ρ) of a fluid affects flow rates in that a more dense fluid requires more head pressure tomaintain a desired flow rate. Also, the fact that gases are compressible, whereas liquidsessentially are not, often requires that different methods be used for measuring the flow rates ofliquids, gases, or liquids with gases in them.It has been found that the most important flow factors can be correlated together into adimensionless parameter called the Reynolds Number .
GMVJE GMPX NFBTVSFNFOU btzjeejoAzbipp/dpn3

7/22/2019 3. FLOW-measurement
http://slidepdf.com/reader/full/3-flow-measurement 7/41
Understanding Flow
The Flow LawIf liquid flow through a pipe of varying diameters, at any particular time the same volume flows atall points. This means, the velocity of liquid must increase at a narrow point (see figure below ).
Flow Q is given by the volume of fluid V divided by time t .
t
VQ =
Liquid volume V itself given by area A times length s;
V = A • s
t
sAQ
⋅= Applying volume to the flow ⇒
However, since we know thatt
s is the velocity v , thus, by substituting it we get;
Q = A • v
In a pipe (see figure below ), the same flow Q (in L/min) occurs at any point in the pipe. If a pipehas cross-sectional area A1 and A2, corresponding velocities (v1 and v2) must occur at the cross-sections.
Q1 = Q2 ,Q1 = A1 • v1 ,Q2 = A2 • v2 ,
hence we can write; A1 • v1 = A2 • v2
v1
v2
A2 A1
Q2
Q1
GMVJE GMPX NFBTVSFNFOU btzjeejoAzbipp/dpn 4

7/22/2019 3. FLOW-measurement
http://slidepdf.com/reader/full/3-flow-measurement 8/41
Energy Balance in FlowBack to the principle that energy is conserved within a system; it may just change from a state toanother, the same principle applies to the flow within a flow closed-system.Consider the Diagram 2 below;
Tapping 2Tapping 1
o
1P
ρo
2P
ρv 1
D2
D1
∆P
Reference plane
v 2
Level resultedfrom tappings
BA
Diagram 2
Z 2 Z 1
A liquid with a density of ρo flows constantly in a pipe with reducing diameters from A to B. Twopoints on the pipe were tapped with a small tube, namely Tapping 1 & Tapping 2, and results intwo different levels of pressure.
The Law of Conservation of Energy, with respect to a flowing fluid, states that ‘the total energy ofa flow of liquid does not change, as long as the system is kept closed (no external influences)’.Neglecting the types of energy which do not change during flow, the total energy is made up of;
i. Potential Energy (due to position, and dependent on the height of head of liquid and onstatic pressure, equals to m·g·h).
ii. Kinetic Energy (due to movement, and dependent on the velocity of flow and on backpressure, equals to ½mv²)
Hence, the Bernaulli’s equation is produced;
constant2
v
ρ
phg
2
=++⋅
With respect to pressure energy, this means;
( )
⋅+⋅⋅+= 2stT v
2
ρhgρPPpressure,total
where, Pst = static pressure(ρ ⋅ g ⋅ h) = pressure due to height of liquid(ρ/2 ⋅ v
2) = back pressure
From these conceptual equations, we can deduce that;
GMVJE GMPX NFBTVSFNFOU btzjeejoAzbipp/dpn5

7/22/2019 3. FLOW-measurement
http://slidepdf.com/reader/full/3-flow-measurement 9/41
If the velocity increases as the cross-section decreases, movement energy increases. As thetotal energy remains constant, potential energy and/or pressure must become smaller as thecross-section decreases.
There is no measurable change in potential energy. However, the static pressure changes,dependent upon the back pressure, i.e. dependent on the velocity of flow.
It is mainly the static pressure which is of importance in ‘hydro-static system’, as the height ofhead of liquid and velocity of flow are usually too small.
ViscosityViscosity is defined as the quantitative measure of tendency of a fluid to resist the forces of shearor deformation. Meaning, a fluid that can flow easily (e.g. water) has low viscosity, and a fluid thatresist to flow (like cold honey, or Dunlop adhesive) is highly viscous.Reference point for viscosity scale is water at 20°C (68°F), which is equal to 1.0 centipoise.(1 poise = 1
gm /cm s). The poise or centipoise is referred to as absolute viscosity .
Other units of viscosity used in the petroleum industries include Kinematics viscosity , expressed
in Stokes (or centistokes) and Saybolt. Universal or Saybolt Furol viscosity expressed inseconds. These units are readily converted from one to the other when calculations required theiruse and values are given in other units.The viscosity of a fluid depends primarily on temperature and to a lesser degree on pressure.Viscosity of liquids generally decrease with increasing temperature, and gas viscosity normallyincrease as temperature increase. The effect of pressure on viscosity of a liquid is very small,however, particularly at high pressure, it does effect the viscosity very significantly.
DensityDensity of a substance is defined as its mass per unit volume.
Vm
ρ = , where ρ=Density , m=mass, V=volume
The unit derived from this formula is kg/m3. However, there are other units used, such as pounds
per cubic inch, ounces per gallons. Liquids densities change considerably with temperature, butrelatively very small with pressure because liquids are considered uncompressible. For gasesand vapours, pressure and temperature affected greatly in their densities. Therefore, inmeasuring the flow, mass-flow measure is most desired method to use.
Specific GravityNormally called ‘SG’, is the fluid weight (or mass) ratio to a standard one. For liquids (or solids),the standard referral is water (s.g. = 1.0) at 4°C (60°F). For gases and vapours, the standardused is air (s.g. = 1.0) at 4°C (60°F) under atmospheric pressure (14.7 psi).
water
liquid
ρρ
.g.sNote : SG act as co-efficient to measurement,
and has NO unit!
GMVJE GMPX NFBTVSFNFOU btzjeejoAzbipp/dpn 6

7/22/2019 3. FLOW-measurement
http://slidepdf.com/reader/full/3-flow-measurement 10/41
Specific gravity correction of flowIt is necessary to compensate for changes in specific gravity because of temperature. Correctionfactor, Cf is used, multiplied against the D.P. (diff. pressure flowmeter) to provide thecompensation. Example;
Temperature, ºF Specific Gravity Actual Cf
60 1.00 1.2100 0.99 1.11200 0.96 1.08300 0.92 1.03347 0.89 1.00400 0.86 0.96
Super-compressibilityLiquids are considered incompressible except at high-pressure ranges but it normally notapplicable to most liquids flow measurement methods. However, for gases, the compressibilityfactor should be taken much into consideration in its calculation since the percentage error isremarkably high.
Compressibility Factor is a function of molecular weight, temperature, and pressure. Follow thefollowing;
2
2
1
11
T
VP
T
VP 2
The Ideal Gas Law (Boyle’s + Charles Laws) ;
Assume at this moment, the gas is at a normal temperature and pressure. The molecules of gasis moving randomly constantly in the container. When pressurised, the molecules have lost thespace to move and become more attached to each other. These changes in behaviour of gas iscalled the Super-compressibility (Z).
22
2
11
11
ZT
VP
ZT
VP 2
=The general gas law written to include the Z factor ;⇒
Head lossHead loss occurs after a fluid passed through a restriction of an orifice or venturi, and does notquite return to its original pressure.Hydraulic energy cannot be transferred through pipes without losses. Friction occurs at the pipesurface and within liquid, which then generates heat. The loss created this way in hydraulicenergy actually means that a pressure loss occurs within the system/pipe itself.
As the fluid flows through the pipe, by principle the head pressure along the pipe should be all equal, but due to friction the heads pressure lost.
GMVJE GMPX NFBTVSFNFOU btzjeejoAzbipp/dpn7

7/22/2019 3. FLOW-measurement
http://slidepdf.com/reader/full/3-flow-measurement 11/41
Discharge co-efficient, C, Viscous frictionIf we examine a real calibrated flowmeter and plot recorded flow, against calculated flow, we findthere is a constant difference over the whole flow range.
actual mass rate of flowDischarge Coefficient, C =
calculated/theoretical mass rate of flow
Note that C will normally be less than 1, the closer value to 1 the more ideal.
Typical values of C are; about 0.6 for an orifice plate, and about 0.99 for a venturi.
Beta ratio ( )It is a ratio between the diameter of orifice bore and the internal diameter of the pipe.
D
d
•
d D
The range of β values is restricted to between 0.2 and up to 0.7 max. for accuracy and linearity inflow measurement.
Physical Nature of Flow
i. Laminar and turbulent fluid flow (Reynolds number)Laminar referred to an orderly motion of flow where every particle of the fluid moves in parallel tothe pipe. However, the fluid flowing close to the wall slows down due to friction and viscosity.
GMVJE GMPX NFBTVSFNFOU btzjeejoAzbipp/dpn 8

7/22/2019 3. FLOW-measurement
http://slidepdf.com/reader/full/3-flow-measurement 12/41
The flow is said to become turbulent when it speeds up even more. The two types can bedemonstrated easily by injecting a small jet of coloured water slowly into a clear liquid stream in atransparent pipe. At low flow rate, the coloured water shows an even and with little diffusion in thesurrounding stream. When a similar jet is released in a high velocity stream, the diffusion isalmost immediate and uniform across the section.
The Reynolds number (Re) tells us if the flow is laminar or turbulent; If less than 2000, it is laminar If more than 4000, it is turbulent
Reynolds Number is given by;
ηρ
vD
Re , where v=fluid velocity , D=pipe diameter,ρ=liquid density, η=liquid viscosity
Therefore, Reynolds number depends on;
i. Velocity of the flow (velocity of the flow ∝ turbulence)ii. Diameter of the pipe, D
iii. Density, ρ
iv. Viscosity of the liquid, η
Minimum and Maximum Volumetric Flow (Qmin /Qmax) Calculation
Fluid Density : 1 kgm-3 ≤ ρ ≤ 12.0 kgm-3
DN 15 :ρ
⋅
0226.0dQ
2i
min Qmax = di2 • 0.130
DN 25….300 :ρ
⋅
017.0dQ
2i
min Qmax = di2 • 0.212
Fluid Density : ρ > 12.0 kgm-3
DN 15 :ρ
⋅
022.0dQ
2i
min Qmax = di2 • 0.130 for ρ ≤ 33 kgm
-3
ρ
⋅
746.0dQ
2i
max for ρ > 33 kgm-3
DN 25….300 : ρ
⋅
017.0dQ
2i
min
ρ
⋅
746.0dQ
2i
max
Where ;ρ = density in kgm-3 Q = volumetric flow in m3/hdi = internal diameter of pipe in mm
GMVJE GMPX NFBTVSFNFOU btzjeejoAzbipp/dpn9
7/22/2019 3. FLOW-measurement
http://slidepdf.com/reader/full/3-flow-measurement 13/41
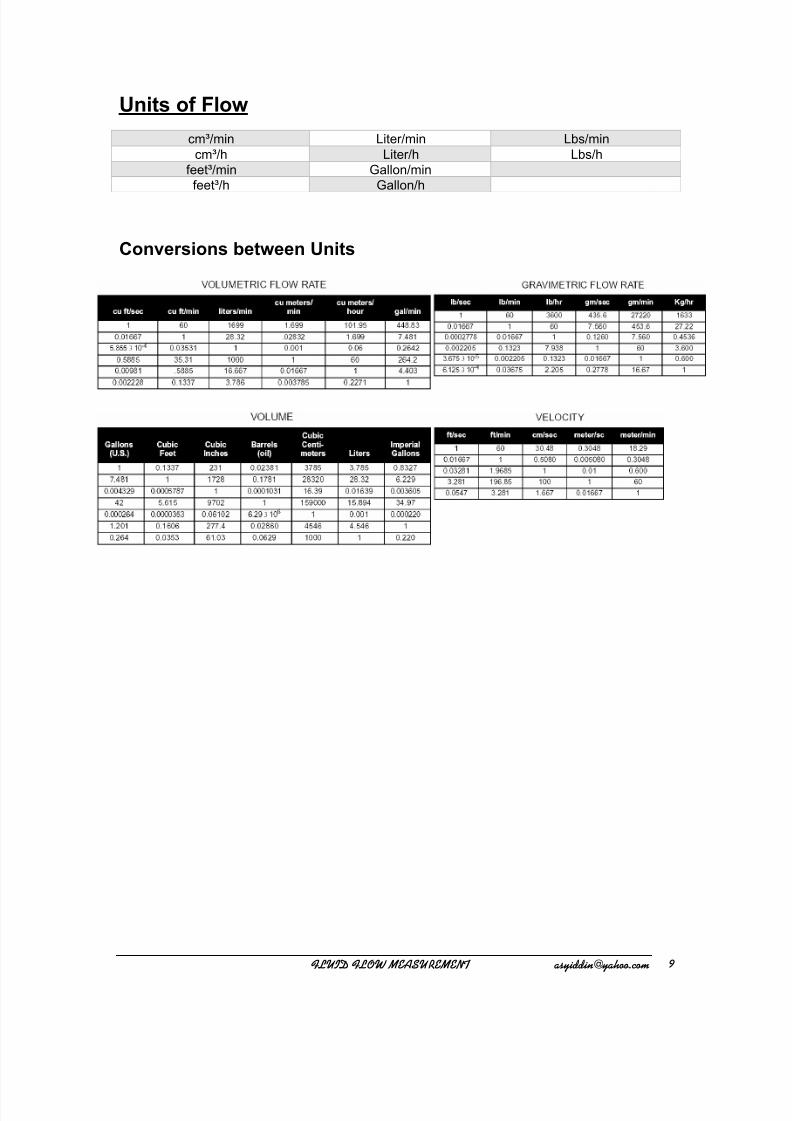
Units of Flow
cm³/min Liter/min Lbs/mincm³/h Liter/h Lbs/h
feet³/min Gallon/minfeet³/h Gallon/h
Conversions between Units
GMVJE GMPX NFBTVSFNFOU btzjeejoAzbipp/dpn :

7/22/2019 3. FLOW-measurement
http://slidepdf.com/reader/full/3-flow-measurement 14/41
Measuring the Flow
Fluids can be measured in gravimetric terms (by weight or mass), or in volumetric term (byvolume), or by velocity .
We measure quantity in terms of mass or volume units, such as kilograms or litres. We can also
measure the quantity that has passed through a defined area in a given direction over a givenperiod of time in terms of mass or volume (kilograms, cubic meters), or in terms of mass flow rateor volume flow rate, such as kilograms per minute, or cubic meter per hour.
In most situations, fluid measurement in terms of mass or mass flow is preferable to volume orvolume flow measurement because the mass of a given quantity does not vary with temperature.Since we know that some liquids are unstable under certain temperature to become vapourised(change from liquid to gas state), example petrol.
In contrast, a volumetric measurement is only meaningful with reference to simultaneousmeasurements of temperature and pressure or with reference to standards to which themeasurement has been corrected. Accurate volumetric measurement of fluids requirescompensation for temperature and pressure, and is limited by the accuracy of measurements that
can be made of these factors.
A contained quantity of fluid can always be weighed on a scale (with the weight of the containersubtracted to give the net weight of the fluid alone), or measured by level if the volume of thecontainer is known. However, in most applications nowadays, it is not practical or efficient tocontain and measure every segment of a continuous process. We need a continuousmeasurement of either total quantity or flow rate, for example sliding vane flowmeter, coriolis.
GMVJE GMPX NFBTVSFNFOU btzjeejoAzbipp/dpn21

7/22/2019 3. FLOW-measurement
http://slidepdf.com/reader/full/3-flow-measurement 15/41
A. Head Type, or Differential MeterDifferential pressure flow instruments create a differential pressure in a fluid flowing through apipe which can be measured and presented in terms of rate of flow. A restriction is placed in lineof a flowing fluid produced a differential pressure across the restriction element, and the flow rateis proportional to the square root of the differential pressure. This can be presented as;
PQ ∆
PkQ ∆ where k is a constant. (it is referred to as flow factor )
Types of flow meters that employ this principle are Orifice Plates, Venturi, Pitot tubes, and FlowNozzle.
Bernaulli Equation finds its major use in this type of flow measurement. The equation is asfollow;
where; vo and vs are velocities at points O and Sg is the local acceleration owing to gravityγ is the weight per unit volume of the fluidPo and Ps are the static and stagnation pressures, respectively.
2g
vP
2g
vP ssoo +=+γ γ
22
Figure : Head-type elements
GMVJE GMPX NFBTVSFNFOU btzjeejoAzbipp/dpn 22

7/22/2019 3. FLOW-measurement
http://slidepdf.com/reader/full/3-flow-measurement 16/41
Orifice Plates
DP
•
Flow
d
An Orifice plate is simply a disc with a hole. Orifice plate functions as the primary element ; itcreates restriction as well as differential pressure between the upstream and downstream sides.The pressure on the upstream is higher than the pressure at the downstream, and this pressuredifference is directly proportional to the velocity and rate of flow of the fluid.
The bore or hole on the orifice is normally concentric, but no always the case; some are eccentricor at top of the plate, especially if fluid contains a lot of dissolved gases, to prevent gases build upat the plate.
Its accuracy is about 1.5%. The sharpness of the edge of the bore is critical; it affects thedischarge coefficient ( C ), thus the accuracy of measurement. There is an overall pressure lossacross the meter of about 50%. The orifice plate is a non-linear primary element.
Orifice Plate TapsTaps are where the impulse lines are joined to the orifice plate carrier. Impulse line should alwaysbe physical as short as possible. There are several different arrangements of flange taps. Themost common are; Pressure taps
1” upstream and downstream of plate faces.
Corner tapsFor use with pipes smaller than 22”, taps are at/on the plate.
Radius tapsSituated upstream at 1 pipe diameter from the upstream face, but this is not critical. Thedownstream taps is ½ a pipe diameter from the plate face.
Vena contracta tapsUpstream anywhere between ½ and 2 pipe diameters. The downstream is at the point ofmaximum flow restriction depending on orifice to pipe diameter. This ratio is called the Beta
Ratio ( β ).
GMVJE GMPX NFBTVSFNFOU btzjeejoAzbipp/dpn23

7/22/2019 3. FLOW-measurement
http://slidepdf.com/reader/full/3-flow-measurement 17/41
Pressure connections For Gas, the tappings are on top as shown;
Orifice plate
For Liquid, the tappings are on the side as shown;
Orifice plate
For Steam, the tappings are on the side but downwards, as shown;
Orifice plate
Condensatechamber
GMVJE GMPX NFBTVSFNFOU btzjeejoAzbipp/dpn 24

7/22/2019 3. FLOW-measurement
http://slidepdf.com/reader/full/3-flow-measurement 18/41
Venturi Tube
P2 P1 throat
d
dD
5° - 15° 10.5°
A venturi tube contains a throat which is smaller in a diameter to the pipeline, into which it fits.The restriction diameter should not be less than 0.224 x D, and not more than 0.742 x D where Dis the nominal bore diameter of the pipe. When the fluid flows through it, the pressure at thethroat is lower than the upstream pressure (because of increased kinetic energy due to increased
velocity, ½ mv
2
) and the consequent reduction in flow energy (Ef = P • v). The flow rate isproportional to the pressure difference, P1 – P2.
where k is dependent on the pipeline and throat diameter,density and discharge coefficient21 PPkQ
The venturi flow meter should always be used for turbulent flow.Its accuracy for a wide range of instruments is about 0.5%. ideal for use in Heat Ventilation AirCond. (HVAC) applications, or air to furnaces and boilers and for liquids containing particles andslurries.
GMVJE GMPX NFBTVSFNFOU btzjeejoAzbipp/dpn25

7/22/2019 3. FLOW-measurement
http://slidepdf.com/reader/full/3-flow-measurement 19/41
Pitot tubes
P2
P1
Pitot Tube basic
static probe
Impact tip
flow
The tube lies along the flow axis having an open end facing into the flow is called the impact probe/tip. The second tube resides around the pipe wall and it has a hole tangential to the flow iscalled the static probe.
The pitot tubes depend on differential pressure between the impact probe and the static probe.The velocity of flow can be represented as follow;
ρ 21 PP2
v , where v = velocity of flow, P1-P2 = differential press.,
ρ = density of liquid
It can be used for turbulent and non-turbulent flows. However, to measure velocity greater thanspeed of sound, special factors must be used, and the tip can become fouled with solids. It isnormally used for air flow measurement particularly in HVAC air ducts, and they are very commonin aircraft to measure airspeed.
GMVJE GMPX NFBTVSFNFOU btzjeejoAzbipp/dpn 26

7/22/2019 3. FLOW-measurement
http://slidepdf.com/reader/full/3-flow-measurement 20/41
Flow Nozzle
P1 P2
flow
A flow nozzle is an elliptical or a radius entrance and is particularly suited for measurement ofsteam flow and other high velocity fluids, fluids with some solids, wet gases, and similarmaterials.
A flow nozzle is essentially a venturi meter with the diffuser cone removed. Since the diffusercone is used to optimise head loss caused by the presence of the meter in the system, largerhead losses will occur in flow nozzles than in venturi meters.
The flow nozzle is preferred to the venturi meter in many applications because of its lower initialcost and because it can be easily installed between two flanges in any piping system.
GMVJE GMPX NFBTVSFNFOU btzjeejoAzbipp/dpn27
7/22/2019 3. FLOW-measurement
http://slidepdf.com/reader/full/3-flow-measurement 21/41
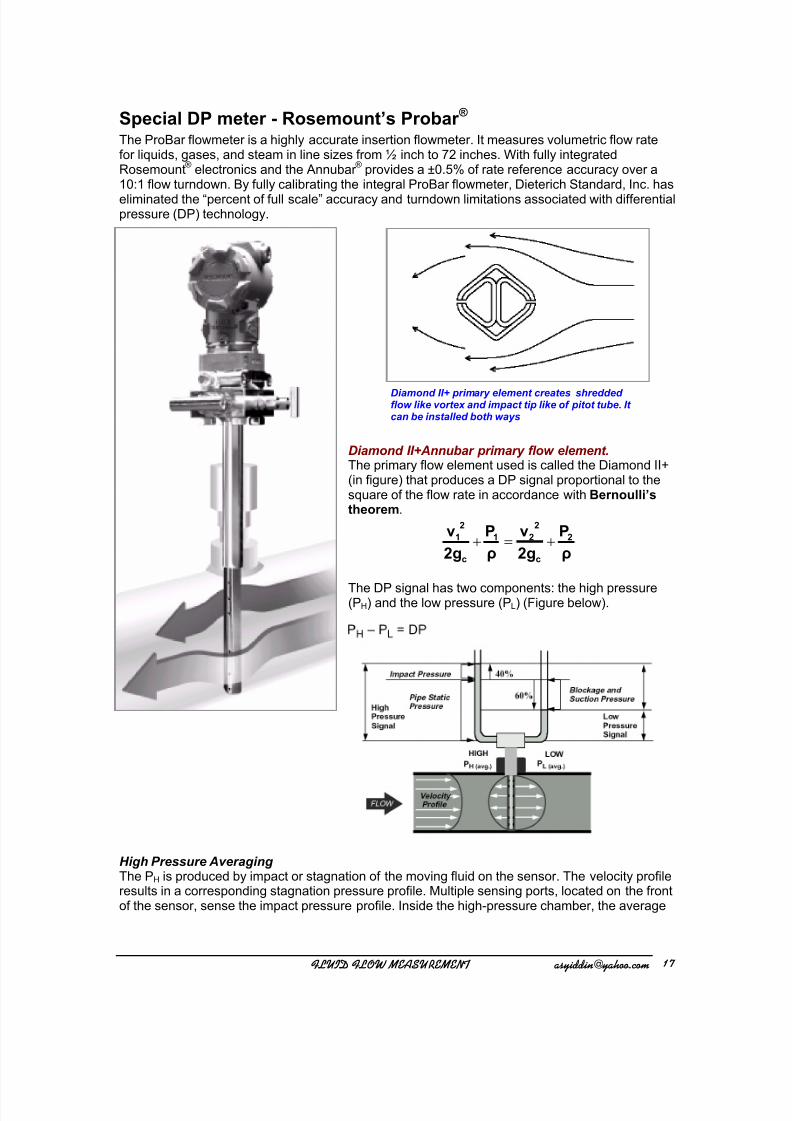
Special DP meter - Rosemount’s Probar ® The ProBar flowmeter is a highly accurate insertion flowmeter. It measures volumetric flow ratefor liquids, gases, and steam in line sizes from ½ inch to 72 inches. With fully integratedRosemount® electronics and the Annubar ® provides a ±0.5% of rate reference accuracy over a10:1 flow turndown. By fully calibrating the integral ProBar flowmeter, Dieterich Standard, Inc. has
eliminated the “percent of full scale” accuracy and turndown limitations associated with differentialpressure (DP) technology.
Diamond II+ primary element creates shreddedflow like vortex and impact tip like of pitot tube. Itcan be installed both ways
Diamond II+Annubar primary flow element.The primary flow element used is called the Diamond II+(in figure) that produces a DP signal proportional to thesquare of the flow rate in accordance with Bernoulli’stheorem.
ρ
P
2g
v
ρ
P
2g
v 2
c
2
21
c
2
1 +=+
The DP signal has two components: the high pressure(PH) and the low pressure (PL) (Figure below).
High Pressure AveragingThe PH is produced by impact or stagnation of the moving fluid on the sensor. The velocity profileresults in a corresponding stagnation pressure profile. Multiple sensing ports, located on the frontof the sensor, sense the impact pressure profile. Inside the high-pressure chamber, the average
GMVJE GMPX NFBTVSFNFOU btzjeejoAzbipp/dpn 28
7/22/2019 3. FLOW-measurement
http://slidepdf.com/reader/full/3-flow-measurement 22/41
velocity pressure is maintained by the proportionality of the sensing port diameters to thechamber cross-sectional area.
Low Pressure Averaging As the fluid continues around the sensor, it generates a vortex-shedding pattern and creates a PL profile. The PL is used as a pressure reference so the velocity can be determined independent ofpipe static pressure. The P
L is sensed by ports, located downstream and opposite the high-
pressure ports. Working on the same principle as the PH side, an average PL is maintained in thelow-pressure chamber. This assures less dependence on the magnitude of flow or ReynoldsNumber.
Benefits of using Diamond II+ Annubar sensor
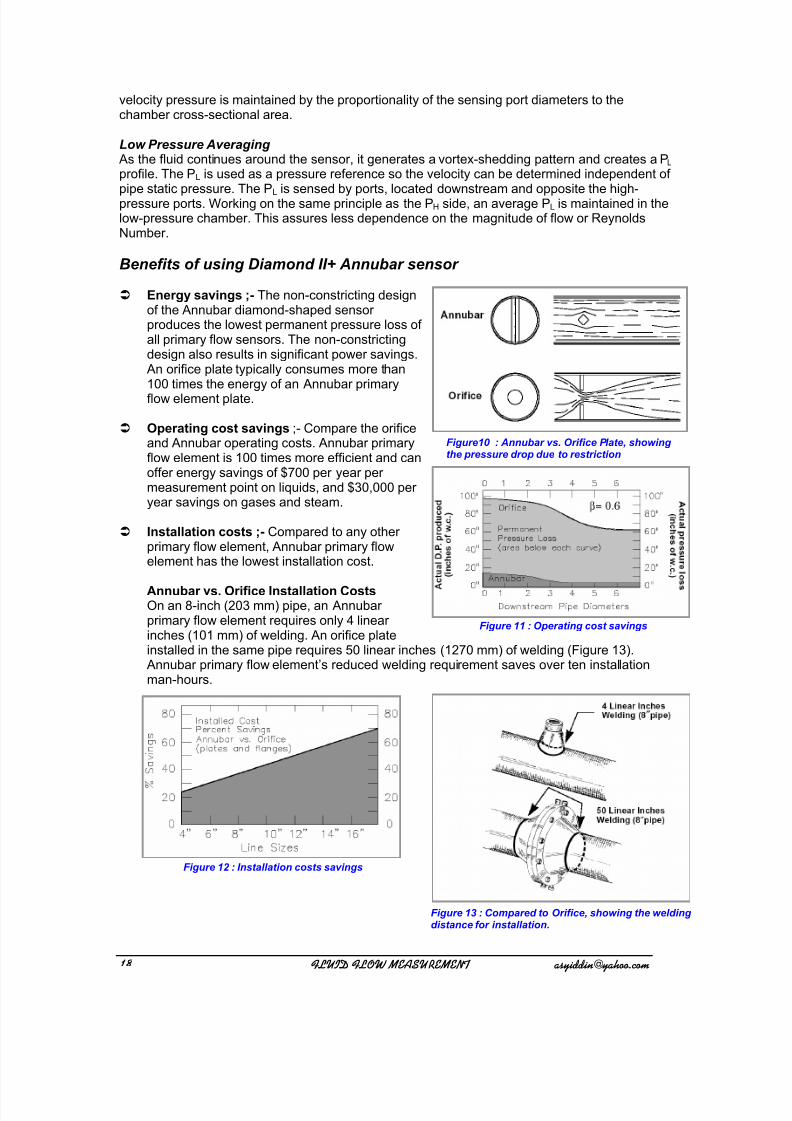
Energy savings ;- The non-constricting designof the Annubar diamond-shaped sensorproduces the lowest permanent pressure loss ofall primary flow sensors. The non-constrictingdesign also results in significant power savings.
An orifice plate typically consumes more than100 times the energy of an Annubar primaryflow element plate.
Operating cost savings ;- Compare the orificeand Annubar operating costs. Annubar primaryflow element is 100 times more efficient and canoffer energy savings of $700 per year permeasurement point on liquids, and $30,000 peryear savings on gases and steam.
Figure10 : Annubar vs. Orifice Plate, showingthe pressure drop due to restriction
Installation costs ;- Compared to any otherprimary flow element, Annubar primary flowelement has the lowest installation cost.
Annubar vs. Orifice Installation Costs
Figure 11 : Operating cost savings
On an 8-inch (203 mm) pipe, an Annubarprimary flow element requires only 4 linearinches (101 mm) of welding. An orifice plateinstalled in the same pipe requires 50 linear inches (1270 mm) of welding (Figure 13).
Annubar primary flow element’s reduced welding requirement saves over ten installationman-hours.
Figure 12 : Installation costs savings
Figure 13 : Compared to Orifice, showing the weldingdistance for installation.
GMVJE GMPX NFBTVSFNFOU btzjeejoAzbipp/dpn29

7/22/2019 3. FLOW-measurement
http://slidepdf.com/reader/full/3-flow-measurement 23/41
B. Turbine MetersIt is very commonly used for measuring condensate, crude oil and diesel. The flow of the liquidcauses the rotor to spin at an angular velocity which is proportional to the velocity of the liquid.The speed of the rotor is detected by a pick-up on the outside of the tube, usually by anelectromagnetic detector to provide a pulsed electrical signal proportional to flow rate.
The effects of viscosity become negligible with Reynolds numbers over 2000 which sets a limit tothe lower flow accuracy of the meter.
Its advantages over DP type devices is that the turbine have a linear flow characteristic and arecapable of a wider flow range. There is a small pressure head drop across the turbine. There aresome mechanical friction effects, but these are negligible except at low flows.
They generally used for liquid flow only. These meters are delicate and do not like sudden highflows caused by gas pockets, or valves sudden opening. The fluid needs to lubricate the turbinebearings and not be too viscous; this restricts the range of fluids for which the meter is suitable.
In practice the angular velocity of the rotor is not directly proportional to the flow velocity. The
liquid may be swirling when it enters the meter which may speed up or slow down the meter. Thiscan be corrected by using a flow straightener or straitening vane fitted to the pipeline at theentrance to the meter.
A straightening element consists of a cluster of vanes or tubes inside a piece of straight pipe. Thisis placed at upstream of the meter. If a plain straight piece of pipe is before the meter, it shouldbe about 20xDiameters equivalent in length minimum.
There are four main types of pick-ups;i. Magnetic Reed switch
Magnets in the rotor cause the reed switch to on and off giving a digital output, this deviceneeds a power supply.
ii. Optical pick-up A beam of light (usually infra red) is interrupted by the blades, the rate is counted from therate of the beam being interrupted, a power supply is required.
iii. Inductive pick-upWorks on the principle of a moving magnet producing a flux which produces a voltage in aninductive pick up.
iv. Reluctive pick-upIt works similar to inductive but the magnet is in the pick up and the rotor is magnetic.
Axial-flow Turbine meter
GMVJE GMPX NFBTVSFNFOU btzjeejoAzbipp/dpn 2:

7/22/2019 3. FLOW-measurement
http://slidepdf.com/reader/full/3-flow-measurement 24/41
C. Positive Displacement Meter (PD)This form of flowmeter divides up the flowing fluid into known volume packets. Thesemeasurement devices trap a known volume of fluid and allow it to pass from meter inlet to outlet.The number of trapped volumes passing through the meter is counted to obtain the total flow.These are then counted to give the true value of the volume passing through. If the volumedelivered over a particular time is monitored, the volume flow rate is established. The term
displacement means that the fluid that flow through the meter replaces (displaces) the volume offluid that flowed through the meter immediately before.
There are several types of P.D. meters;
i. Rotating or sliding vane meter
Consists of a cylindrical rotor from retractable vanes protrude. The fluid flow against the vanescauses the rotor to rotate. As the rotor rotates, the trapped fluid between vanes is swept aroundand out of the chamber. The number of revolution of the rotor is thus a measure of the amount offluid that has been passed through the meter. Accuracy is high, about 0.1%. This is the type ofmeter commonly used for metering as it is very accurate.
measuring chamber
sliding vane
cam
main shaft
roller
“Cut-away’ view of a vane meter
sliding-vane meter
A rotating vane meter
GMVJE GMPX NFBTVSFNFOU btzjeejoAzbipp/dpn31
7/22/2019 3. FLOW-measurement
http://slidepdf.com/reader/full/3-flow-measurement 25/41
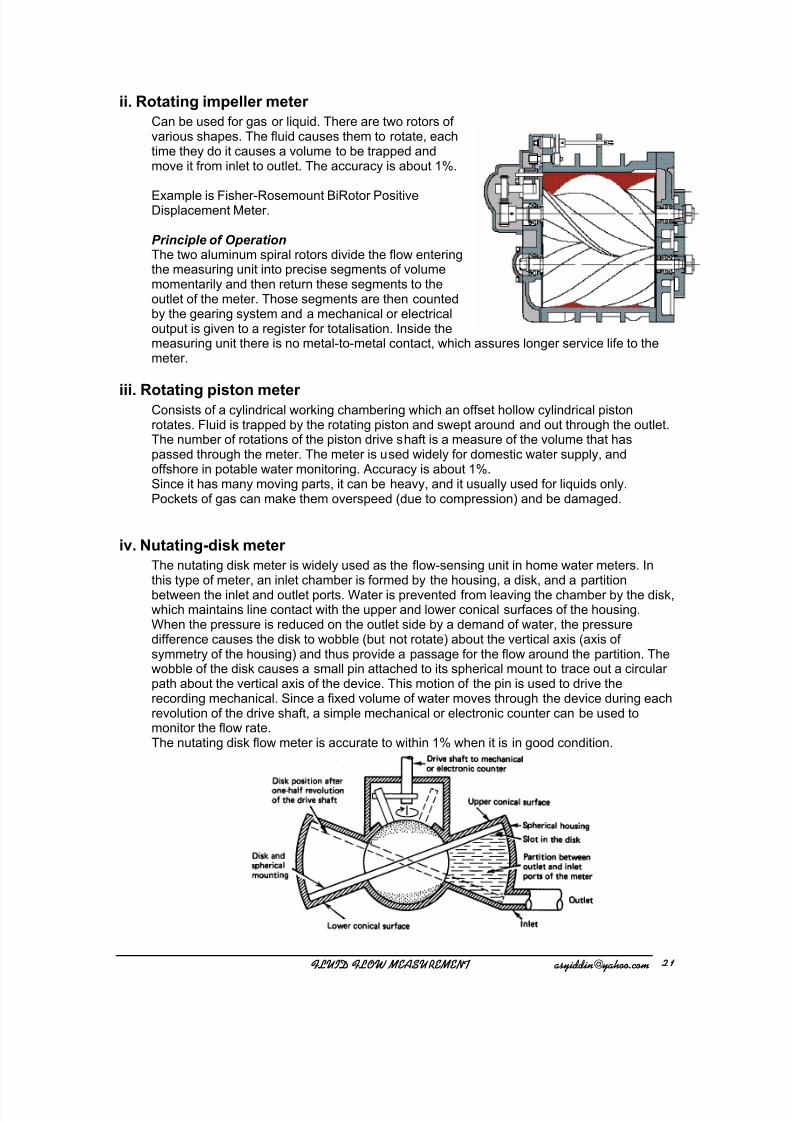
ii. Rotating impeller meter
Can be used for gas or liquid. There are two rotors ofvarious shapes. The fluid causes them to rotate, eachtime they do it causes a volume to be trapped andmove it from inlet to outlet. The accuracy is about 1%.
Example is Fisher-Rosemount BiRotor PositiveDisplacement Meter.
Principle of OperationThe two aluminum spiral rotors divide the flow enteringthe measuring unit into precise segments of volumemomentarily and then return these segments to theoutlet of the meter. Those segments are then countedby the gearing system and a mechanical or electricaloutput is given to a register for totalisation. Inside themeasuring unit there is no metal-to-metal contact, which assures longer service life to themeter.
iii. Rotating piston meterConsists of a cylindrical working chambering which an offset hollow cylindrical pistonrotates. Fluid is trapped by the rotating piston and swept around and out through the outlet.The number of rotations of the piston drive shaft is a measure of the volume that haspassed through the meter. The meter is used widely for domestic water supply, andoffshore in potable water monitoring. Accuracy is about 1%.Since it has many moving parts, it can be heavy, and it usually used for liquids only.Pockets of gas can make them overspeed (due to compression) and be damaged.
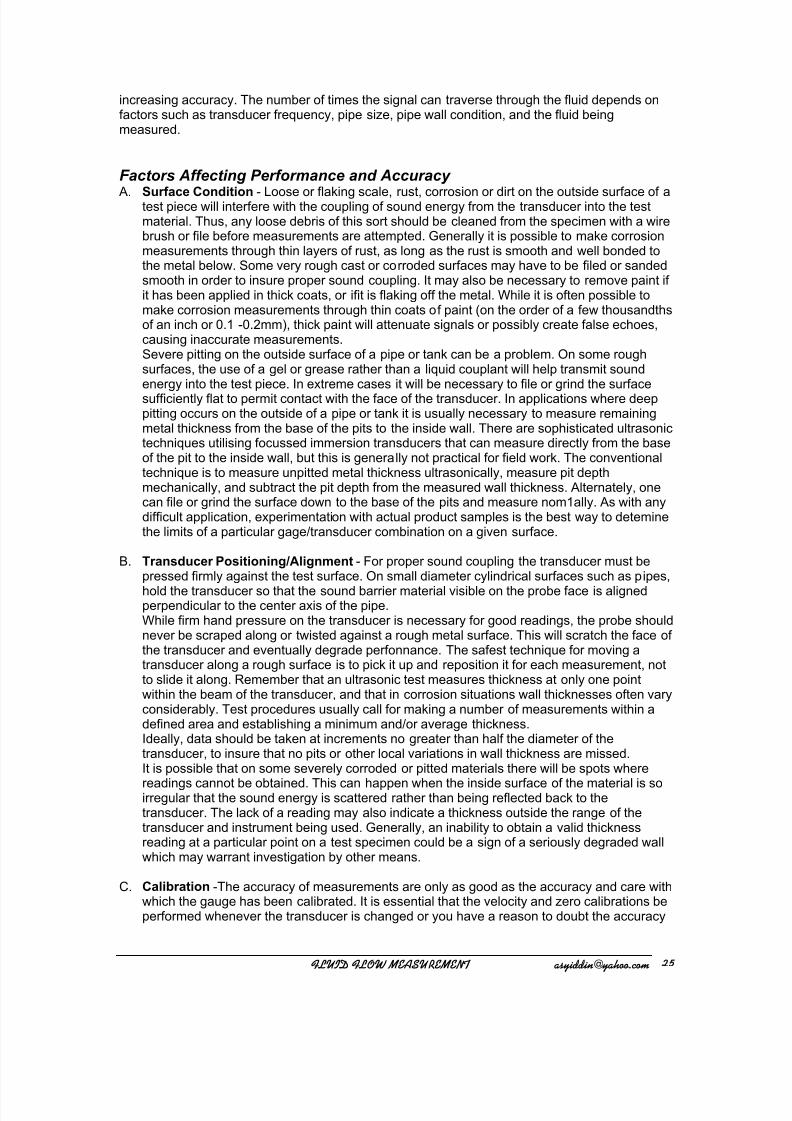
iv. Nutating-disk meter
The nutating disk meter is widely used as the flow-sensing unit in home water meters. Inthis type of meter, an inlet chamber is formed by the housing, a disk, and a partitionbetween the inlet and outlet ports. Water is prevented from leaving the chamber by the disk,which maintains line contact with the upper and lower conical surfaces of the housing.When the pressure is reduced on the outlet side by a demand of water, the pressuredifference causes the disk to wobble (but not rotate) about the vertical axis (axis ofsymmetry of the housing) and thus provide a passage for the flow around the partition. Thewobble of the disk causes a small pin attached to its spherical mount to trace out a circularpath about the vertical axis of the device. This motion of the pin is used to drive therecording mechanical. Since a fixed volume of water moves through the device during eachrevolution of the drive shaft, a simple mechanical or electronic counter can be used tomonitor the flow rate.The nutating disk flow meter is accurate to within 1% when it is in good condition.
GMVJE GMPX NFBTVSFNFOU btzjeejoAzbipp/dpn 32

7/22/2019 3. FLOW-measurement
http://slidepdf.com/reader/full/3-flow-measurement 26/41
D. Magnetic FlowmeterThis type of flow meter uses the principle of inductive voltage/current in accordance withFaraday’s Law and Lenz’s Law.
v
Ue
coil
L
I
I
B
where,L=distance between electrodes,v=flow velocity A= pipe cross-section area
Induced voltage, Ue = B⋅L⋅v , and,Volume flow, Q = v⋅A ,
Two metal electrodes are fit into the wall of the tubing flush with inner wall at opposite sides of thepipe. Two specially shaped magnetic coils are then attached to the pipe to produce a uniformmagnetic fields at the right angles to the pipe (as shown in the diagram above).
The meter works by using the flowing liquid as a conductor, moving across the meter generatedmagnetic field. A voltage is induced across the moving liquid and the amplitude of this voltage isproportional to the velocity of the liquid and the strength of the magnetic field. This inducedvoltage is fed to the measuring amplifier by the electrode pair.
The magflow meter has no moving parts and offers no restriction to the flow, nor any pressuredrop running through it. Its accuracy does not depend on viscosity since it measures by volume.So it can be used for highly viscous slurries or liquids with varying viscosities.
The limitation of this meter is that it can be used only with liquids that are sufficiently conductive.
GMVJE GMPX NFBTVSFNFOU btzjeejoAzbipp/dpn33

7/22/2019 3. FLOW-measurement
http://slidepdf.com/reader/full/3-flow-measurement 27/41
E. Ultra-Sonic FlowmeterThe term ‘ultra sonic’ is used to describe pressure waves at frequencies higher than the humanears can detect. The velocity of the sound waves in the fluid is the same as the velocity of soundin the fluid. If an ultrasonic beam is transmitted across a pipeline at an angle to the flow direction,the time taken for the pulse to reach the receiver is a function of the flow velocity of the fluid, aswell as the velocity of sound in the fluid.
Thus, this type of flowmeter operates on the principle of transit time differences. An acousticsignal (ultrasonic) is transmitted from one sensor to another. This can be either in the direction offlow (downstream) or against the direction of flow (upstream). The time (transit) that the signalrequires to arrive at the receiver is then measured.
According to physical principles, the signal sent against the direction of flow requires longer toreturn than the signal in the direction of flow.The difference in the transit time is directly proportional to the velocity of flow.
v ∝ ∆t
⇒ v = k∆t, where k is a constant
Flow rate is thus, Q = v • A where, v = flow velocity
∆t = transit time difference between the signal in the direction of flowand against the direction of flow
Q = volumetric flow A = pipe cross-sectional area
Transmitter and receiver roles are constantly switched by electronics. Ultrasonic pulses travelingin the direction of the flow, travel path between transducers in a shorter period of time than pulsestraveling against the flow. This is because the flow speeds up pulses traveling downstream butslows down pulses traveling upstream. The equation is;
ud t
1
t
1
L2
KPv
2
where, v = measured velocity ,L = distance btw transducers
P = fluid path length diagonally from transducers tu = transit time upstream td = transit time downstream K = meter factor
flow
45°
upstream transducer
downstream transducer
P
L
GMVJE GMPX NFBTVSFNFOU btzjeejoAzbipp/dpn 34

7/22/2019 3. FLOW-measurement
http://slidepdf.com/reader/full/3-flow-measurement 28/41
INSTALLATION OPTIONS FOR ULTRASONIC FLOWMETER
45°
flow
45°
Figure 1 : Single-traverse Flowcell : L = pipe ID
45° flow
45°
Figure 2A : Multiple-traverse Flowcell (two traverses)
45°
flow45°
Figure 2B : Multiple-traverse Flowcell (four traverses)
A tilted diameter flowcell is so named because the transducers send their pulses obliquely at a45° angle across the diameter of the pipe. This type of flowcell can be configured as a singletraverse or multiple traverse.
A single-traverse configuration consists of two transducers mounted across from each other onthe pipe (figure 1) so that the signal they transmit passes through the fluid just once at a 45° angle.
A multiple-transverse configuration consists of two transducers mounted on the pipe so that thesignal traverses the fluid two or more times before reaching the other transducer (figure 2). Thewalls of the pipe reflect the ultrasonic signal in order to maintain at 45° angle. This allows thesignal to remain in the fluid longer, increasing the effective length ( L ) of the signal path, and thus
GMVJE GMPX NFBTVSFNFOU btzjeejoAzbipp/dpn35
7/22/2019 3. FLOW-measurement
http://slidepdf.com/reader/full/3-flow-measurement 29/41
increasing accuracy. The number of times the signal can traverse through the fluid depends onfactors such as transducer frequency, pipe size, pipe wall condition, and the fluid beingmeasured.
Factors Affecting Performance and Accuracy
A. Surface Condition - Loose or flaking scale, rust, corrosion or dirt on the outside surface of atest piece will interfere with the coupling of sound energy from the transducer into the testmaterial. Thus, any loose debris of this sort should be cleaned from the specimen with a wirebrush or file before measurements are attempted. Generally it is possible to make corrosionmeasurements through thin layers of rust, as long as the rust is smooth and well bonded tothe metal below. Some very rough cast or corroded surfaces may have to be filed or sandedsmooth in order to insure proper sound coupling. It may also be necessary to remove paint ifit has been applied in thick coats, or ifit is flaking off the metal. While it is often possible tomake corrosion measurements through thin coats of paint (on the order of a few thousandthsof an inch or 0.1 -0.2mm), thick paint will attenuate signals or possibly create false echoes,causing inaccurate measurements.Severe pitting on the outside surface of a pipe or tank can be a problem. On some roughsurfaces, the use of a gel or grease rather than a liquid couplant will help transmit soundenergy into the test piece. In extreme cases it will be necessary to file or grind the surfacesufficiently flat to permit contact with the face of the transducer. In applications where deeppitting occurs on the outside of a pipe or tank it is usually necessary to measure remainingmetal thickness from the base of the pits to the inside wall. There are sophisticated ultrasonictechniques utilising focussed immersion transducers that can measure directly from the baseof the pit to the inside wall, but this is generally not practical for field work. The conventionaltechnique is to measure unpitted metal thickness ultrasonically, measure pit depthmechanically, and subtract the pit depth from the measured wall thickness. Alternately, onecan file or grind the surface down to the base of the pits and measure nom1ally. As with anydifficult application, experimentation with actual product samples is the best way to deteminethe limits of a particular gage/transducer combination on a given surface.
B. Transducer Positioning/Alignment - For proper sound coupling the transducer must bepressed firmly against the test surface. On small diameter cylindrical surfaces such as pipes,
hold the transducer so that the sound barrier material visible on the probe face is alignedperpendicular to the center axis of the pipe.While firm hand pressure on the transducer is necessary for good readings, the probe shouldnever be scraped along or twisted against a rough metal surface. This will scratch the face ofthe transducer and eventually degrade perfonnance. The safest technique for moving atransducer along a rough surface is to pick it up and reposition it for each measurement, notto slide it along. Remember that an ultrasonic test measures thickness at only one pointwithin the beam of the transducer, and that in corrosion situations wall thicknesses often varyconsiderably. Test procedures usually call for making a number of measurements within adefined area and establishing a minimum and/or average thickness.Ideally, data should be taken at increments no greater than half the diameter of thetransducer, to insure that no pits or other local variations in wall thickness are missed.It is possible that on some severely corroded or pitted materials there will be spots where
readings cannot be obtained. This can happen when the inside surface of the material is soirregular that the sound energy is scattered rather than being reflected back to thetransducer. The lack of a reading may also indicate a thickness outside the range of thetransducer and instrument being used. Generally, an inability to obtain a valid thicknessreading at a particular point on a test specimen could be a sign of a seriously degraded wallwhich may warrant investigation by other means.
C. Calibration -The accuracy of measurements are only as good as the accuracy and care withwhich the gauge has been calibrated. It is essential that the velocity and zero calibrations beperformed whenever the transducer is changed or you have a reason to doubt the accuracy
GMVJE GMPX NFBTVSFNFOU btzjeejoAzbipp/dpn 36

7/22/2019 3. FLOW-measurement
http://slidepdf.com/reader/full/3-flow-measurement 30/41
of the readings. Periodic checks with samples of known thicknesses are recommended toverify that the gauge is operating properly.
D. Taper or Eccentricity - If the contact surface and the back surface are tapered or eccentricwith respect to each other, the return echo again becomes distorted and the accuracy ofmeasurement is diminished.
E. Acoustic Properties of the Material - There are several conditions found in engineeringmaterials that can severely limit the accuracy and thickness range that can be measured.1. “ Sound Scattering " - In some materials, notably certain types of cast stainless steel, castirons, and composites, the sound energy is scattered from individual crystallites in the castingor from dissimilar materials within the composite. This effect reduces the ability todiscriminate a valid return echo from the back side of the material and limits the ability togauge the material ultrasonically.
2. Velocity Variations - A number of materials exhibit significant variations in sound velocityfrom point-to-point within the material. Certain types of cast stainless steels and brass exhibitthis effect due to a relatively large grain size and the anisotropy of sound velocity with respectto grain orientation. Other materials show a rapid change in sound velocity with temperature.This is characteristic of plastic materials where temperature must be controlled in order to
obtain maximum precision in the measurement.
3. Sound Attenuation or Absorption - In many organic materials, such as low density plasticsand rubber, sound is attenuated very rapidly at the frequencies used in normal ultrasonicthickness gauging. Therefore, the maximum thickness that can be measured in thesematerials is often limited by sound attenuation.
GMVJE GMPX NFBTVSFNFOU btzjeejoAzbipp/dpn37

7/22/2019 3. FLOW-measurement
http://slidepdf.com/reader/full/3-flow-measurement 31/41
F. Vortex Flowmeter
flow
high velocity fluid
alternate vortices
eddies
meterbore
shear layerstill fluid
Vortex formation can occur when a nonstreamlined obstruction is placed in a flowing stream. Theobstruction (sometimes referred to as the shredder) must be designed and shaped to producevortices (or eddies) which create a differential pressure of sufficient magnitude to be detected.In the diagram above, as the fluid flows through the flowmeter, it is divided into two paths by theshredding element, which is positioned across the flowmeter body. High-velocity fluid parcels flowpast the lower-velocity parcels in the vicinity of the element to form a shear layer. There is a largevelocity gradient within this shear layer, thus making it inherently unstable. After some length oftravel, the shear layer breaks down into well-defined vortices. Differential pressure changes occuras the vortices are formed and shed. This pressure variation is used to actuate a sealed detectorat a frequency proportional to vortex shedding.
diaphragm
tailStraindetector
The detector may consist of a double-faced circular diaphragm capsule filled with a liquid. Apiezoelectric crystal may be located in the centre of the capsule in such manner that the vortex-produced pressure changes are transmitted through the fill liquid to the crystal, whereupon thepiezoelectric crystal produces a voltage output when a pressure change is detected. Thealternate vortex generation reverses the differential, and a voltage of opposite polarity isgenerated. Thus, a train of vortices generates an alternating voltage output with a frequencyidentical to the frequency of vortex shedding.
The accuracy of this meter is about 1%.
GMVJE GMPX NFBTVSFNFOU btzjeejoAzbipp/dpn 38
7/22/2019 3. FLOW-measurement
http://slidepdf.com/reader/full/3-flow-measurement 32/41
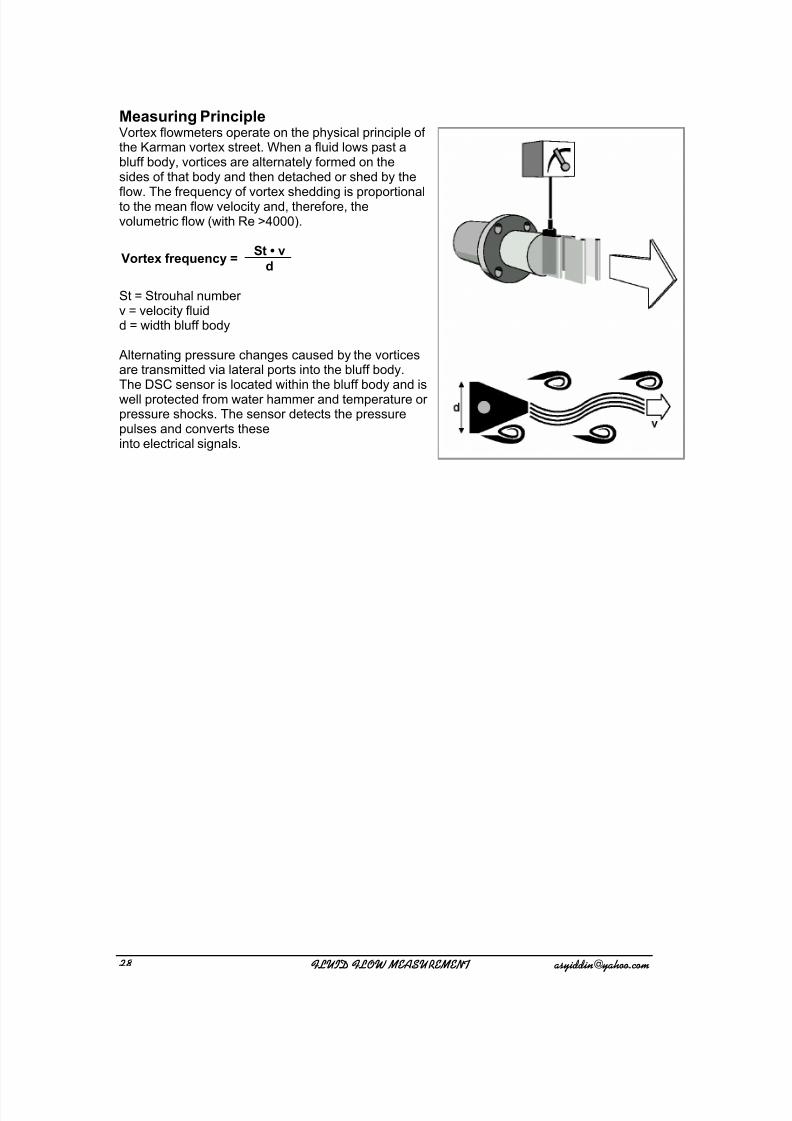
Measuring PrincipleVortex flowmeters operate on the physical principle ofthe Karman vortex street. When a fluid lows past abluff body, vortices are alternately formed on thesides of that body and then detached or shed by the
flow. The frequency of vortex shedding is proportionalto the mean flow velocity and, therefore, thevolumetric flow (with Re >4000).
St • vVortex frequency =
d
St = Strouhal numberv = velocity fluidd = width bluff body
Alternating pressure changes caused by the vorticesare transmitted via lateral ports into the bluff body.The DSC sensor is located within the bluff body and iswell protected from water hammer and temperature orpressure shocks. The sensor detects the pressurepulses and converts theseinto electrical signals.
GMVJE GMPX NFBTVSFNFOU btzjeejoAzbipp/dpn39

7/22/2019 3. FLOW-measurement
http://slidepdf.com/reader/full/3-flow-measurement 33/41
G. Coriolis-Effect meterIt is so called because the instrument employs the Coriolis principle which states that “ A body of
mass M , moving with constant linear velocity, , and subject to an angular velocity,ω, (or
vibrating) experiences an inertial force at right angles to the direction of motion”. It can be
expressed as, Coriolis force = 2M
ων
.(refer to the Appendices page for further reading on Coriolis Effect)
Pickoff coil& magnets
Drive coil
& magnet
Manifold/flowsplitter
junction box
flow tube
case
During operation, a drive coil, located at the centre of the bend in the tube, is energisedperiodically, and causes the sensor tube to oscillate (move up and down) about the support axisas shown in the figure above.
The tube vibrates rapidly at a rate of 40-200 cycles per second, and through a distance of just afew hundredths of a centimeter.
supportaxis
outlet
O
C
I
inletOCI
GMVJE GMPX NFBTVSFNFOU btzjeejoAzbipp/dpn 3:

7/22/2019 3. FLOW-measurement
http://slidepdf.com/reader/full/3-flow-measurement 34/41
When there is no flow, as the tube oscillates around the support axis, points I, C, and O movetogether, reaching the furthest extent of their upward and downward travel at the same time.
When fluid start to flow through the sensor tube, the tube would be seen to twist around the twistaxis, which is perpendicular to the support axis, as shown in the figures below.
O
C
I
inlettwistaxis
outlet
supportaxis
Fluid ReactionForce (inlet)
Fluid ReactiveForce (outlet)
OCI
Points I, C, and O move up and down like before but C would lag somewhat behind O, and Iwould lag somewhat behind C. During the upward half of the cycle (in the right figure), O wouldhave reached the end of its upward travel and begun to move downward before C had reachedits upward limit, and I would not reach its upper limit until C had already begun its downwardmotion.
The lag between I and O, measured in units of time, is referred to as ∆t . This ∆t is directly
proportional to the mass flow rate of the liquid; the larger the measured value of ∆t , the greaterthe mass flow rate. The coriolis sensor will detect this time difference and convert it into astandard signal for the measurement. Voltage is induced at the pickoff coils, located at both sidesof the flow tube, based on Faraday’s Law. These coils will have the same amount of inducedvoltage but with time, they vary with flow rate. This can be shown in the plotted sine-wave graph;
induced voltage (at pickoff coil) vs time as below;
+
Figure : “No flow”
C2
C1
I n d u c e d
v o l t a g e ,
V
Time, t
When there is no flow, the sine waves generated by the inlet and outlet sensors are in phase,since the inlet and outlet sides of the tubes have the same velocity. If superimposed on oneanother, like in the figure above, the sine waves generated by the outlet side pickoff (C1) and inletside pickoff (C2) coincide exactly.
GMVJE GMPX NFBTVSFNFOU btzjeejoAzbipp/dpn41

7/22/2019 3. FLOW-measurement
http://slidepdf.com/reader/full/3-flow-measurement 35/41
C1 C2
+
∆t ∆t
I n d u c e d v
o l t a g e ,
V
Time, t
Figure : “with flow”
When there is flow in the tubes, the sine waves are out of phase. The reason is that the inletsides of the tubes (C2) are lagging behind the outlet sides (C1). The amount of time that elapsesbetween the moment when C1 reaches its peak and the moment when C2 reaches its peak is at
∆t , the value that we know to be proportional to the mass flow rate.
Because each coil and magnet is also a position sensor, the same sine wave signal alsorepresents the periods of oscillation of the tubes, that is, the time taken for the tubes to make acomplete oscillation. This value, τ, provides the basis for density measurement. To represent τ,only one signal is required, as shown in the figure below;
τ - tube period
time
If we begin timing at a zero crossing of the wave and record the elapsed time at the next zerocrossing, we will have the tube period.
Measuring the fluid density…
Coriolis mass-flowmeter also capable of giving the density of the flowing fluid, it operates on thesame principle as the spring and mass assembly as shown in the diagram below.
GMVJE GMPX NFBTVSFNFOU btzjeejoAzbipp/dpn 42

7/22/2019 3. FLOW-measurement
http://slidepdf.com/reader/full/3-flow-measurement 36/41
When the suspended mass is pulled down and released, it will move up and down, its motionboth driven and limited by the spring, until the vibration is damped. The number of completeoscillations per unit time is referred to as the frequency of oscillation. As long as the mass of theobject attached to the spring remains the same, whenever the object is pulled and released, thesystem settles to the same frequency until the movement is damped. This is referred to as theNatural frequency of the system.
If the amount of mass changes, the natural frequency of the system changes;1. If the mass is increased, the natural frequency decreases; the weight and spring make fewer
oscillations per unit of time.
2. If the mass is decreased, the natural frequency increases; the weight and spring make moreoscillations per unit of time.
The frequency of oscillation is inversely proportional to the square root of the mass.
The exact relationship is expressed by the formula;
mK
21f π
where; f = the frequency
m = mass of the tubeK = constant representing the response of the spring
In the coriolis mass-flowmeter, the oscillating tubes correspond to the spring, and the mass of thetubes plus the mass of their contents corresponds to the mass of spring assembly. The drive coilthat oscillates the flow tubes is energised periodically through a feedback circuit so that the tubesare always oscillating at their natural frequency.
Density is inversely proportional to the square of the frequency.
The equation is ;
V
m
Vf 4
K tube
22
π
where; f = the frequency
m = mass of the tubeV = volume of the tubeK = constant representing the response of the spring
Since the volume and mass of the tubes and the spring constant do not change, the density of
the fluid can be derived from the frequency of oscillation of the sensor.
GMVJE GMPX NFBTVSFNFOU btzjeejoAzbipp/dpn43

7/22/2019 3. FLOW-measurement
http://slidepdf.com/reader/full/3-flow-measurement 37/41
The Coriolis Effect in the Coriolis Meter
Consider the following figure;-
Coriolisacceleration
OUTLET
INLET
Support axis
Fluid ReactiveForce
Verticalvelocity
Horizontalvelocity
Fluid ReactiveForce
Figure : Flow tube response to Coriolis Acceleration
The twist produced in the oscillating tube when process fluid is flowing results from the CoriolisEffect. In summary, the motion of the tube induces an acceleration in the fluid – that is, a changein its velocity – flowing in the inlet side of the tube. On the outlet side a deceleration is induced.The fluid resists these changes, and its resistance results in reactive forces that causes the tubeto twist.Fluid entering the tube has a velocity that is virtually horizontal. But the upward motion of theoscillating tube forces the incoming fluid to take on a vertical velocity. Because the curved endof the tube moves through an arc, this vertical velocity increases as the fluid approaches thebend. This change of velocity is the Coriolis Acceleration.
Newton’s Third Law of Motion states that ‘for every action, there is an equal opposite reaction’ . Inthis case, the action is the Coriolis acceleration, and the resulting opposite reaction is thereactive force, proportional to the acceleration, which presses downward and resists the upwardmovement of the inlet side of the tube.
As the fluid rounds the bend in the flow tube and enters the outlet side, it must decelerate.Because of the rotational motion of the tube, each point on the outlet side travels through asmaller distance than a point immediately upstream, so the vertical velocity must steadilydiminish.
Since the direction of the change is now downwards, the reactive force is therefore appliedupwards, actually pushing the outlet side of the tube upward. The reactive forces cause the tubeto twist. The combination of the twist and the motion of the tube driven by the coil results in the
characteristic lag of the inlet side and the lead of the outlet side mentioned earlier.
According to Newton’s Second Law of Motion, ‘the force produced by an object is the product ofits mass and its acceleration, F=ma’, the force that causes the twist in the flow tube is directlyproportional to the mass of the fluid. Therefore, this type of meter is made possible to calculatethe mass of fluid flow.
GMVJE GMPX NFBTVSFNFOU btzjeejoAzbipp/dpn 44

7/22/2019 3. FLOW-measurement
http://slidepdf.com/reader/full/3-flow-measurement 38/41
Straight-Tube Coriolis mass-flowmeter (example Promass 63)The measuring principle is based on the controlled generation of Coriolis forces. These forces arealways present when both translational (straight line) and angular (rotational) movement occursimultaneously.
FC = 2 · ∆m ( v - ω )
where, F C = Coriolis force
∆m = moved mass
ω = angular velocityv = radial velocity in the rotating or oscillating system
The amplitude of the Coriolis force depends on the moving mass, m, its velocity in the systemand thus on the mass flow. Instead of a constant angular velocity, ω, this sensor uses oscillation.
In the sensor, two parallel measuring tubes containing flowing fluid oscillate in antiphase, actinglike a tuning fork. The Coriolis forces produced at the measuring tubes cause a phase shift in thetube oscillations (see illustration):• At zero flow, in other words when the fluid is at a standstill, the two tubes oscillate
in-phase (1).
• Mass flow causes deceleration of the oscillation at the inlet of the tubes (2) and accelerationat the outlet (3).
The phase difference (A-B) increases with increasing mass flow.
Electrodynamic sensors register the tube oscillations at the inlet andoutlet.
System balance is ensured by the antiphase oscillation of the twomeasuring tubes.
The measuring principle operates independently of temperature, pressure, viscosity, conductivityand flow profile.
GMVJE GMPX NFBTVSFNFOU btzjeejoAzbipp/dpn45

7/22/2019 3. FLOW-measurement
http://slidepdf.com/reader/full/3-flow-measurement 39/41
Volume and Density measurementThe measuring tubes are continuously excited at their resonance frequency. A change in themass and thus the density of the oscillating system (comprising measuring tubes and fluid)results in a corresponding, automatic adjustment in the oscillation frequency.
The resonant frequency is thus a function of the density of the medium and enables themicroprocessor to produce a density signal.
The density value obtained in this way can be used in conjunction with the measured mass flowto calculate the volume flow.
The temperature of the measuring tubes is also determined in order to calculate thecompensation factor due to temperature effects.
GMVJE GMPX NFBTVSFNFOU btzjeejoAzbipp/dpn 46

7/22/2019 3. FLOW-measurement
http://slidepdf.com/reader/full/3-flow-measurement 40/41
H. Rotameter (Variable Area Flow Meter)Rotameters are a common type of variable area flow meter. Besides being as a standalonemeter, they can also be found on the level bubbler system, and on the caissons.
F
LOW
FL
OW
float
Scalemarkings
float
The rotameter consists of a tapered glass metering tube that has a float inside that is free tomove up and down. A scale is engraved on the outside the tube in flow units. As the flow variesthe float rises and falls and the flow value can be read off against the glass. The flow has to passthrough the gap between the float and the walls of the tube, so there is a pressure drop.
Since the walls are tapered and the gap between the float and tube walls increases as the floatrises, the pressure drop decreases as the float moves up the tube. The float moves until the fluidpressure balances the weight of the float.
The lifting force on the float is a result from the flow velocity of the fluid against the weight of thefloat.
The greater the flow rate, the greater the pressure difference for a particular gap, so the floatmoves to a position depending on the rate of flow. If the glass were not tapered, the float wouldnot give a meaningful reading.
Accuracy of this measurement is around 3-5%.
GMVJE GMPX NFBTVSFNFOU btzjeejoAzbipp/dpn47
7/22/2019 3. FLOW-measurement
http://slidepdf.com/reader/full/3-flow-measurement 41/41
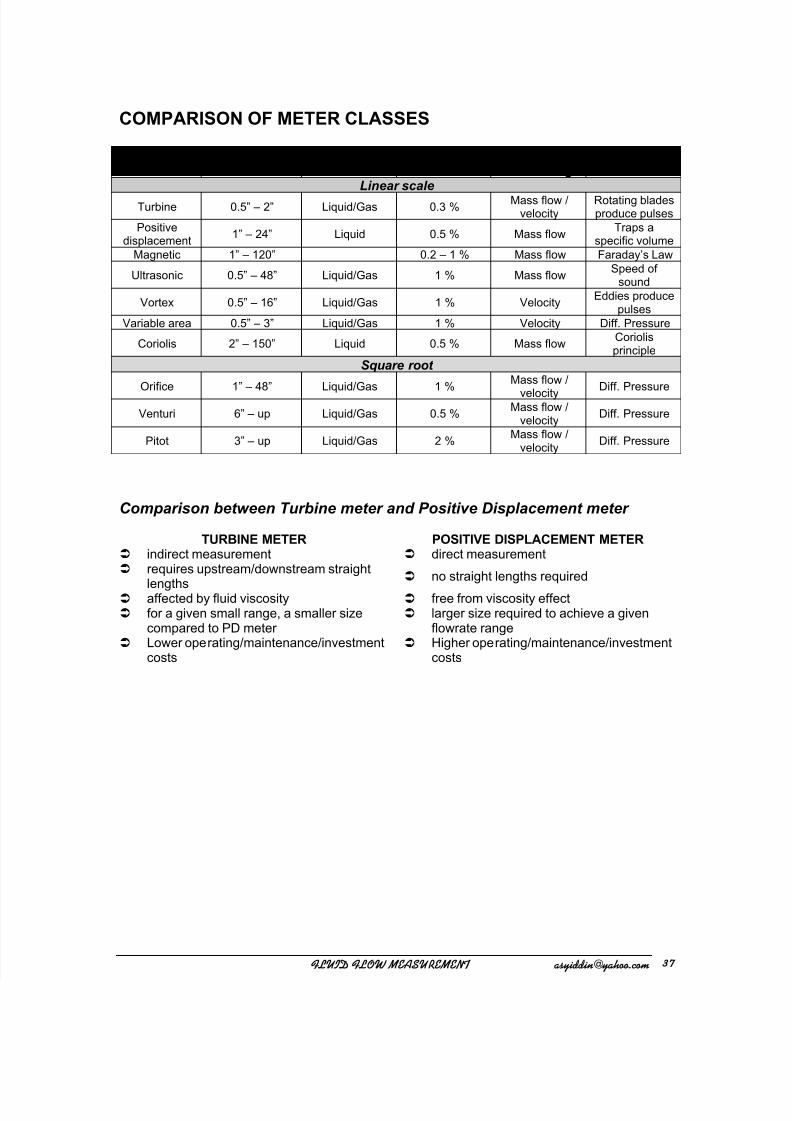
COMPARISON OF METER CLASSES
Flowmeter Pipe/size Gas/Liquid AccuracyIdeal for
measuringPrinciple
Linear scale
Turbine 0.5” – 2” Liquid/Gas 0.3 % Mass flow /velocity
Rotating bladesproduce pulses
Positivedisplacement
1” – 24” Liquid 0.5 % Mass flowTraps a
specific volumeMagnetic 1” – 120” 0.2 – 1 % Mass flow Faraday’s Law
Ultrasonic 0.5” – 48” Liquid/Gas 1 % Mass flowSpeed of
sound
Vortex 0.5” – 16” Liquid/Gas 1 % VelocityEddies produce
pulsesVariable area 0.5” – 3” Liquid/Gas 1 % Velocity Diff. Pressure
Coriolis 2” – 150” Liquid 0.5 % Mass flowCoriolisprinciple
Square root
Orifice 1” – 48” Liquid/Gas 1 %Mass flow /
velocityDiff. Pressure
Venturi 6” – up Liquid/Gas 0.5 %Mass flow /
velocityDiff. Pressure
Pitot 3” – up Liquid/Gas 2 %Mass flow /
velocityDiff. Pressure
Comparison between Turbine meter and Positive Displacement meter
TURBINE METER POSITIVE DISPLACEMENT METER indirect measurement direct measurement requires upstream/downstream straight
lengths
no straight lengths required
affected by fluid viscosity free from viscosity effect for a given small range, a smaller size
compared to PD meter larger size required to achieve a given
flowrate range Lower operating/maintenance/investment
costs Higher operating/maintenance/investment
costs