24x7 power for all Lakshadweep...
74
24X7 POWER FOR ALL LAKSHADWEEP ISLANDS A Joint Initiative of Government of India and Administration of UT of Lakshadweep
Transcript of 24x7 power for all Lakshadweep...

24X7 POWER FOR ALL LAKSHADWEEP ISLANDS
A Joint Initiative of Government of India and Administration of UT of Lakshadweep
Government of India
Piyush Goyal
Minister of State (Independent Charge) for Power, Coal, New & Renewable Energy
Foreword
Electricity consumption is one of the most important indices that
decide the development level of a nation. The Government of India is
committed to improving the quality of life of its citizens through
higher electricity consumption. Our aim is to provide each household
access to electricity, round the clock. The ‘Power for All’ programme
is a major step in this direction.
Union Territory of Lakshadweep is an important part of India
situated in Arabian Sea and is having main source of power through
diesel generation. UT is already providing round the clock power
supply in all the inhabited islands but would have to increase the
share of renewable energy in the Islands to increase the energy mix.
This joint initiative of Government of India and Administration of
Lakshadweep aims to further enhance the satisfaction levels of the
consumers and improve the quality of life of people through 24x7
power supply. This would lead to rapid economic development of the
state in primary, secondary & tertiary sectors resulting in inclusive
development.
I compliment the Administration of U.T. of Lakshadweep and wish
them all the best for implementation of this programme and bringing
uninterrupted quality power to each household, and other energy
consuming establishments in the Lakshadweep Islands.

Lakshadweep
Administration
Shri Vijay Kumar, IAS
Administrator, UT of Lakshadweep
Foreword
Power is the lifeline of any growing economy and the availability of
reliable and uninterrupted power supply is a crucial determinant for
economic growth. I would like to thank the Ministry of Power, Govt.
of India for collaborating with the UT of Lakshadweep for
implementing the scheme - "Power for All".
The Lakshadweep Power Department is already supplying power
round the clock across all inhabited islands and is fully committed to
undertake all measures for infrastructural upgradation and measures
for efficiency improvements in Generation and Distribution system.
It is our vision to transform Lakshadweep into a model territory with
an efficient power supply framework and best in industry standard
efficiency parameters. Equally, we are committed to supplement our
generating capacity through renewable energy sources including
harnessing solar power.
Power for all programme provides us a blueprint and a management
tool for undertaking comprehensive reforms in the power sector
including the institutional arrangement and financial plan. I am
confident that in the next few years, we shall be able to achieve the
key objectives set out for us.

Government of India
UT of Lakshadweep Administration
Joint Statement
Lakshadweep is one of the Union Territory
selected for "Power for ALL" (PFA)
programme. This Programme will be
implemented by Administration of
Lakshadweep with active support of
Government of India, Ministry of Power.
The objective of the programme is to supply
24x7 quality, reliable, uninterrupted and
affordable power supply to all consumers
within the territory. All unconnected
households will be provided electricity as the
goal of 100% electrification.
The Administration of UT of Lakshadweep is
giving highest priority to power sector of the
territory and has created adequate
infrastructure to strengthen the power
generation, transmission and distribution
network of the territory.
The Administration of Lakshadweep would
ensure that all the necessary steps outlined in
the PFA document are taken up in terms of
capacity addition, strengthening the required
Joint Secretary
Ministry of Power (GoI)
distribution network, encouraging
renewables & energy efficiency measures,
implementation of pre-paid metering,
reduction of AT & C losses and following good
governance practices in implementation of all
Central and State Government schemes.
Government of India (GOI) would supplement
the efforts of Union Territory through various
interventions.
It is envisaged to cover entire territory under
PFA programme in a phased manner and
provide affordable, reliable and round the
clock power supply to all consumers by FY 17
onwards.
The Central Government and Administration
of UT of Lakshadweep would meet regularly to
review the progress of the programme over
the next 3 years and would strive to achieve
the objectives of the programme by taking the
necessary steps as envisaged in the PFA
document.
Shri Vijay Kumar, IAS
Administrator,
UT of Lakshadweep

EXECUTIVE SUMMARY
24x7- Power for All (24x7 PFA) is a Joint
Initiative of Government of India (GoI) and
UT Administration with the objective to
provide 24x7 power available to all
households, industries, commercial
businesses, public needs & any other
electricity consuming entities and adequate
power to agriculture farm holdings by FY 19.
This roadmap document aims to meet the
above objectives for the UT of Lakshadweep.
The power department of the UT is
integrated utility having functions of
generation, and distribution. As per
department records, presently there are a
total of 17,761 domestic consumers, which
includes some of the households having
multiple connections.
The UT has per capita annual consumption
of 657 units in FY 15, which is expected to
rise to 962 units in FY 19.
CONNECTING THE UNCONNECTED
As per available records, there are no un-
electrified households in the UT at present.
FEEDER SEGREGATION
Keeping in view of the negligible sales in
agriculture category, the UT does not have
any feeder segregation and also has not
estimated any expenditure on this account.
24 X 7 SUPPLY
The UT is already supplying 24 hours supply
to all domestic households.
GROWTH IN DEMAND
Since growth in the demand in islands is
dependent on various factors which are very
different from the mainland, along with the
fact that the islands are not physically and
electrically connected, historical growth of
individual islands have been considered to
arrive at the demand of the Lakshadweep
Islands as a whole.
For assessing the Island wise energy
requirement, the daily household
consumption for domestic consumers has
been computed and increased with at
reasonable CAGR to arrive at the daily
household consumption up to FY 19 and
accordingly, the energy requirement for
domestic consumers are computed.
For other than domestic consumers,
individual category-wise growth rate
equivalent to the 5 year CAGR has been
considered for estimating the energy
requirement other than domestic sectors.
However separate suitable growth rate has
been assumed in categories where there has
been abnormal growth due to various one-
off reasons.
The maximum demand is projected to grow
from present 8.24 MW in FY 15 to 10.85 MW
in FY 19 and the average daily household
consumption is projected to rise from 4.73
units in FY 16 to 5.50 units in FY 19.
SUPPLY ADEQUACY
The department has planned to install
additional DG sets totaling up to 5.80 MW
which will take the installed capacity of DG
based generation to 26.82 MW and another
6.80 MW of Solar SPVs. With planned
addition of DG sets and large scale
installation of Solar SPVs, the department
has adequate capacity available to meet the
increasing demand.
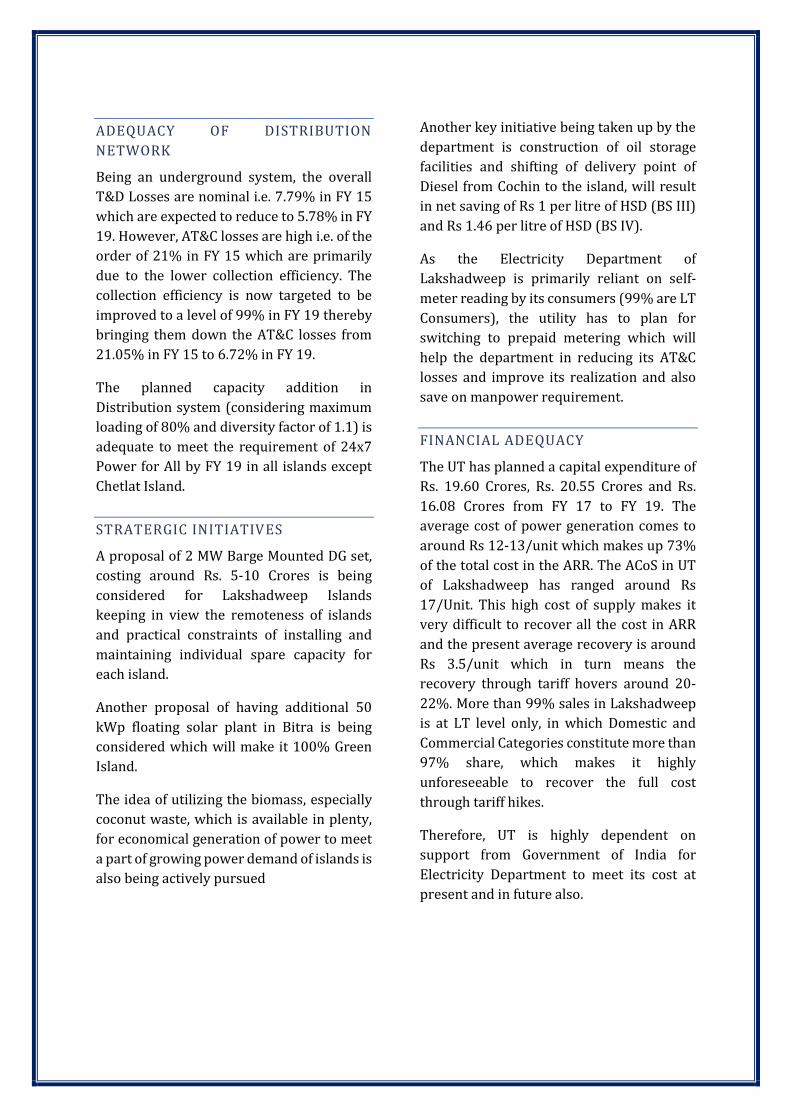
ADEQUACY OF DISTRIBUTION
NETWORK
Being an underground system, the overall
T&D Losses are nominal i.e. 7.79% in FY 15
which are expected to reduce to 5.78% in FY
19. However, AT&C losses are high i.e. of the
order of 21% in FY 15 which are primarily
due to the lower collection efficiency. The
collection efficiency is now targeted to be
improved to a level of 99% in FY 19 thereby
bringing them down the AT&C losses from
21.05% in FY 15 to 6.72% in FY 19.
The planned capacity addition in
Distribution system (considering maximum
loading of 80% and diversity factor of 1.1) is
adequate to meet the requirement of 24x7
Power for All by FY 19 in all islands except
Chetlat Island.
STRATERGIC INITIATIVES
A proposal of 2 MW Barge Mounted DG set,
costing around Rs. 5-10 Crores is being
considered for Lakshadweep Islands
keeping in view the remoteness of islands
and practical constraints of installing and
maintaining individual spare capacity for
each island.
Another proposal of having additional 50
kWp floating solar plant in Bitra is being
considered which will make it 100% Green
Island.
The idea of utilizing the biomass, especially
coconut waste, which is available in plenty,
for economical generation of power to meet
a part of growing power demand of islands is
also being actively pursued
Another key initiative being taken up by the
department is construction of oil storage
facilities and shifting of delivery point of
Diesel from Cochin to the island, will result
in net saving of Rs 1 per litre of HSD (BS III)
and Rs 1.46 per litre of HSD (BS IV).
As the Electricity Department of
Lakshadweep is primarily reliant on self-
meter reading by its consumers (99% are LT
Consumers), the utility has to plan for
switching to prepaid metering which will
help the department in reducing its AT&C
losses and improve its realization and also
save on manpower requirement.
FINANCIAL ADEQUACY
The UT has planned a capital expenditure of
Rs. 19.60 Crores, Rs. 20.55 Crores and Rs.
16.08 Crores from FY 17 to FY 19. The
average cost of power generation comes to
around Rs 12-13/unit which makes up 73%
of the total cost in the ARR. The ACoS in UT
of Lakshadweep has ranged around Rs
17/Unit. This high cost of supply makes it
very difficult to recover all the cost in ARR
and the present average recovery is around
Rs 3.5/unit which in turn means the
recovery through tariff hovers around 20-
22%. More than 99% sales in Lakshadweep
is at LT level only, in which Domestic and
Commercial Categories constitute more than
97% share, which makes it highly
unforeseeable to recover the full cost
through tariff hikes.
Therefore, UT is highly dependent on
support from Government of India for
Electricity Department to meet its cost at
present and in future also.

TABLE OF CONTENTS
CHAPTER 1: INTRODUCTION ................................................................................................................. 1
CHAPTER 2: FACTS ABOUT LAKSHADWEEP ................................................................................... 3
CHAPTER 3: CONSUMPTION PATTERN AND ELECTRIFICATION STATUS .......................... 4
CHAPTER 4: DEMAND AND SUPPLY SCENARIO ............................................................................. 6
CHAPTER 5: POWER SUPPLY –AGATTI ISLAND ............................................................................. 7
CHAPTER 6: POWER SUPPLY –AMINI ISLAND .............................................................................. 10
CHAPTER 7: POWER SUPPLY –ANDROTH ISLAND ..................................................................... 13
CHAPTER 8: POWER SUPPLY –BITRA ISLAND .............................................................................. 16
CHAPTER 9: POWER SUPPLY –CHETLAT ISLAND ....................................................................... 19
CHAPTER 10: POWER SUPPLY –KADMAT ISLAND ................................................................... 22
CHAPTER 11: POWER SUPPLY –KALPENI ISLAND.................................................................... 25
CHAPTER 12: POWER SUPPLY –KAVARATTI .............................................................................. 28
CHAPTER 13: POWER SUPPLY –KILTAN ISLAND ...................................................................... 31
CHAPTER 14: POWER SUPPLY –MINICOY ISLAND.................................................................... 34
CHAPTER 15: OVERALL SCENARIO ................................................................................................. 37
CHAPTER 16: GREEN ISLAND INITIATIVES ................................................................................. 38
CHAPTER 17: ENERGY EFFICIENCY PROGRAM .......................................................................... 40
CHAPTER 18: STRATERGIC INTIATIVES ....................................................................................... 42
CHAPTER 19: FINANCIAL VIABILITY OF THE POWER DEPARTMENT ............................. 45
CHAPTER 20: OTHER INITIATIVES .................................................................................................. 46
CHAPTER 21: YEAR WISE ROLL OUT PLAN ................................................................................. 50
CHAPTER 22: FUND REQUIREMENT ............................................................................................... 53
ANNEXURES ................................................................................................................................................... 54

24x7 Power For All (Lakshadweep Islands) 1
CHAPTER 1: INTRODUCTION
Power sector is a critical infrastructure
element for growth of an economy. The
availability of reliable, quality and affordable
power is vital for rapid growth in
agriculture, industry and for overall
economic development of a state. For this an
efficient, resilient and financially healthy
power sector is an essential requirement for
growth of a state and economic
empowerment of the common man.
Under the Indian Constitution, electricity is a
concurrent subject. As per Electricity Act
2003, it is the duty of a distribution licensee
to develop and maintain an efficient,
coordinated and economical distribution
system in the mandated area of supply as
well as to supply electricity in accordance
with the provisions contained in the Act. The
State Electricity Regulatory Commission
(SERC), as per the provisions of the act,
specifies and enforces the standards with
respect to quality and reliability of supply by
licensees and also monitors the performance
of distribution companies (Licensees) on the
basis of notified performance standards.
OBJECTIVES AND KEY OUTCOMES OF
THE 24X7 POWER FOR ALL
INITIATIVE
The 24x7 Power for All (24x7 PFA) is a Joint
Initiative of Government of India (GoI) and
Administration of Lakshadweep with the
objective to make 24x7 power available to all
households, commercial businesses, public
needs, any other electricity consuming
entity and adequate power to agriculture
farm holdings.
Towards this goal the 24x7 PFA initiative
seeks to:
i. Ensure reliable 24x7 supply to
consumers within a period of four years
of commencement of the program. The
hours of supply for agriculture
consumers will be decided by the State
Government as per requirement.
ii. Ensure that all unconnected households
are provided access to electricity in a time
bound manner in the next three years i.e.
by end of FY 19.
iii. Ensure adequate capacity addition
planning and tie ups for power from
various sources at affordable price to
meet the projected power demand in
future.
iv. Strengthen the transmission and
distribution network to cater to the
expected growth in demand of existing as
well as future consumers.
v. Assess the financial measures including
optimizing investments and undertaking
necessary balance sheet restructuring
measures to ensure liquidity in the
finances of the utility.
vi. Put in place a strategy to ensure
reduction of AT&C losses as per the
agreed loss reduction trajectory and
methodology and steps required to be
taken at every level of distribution.
vii. Identify steps for implementation and
adoption of modern technologies to
monitor reliability of supply.
viii. Identify steps for monitoring timely
commissioning of various generating
plants and transmission and distribution
infrastructure to meet the expected
growth in demand.
ix. To take measures for meeting the

24x7 Power For All (Lakshadweep Islands) 2
performance standards as laid down by
SERC.
This document is an action plan has been
drawn to achieve the above aims and
objectives. The plan will be executed by
the Administration of Lakshadweep with
the support of Government of India,
wherever necessary, as per their
approved plans, schemes and policies.
METHODOLOGY FOR PREPARATION
OF THE ACTION PLAN FOR 24X7
POWER FOR ALL
The plan aims at the following:
(1) bridging the gap between the demand and supply for the already identified/registered consumers and other consuming entities,
(2) connecting the unconnected households and unconnected farm holdings.
Accordingly the methodology adopted to
prepare the ‘Action Plan’ for 24x7 PFA
includes inter-alia:
1) Projection of average per day
consumption of rural and urban
households based on respective
historical compounded annual growth
rates (CAGR) during the past five years.
2) Projection of demand of commercial,
industrial and agriculture consumers
based again on past data and historical
CAGR recorded during the past five years.
3) Assess the power requirement of un-
electrified households and draw up a
time bound plan for electrification of all
households.
4) Project the annual energy requirement
and maximum demand by aggregating
the requirement of all consumer
categories and applying an appropriate
load factor.
5) Draw up a broad plan to meet power
demand in future through
State’s own upcoming generation
resources.
Allocation from upcoming central
sector power plants
Quantum for additional procurement
required.
6) Assess the additional energy requirement
for providing 24x7 power supply to all
households in the state as well as to other
consumer categories and determine
financial implications on utilities for
procuring additional energy and its
implication on tariff.
7) Assess the adequacy of the network - both
inter-state and intra state transmission as
well as distribution so as to meet the
increased / expected / projected power
requirement of all consumer categories of
the state.
8) Conduct sensitivity analysis for cost of
service and resulting financial gap under
multiple scenarios, namely, tariff hike,
reduction in power procurement cost and
increase in interest and moratorium
period and AT&C loss reduction, etc.
9) Set monitorable targets to achieve the
goal of 24x7 Power for All in a cost
effective manner to the consumers of the
state.

24x7 Power For All (Lakshadweep Islands) 3
CHAPTER 2: FACTS ABOUT LAKSHADWEEP
Key Facts
Constituted on 21st January 1972 As per 2011 Census Total Area - Rural - Urban
30 Sq. Km - 8.05 - 21.95
Density of Population 2013 people/Kms
Total islands -Inhabited Islands
36 - 10
Population - Rural - Urban
64,473 - 14,141 - 50,332
Lakshadweep is the tiniest union territory of India and is only coral island chain in the country.
This archipelago consists of 36 islands including 12 atolls, 3 reefs and 5 submerged banks. The
islands have a total area of 32 sq.km and the lagoons enclosed by the atolls cover an area of 4200
sq.km. Its territorial waters extend to 20,000 sq. km and Exclusive Economic Zone (EEZ) to
4,00,000 sq.km. Only 10 of these islands namely, Agatti, Amini, Andrott, Bitra, Chetlat, Kadmat,
Kalpeni, Kavaratti, Kiltan and Minicoy are inhabited. Kavaratti is the administrative headquarters
of the union territory. The islands are restricted area and permit from the Administration is
required to visit the islands.
Electrification of Lakshadweep Islands was initiated during the Second Five Year Plan. Minicoy
was the first island electrified in 1962 followed by Kavaratti Island in 1964, then Amini and
Andrott in 1965 and 1966 respectively. Bitra was the last island electrified in 1982. Initially,
power supply was limited to 6 - 12 hours till 1982-83 except in Kavaratti where 24 hours power
supply was provided from 1964 itself. Round the clock power supply is provided in all the Islands
since 1983.
Lakshadweep Electricity Department generates and distributes electricity to consumers round
the clock in the entire Lakshadweep Islands and also performs following functions:
Internal electrification of Govt. buildings
Implementation of non-conventional energy source projects
The power sector of state is regulated by Joint Electricity Regulatory Commission (JERC) for the
State of Goa and Union Territories.

24x7 Power For All (Lakshadweep Islands) 4
CHAPTER 3: CONSUMPTION PATTERN AND
ELECTRIFICATION STATUS
ELECTRIFICATION STATUS AND PER-
CAPITA CONSUMPTION
The population of Lakshadweep Islands has
grown from 60,650 in 2001 to 64,473 in
2011 at a decadal CAGR of 0.61%. This
growth rate has been considered for
estimating the population beyond 2011.
Based on the annual energy availability from
FY 11 to FY 15, the per-capita consumption
of electricity in the period has been as shown
below:
Figure 1: Per-Capita Consumption of
Electricity (kWh per person) in recent years
STATUS OF ELECTRIFICATION AND
PROJECTION OF HOUSEHOLDS FOR
FY 14
District-wise electrification in urban and
rural areas is detailed in Table 57 in
Annexure-1.
The summary of electrified and un-
electrified households as per 2001 and 2011
census and projections for FY 14 based on
CAGR for past 10 years is tabulated below:
Table 1: Projection of households based on
Census 2001 and 2011
Particulars Electrified
Households
Un-Electrified
Households
Total Households
Total
2001 9,213 27 9,240
in % 99.71% 0.29% 100.00%
2011 10,669 34 10,703
in % 99.68% 0.32% 100.00%
CAGR 1.48% 2.33% 1.48% FY 15 (Projected Households)
12,839 42 12,881
Rural
2001 5,337 14 5,351
in % 99.74% 0.26% 100.00%
2011 2,517 6 2,523
in % 99.76% 0.24% 100.00%
CAGR -7.24% -8.12% -7.24% FY 15 (Projected Households)
1,863 4 1,868
Urban
2001 3,876 13 3,889
in % 99.67% 0.33% 100.00%
2011 8,152 28 8,180
in % 99.66% 0.34% 100.00%
CAGR 7.72% 7.97% 7.72% FY 15 (Projected Households)
10,975 38 11,013
From above it is inferred that:
%age of rural households has declined in
past decade from 57.91% to 23.57% while
the number of urban households has
increased from 42.09% to 76.43% during
this period.
There is almost 100% electrification in the
Lakshadweep islands.
The above projected figures, derived by
extrapolating Census 2011 data, do not
match with the records of the Electricity
Department of UT of Lakshadweep for FY 15
which shows that presently there are a total
of 17,761 domestic consumers.

24x7 Power For All (Lakshadweep Islands) 5
This anomaly/discrepancy in figures was
discussed with Electricity Department of UT
of Lakshadweep wherein it was
communicated that the some of the
households have multiple connections.
Since growth in the demand in islands is
dependent on various factors which are very
different from the mainland, along with the
fact that the islands are not electrically
connected, historical growth of individual
islands have been considered to arrive at the
demand of the Lakshadweep Islands as a
whole.
Accordingly, the demand projections for the
state have been worked out in the next
chapter.
24x7 Power For All (Lakshadweep Islands) 6
CHAPTER 4: DEMAND AND SUPPLY SCENARIO
PRESENT POWER SUPPLY
POSITION
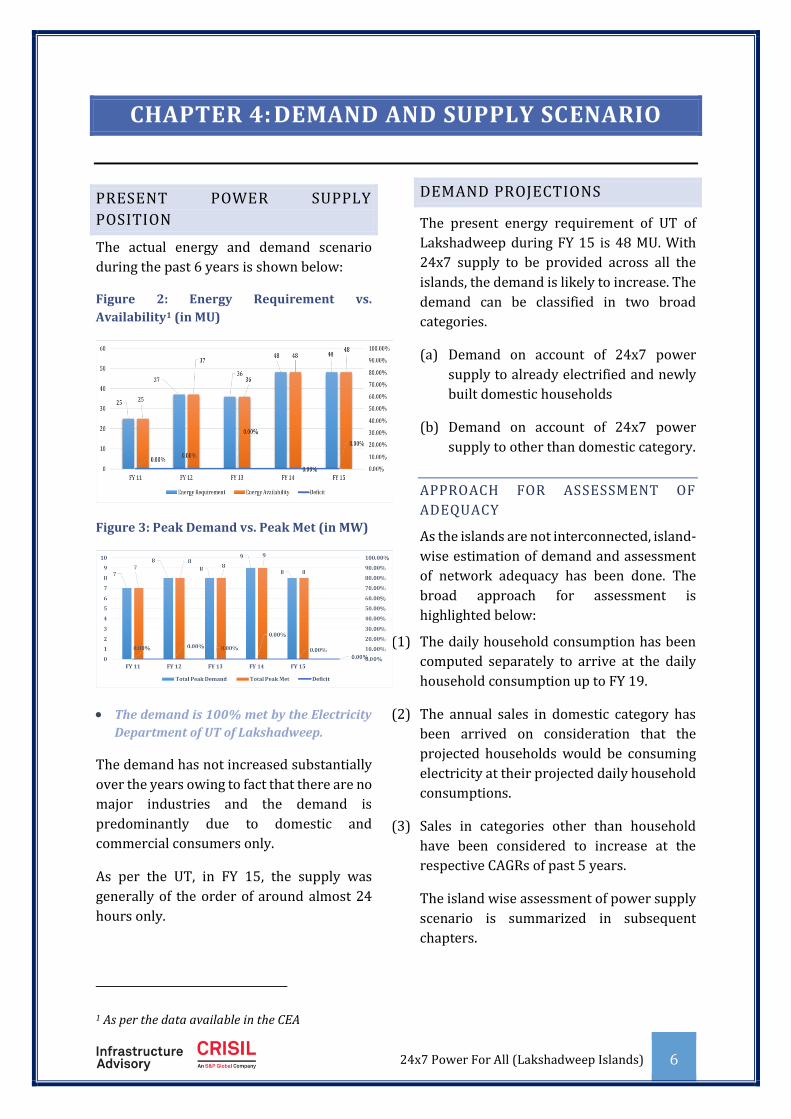
The actual energy and demand scenario
during the past 6 years is shown below:
Figure 2: Energy Requirement vs.
Availability1 (in MU)
Figure 3: Peak Demand vs. Peak Met (in MW)
The demand is 100% met by the Electricity
Department of UT of Lakshadweep.
The demand has not increased substantially
over the years owing to fact that there are no
major industries and the demand is
predominantly due to domestic and
commercial consumers only.
As per the UT, in FY 15, the supply was
generally of the order of around almost 24
hours only.
1 As per the data available in the CEA
DEMAND PROJECTIONS
The present energy requirement of UT of
Lakshadweep during FY 15 is 48 MU. With
24x7 supply to be provided across all the
islands, the demand is likely to increase. The
demand can be classified in two broad
categories.
(a) Demand on account of 24x7 power
supply to already electrified and newly
built domestic households
(b) Demand on account of 24x7 power
supply to other than domestic category.
APPROACH FOR ASSESSMENT OF
ADEQUACY
As the islands are not interconnected, island-
wise estimation of demand and assessment
of network adequacy has been done. The
broad approach for assessment is
highlighted below:
(1) The daily household consumption has been
computed separately to arrive at the daily
household consumption up to FY 19.
(2) The annual sales in domestic category has
been arrived on consideration that the
projected households would be consuming
electricity at their projected daily household
consumptions.
(3) Sales in categories other than household
have been considered to increase at the
respective CAGRs of past 5 years.
The island wise assessment of power supply
scenario is summarized in subsequent
chapters.
24x7 Power For All (Lakshadweep Islands) 7
CHAPTER 5: POWER SUPPLY –AGATTI ISLAND
ABOUT AGATTI
The Agatti Island is at a distance of 459 km
(248 nautical miles) from Kochi and is
located the west of Kavaratti Island. It lies
between 10°48' and 10°53' N latitude and
72°09' and 7°13' E longitude, having an area
of 3.84 square km, with a maximum length of
10 km and width of 1 km. It has a north-east,
south-west trend with a long tail on the
south. The lagoon area of this island is 17.50
square km.
DEMAND PROJECTIONS
DETERMINATION OF CONSUMPTION
OF DOMESTIC CONSUMERS
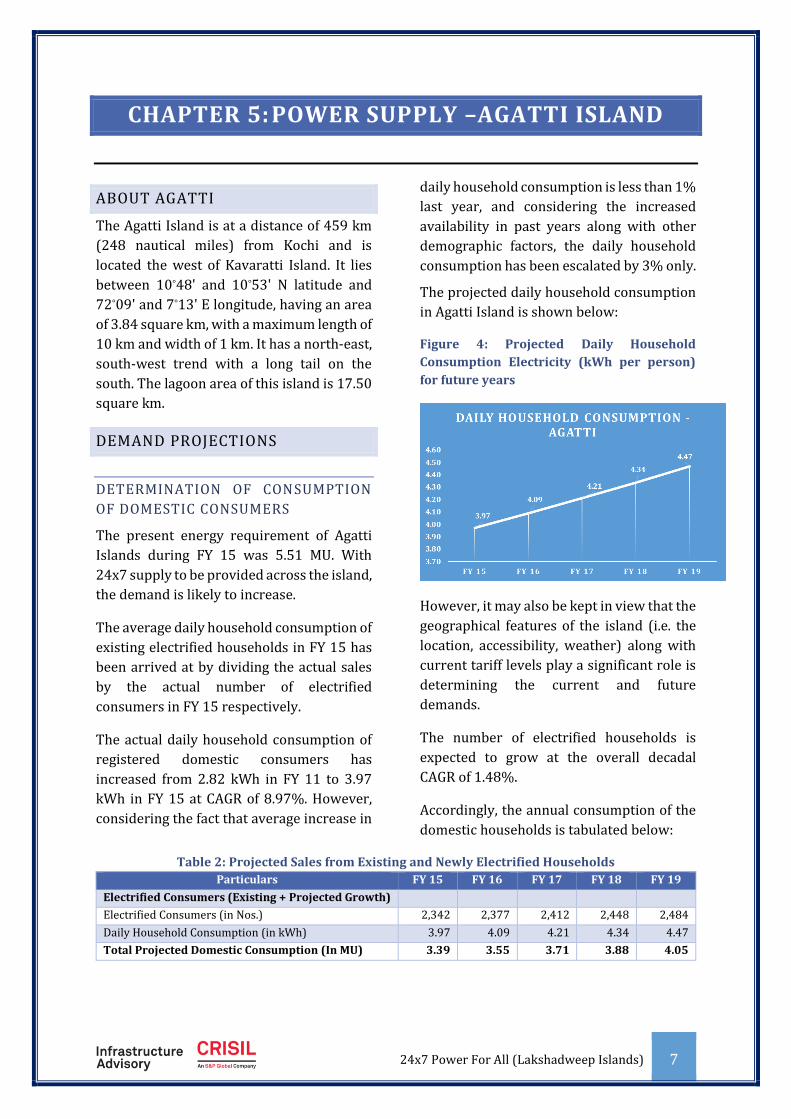
The present energy requirement of Agatti
Islands during FY 15 was 5.51 MU. With
24x7 supply to be provided across the island,
the demand is likely to increase.
The average daily household consumption of
existing electrified households in FY 15 has
been arrived at by dividing the actual sales
by the actual number of electrified
consumers in FY 15 respectively.
The actual daily household consumption of
registered domestic consumers has
increased from 2.82 kWh in FY 11 to 3.97
kWh in FY 15 at CAGR of 8.97%. However,
considering the fact that average increase in
daily household consumption is less than 1%
last year, and considering the increased
availability in past years along with other
demographic factors, the daily household
consumption has been escalated by 3% only.
The projected daily household consumption
in Agatti Island is shown below:
Figure 4: Projected Daily Household
Consumption Electricity (kWh per person)
for future years
However, it may also be kept in view that the
geographical features of the island (i.e. the
location, accessibility, weather) along with
current tariff levels play a significant role is
determining the current and future
demands.
The number of electrified households is
expected to grow at the overall decadal
CAGR of 1.48%.
Accordingly, the annual consumption of the
domestic households is tabulated below:
Table 2: Projected Sales from Existing and Newly Electrified Households
Particulars FY 15 FY 16 FY 17 FY 18 FY 19
Electrified Consumers (Existing + Projected Growth)
Electrified Consumers (in Nos.) 2,342 2,377 2,412 2,448 2,484
Daily Household Consumption (in kWh) 3.97 4.09 4.21 4.34 4.47
Total Projected Domestic Consumption (In MU) 3.39 3.55 3.71 3.88 4.05

24x7 Power For All (Lakshadweep Islands) 8
DETERMINATION OF CONSUMPTION
OF OTHER CONSUMERS
For projection of sales for FY 16 to FY 19, the
CAGR of previous 5 years has been
considered for all categories.
Based on this, the category-wise sales is as
per table below:
Table 3: Projected Category-wise Sales (In
MU)
Categories CAGR Projections
Considered FY 16 FY 17 FY 18 FY 19
Domestic 3.55 3.71 3.88 4.05 Commercial 18.36% 1.96 2.32 2.74 3.25 Industrial 3.00% 0.05 0.05 0.05 0.05 Public Lighting 1.08% 0.10 0.10 0.10 0.10 Temporary 10.72% 0.01 0.01 0.01 0.01
Grand Total 5.66 6.18 6.78 7.46
ENERGY AND DEMAND REQUIREMENT
MoP has not specified any loss trajectory for
AT&C loss reduction for UT of Lakshadweep.
Thus a reasonable reduction in line with
JERC targets has been taken into account for
preparing this roadmap document which is
shown in Figure 5. A reduction of 0.1% every
year in the T&D losses has been considered
in Agatti Island.
Based on the loss reduction trajectory as
above, the energy and demand requirement
for the future years is tabulated in Table 4
below:
Figure 5: Projected Loss Reduction
Trajectory- Agatti Island
Table 4: Energy Requirement (In MU) and Peak Demand (in MW) – Agatti Island
Particulars Energy and Demand Scenario
FY 16 FY 17 FY 18 FY 19
Sale within State 5.66 6.18 6.78 7.46
Distribution Losses 5.53% 5.43% 5.33% 5.23%
Total Energy Requirement within Island 5.99 6.54 7.16 7.88
Load Factor 64.18% 64.18% 64.18% 64.18%
Maximum Demand – Agatti Island 1.07 1.16 1.27 1.40
As seen from the above, the maximum
demand requirement of the Agatti Islands is
projected to increase from 0.98 MW in FY 15
to 1.40 MW in FY 19 assuming an
unchanged annual load factor of 64.18% as
per actual information for FY 15.
Adoption of various energy efficiency
measures like energy efficient lighting (use
of LEDs) would also help in reducing the
peak demand of the state.
GENERATION PLAN
The total installed capacity in Agatti Island
as on 31st March 2015 is 2.55 MW which
included 2.45 MW of DG Sets and 0.10 MW of
SPV plant. Further 1.75 MW capacity
addition (0.75 MW DG and 1 MW solar) has
been planned to be added by FY 19.
24x7 Power For All (Lakshadweep Islands) 9
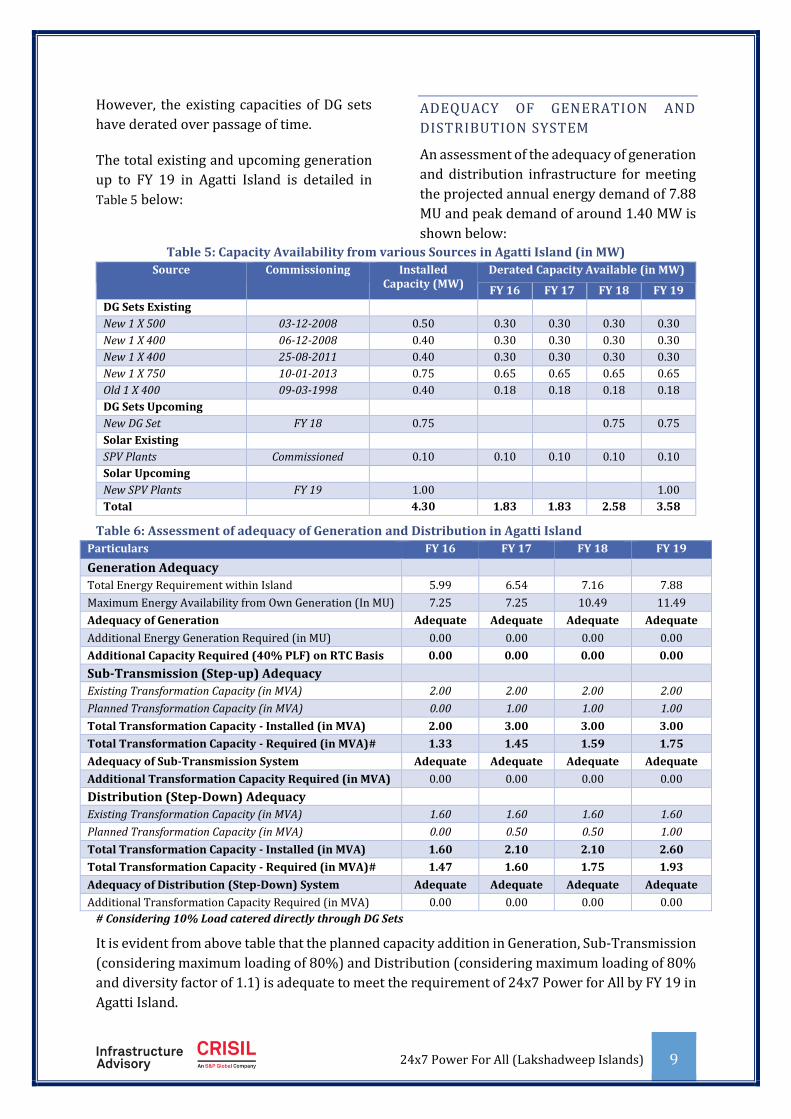
However, the existing capacities of DG sets
have derated over passage of time.
The total existing and upcoming generation
up to FY 19 in Agatti Island is detailed in
Table 5 below:
ADEQUACY OF GENERATION AND
DISTRIBUTION SYSTEM
An assessment of the adequacy of generation
and distribution infrastructure for meeting
the projected annual energy demand of 7.88
MU and peak demand of around 1.40 MW is
shown below:Table 5: Capacity Availability from various Sources in Agatti Island (in MW)
Source Commissioning Installed Capacity (MW)
Derated Capacity Available (in MW)
FY 16 FY 17 FY 18 FY 19
DG Sets Existing
New 1 X 500 03-12-2008 0.50 0.30 0.30 0.30 0.30
New 1 X 400 06-12-2008 0.40 0.30 0.30 0.30 0.30
New 1 X 400 25-08-2011 0.40 0.30 0.30 0.30 0.30
New 1 X 750 10-01-2013 0.75 0.65 0.65 0.65 0.65
Old 1 X 400 09-03-1998 0.40 0.18 0.18 0.18 0.18
DG Sets Upcoming
New DG Set FY 18 0.75 0.75 0.75
Solar Existing
SPV Plants Commissioned 0.10 0.10 0.10 0.10 0.10
Solar Upcoming
New SPV Plants FY 19 1.00 1.00
Total 4.30 1.83 1.83 2.58 3.58
Table 6: Assessment of adequacy of Generation and Distribution in Agatti Island
Particulars FY 16 FY 17 FY 18 FY 19
Generation Adequacy
Total Energy Requirement within Island 5.99 6.54 7.16 7.88
Maximum Energy Availability from Own Generation (In MU) 7.25 7.25 10.49 11.49
Adequacy of Generation Adequate Adequate Adequate Adequate
Additional Energy Generation Required (in MU) 0.00 0.00 0.00 0.00
Additional Capacity Required (40% PLF) on RTC Basis 0.00 0.00 0.00 0.00
Sub-Transmission (Step-up) Adequacy
Existing Transformation Capacity (in MVA) 2.00 2.00 2.00 2.00
Planned Transformation Capacity (in MVA) 0.00 1.00 1.00 1.00
Total Transformation Capacity - Installed (in MVA) 2.00 3.00 3.00 3.00
Total Transformation Capacity - Required (in MVA)# 1.33 1.45 1.59 1.75
Adequacy of Sub-Transmission System Adequate Adequate Adequate Adequate
Additional Transformation Capacity Required (in MVA) 0.00 0.00 0.00 0.00
Distribution (Step-Down) Adequacy
Existing Transformation Capacity (in MVA) 1.60 1.60 1.60 1.60
Planned Transformation Capacity (in MVA) 0.00 0.50 0.50 1.00
Total Transformation Capacity - Installed (in MVA) 1.60 2.10 2.10 2.60
Total Transformation Capacity - Required (in MVA)# 1.47 1.60 1.75 1.93
Adequacy of Distribution (Step-Down) System Adequate Adequate Adequate Adequate
Additional Transformation Capacity Required (in MVA) 0.00 0.00 0.00 0.00
# Considering 10% Load catered directly through DG Sets
It is evident from above table that the planned capacity addition in Generation, Sub-Transmission
(considering maximum loading of 80%) and Distribution (considering maximum loading of 80%
and diversity factor of 1.1) is adequate to meet the requirement of 24x7 Power for All by FY 19 in
Agatti Island.
24x7 Power For All (Lakshadweep Islands) 10
CHAPTER 6: POWER SUPPLY –AMINI ISLAND
ABOUT AMINI
The Amini Island is at a distance of 407 km
(220 nautical miles) from Kochi and located
between Kavaratti Island in the south and
Kadmat Island in the north. This island has
an oval shape with a width of 1.20 km at the
broadest point and a length of 2.70 km. It lies
between 11° 06' and 11° 08' N latitude and
72° 42' and 72° 45' E longitude, having a land
area of 2.60 square km and lagoon area of
1.50 square km.
DEMAND PROJECTIONS
DETERMINATION OF CONSUMPTION
OF DOMESTIC CONSUMERS
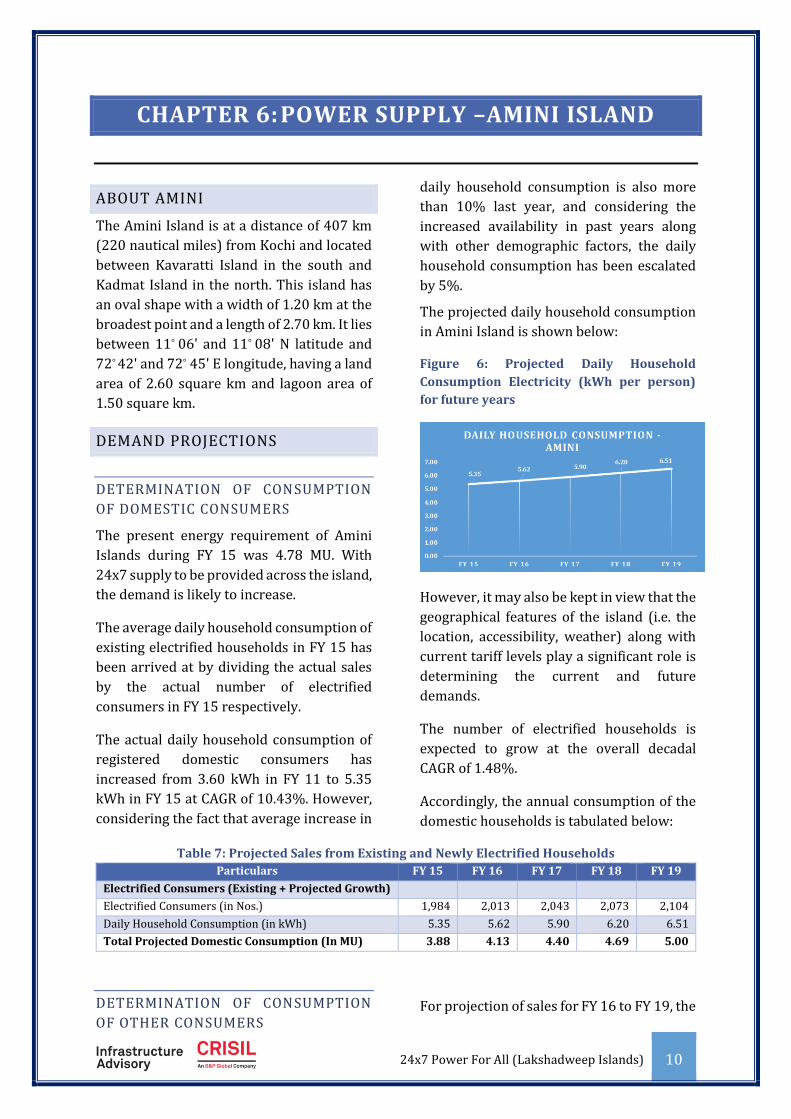
The present energy requirement of Amini
Islands during FY 15 was 4.78 MU. With
24x7 supply to be provided across the island,
the demand is likely to increase.
The average daily household consumption of
existing electrified households in FY 15 has
been arrived at by dividing the actual sales
by the actual number of electrified
consumers in FY 15 respectively.
The actual daily household consumption of
registered domestic consumers has
increased from 3.60 kWh in FY 11 to 5.35
kWh in FY 15 at CAGR of 10.43%. However,
considering the fact that average increase in
daily household consumption is also more
than 10% last year, and considering the
increased availability in past years along
with other demographic factors, the daily
household consumption has been escalated
by 5%.
The projected daily household consumption
in Amini Island is shown below:
Figure 6: Projected Daily Household
Consumption Electricity (kWh per person)
for future years
However, it may also be kept in view that the
geographical features of the island (i.e. the
location, accessibility, weather) along with
current tariff levels play a significant role is
determining the current and future
demands.
The number of electrified households is
expected to grow at the overall decadal
CAGR of 1.48%.
Accordingly, the annual consumption of the
domestic households is tabulated below:
Table 7: Projected Sales from Existing and Newly Electrified Households
Particulars FY 15 FY 16 FY 17 FY 18 FY 19
Electrified Consumers (Existing + Projected Growth)
Electrified Consumers (in Nos.) 1,984 2,013 2,043 2,073 2,104
Daily Household Consumption (in kWh) 5.35 5.62 5.90 6.20 6.51
Total Projected Domestic Consumption (In MU) 3.88 4.13 4.40 4.69 5.00
DETERMINATION OF CONSUMPTION
OF OTHER CONSUMERS For projection of sales for FY 16 to FY 19, the

24x7 Power For All (Lakshadweep Islands) 11
CAGR of previous 5 years has been
considered for all categories.
Based on this, the category-wise sales is as
per table below:
Table 8: Projected Category-wise Sales (In
MU)
Categories CAGR Projections
Considered FY 16 FY 17 FY 18 FY 19
Domestic 4.13 4.40 4.69 5.00 Commercial 13.65% 0.73 0.82 0.94 1.07 Industrial 9.77% 0.06 0.06 0.07 0.07 Public Lighting 10.98% 0.11 0.12 0.13 0.15 Temporary 16.70% 0.00 0.01 0.01 0.01
Grand Total 5.03 5.41 5.83 6.29
ENERGY AND DEMAND REQUIREMENT
MoP has not specified any loss trajectory for
AT&C loss reduction. Thus a reasonable
reduction in line with JERC targets has been
taken into account for preparing this
roadmap document which is shown in Figure
7. No Reduction in the T&D losses have been
considered as the losses are already at a very
nominal level.
Based on the loss reduction trajectory as
above, the energy and demand requirement
for the future years is tabulated in Table 9
below:
Figure 7: Projected Loss Reduction
Trajectory- Amini Island
Table 9: Energy Requirement (In MU) and Peak Demand (in MW) – Amini Island
Particulars Energy and Demand Scenario
FY 16 FY 17 FY 18 FY 19
Sale within State 5.03 5.41 5.83 6.29
Distribution Losses 2.34% 2.34% 2.34% 2.34%
Total Energy Requirement within Island 5.15 5.54 5.97 6.44
Load Factor 68.21% 68.21% 68.21% 68.21%
Maximum Demand – Amini Island 0.86 0.93 1.00 1.08
As seen from the above, the maximum
demand requirement of the Amini Islands is
projected to increase from 0.80 MW in FY 15
to 1.08 MW in FY 19 assuming an
unchanged annual load factor of 68.21% as
per actual information for FY 15.
Adoption of various energy efficiency
measures like energy efficient lighting (use
of LEDs) would also help in reducing the
peak demand of the state.
GENERATION PLAN
The total installed capacity in Amini Island
as on 31st March 2015 is 2.75 MW which
included 2.65 MW of DG Sets and 0.10 MW of
SPV plant. Further 1.75 MW capacity (0.75
DG +1 MW solar) has been planned to be
added by FY 19. However, the existing
capacities of DG sets have derated over
passage of time.
The total existing and upcoming generation

24x7 Power For All (Lakshadweep Islands) 12
up to FY 19 in Amini Island is detailed in
Table 10 below:
ADEQUACY OF GENERATION AND
DISTRIBUTION SYSTEM
An assessment of the adequacy of generation
and distribution infrastructure for meeting
the projected annual energy demand of 6.44
MU and peak demand of around 1.08 MW is
shown below:
Table 10: Capacity Availability from various Sources in Amini Island (in MW)
Source Commissioning Installed Capacity (MW)
Derated Capacity Available in MW
FY 16 FY 17 FY 18 FY 19
DG Sets Existing
New 1 X 750 31-08-2008 0.75 0.60 0.55 0.55 0.55
New 1 X 750 04-04-2010 0.75 0.60 0.55 0.55 0.55
New 1 X 750 12-09-2013 0.75 0.60 0.55 0.55 0.55
Old 1 X 400 22-05-1998 0.40 0.20 0.18 0.18 0.18
DG Sets Upcoming
New DG Set FY 18 0.75 0.75 0.75
Solar Existing
SPV Plants Commissioned 0.10 0.10 0.10 0.10 0.10
Solar Existing
New SPV Plants FY 18 1.00 1.00 1.00
Total 4.50 2.10 1.93 3.68 3.68
Table 11: Assessment of adequacy of Generation and Distribution in Amini Island
Particulars FY 16 FY 17 FY 18 FY 19
Generation Adequacy
Total Energy Requirement within Island 5.15 5.54 5.97 6.44
Maximum Energy Availability from Own Generation (In MU) 8.38 7.68 11.92 11.92
Adequacy of Generation Adequate Adequate Adequate Adequate
Additional Energy Generation Required (in MU) 0.00 0.00 0.00 0.00
Additional Capacity Required (40% PLF) on RTC Basis 0.00 0.00 0.00 0.00
Sub-Transmission (Step-up) Adequacy
Existing Transformation Capacity (in MVA) 1.00 1.00 1.00 1.00
Planned Transformation Capacity (in MVA) 0.00 0.00 1.00 1.00
Total Transformation Capacity - Installed (in MVA) 1.00 1.00 2.00 2.00
Total Transformation Capacity - Required (in MVA)# 1.08 1.16 1.25 1.35
Adequacy of Sub-Transmission System Inadequate $ Inadequate $ Adequate Adequate
Additional Transformation Capacity Required (in MVA) 0.08 0.16 0.00 0.00
Distribution (Step-Down) Adequacy
Existing Transformation Capacity (in MVA) 1.30 1.30 1.30 1.30
Planned Transformation Capacity (in MVA) 0.00 0.00 0.75 0.75
Total Transformation Capacity - Installed (in MVA) 1.30 1.30 2.05 2.05
Total Transformation Capacity - Required (in MVA)# 1.18 1.28 1.37 1.48
Adequacy of Distribution (Step-Down) System Adequate Adequate Adequate Adequate
Additional Transformation Capacity Required (in MVA) 0.00 0.00 0.00 0.00
# Considering 10% Load catered directly through DG Sets
$ Transformers will be loaded to the extent of 95% to supply full load.
It is evident from above table that the planned capacity addition in Generation, Sub-Transmission
(considering maximum loading of 80%) and Distribution (considering maximum loading of 80%
and diversity factor of 1.1) is adequate to meet the requirement of 24x7 Power for All by FY 19 in
Amini Island.
24x7 Power For All (Lakshadweep Islands) 13
CHAPTER 7: POWER SUPPLY –ANDROTH ISLAND
ABOUT ANDROTH
The Androth Island is the largest island with
an area of 4.90 sq km, length of 4.66 km and
a maximum width of 1.43 km. It lies in the
east-west direction, between 10° 48' and 10°
50' N latitude and 73° 38' and 73° 42' E
longitude. It is 119 km (64 nautical miles)
away from Kavaratti and 293 km (158
nautical miles) away from Kochi. It is the
only island having a very small lagoon area.
DEMAND PROJECTIONS
DETERMINATION OF CONSUMPTION
OF DOMESTIC CONSUMERS
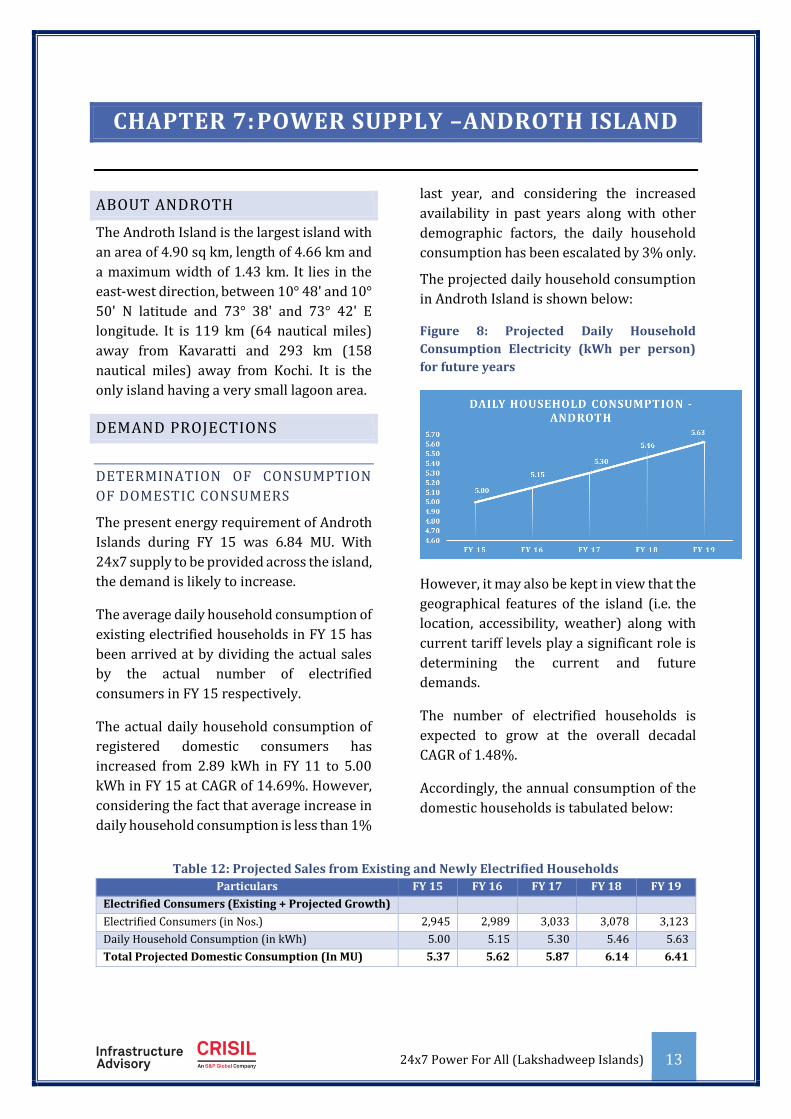
The present energy requirement of Androth
Islands during FY 15 was 6.84 MU. With
24x7 supply to be provided across the island,
the demand is likely to increase.
The average daily household consumption of
existing electrified households in FY 15 has
been arrived at by dividing the actual sales
by the actual number of electrified
consumers in FY 15 respectively.
The actual daily household consumption of
registered domestic consumers has
increased from 2.89 kWh in FY 11 to 5.00
kWh in FY 15 at CAGR of 14.69%. However,
considering the fact that average increase in
daily household consumption is less than 1%
last year, and considering the increased
availability in past years along with other
demographic factors, the daily household
consumption has been escalated by 3% only.
The projected daily household consumption
in Androth Island is shown below:
Figure 8: Projected Daily Household
Consumption Electricity (kWh per person)
for future years
However, it may also be kept in view that the
geographical features of the island (i.e. the
location, accessibility, weather) along with
current tariff levels play a significant role is
determining the current and future
demands.
The number of electrified households is
expected to grow at the overall decadal
CAGR of 1.48%.
Accordingly, the annual consumption of the
domestic households is tabulated below:
Table 12: Projected Sales from Existing and Newly Electrified Households
Particulars FY 15 FY 16 FY 17 FY 18 FY 19
Electrified Consumers (Existing + Projected Growth)
Electrified Consumers (in Nos.) 2,945 2,989 3,033 3,078 3,123
Daily Household Consumption (in kWh) 5.00 5.15 5.30 5.46 5.63
Total Projected Domestic Consumption (In MU) 5.37 5.62 5.87 6.14 6.41

24x7 Power For All (Lakshadweep Islands) 14
DETERMINATION OF CONSUMPTION
OF OTHER CONSUMERS
For projection of sales for FY 16 to FY 19, the
CAGR of previous 5 years has been
considered for all categories.
Based on this, the category-wise sales is as
per table below:
Table 13: Projected Category-wise Sales (In
MU)
Categories CAGR Projections
Considered FY 16 FY 17 FY 18 FY 19
Domestic 5.62 5.87 6.14 6.41 Commercial 10.17% 1.05 1.16 1.28 1.41 Industrial 25.56% 0.17 0.21 0.26 0.33 Public 0.00% 0.06 0.06 0.06 0.06 Temporary 8.02% 0.01 0.01 0.02 0.02
Grand Total 6.91 7.31 7.75 8.23
ENERGY AND DEMAND REQUIREMENT
MoP has not specified any loss trajectory for
AT&C loss reduction. Thus a reasonable
reduction in line with JERC targets has been
taken into account for preparing this
roadmap document which is shown in Figure
7. No Reduction in the T&D losses have been
considered as the losses are already at a very
nominal level.
Based on the loss reduction trajectory as
above, the energy and demand requirement
for the future years is tabulated in Table 9
below:
Figure 9: Projected Loss Reduction
Trajectory- Androth Island
Table 14: Energy Requirement (In MU) and Peak Demand (in MW) – Androth Island
Particulars Energy and Demand Scenario
FY 16 FY 17 FY 18 FY 19
Sale within State 6.91 7.31 7.75 8.23
Distribution Losses 4.48% 4.48% 4.48% 4.48%
Total Energy Requirement within Island 7.23 7.66 8.12 8.61
Load Factor 66.34% 66.34% 66.34% 66.34%
Maximum Demand – Androth Island 1.24 1.32 1.40 1.48
As seen from the above, the maximum
demand requirement of the Androth Islands
is projected to increase from 1.18 MW in FY
15 to 1.48 MW in FY 19 assuming an
unchanged annual load factor of 66.34% as
per actual information for FY 15.
Adoption of various energy efficiency
measures like energy efficient lighting (use
of LEDs) would also help in reducing the
peak demand of the state.
GENERATION PLAN
The total installed capacity in Androth Island
as on 31st March 2015 is 2.57 MW which
included 2.25 MW of DG Sets and 0.32 MW of
SPV plant. Further 1.00 MW capacity has
been planned to be added by FY 19.
However, the existing capacities of DG sets
have derated over passage of time.
The total existing and upcoming generation
24x7 Power For All (Lakshadweep Islands) 15
up to FY 19 in Androth Island is detailed in
Table 15 below:
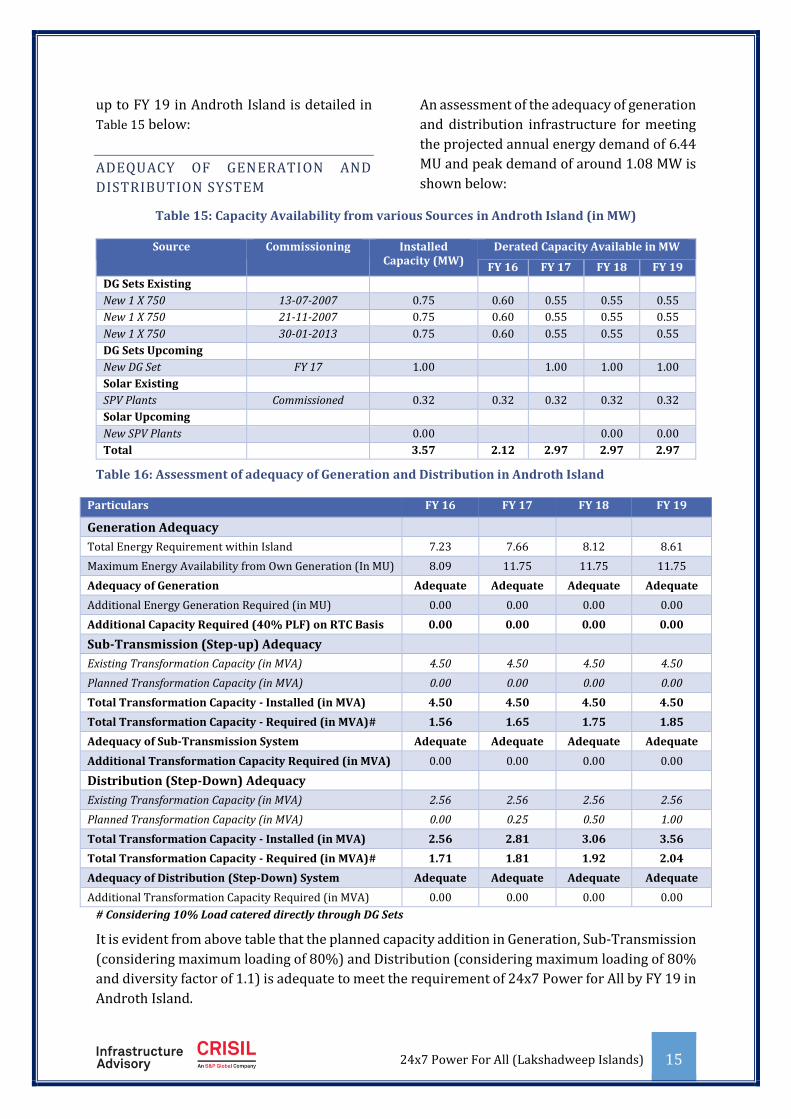
ADEQUACY OF GENERATION AND
DISTRIBUTION SYSTEM
An assessment of the adequacy of generation
and distribution infrastructure for meeting
the projected annual energy demand of 6.44
MU and peak demand of around 1.08 MW is
shown below:
Table 15: Capacity Availability from various Sources in Androth Island (in MW)
Source Commissioning Installed Capacity (MW)
Derated Capacity Available in MW
FY 16 FY 17 FY 18 FY 19
DG Sets Existing
New 1 X 750 13-07-2007 0.75 0.60 0.55 0.55 0.55
New 1 X 750 21-11-2007 0.75 0.60 0.55 0.55 0.55
New 1 X 750 30-01-2013 0.75 0.60 0.55 0.55 0.55
DG Sets Upcoming
New DG Set FY 17 1.00 1.00 1.00 1.00
Solar Existing
SPV Plants Commissioned 0.32 0.32 0.32 0.32 0.32
Solar Upcoming
New SPV Plants 0.00 0.00 0.00
Total 3.57 2.12 2.97 2.97 2.97
Table 16: Assessment of adequacy of Generation and Distribution in Androth Island
Particulars FY 16 FY 17 FY 18 FY 19
Generation Adequacy
Total Energy Requirement within Island 7.23 7.66 8.12 8.61
Maximum Energy Availability from Own Generation (In MU) 8.09 11.75 11.75 11.75
Adequacy of Generation Adequate Adequate Adequate Adequate
Additional Energy Generation Required (in MU) 0.00 0.00 0.00 0.00
Additional Capacity Required (40% PLF) on RTC Basis 0.00 0.00 0.00 0.00
Sub-Transmission (Step-up) Adequacy
Existing Transformation Capacity (in MVA) 4.50 4.50 4.50 4.50
Planned Transformation Capacity (in MVA) 0.00 0.00 0.00 0.00
Total Transformation Capacity - Installed (in MVA) 4.50 4.50 4.50 4.50
Total Transformation Capacity - Required (in MVA)# 1.56 1.65 1.75 1.85
Adequacy of Sub-Transmission System Adequate Adequate Adequate Adequate
Additional Transformation Capacity Required (in MVA) 0.00 0.00 0.00 0.00
Distribution (Step-Down) Adequacy
Existing Transformation Capacity (in MVA) 2.56 2.56 2.56 2.56
Planned Transformation Capacity (in MVA) 0.00 0.25 0.50 1.00
Total Transformation Capacity - Installed (in MVA) 2.56 2.81 3.06 3.56
Total Transformation Capacity - Required (in MVA)# 1.71 1.81 1.92 2.04
Adequacy of Distribution (Step-Down) System Adequate Adequate Adequate Adequate
Additional Transformation Capacity Required (in MVA) 0.00 0.00 0.00 0.00
# Considering 10% Load catered directly through DG Sets
It is evident from above table that the planned capacity addition in Generation, Sub-Transmission
(considering maximum loading of 80%) and Distribution (considering maximum loading of 80%
and diversity factor of 1.1) is adequate to meet the requirement of 24x7 Power for All by FY 19 in
Androth Island.

24x7 Power For All (Lakshadweep Islands) 16
CHAPTER 8: POWER SUPPLY –BITRA ISLAND
ABOUT BITRA
The Bitra Island is the smallest inhabited
island in the territory having a land area of
0.105 square km. It has a length of 0.57 km
and a width of 0.28 km at the broadest point.
This is at a distance of 483 km (261 nautical
miles) from Kochi. The island is located at
11° 36' N I and 72° 11' E longitude. Though
the land area is small, its lagoon area is 45.61
square km.
DEMAND PROJECTIONS
DETERMINATION OF CONSUMPTION
OF DOMESTIC CONSUMERS
The present energy requirement of Bitra
Islands during FY 15 was 0.22 MU. With
24x7 supply to be provided across the island,
the demand is likely to increase.
The average daily household consumption of
existing electrified households in FY 15 has
been arrived at by dividing the actual sales
by the actual number of electrified
consumers in FY 15 respectively.
The actual daily household consumption of
registered domestic consumers has
increased from 2.01 kWh in FY 11 to 2.91
kWh in FY 15 at CAGR of 9.70%. However,
considering the fact that average increase in
daily household consumption is more than
10% last year, and considering the increased
availability in past years along with other
demographic factors, the daily household
consumption has been escalated by 5%.
The projected daily household consumption
in Bitra Island is shown below:
Figure 10: Projected Daily Household
Consumption Electricity (kWh per person)
for future years
However, it may also be kept in view that the
geographical features of the island (i.e. the
location, accessibility, weather) along with
current tariff levels play a significant role is
determining the current and future
demands.
The number of electrified households is
expected to grow at the overall decadal
CAGR of 1.48%.
Accordingly, the annual consumption of the
domestic households is tabulated below:
Table 17: Projected Sales from Existing and Newly Electrified Households
Particulars FY 15 FY 16 FY 17 FY 18 FY 19
Electrified Consumers (Existing + Projected Growth)
Electrified Consumers (in Nos.) 128 130 132 134 136
Daily Household Consumption (in kWh) 2.91 3.06 3.21 3.37 3.54
Total Projected Domestic Consumption (In MU) 0.14 0.14 0.15 0.16 0.18

24x7 Power For All (Lakshadweep Islands) 17
DETERMINATION OF CONSUMPTION
OF OTHER CONSUMERS
For projection of sales for FY 16 to FY 19, the
CAGR of previous 5 years has been
considered for all categories.
Based on this, the category-wise sales is as
per table below:
Table 18: Projected Category-wise Sales (In
MU)
Categories CAGR Projections
Considered FY 16 FY 17 FY 18 FY 19
Domestic 0.14 0.15 0.16 0.18 Commercial 0.00% 0.08 0.08 0.08 0.08 Industrial 0.00% 0.00 0.00 0.00 0.00 Public Lighting 0.00% 0.00 0.00 0.00 0.00 Temporary 0.00% 0.00 0.00 0.00 0.00
Grand Total 0.23 0.24 0.25 0.26
ENERGY AND DEMAND REQUIREMENT
MoP has not specified any loss trajectory for
AT&C loss reduction. Thus a reasonable
reduction in line with JERC targets has been
taken into account for preparing this
roadmap document which is shown in Figure
11. No Reduction in the T&D losses have
been considered as the losses are already at
a very nominal level.
Based on the loss reduction trajectory as
above, the energy and demand requirement
for the future years is tabulated in Table 19
below:
Figure 11: Projected Loss Reduction
Trajectory- Bitra Island
Table 19: Energy Requirement (In MU) and Peak Demand (in MW) – Bitra Island
Particulars Energy and Demand Scenario
FY 16 FY 17 FY 18 FY 19
Sale within State 0.23 0.24 0.25 0.26
Distribution Losses 0.00% 0.00% 0.00% 0.00%
Total Energy Requirement within Island 0.23 0.24 0.25 0.26
Load Factor 50.65% 50.65% 50.65% 50.65%
Maximum Demand – Bitra Island 0.05 0.05 0.06 0.06
As seen from the above, the maximum
demand requirement of the Bitra Islands is
projected to increase from 0.05 MW in FY 15
to 0.06 MW in FY 19 assuming an
unchanged annual load factor of 50.65% as
per actual information for FY 15.
Adoption of various energy efficiency
measures like energy efficient lighting (use
of LEDs) would also help in reducing the
peak demand of the state.
GENERATION PLAN
The total installed capacity in Bitra Island as
on 31st March 2015 is 2.57 MW which
included 2.25 MW of DG Sets and 0.32 MW of
SPV plant. Further Nil capacity has been
planned to be added by FY 19. However, the
existing capacities of DG sets have derated
over passage of time.
The total existing and upcoming generation

24x7 Power For All (Lakshadweep Islands) 18
up to FY 19 in Bitra Island is detailed in Table
20 below:
ADEQUACY OF GENERATION AND
DISTRIBUTION SYSTEM
An assessment of the adequacy of generation
and distribution infrastructure for meeting
the projected annual energy demand of 0.26
MU and peak demand of around 0.06 MW is
shown below:
Table 20: Capacity Availability from various Sources in Bitra Island (in MW)
Source Commissioning Installed Capacity (MW)
Derated Capacity Available in MW
FY 16 FY 17 FY 18 FY 19
DG Sets Existing
New 1 X 100 28-02-2013 0.10 0.08 0.08 0.08 0.08
Old 1 X 50 31-08-2003 0.05 0.03 0.03 0.03 0.03
Old 1 X 50 30-08-2003 0.05 0.03 0.03 0.03 0.03
Old 1 X 320 30-12-2012 0.32 0.25 0.25 0.25 0.25
DG Sets Upcoming
New DG Set 0.00 0.00 0.00
Solar Existing
SPV Plants Commissioned 0.10 0.10 0.10 0.10 0.10
Solar Upcoming
New SPV Plants 0.00 0.00 0.00
Total 0.62 0.48 0.48 0.48 0.48
Table 21: Assessment of adequacy of Generation and Distribution in Bitra Island
Particulars FY 16 FY 17 FY 18 FY 19
Generation Adequacy
Total Energy Requirement within Island 0.23 0.24 0.25 0.26
Maximum Energy Availability from Own Generation (In MU) 1.22 1.22 1.22 1.22
Adequacy of Generation Adequate Adequate Adequate Adequate
Additional Energy Generation Required (in MU) 0.00 0.00 0.00 0.00
Additional Capacity Required (40% PLF) on RTC Basis 0.00 0.00 0.00 0.00
Sub-Transmission (Step-up) Adequacy
Existing Transformation Capacity (in MVA)
Not Required as supply is directly done from generator to the Consumers owing to very less connected load
Planned Transformation Capacity (in MVA)
Total Transformation Capacity - Installed (in MVA)
Total Transformation Capacity - Required (in MVA)
Adequacy of Sub-Transmission System
Additional Transformation Capacity Required (in MVA)
Distribution (Step-Down) Adequacy
Existing Transformation Capacity (in MVA)
Not Required as supply is directly done from generator to the Consumers owing to very less connected load
Planned Transformation Capacity (in MVA)
Total Transformation Capacity - Installed (in MVA)
Total Transformation Capacity - Required (in MVA)
Adequacy of Distribution (Step-Down) System
Additional Transformation Capacity Required (in MVA)
It is evident from above table that the planned capacity addition in Generation, Sub-Transmission
(considering maximum loading of 80%) and Distribution (considering maximum loading of 80%
and diversity factor of 1.1) is adequate to meet the requirement of 24x7 Power for All by FY 19 in
Bitra Island.
24x7 Power For All (Lakshadweep Islands) 19
CHAPTER 9: POWER SUPPLY –CHETLAT ISLAND
ABOUT CHETLAT
The Chetlat Island is 56 km on the north of
the Amini and 432 km (233 nautical miles)
away from Kochi. It lies between 11° 41' and
11° 43' N latitude and 72° 41' and 72° 43' E
longitude having an area of 1.40 square km.
Along the eastern side of the island, there is
a wide belt of coral delta formed by storms,
which broadens at the north and covers the
whole southern end of the island.
DEMAND PROJECTIONS
DETERMINATION OF CONSUMPTION
OF DOMESTIC CONSUMERS
The present energy requirement of Chetlat
Islands during FY 15 was 1.47 MU. With
24x7 supply to be provided across the island,
the demand is likely to increase.
The average daily household consumption of
existing electrified households in FY 15 has
been arrived at by dividing the actual sales
by the actual number of electrified
consumers in FY 15 respectively.
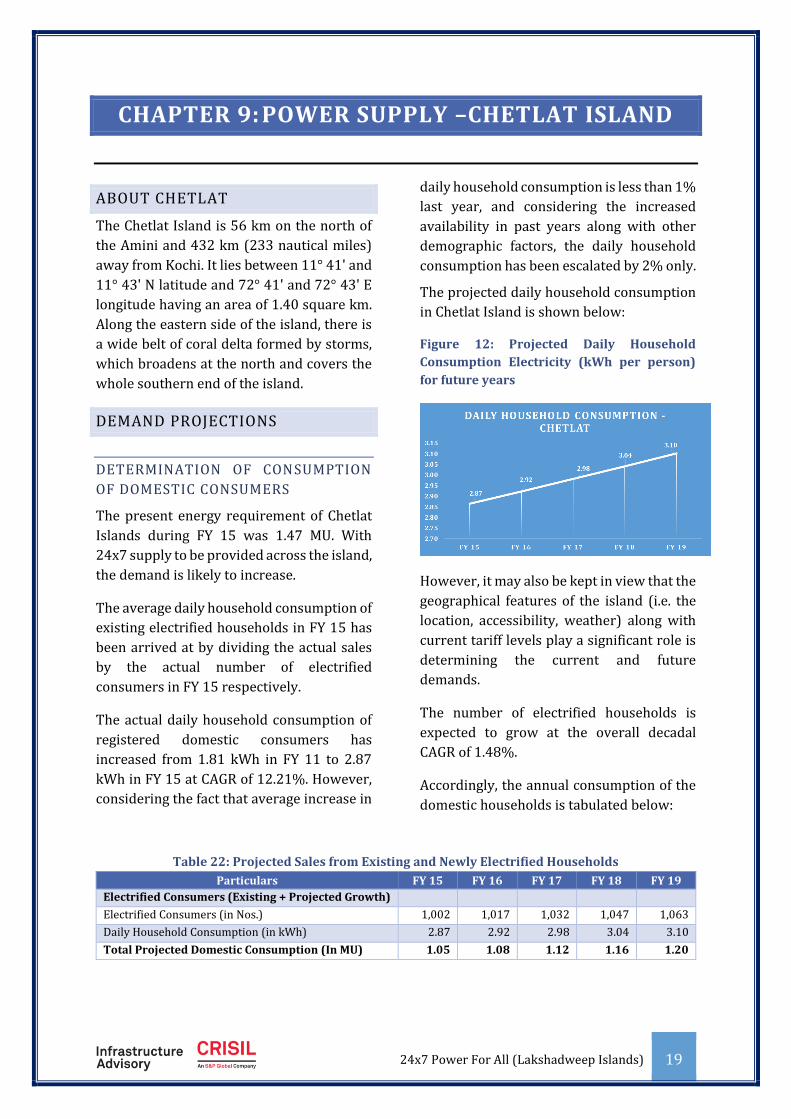
The actual daily household consumption of
registered domestic consumers has
increased from 1.81 kWh in FY 11 to 2.87
kWh in FY 15 at CAGR of 12.21%. However,
considering the fact that average increase in
daily household consumption is less than 1%
last year, and considering the increased
availability in past years along with other
demographic factors, the daily household
consumption has been escalated by 2% only.
The projected daily household consumption
in Chetlat Island is shown below:
Figure 12: Projected Daily Household
Consumption Electricity (kWh per person)
for future years
However, it may also be kept in view that the
geographical features of the island (i.e. the
location, accessibility, weather) along with
current tariff levels play a significant role is
determining the current and future
demands.
The number of electrified households is
expected to grow at the overall decadal
CAGR of 1.48%.
Accordingly, the annual consumption of the
domestic households is tabulated below:
Table 22: Projected Sales from Existing and Newly Electrified Households
Particulars FY 15 FY 16 FY 17 FY 18 FY 19
Electrified Consumers (Existing + Projected Growth)
Electrified Consumers (in Nos.) 1,002 1,017 1,032 1,047 1,063
Daily Household Consumption (in kWh) 2.87 2.92 2.98 3.04 3.10
Total Projected Domestic Consumption (In MU) 1.05 1.08 1.12 1.16 1.20

24x7 Power For All (Lakshadweep Islands) 20
DETERMINATION OF CONSUMPTION
OF OTHER CONSUMERS
For projection of sales for FY 16 to FY 19, the
CAGR of previous 5 years has been
considered for all categories.
Based on this, the category-wise sales is as
per table below:
Table 23: Projected Category-wise Sales (In
MU)
Categories CAGR Projections
Considered FY 16 FY 17 FY 18 FY 19
Domestic 1.08 1.12 1.16 1.20 Commercial 9.86% 0.29 0.32 0.35 0.39 Industrial 8.79% 0.01 0.01 0.01 0.01 Public Lighting 0.00% 0.02 0.02 0.02 0.02 Temporary 37.62% 0.00 0.00 0.01 0.01
Grand Total 1.41 1.48 1.55 1.63
ENERGY AND DEMAND REQUIREMENT
MoP has not specified any loss trajectory for
AT&C loss reduction. Thus a reasonable
reduction in line with JERC targets has been
taken into account for preparing this
roadmap document which is shown in Figure
13. A reduction of 0.25% in the T&D losses
have been considered as the losses are
already at a very nominal level.
Based on the loss reduction trajectory
approved as above, the energy and demand
requirement for the future years is tabulated
in Table 24 below:
Figure 13: Projected Loss Reduction
Trajectory- Chetlat Island
Table 24: Energy Requirement (In MU) and Peak Demand (in MW) – Chetlat Island
Particulars Energy and Demand Scenario
FY 16 FY 17 FY 18 FY 19
Sale within State 1.41 1.48 1.55 1.63
Distribution Losses 8.11% 7.86% 7.61% 7.36%
Total Energy Requirement within Island 1.54 1.61 1.68 1.76
Load Factor 45.85% 45.85% 45.85% 45.85%
Maximum Demand – Chetlat Island 0.38 0.40 0.42 0.44
As seen from the above, the maximum
demand requirement of the Chetlat Islands is
projected to increase from 0.37 MW in FY 15
to 0.44 MW in FY 19 assuming an
unchanged annual load factor of 45.85% as
per actual information for FY 15.
Adoption of various energy efficiency
measures like energy efficient lighting (use
of LEDs) would also help in reducing the
peak demand of the state.
GENERATION PLAN
The total installed capacity in Chetlat Island
as on 31st March 2015 is 1.10 MW which
included 1.00 MW of DG Sets and 0.10 MW of
SPV plant. Further Nil capacity has been
planned to be added by FY 19. However, the
existing capacities of DG sets have derated
over passage of time.
The total existing and upcoming generation
24x7 Power For All (Lakshadweep Islands) 21
up to FY 19 in Chetlat Island is detailed in
Table 15 below:
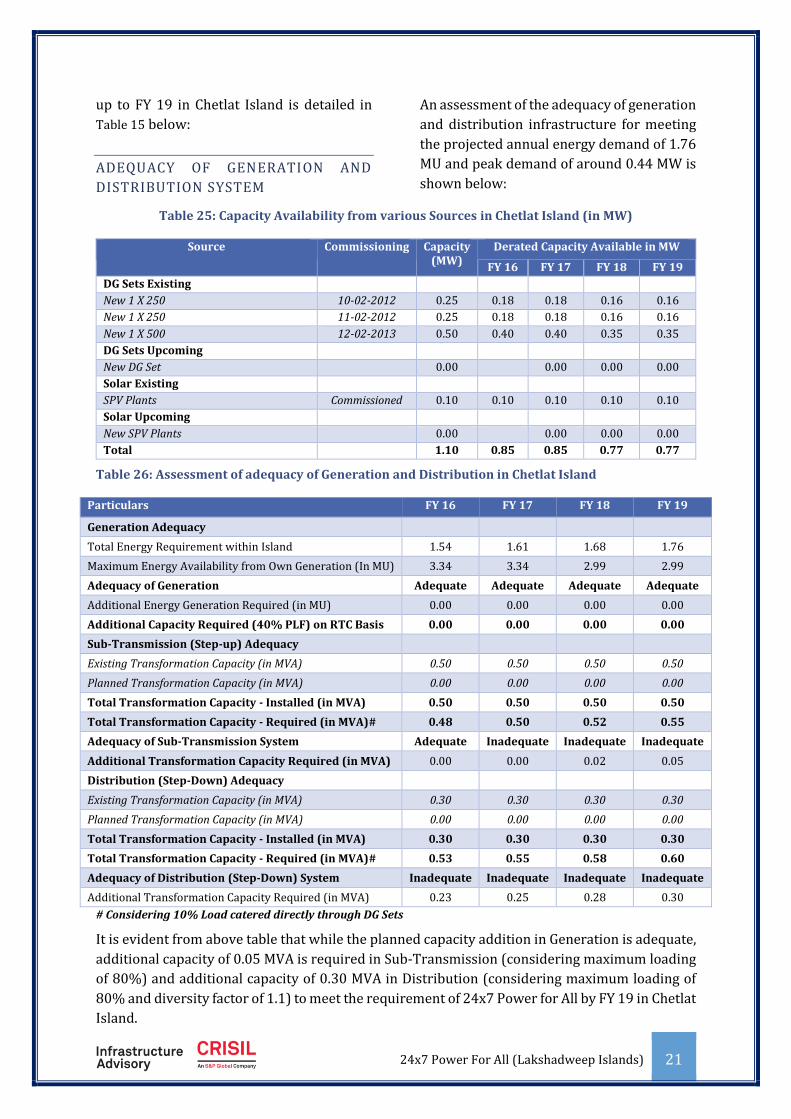
ADEQUACY OF GENERATION AND
DISTRIBUTION SYSTEM
An assessment of the adequacy of generation
and distribution infrastructure for meeting
the projected annual energy demand of 1.76
MU and peak demand of around 0.44 MW is
shown below:
Table 25: Capacity Availability from various Sources in Chetlat Island (in MW)
Source Commissioning Capacity (MW)
Derated Capacity Available in MW
FY 16 FY 17 FY 18 FY 19
DG Sets Existing
New 1 X 250 10-02-2012 0.25 0.18 0.18 0.16 0.16
New 1 X 250 11-02-2012 0.25 0.18 0.18 0.16 0.16
New 1 X 500 12-02-2013 0.50 0.40 0.40 0.35 0.35
DG Sets Upcoming
New DG Set 0.00 0.00 0.00 0.00
Solar Existing
SPV Plants Commissioned 0.10 0.10 0.10 0.10 0.10
Solar Upcoming
New SPV Plants 0.00 0.00 0.00 0.00
Total 1.10 0.85 0.85 0.77 0.77
Table 26: Assessment of adequacy of Generation and Distribution in Chetlat Island
Particulars FY 16 FY 17 FY 18 FY 19
Generation Adequacy
Total Energy Requirement within Island 1.54 1.61 1.68 1.76
Maximum Energy Availability from Own Generation (In MU) 3.34 3.34 2.99 2.99
Adequacy of Generation Adequate Adequate Adequate Adequate
Additional Energy Generation Required (in MU) 0.00 0.00 0.00 0.00
Additional Capacity Required (40% PLF) on RTC Basis 0.00 0.00 0.00 0.00
Sub-Transmission (Step-up) Adequacy
Existing Transformation Capacity (in MVA) 0.50 0.50 0.50 0.50
Planned Transformation Capacity (in MVA) 0.00 0.00 0.00 0.00
Total Transformation Capacity - Installed (in MVA) 0.50 0.50 0.50 0.50
Total Transformation Capacity - Required (in MVA)# 0.48 0.50 0.52 0.55
Adequacy of Sub-Transmission System Adequate Inadequate Inadequate Inadequate
Additional Transformation Capacity Required (in MVA) 0.00 0.00 0.02 0.05
Distribution (Step-Down) Adequacy
Existing Transformation Capacity (in MVA) 0.30 0.30 0.30 0.30
Planned Transformation Capacity (in MVA) 0.00 0.00 0.00 0.00
Total Transformation Capacity - Installed (in MVA) 0.30 0.30 0.30 0.30
Total Transformation Capacity - Required (in MVA)# 0.53 0.55 0.58 0.60
Adequacy of Distribution (Step-Down) System Inadequate Inadequate Inadequate Inadequate
Additional Transformation Capacity Required (in MVA) 0.23 0.25 0.28 0.30
# Considering 10% Load catered directly through DG Sets
It is evident from above table that while the planned capacity addition in Generation is adequate,
additional capacity of 0.05 MVA is required in Sub-Transmission (considering maximum loading
of 80%) and additional capacity of 0.30 MVA in Distribution (considering maximum loading of
80% and diversity factor of 1.1) to meet the requirement of 24x7 Power for All by FY 19 in Chetlat
Island.
24x7 Power For All (Lakshadweep Islands) 22
CHAPTER 10: POWER SUPPLY –KADMAT ISLAND
ABOUT KADMAT
The Kadmat Island is long and narrow. It is
only 0.57 km wide at the broadest point
having maximum length of 11 km. It lies
between 11° 10' and 11° 16' N latitude and
72° 45' and 72° 48' E longitude, having an
area of 3.20 square km. This island is at a
distance of 407 km (220 nautical mil from
Kochi and located between Amini Island in
the south and Chetlat Island in the north.
DEMAND PROJECTIONS
DETERMINATION OF CONSUMPTION
OF DOMESTIC CONSUMERS
The present energy requirement of Kadmat
Islands during FY 15 was 4.31 MU. With
24x7 supply to be provided across the island,
the demand is likely to increase.
The average daily household consumption of
existing electrified households in FY 15 has
been arrived at by dividing the actual sales
by the actual number of electrified
consumers in FY 15 respectively.
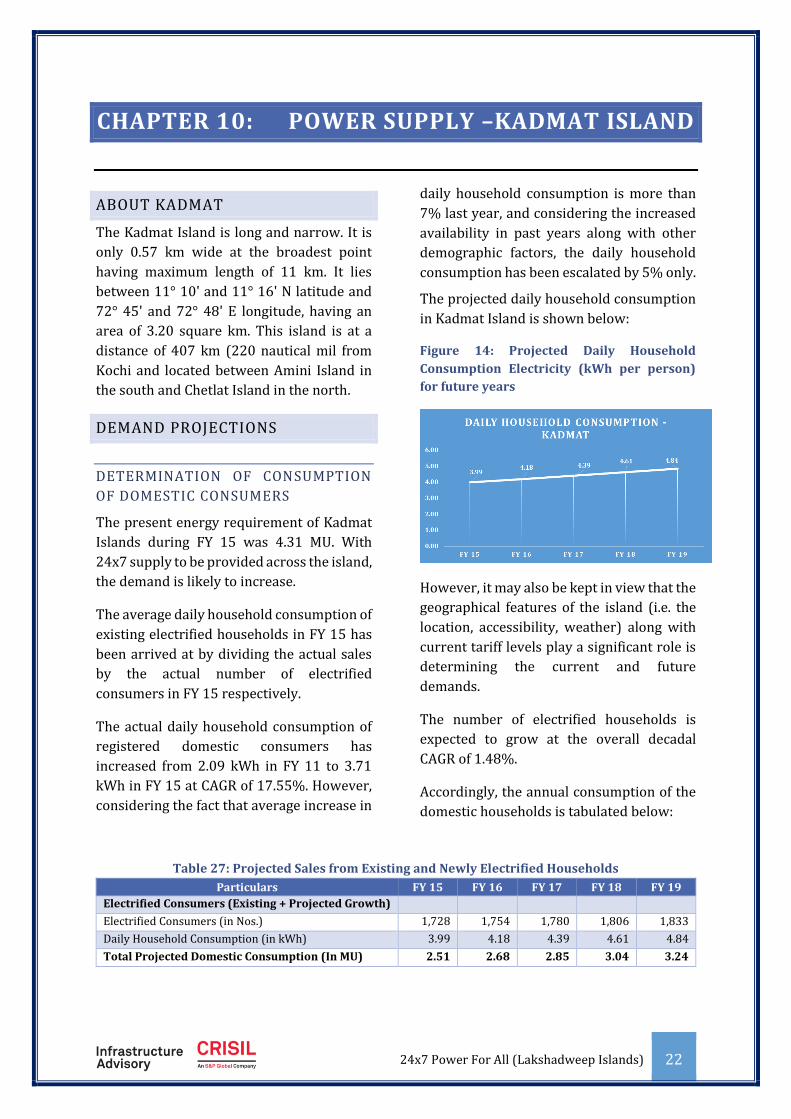
The actual daily household consumption of
registered domestic consumers has
increased from 2.09 kWh in FY 11 to 3.71
kWh in FY 15 at CAGR of 17.55%. However,
considering the fact that average increase in
daily household consumption is more than
7% last year, and considering the increased
availability in past years along with other
demographic factors, the daily household
consumption has been escalated by 5% only.
The projected daily household consumption
in Kadmat Island is shown below:
Figure 14: Projected Daily Household
Consumption Electricity (kWh per person)
for future years
However, it may also be kept in view that the
geographical features of the island (i.e. the
location, accessibility, weather) along with
current tariff levels play a significant role is
determining the current and future
demands.
The number of electrified households is
expected to grow at the overall decadal
CAGR of 1.48%.
Accordingly, the annual consumption of the
domestic households is tabulated below:
Table 27: Projected Sales from Existing and Newly Electrified Households
Particulars FY 15 FY 16 FY 17 FY 18 FY 19
Electrified Consumers (Existing + Projected Growth)
Electrified Consumers (in Nos.) 1,728 1,754 1,780 1,806 1,833
Daily Household Consumption (in kWh) 3.99 4.18 4.39 4.61 4.84
Total Projected Domestic Consumption (In MU) 2.51 2.68 2.85 3.04 3.24

24x7 Power For All (Lakshadweep Islands) 23
DETERMINATION OF CONSUMPTION
OF OTHER CONSUMERS
For projection of sales for FY 16 to FY 19, the
CAGR of previous 5 years has been
considered for all categories.
Based on this, the category-wise sales is as
per table below:
Table 28: Projected Category-wise Sales (In
MU)
Categories CAGR Projections
Considered FY 16 FY 17 FY 18 FY 19
Domestic 2.68 2.85 3.04 3.24 Commercial 10.56% 0.57 0.63 0.70 0.77 Industrial 4.57% 0.03 0.03 0.03 0.03 Public Lighting 13.05% 0.23 0.26 0.29 0.33 Temporary 52.04% 0.01 0.01 0.02 0.03
Grand Total 3.51 3.78 4.08 4.40
ENERGY AND DEMAND REQUIREMENT
MoP has not specified any loss trajectory for
AT&C loss reduction. Thus a reasonable
reduction in line with JERC targets has been
taken into account for preparing this
roadmap document which is shown in Figure
15. A reduction of 4% in the T&D losses have
been considered as the losses are at very
high level.
Based on the loss reduction trajectory as
above, the energy and demand requirement
for the future years is tabulated in Table 29
below:
Figure 15: Projected Loss Reduction
Trajectory- Kadmat Island
Table 29: Energy Requirement (In MU) and Peak Demand (in MW) – Kadmat Island
Particulars Energy and Demand Scenario
FY 16 FY 17 FY 18 FY 19
Sale within State 3.51 3.78 4.08 4.40
Distribution Losses 20.27% 16.27% 12.27% 8.27%
Total Energy Requirement within Island 4.41 4.52 4.65 4.80
Load Factor 61.50% 61.50% 61.50% 61.50%
Maximum Demand – Kadmat Island 0.82 0.84 0.86 0.89
As seen from the above, the maximum
demand requirement of the Kadmat Islands
is projected to increase from 1.18 MW in FY
15 to 1.48 MW in FY 19 assuming an
unchanged annual load factor of 66.34% as
per actual information for FY 15.
Adoption of various energy efficiency
measures like energy efficient lighting (use
of LEDs) would also help in reducing the
peak demand of the state.
GENERATION PLAN
The total installed capacity in Kadmat Island
as on 31st March 2015 is 2.45 MW which
included 2.30 MW of DG Sets and 0.15 MW of
SPV plant. Further 1.75 MW capacity (0.75
MW DG + 1 MW Solar) has been planned to
be added by FY 19. However, the existing
capacities of DG sets have derated over
passage of time.

24x7 Power For All (Lakshadweep Islands) 24
The total existing and upcoming generation
up to FY 19 in Kadmat Island is detailed in
Table 30 below:
ADEQUACY OF GENERATION AND
DISTRIBUTION SYSTEM
An assessment of the adequacy of generation
and distribution infrastructure for meeting
the projected annual energy demand of 8.61
MU and peak demand of around 1.48 MW is
shown below:
Table 30: Capacity Availability from various Sources in Kadmat Island (in MW)
Source Commissioning Installed Capacity (MW) Derated Capacity Available in MW
FY 16 FY 17 FY 18 FY 19
DG Sets Existing
New 1 X 400 24-01-2009 0.40 0.30 0.30 0.30 0.30
New 1 X 400 08-05-2011 0.40 0.30 0.30 0.30 0.30
New 1 X 750 03-02-2013 0.75 0.65 0.65 0.65 0.65
Old 1 X 250 13-06-2013 0.25 0.08 0.08 0.08 0.08
Old 1 X 250 06-09-2013 0.25 0.08 0.08 0.08 0.08
Old 1 X 250 09-02-2014 0.25 0.08 0.08 0.08 0.08
DG Sets Upcoming
New DG Set FY 18 0.75 0.75 0.75
Solar Existing
SPV Plants Commissioned 0.15 0.15 0.15 0.15 0.15
Solar Upcoming
New SPV Plants FY 18 1.00 1.00 1.00
Total 4.20 1.64 1.64 3.39 3.39
Table 31: Assessment of adequacy of Generation and Distribution in Kadmat Island
Particulars FY 16 FY 17 FY 18 FY 19
Generation Adequacy
Total Energy Requirement within Island 4.41 4.52 4.65 4.80
Maximum Energy Availability from Own Generation (In MU) 6.16 6.16 10.40 10.40
Adequacy of Generation Adequate Adequate Adequate Adequate
Additional Energy Generation Required (in MU) 0.00 0.00 0.00 0.00
Additional Capacity Required (40% PLF) on RTC Basis 0.00 0.00 0.00 0.00
Sub-Transmission (Step-up) Adequacy
Existing Transformation Capacity (in MVA) 1.50 1.50 1.50 1.50
Planned Transformation Capacity (in MVA) 0.00 0.00 1.00 1.00
Total Transformation Capacity - Installed (in MVA) 1.50 1.50 2.50 2.50
Total Transformation Capacity - Required (in MVA)# 1.02 1.05 1.08 1.11
Adequacy of Sub-Transmission System Adequate Adequate Adequate Adequate
Additional Transformation Capacity Required (in MVA) 0.00 0.00 0.00 0.00
Distribution (Step-Down) Adequacy
Existing Transformation Capacity (in MVA) 1.00 1.00 1.00 1.00
Planned Transformation Capacity (in MVA) 0.00 0.00 0.75 0.75
Total Transformation Capacity - Installed (in MVA) 1.00 1.00 1.75 1.75
Total Transformation Capacity - Required (in MVA)# 1.12 1.15 1.19 1.22
Adequacy of Distribution (Step-Down) System Inadequate$ Inadequate$ Adequate Adequate
Additional Transformation Capacity Required (in MVA) 0.12 0.15 0.00 0.00
# Considering 10% Load catered directly through DG Sets
$ Transformers will be loaded to the extent of 95% to supply full load.
It is evident from above table that the planned capacity addition in Generation, Sub-Transmission
(considering maximum loading of 80%) and Distribution (considering maximum loading of 80%
and diversity factor of 1.1) is adequate to meet the requirement of 24x7 Power for All by FY 19 in
Kadmat Island.

24x7 Power For All (Lakshadweep Islands) 25
CHAPTER 11: POWER SUPPLY –KALPENI ISLAND
ABOUT KALPENI
The Kalpeni Island lies between 10° 03' and
10° 07' N latitude and 73° 37' and 73° 39'E
longitude, having on area of 2.79 square km.
The Island is located at a distance of 287 km
(155 nautical miles) from Kochi and located
south-east of Kavaratti Island and midway
between Andrott and Minicoy. It has a very
large lagoon measuring about 2.8 km at the
point of maximum width. The Island is
aligned in the north-south direction.
DEMAND PROJECTIONS
DETERMINATION OF CONSUMPTION
OF DOMESTIC CONSUMERS
The present energy requirement of Kalpeni
Islands during FY 15 was 3.39 MU. With
24x7 supply to be provided across the island,
the demand is likely to increase.
The average daily household consumption of
existing electrified households in FY 15 has
been arrived at by dividing the actual sales
by the actual number of electrified
consumers in FY 15 respectively.
The actual daily household consumption of
registered domestic consumers has
increased from 2.71 kWh in FY 11 to 4.24
kWh in FY 15 at CAGR of 11.82%. However,
considering the fact that average increase in
daily household consumption is more than
10% last year, and considering the increased
availability in past years along with other
demographic factors, the daily household
consumption has been escalated by 5% only.
The projected daily household consumption
in Kalpeni Island is shown below:
Figure 16: Projected Daily Household
Consumption Electricity (kWh per person)
for future years
However, it may also be kept in view that the
geographical features of the island (i.e. the
location, accessibility, weather) along with
current tariff levels play a significant role is
determining the current and future
demands.
The number of electrified households is
expected to grow at the overall decadal
CAGR of 1.48%.
Accordingly, the annual consumption of the
domestic households is tabulated below:
Table 32: Projected Sales from Existing and Newly Electrified Households
Particulars FY 15 FY 16 FY 17 FY 18 FY 19
Electrified Consumers (Existing + Projected Growth)
Electrified Consumers (in Nos.) 1,706 1,731 1,757 1,783 1,809
Daily Household Consumption (in kWh) 4.24 4.46 4.68 4.91 5.16
Total Projected Domestic Consumption (In MU) 2.64 2.82 3.00 3.20 3.41

24x7 Power For All (Lakshadweep Islands) 26
DETERMINATION OF CONSUMPTION
OF OTHER CONSUMERS
For projection of sales for FY 16 to FY 19, the
CAGR of previous 5 years has been
considered for all categories.
Based on this, the category-wise sales is as
per table below:
Table 33: Projected Category-wise Sales (In
MU)
Categories CAGR Projections
Considered FY 16 FY 17 FY 18 FY 19
Domestic 2.82 3.00 3.20 3.41
Commercial 8.22% 0.48 0.51 0.56 0.60
Industrial 17.79% 0.05 0.05 0.06 0.07
Public Lighting 0.00% 0.06 0.06 0.06 0.06
Temporary 54.38% 0.01 0.02 0.03 0.05
Grand Total 3.41 3.65 3.91 4.19
ENERGY AND DEMAND REQUIREMENT
MoP has not specified any loss trajectory for
AT&C loss reduction. Thus a reasonable
reduction in line with JERC targets has been
taken into account for preparing this
roadmap document which is shown in Figure
17. A reduction of 0.10% in the T&D losses
have been considered as the losses are at
very nominal level.
Based on the loss reduction trajectory as
above, the energy and demand requirement
for the future years is tabulated in Table 34
below:
Figure 17: Projected Loss Reduction
Trajectory- Kalpeni Island
Table 34: Energy Requirement (In MU) and Peak Demand (in MW) – Kalpeni Island
Particulars Energy and Demand Scenario
FY 16 FY 17 FY 18 FY 19
Sale within State 3.41 3.65 3.91 4.19
Distribution Losses 5.82% 5.72% 5.62% 5.52%
Total Energy Requirement within Island 3.62 3.87 4.14 4.44
Load Factor 56.91% 56.91% 56.91% 56.91%
Maximum Demand – Kalpeni Island 0.73 0.78 0.83 0.89
As seen from the above, the maximum
demand requirement of the Kalpeni Islands
is projected to increase from 0.68 MW in FY
15 to 0.89 MW in FY 19 assuming an
unchanged annual load factor of 56.91% as
per actual information for FY 15.
Adoption of various energy efficiency
measures like energy efficient lighting (use
of LEDs) would also help in reducing the
peak demand of the state.
GENERATION PLAN
The total installed capacity in Kalpeni Island
as on 31st March 2015 is 1.35 MW which
included 1.25 MW of DG Sets and 0.10 MW of
SPV plant. However, 0.25 MW old DG set has
been replaced by 0.75 MW DG set on
16/02/2016. Further 1.3 MW capacity (0.50
DG + 0.80 MW Solar) has been planned to be
added by FY 19. However, the existing

24x7 Power For All (Lakshadweep Islands) 27
capacities of DG sets have derated over
passage of time. The total existing and
upcoming generation up to FY 19 in Kalpeni
Island is detailed in Table 35 below:
ADEQUACY OF GENERATION
DISTRIBUTION SYSTEM
An assessment of the adequacy of generation
and distribution infrastructure for meeting
the projected annual energy demand of 4.44
MU and peak demand of around 0.89 MW is
shown below:
Table 35: Capacity Availability from various Sources in Kalpeni Island (in MW)
Source Commissioning Installed Capacity (MW) Derated Capacity Available in MW
FY 16 FY 17 FY 18 FY 19 DG Sets Existing New 1 X 250 25-05-2009 0.25 0.16 0.16 0.16 0.16 New 1 X 250 25-05-2009 0.25 0.16 0.16 0.16 0.16 New 1 X 750 16-02-2016 0.75 0.75 0.75 0.75 0.75 Old 1 X 250 15-08-1995 0.25 0.10 0.10 0.10 0.10 Old 1 X 250 01-01-1998 0.25 0.10 0.10 0.10 0.10 DG Sets Upcoming New DG Set FY 18 0.50 0.50 0.50 Solar Existing SPV Plants Commissioned 0.10 0.10 0.10 0.10 0.10 Solar Upcoming New SPV Plants FY 19 0.80 0.80 Total 2.65 1.37 1.37 1.87 2.67
Table 36: Assessment of adequacy of Generation and Distribution in Kalpeni Island
Particulars FY 16 FY 17 FY 18 FY 19
Generation Adequacy
Total Energy Requirement within Island 3.62 3.87 4.14 4.44
Maximum Energy Availability from Own Generation (In MU) 3.94 3.94 6.10 6.90
Adequacy of Generation Adequate Adequate Adequate Adequate
Additional Energy Generation Required (in MU) 0.00 0.00 0.00 0.00
Additional Capacity Required (40% PLF) on RTC Basis 0.00 0.00 0.00 0.00
Sub-Transmission (Step-up) Adequacy
Existing Transformation Capacity (in MVA) 1.00 1.00 1.00 1.00
Planned Transformation Capacity (in MVA) 0.00 0.00 1.00 1.00
Total Transformation Capacity - Installed (in MVA) 1.00 1.00 2.00 2.00
Total Transformation Capacity - Required (in MVA)# 0.91 0.97 1.04 1.11
Adequacy of Sub-Transmission System Adequate Adequate Adequate Adequate
Additional Transformation Capacity Required (in MVA) 0.00 0.00 0.00 0.00
Distribution (Step-Down) Adequacy
Existing Transformation Capacity (in MVA) 1.15 1.15 1.15 1.15
Planned Transformation Capacity (in MVA) 0.00 0.00 0.75 0.75
Total Transformation Capacity - Installed (in MVA) 1.15 1.15 1.90 1.90
Total Transformation Capacity - Required (in MVA)# 1.00 1.07 1.14 1.22
Adequacy of Distribution (Step-Down) System Adequate Adequate Adequate Adequate
Additional Transformation Capacity Required (in MVA) 0.00 0.00 0.00 0.00
# Considering 10% Load catered directly through DG Sets
It is evident from above table that the planned capacity addition in Generation, Sub-Transmission
(considering maximum loading of 80%) and Distribution (considering maximum loading of 80%
and diversity factor of 1.1) is adequate to meet the requirement of 24x7 Power for All by FY 19 in
Kalpeni Island.

24x7 Power For All (Lakshadweep Islands) 28
CHAPTER 12: POWER SUPPLY –KAVARATTI
ABOUT KAVARATTI
The Kavaratti Island is the headquarters of
the Union Territory of Lakshadweep. This
island is at a distance of 404 km (218
nautical miles) from Kochi and is located
between Agatti Island on the west and
Andrott Island on the east. It lies between
10o 32' and 10o 35' N latitude and 72o 35'
and 72o 40' E longitude, having an area of
4.22 square km. Maximum length of the
island is 5.8 km and width is 1.6 km with a
lagoon having a length of about 6 km.
DEMAND PROJECTIONS
DETERMINATION OF CONSUMPTION
OF DOMESTIC CONSUMERS
The present energy requirement of Kavaratti
Islands during FY 15 was 10.90 MU. With
24x7 supply to be provided across the island,
the demand is likely to increase.
The average daily household consumption of
existing electrified households in FY 15 has
been arrived at by dividing the actual sales
by the actual number of electrified
consumers in FY 15 respectively.
The actual daily household consumption of
registered domestic consumers has
increased from 2.64 kWh in FY 11 to 4.84
kWh in FY 15 at CAGR of 16.39%. However,
considering the fact that average increase in
daily household consumption is more than
7% last year, and considering the increased
availability in past years along with other
demographic factors, the daily household
consumption has been escalated by 5% only.
The projected daily household consumption
in Kavaratti Island is shown below:
Figure 18: Projected Daily Household
Consumption Electricity (kWh per person)
for future years
However, it may also be kept in view that the
geographical features of the island (i.e. the
location, accessibility, weather) along with
current tariff levels play a significant role is
determining the current and future
demands.
The number of electrified households is
expected to grow at the overall decadal
CAGR of 1.48%.
Accordingly, the annual consumption of the
domestic households is tabulated below:
Table 37: Projected Sales from Existing and Newly Electrified Households
Particulars FY 15 FY 16 FY 17 FY 18 FY 19
Electrified Consumers (Existing + Projected Growth)
Electrified Consumers (in Nos.) 3,475 3,526 3,579 3,632 3,685
Daily Household Consumption (in kWh) 4.84 5.08 5.34 5.60 5.88
Total Projected Domestic Consumption (In MU) 6.14 6.54 6.97 7.43 7.92
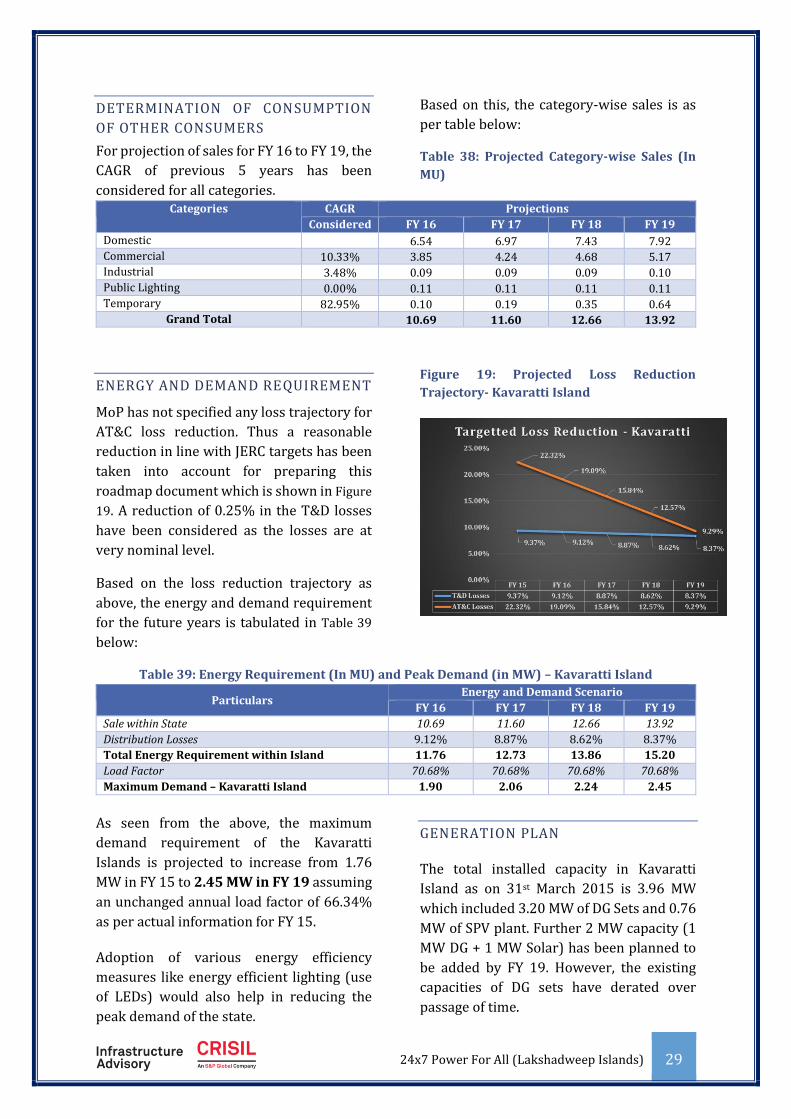
24x7 Power For All (Lakshadweep Islands) 29
DETERMINATION OF CONSUMPTION
OF OTHER CONSUMERS
For projection of sales for FY 16 to FY 19, the
CAGR of previous 5 years has been
considered for all categories.
Based on this, the category-wise sales is as
per table below:
Table 38: Projected Category-wise Sales (In
MU)
Categories CAGR Projections
Considered FY 16 FY 17 FY 18 FY 19
Domestic 6.54 6.97 7.43 7.92 Commercial 10.33% 3.85 4.24 4.68 5.17 Industrial 3.48% 0.09 0.09 0.09 0.10 Public Lighting 0.00% 0.11 0.11 0.11 0.11 Temporary 82.95% 0.10 0.19 0.35 0.64
Grand Total 10.69 11.60 12.66 13.92
ENERGY AND DEMAND REQUIREMENT
MoP has not specified any loss trajectory for
AT&C loss reduction. Thus a reasonable
reduction in line with JERC targets has been
taken into account for preparing this
roadmap document which is shown in Figure
19. A reduction of 0.25% in the T&D losses
have been considered as the losses are at
very nominal level.
Based on the loss reduction trajectory as
above, the energy and demand requirement
for the future years is tabulated in Table 39
below:
Figure 19: Projected Loss Reduction
Trajectory- Kavaratti Island
Table 39: Energy Requirement (In MU) and Peak Demand (in MW) – Kavaratti Island
Particulars Energy and Demand Scenario
FY 16 FY 17 FY 18 FY 19
Sale within State 10.69 11.60 12.66 13.92
Distribution Losses 9.12% 8.87% 8.62% 8.37%
Total Energy Requirement within Island 11.76 12.73 13.86 15.20
Load Factor 70.68% 70.68% 70.68% 70.68%
Maximum Demand – Kavaratti Island 1.90 2.06 2.24 2.45
As seen from the above, the maximum
demand requirement of the Kavaratti
Islands is projected to increase from 1.76
MW in FY 15 to 2.45 MW in FY 19 assuming
an unchanged annual load factor of 66.34%
as per actual information for FY 15.
Adoption of various energy efficiency
measures like energy efficient lighting (use
of LEDs) would also help in reducing the
peak demand of the state.
GENERATION PLAN
The total installed capacity in Kavaratti
Island as on 31st March 2015 is 3.96 MW
which included 3.20 MW of DG Sets and 0.76
MW of SPV plant. Further 2 MW capacity (1
MW DG + 1 MW Solar) has been planned to
be added by FY 19. However, the existing
capacities of DG sets have derated over
passage of time.
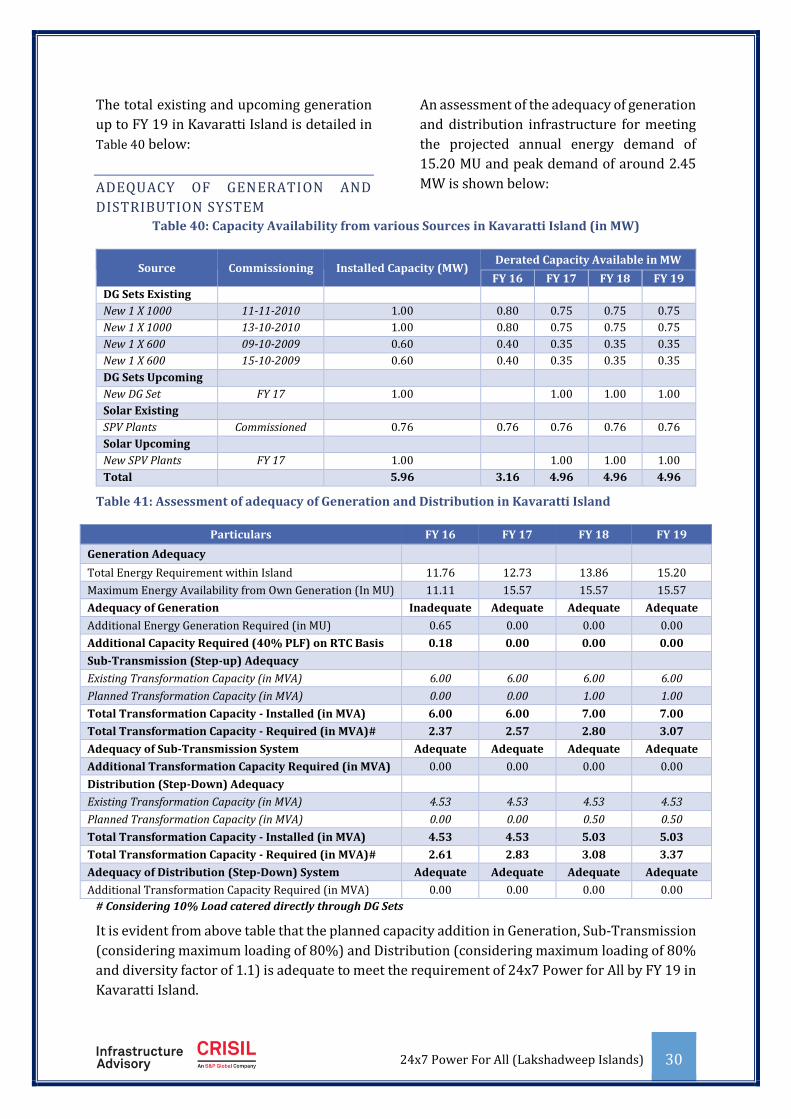
24x7 Power For All (Lakshadweep Islands) 30
The total existing and upcoming generation
up to FY 19 in Kavaratti Island is detailed in
Table 40 below:
ADEQUACY OF GENERATION AND
DISTRIBUTION SYSTEM
An assessment of the adequacy of generation
and distribution infrastructure for meeting
the projected annual energy demand of
15.20 MU and peak demand of around 2.45
MW is shown below:
Table 40: Capacity Availability from various Sources in Kavaratti Island (in MW)
Source Commissioning Installed Capacity (MW) Derated Capacity Available in MW
FY 16 FY 17 FY 18 FY 19
DG Sets Existing
New 1 X 1000 11-11-2010 1.00 0.80 0.75 0.75 0.75
New 1 X 1000 13-10-2010 1.00 0.80 0.75 0.75 0.75
New 1 X 600 09-10-2009 0.60 0.40 0.35 0.35 0.35
New 1 X 600 15-10-2009 0.60 0.40 0.35 0.35 0.35
DG Sets Upcoming
New DG Set FY 17 1.00 1.00 1.00 1.00
Solar Existing
SPV Plants Commissioned 0.76 0.76 0.76 0.76 0.76
Solar Upcoming
New SPV Plants FY 17 1.00 1.00 1.00 1.00
Total 5.96 3.16 4.96 4.96 4.96
Table 41: Assessment of adequacy of Generation and Distribution in Kavaratti Island
Particulars FY 16 FY 17 FY 18 FY 19
Generation Adequacy
Total Energy Requirement within Island 11.76 12.73 13.86 15.20
Maximum Energy Availability from Own Generation (In MU) 11.11 15.57 15.57 15.57
Adequacy of Generation Inadequate Adequate Adequate Adequate
Additional Energy Generation Required (in MU) 0.65 0.00 0.00 0.00
Additional Capacity Required (40% PLF) on RTC Basis 0.18 0.00 0.00 0.00
Sub-Transmission (Step-up) Adequacy
Existing Transformation Capacity (in MVA) 6.00 6.00 6.00 6.00
Planned Transformation Capacity (in MVA) 0.00 0.00 1.00 1.00
Total Transformation Capacity - Installed (in MVA) 6.00 6.00 7.00 7.00
Total Transformation Capacity - Required (in MVA)# 2.37 2.57 2.80 3.07
Adequacy of Sub-Transmission System Adequate Adequate Adequate Adequate
Additional Transformation Capacity Required (in MVA) 0.00 0.00 0.00 0.00
Distribution (Step-Down) Adequacy
Existing Transformation Capacity (in MVA) 4.53 4.53 4.53 4.53
Planned Transformation Capacity (in MVA) 0.00 0.00 0.50 0.50
Total Transformation Capacity - Installed (in MVA) 4.53 4.53 5.03 5.03
Total Transformation Capacity - Required (in MVA)# 2.61 2.83 3.08 3.37
Adequacy of Distribution (Step-Down) System Adequate Adequate Adequate Adequate
Additional Transformation Capacity Required (in MVA) 0.00 0.00 0.00 0.00
# Considering 10% Load catered directly through DG Sets
It is evident from above table that the planned capacity addition in Generation, Sub-Transmission
(considering maximum loading of 80%) and Distribution (considering maximum loading of 80%
and diversity factor of 1.1) is adequate to meet the requirement of 24x7 Power for All by FY 19 in
Kavaratti Island.

24x7 Power For All (Lakshadweep Islands) 31
CHAPTER 13: POWER SUPPLY –KILTAN ISLAND
ABOUT KILTAN
The Kiltan Island lies 51 km north-east of
Amini Island, between 11° 28' and 11° 30' N
latitude and 72° 59' and 73° 01' E longitude,
and has an area of 2.20 square km. It has 3.4
km length and 0.6 km width at the broadest
point. On the northern and southern ends of
the island, there are high storm beaches.
This island is 394 km (213 nautical miles)
away from Kochi. Its lagoon area is 1.76
square km.
DEMAND PROJECTIONS
DETERMINATION OF CONSUMPTION
OF DOMESTIC CONSUMERS
The present energy requirement of Kiltan
Islands during FY 15 was 2.58 MU. With
24x7 supply to be provided across the island,
the demand is likely to increase.
The average daily household consumption of
existing electrified households in FY 15 has
been arrived at by dividing the actual sales
by the actual number of electrified
consumers in FY 15 respectively.
The actual daily household consumption of
registered domestic consumers has
increased from 2.07 kWh in FY 11 to 3.27
kWh in FY 15 at CAGR of 12.04%. However,
considering the fact that average increase in
daily household consumption is less than 4%
last year, and considering the increased
availability in past years along with other
demographic factors, the daily household
consumption has been escalated by 3% only.
The projected daily household consumption
in Kiltan Island is shown below:
Figure 20: Projected Daily Household
Consumption Electricity (kWh per person)
for future years
However, it may also be kept in view that the
geographical features of the island (i.e. the
location, accessibility, weather) along with
current tariff levels play a significant role is
determining the current and future
demands.
The number of electrified households is
expected to grow at the overall decadal
CAGR of 1.48%.
Accordingly, the annual consumption of the
domestic households is tabulated below:
Table 42: Projected Sales from Existing and Newly Electrified Households
Particulars FY 15 FY 16 FY 17 FY 18 FY 19
Electrified Consumers (Existing + Projected Growth)
Electrified Consumers (in Nos.) 1,500 1,522 1,545 1,568 1,591
Daily Household Consumption (in kWh) 3.27 3.36 3.47 3.57 3.68
Total Projected Domestic Consumption (In MU) 1.79 1.87 1.95 2.04 2.14
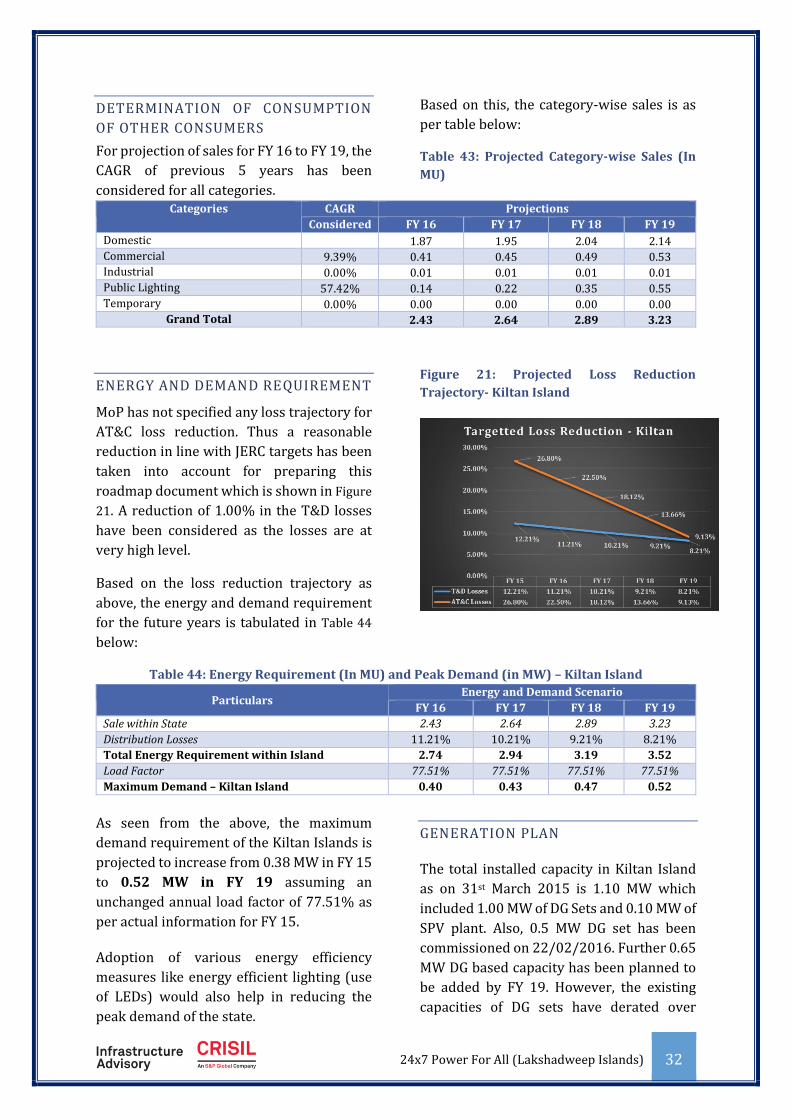
24x7 Power For All (Lakshadweep Islands) 32
DETERMINATION OF CONSUMPTION
OF OTHER CONSUMERS
For projection of sales for FY 16 to FY 19, the
CAGR of previous 5 years has been
considered for all categories.
Based on this, the category-wise sales is as
per table below:
Table 43: Projected Category-wise Sales (In
MU)
Categories CAGR Projections
Considered FY 16 FY 17 FY 18 FY 19
Domestic 1.87 1.95 2.04 2.14 Commercial 9.39% 0.41 0.45 0.49 0.53 Industrial 0.00% 0.01 0.01 0.01 0.01 Public Lighting 57.42% 0.14 0.22 0.35 0.55 Temporary 0.00% 0.00 0.00 0.00 0.00
Grand Total 2.43 2.64 2.89 3.23
ENERGY AND DEMAND REQUIREMENT
MoP has not specified any loss trajectory for
AT&C loss reduction. Thus a reasonable
reduction in line with JERC targets has been
taken into account for preparing this
roadmap document which is shown in Figure
21. A reduction of 1.00% in the T&D losses
have been considered as the losses are at
very high level.
Based on the loss reduction trajectory as
above, the energy and demand requirement
for the future years is tabulated in Table 44
below:
Figure 21: Projected Loss Reduction
Trajectory- Kiltan Island
Table 44: Energy Requirement (In MU) and Peak Demand (in MW) – Kiltan Island
Particulars Energy and Demand Scenario
FY 16 FY 17 FY 18 FY 19
Sale within State 2.43 2.64 2.89 3.23
Distribution Losses 11.21% 10.21% 9.21% 8.21%
Total Energy Requirement within Island 2.74 2.94 3.19 3.52
Load Factor 77.51% 77.51% 77.51% 77.51%
Maximum Demand – Kiltan Island 0.40 0.43 0.47 0.52
As seen from the above, the maximum
demand requirement of the Kiltan Islands is
projected to increase from 0.38 MW in FY 15
to 0.52 MW in FY 19 assuming an
unchanged annual load factor of 77.51% as
per actual information for FY 15.
Adoption of various energy efficiency
measures like energy efficient lighting (use
of LEDs) would also help in reducing the
peak demand of the state.
GENERATION PLAN
The total installed capacity in Kiltan Island
as on 31st March 2015 is 1.10 MW which
included 1.00 MW of DG Sets and 0.10 MW of
SPV plant. Also, 0.5 MW DG set has been
commissioned on 22/02/2016. Further 0.65
MW DG based capacity has been planned to
be added by FY 19. However, the existing
capacities of DG sets have derated over

24x7 Power For All (Lakshadweep Islands) 33
passage of time.
The total existing and upcoming generation
up to FY 19 in Kiltan Island is detailed in
Table 40 below:
ADEQUACY OF GENERATION AND
DISTRIBUTION SYSTEM
An assessment of the adequacy of generation
and distribution infrastructure for meeting
the projected annual energy demand of 3.52
MU and peak demand of around 0.52 MW is
shown below:
Table 45: Capacity Availability from various Sources in Kiltan Island (in MW)
Source Commissioning Installed Capacity (MW) Derated Capacity Available in MW
FY 16 FY 17 FY 18 FY 19
DG Sets Existing
New 1 X 500 22-02-2016 0.50 0.50 0.50 0.50 0.50
New 1 X 400 13-08-2008 0.40 0.32 0.30 0.30 0.30
New 1 X 400 14-08-2008 0.40 0.32 0.30 0.30 0.30
Old 1 X 200 22-05-1996 0.20 0.08 0.07 0.07 0.07
DG Sets Upcoming
New DG Set FY 17 0.65 0.65 0.65 0.65
Solar Existing
SPV Plants Commissioned 0.10 0.10 0.10 0.10 0.10
Solar Upcoming
New SPV Plants 0.00 0.00 0.00 0.00
Total 2.25 1.32 1.92 1.92 1.92
Table 46: Assessment of adequacy of Generation and Distribution in Kiltan Island
Particulars FY 16 FY 17 FY 18 FY 19
Generation Adequacy
Total Energy Requirement within Island 2.74 2.94 3.19 3.52
Maximum Energy Availability from Own Generation (In MU) 5.23 7.83 7.83 7.83
Adequacy of Generation Adequate Adequate Adequate Adequate
Additional Energy Generation Required (in MU) 0.00 0.00 0.00 0.00
Additional Capacity Required (40% PLF) on RTC Basis 0.00 0.00 0.00 0.00
Sub-Transmission (Step-up) Adequacy
Existing Transformation Capacity (in MVA) 1.10 1.10 1.10 1.10
Planned Transformation Capacity (in MVA) 0.00 0.00 1.00 1.00
Total Transformation Capacity - Installed (in MVA) 1.10 1.10 2.10 2.10
Total Transformation Capacity - Required (in MVA)# 0.50 0.54 0.59 0.65
Adequacy of Sub-Transmission System Adequate Adequate Adequate Adequate
Additional Transformation Capacity Required (in MVA) 0.00 0.00 0.00 0.00
Distribution (Step-Down) Adequacy
Existing Transformation Capacity (in MVA) 0.70 0.70 0.70 0.70
Planned Transformation Capacity (in MVA) 0.00 0.00 0.25 0.25
Total Transformation Capacity - Installed (in MVA) 0.70 0.70 0.95 0.95
Total Transformation Capacity - Required (in MVA)# 0.55 0.59 0.65 0.71
Adequacy of Distribution (Step-Down) System Adequate Adequate Adequate Adequate
Additional Transformation Capacity Required (in MVA) 0.00 0.00 0.00 0.00
# Considering 10% Load catered directly through DG Sets
It is evident from above table that the planned capacity addition in Generation, Sub-Transmission
(considering maximum loading of 80%) and Distribution (considering maximum loading of 80%
and diversity factor of 1.1) is adequate to meet the requirement of 24x7 Power for All by FY 19 in
Kiltan Island.
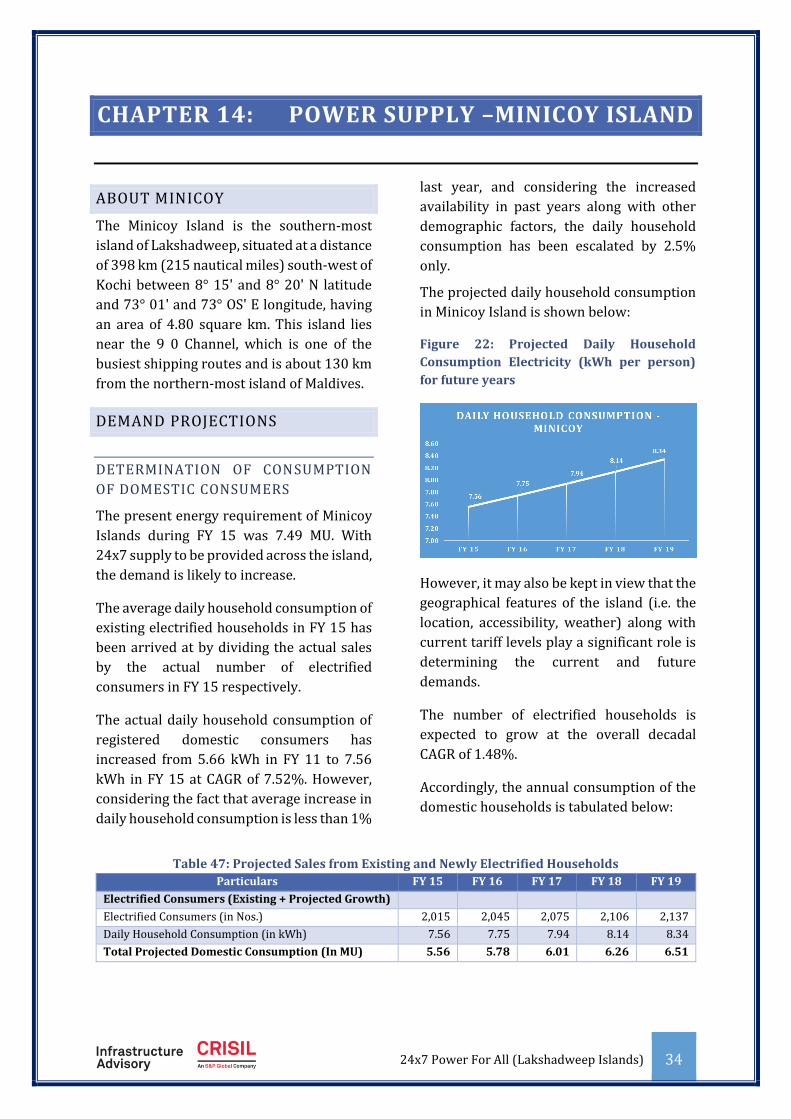
24x7 Power For All (Lakshadweep Islands) 34
CHAPTER 14: POWER SUPPLY –MINICOY ISLAND
ABOUT MINICOY
The Minicoy Island is the southern-most
island of Lakshadweep, situated at a distance
of 398 km (215 nautical miles) south-west of
Kochi between 8° 15' and 8° 20' N latitude
and 73° 01' and 73° OS' E longitude, having
an area of 4.80 square km. This island lies
near the 9 0 Channel, which is one of the
busiest shipping routes and is about 130 km
from the northern-most island of Maldives.
DEMAND PROJECTIONS
DETERMINATION OF CONSUMPTION
OF DOMESTIC CONSUMERS
The present energy requirement of Minicoy
Islands during FY 15 was 7.49 MU. With
24x7 supply to be provided across the island,
the demand is likely to increase.
The average daily household consumption of
existing electrified households in FY 15 has
been arrived at by dividing the actual sales
by the actual number of electrified
consumers in FY 15 respectively.
The actual daily household consumption of
registered domestic consumers has
increased from 5.66 kWh in FY 11 to 7.56
kWh in FY 15 at CAGR of 7.52%. However,
considering the fact that average increase in
daily household consumption is less than 1%
last year, and considering the increased
availability in past years along with other
demographic factors, the daily household
consumption has been escalated by 2.5%
only.
The projected daily household consumption
in Minicoy Island is shown below:
Figure 22: Projected Daily Household
Consumption Electricity (kWh per person)
for future years
However, it may also be kept in view that the
geographical features of the island (i.e. the
location, accessibility, weather) along with
current tariff levels play a significant role is
determining the current and future
demands.
The number of electrified households is
expected to grow at the overall decadal
CAGR of 1.48%.
Accordingly, the annual consumption of the
domestic households is tabulated below:
Table 47: Projected Sales from Existing and Newly Electrified Households
Particulars FY 15 FY 16 FY 17 FY 18 FY 19
Electrified Consumers (Existing + Projected Growth)
Electrified Consumers (in Nos.) 2,015 2,045 2,075 2,106 2,137
Daily Household Consumption (in kWh) 7.56 7.75 7.94 8.14 8.34
Total Projected Domestic Consumption (In MU) 5.56 5.78 6.01 6.26 6.51
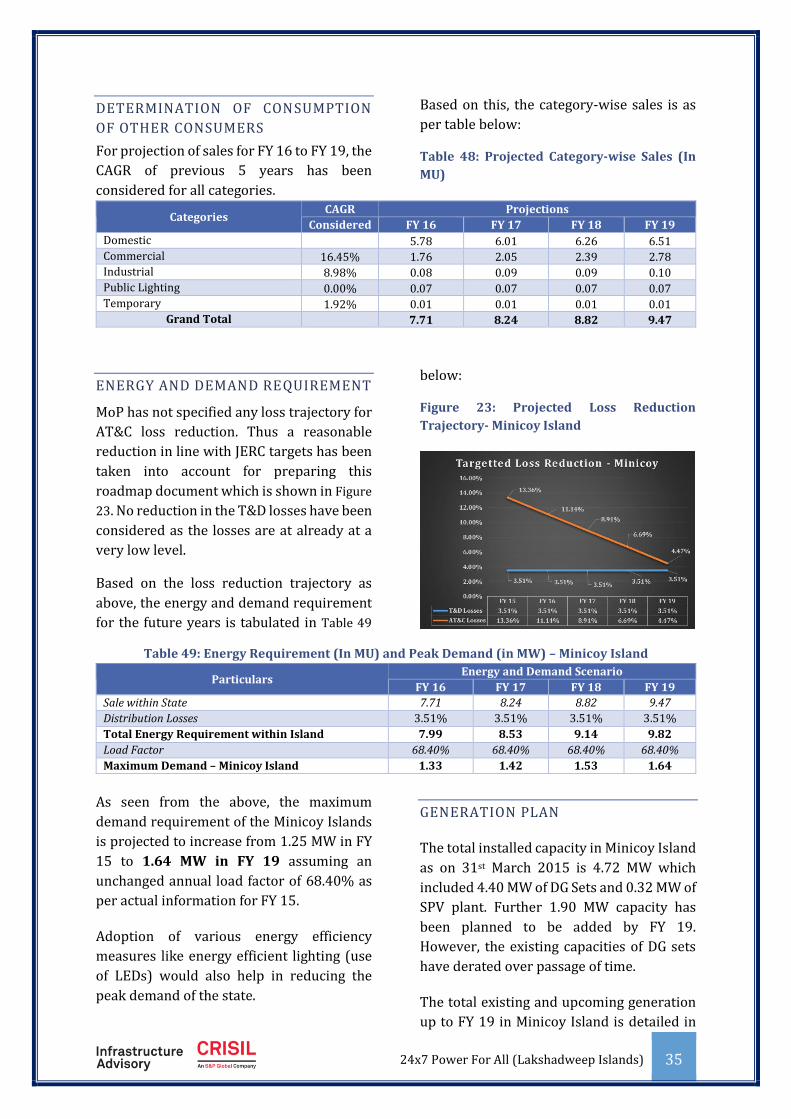
24x7 Power For All (Lakshadweep Islands) 35
DETERMINATION OF CONSUMPTION
OF OTHER CONSUMERS
For projection of sales for FY 16 to FY 19, the
CAGR of previous 5 years has been
considered for all categories.
Based on this, the category-wise sales is as
per table below:
Table 48: Projected Category-wise Sales (In
MU)
Categories CAGR Projections
Considered FY 16 FY 17 FY 18 FY 19
Domestic 5.78 6.01 6.26 6.51 Commercial 16.45% 1.76 2.05 2.39 2.78 Industrial 8.98% 0.08 0.09 0.09 0.10 Public Lighting 0.00% 0.07 0.07 0.07 0.07 Temporary 1.92% 0.01 0.01 0.01 0.01
Grand Total 7.71 8.24 8.82 9.47
ENERGY AND DEMAND REQUIREMENT
MoP has not specified any loss trajectory for
AT&C loss reduction. Thus a reasonable
reduction in line with JERC targets has been
taken into account for preparing this
roadmap document which is shown in Figure
23. No reduction in the T&D losses have been
considered as the losses are at already at a
very low level.
Based on the loss reduction trajectory as
above, the energy and demand requirement
for the future years is tabulated in Table 49
below:
Figure 23: Projected Loss Reduction
Trajectory- Minicoy Island
Table 49: Energy Requirement (In MU) and Peak Demand (in MW) – Minicoy Island
Particulars Energy and Demand Scenario
FY 16 FY 17 FY 18 FY 19
Sale within State 7.71 8.24 8.82 9.47
Distribution Losses 3.51% 3.51% 3.51% 3.51%
Total Energy Requirement within Island 7.99 8.53 9.14 9.82
Load Factor 68.40% 68.40% 68.40% 68.40%
Maximum Demand – Minicoy Island 1.33 1.42 1.53 1.64
As seen from the above, the maximum
demand requirement of the Minicoy Islands
is projected to increase from 1.25 MW in FY
15 to 1.64 MW in FY 19 assuming an
unchanged annual load factor of 68.40% as
per actual information for FY 15.
Adoption of various energy efficiency
measures like energy efficient lighting (use
of LEDs) would also help in reducing the
peak demand of the state.
GENERATION PLAN
The total installed capacity in Minicoy Island
as on 31st March 2015 is 4.72 MW which
included 4.40 MW of DG Sets and 0.32 MW of
SPV plant. Further 1.90 MW capacity has
been planned to be added by FY 19.
However, the existing capacities of DG sets
have derated over passage of time.
The total existing and upcoming generation
up to FY 19 in Minicoy Island is detailed in
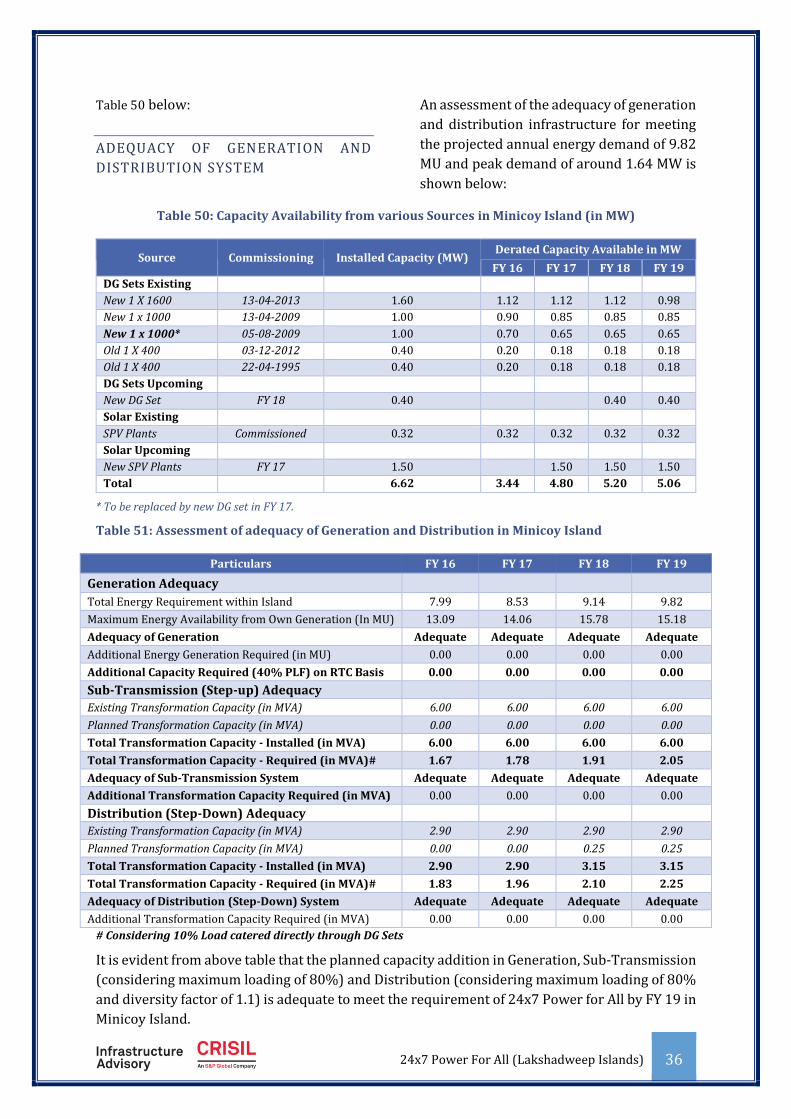
24x7 Power For All (Lakshadweep Islands) 36
Table 50 below:
ADEQUACY OF GENERATION AND
DISTRIBUTION SYSTEM
An assessment of the adequacy of generation
and distribution infrastructure for meeting
the projected annual energy demand of 9.82
MU and peak demand of around 1.64 MW is
shown below:
Table 50: Capacity Availability from various Sources in Minicoy Island (in MW)
Source Commissioning Installed Capacity (MW) Derated Capacity Available in MW
FY 16 FY 17 FY 18 FY 19
DG Sets Existing
New 1 X 1600 13-04-2013 1.60 1.12 1.12 1.12 0.98
New 1 x 1000 13-04-2009 1.00 0.90 0.85 0.85 0.85
New 1 x 1000* 05-08-2009 1.00 0.70 0.65 0.65 0.65
Old 1 X 400 03-12-2012 0.40 0.20 0.18 0.18 0.18
Old 1 X 400 22-04-1995 0.40 0.20 0.18 0.18 0.18
DG Sets Upcoming
New DG Set FY 18 0.40 0.40 0.40
Solar Existing
SPV Plants Commissioned 0.32 0.32 0.32 0.32 0.32
Solar Upcoming
New SPV Plants FY 17 1.50 1.50 1.50 1.50
Total 6.62 3.44 4.80 5.20 5.06
* To be replaced by new DG set in FY 17.
Table 51: Assessment of adequacy of Generation and Distribution in Minicoy Island
Particulars FY 16 FY 17 FY 18 FY 19
Generation Adequacy
Total Energy Requirement within Island 7.99 8.53 9.14 9.82
Maximum Energy Availability from Own Generation (In MU) 13.09 14.06 15.78 15.18
Adequacy of Generation Adequate Adequate Adequate Adequate
Additional Energy Generation Required (in MU) 0.00 0.00 0.00 0.00
Additional Capacity Required (40% PLF) on RTC Basis 0.00 0.00 0.00 0.00
Sub-Transmission (Step-up) Adequacy
Existing Transformation Capacity (in MVA) 6.00 6.00 6.00 6.00
Planned Transformation Capacity (in MVA) 0.00 0.00 0.00 0.00
Total Transformation Capacity - Installed (in MVA) 6.00 6.00 6.00 6.00
Total Transformation Capacity - Required (in MVA)# 1.67 1.78 1.91 2.05
Adequacy of Sub-Transmission System Adequate Adequate Adequate Adequate
Additional Transformation Capacity Required (in MVA) 0.00 0.00 0.00 0.00
Distribution (Step-Down) Adequacy
Existing Transformation Capacity (in MVA) 2.90 2.90 2.90 2.90
Planned Transformation Capacity (in MVA) 0.00 0.00 0.25 0.25
Total Transformation Capacity - Installed (in MVA) 2.90 2.90 3.15 3.15
Total Transformation Capacity - Required (in MVA)# 1.83 1.96 2.10 2.25
Adequacy of Distribution (Step-Down) System Adequate Adequate Adequate Adequate
Additional Transformation Capacity Required (in MVA) 0.00 0.00 0.00 0.00
# Considering 10% Load catered directly through DG Sets
It is evident from above table that the planned capacity addition in Generation, Sub-Transmission
(considering maximum loading of 80%) and Distribution (considering maximum loading of 80%
and diversity factor of 1.1) is adequate to meet the requirement of 24x7 Power for All by FY 19 in
Minicoy Island.

24x7 Power For All (Lakshadweep Islands) 37
CHAPTER 15: OVERALL SCENARIO
AGGREGATE DEMAND
On the basis of island-wise demand
assessment discussed in previous chapters,
the overall demand projections of
Lakshadweep Islands is shown in figure
below:
Figure 24: Projected Maximum Demand for
Lakshadweep Islands (in MW)
The maximum demand is projected to grow
from present 8.24 MW in FY 15 to 10.85 MW
in FY 19 (Refer table 79 in Annexure 3).
OVERALL DAILY HOUSEHOLD
CONSUMPTION
On the basis of island-wise domestic
consumers and sales in domestic category
discussed in previous chapters, the overall
Daily Household Consumption for
Lakshadweep Islands is shown in figure
below (Refer table 78 in Annexure 2): Figure 25: Projected Daily Household
Consumption - Lakshadweep Islands
OVERALL PER-CAPITA
CONSUMPTION
On the basis of island-wise population and
overall sales in domestic category discussed
in previous chapters, the overall Per Capita
Consumption for Lakshadweep Islands is
shown in figure below:
Figure 26: Projected Per-Capita Consumption
- Lakshadweep Islands
OVERALL LOSS TRAJECTORY
On the basis of island-wise demand
assessment discussed in previous chapters,
the overall trajectory for AT&C and T&D
Losses for Lakshadweep Islands is shown in
figure below:
Figure 27: Projected Loss Reduction
Trajectory- Lakshadweep Islands
Being an underground system, the overall
T&D Losses are very nominal. The high
AT&C losses is primarily due to the lower
collection efficiency, which is now targeted
to be improved to a level of 99% in FY 19.

24x7 Power For All (Lakshadweep Islands) 38
CHAPTER 16: GREEN ISLAND INITIATIVES
GREEN ISLAND INITIATIVE
Government of India has taken a strategic
decision for conversion of Lakshadweep
Islands into 100% Green Islands.
Ministry of New and Renewable Energy has
fixed a target of 10 MW rooftop solar plants
to be achieved by the year 2022. As a
preliminary requirement for executing the
project, power department has assessed the
available roof area of Government buildings
throughout the inhabited islands of this
Union Territory.
Since the allowable height of the buildings is
nine meters i.e. ground+2, initial preference
will be given to three storied buildings so
that shadow free are can be ensured and
there will not be further extension of the
buildings. Moreover, as the 11 kV Grid is
available adjacent to these buildings, feeding
the power to grid will also not an issue.
As the rooftop solar plants are of grid
interactive one without battery backup, the
generation from the plant will be available
during day time only. Hence such plants
could be used for peak shaving at day time
and can take away a major portion of the day
time demand from Diesel Generating sets.
To achieve the target allocated by the
Ministry a road map has already been
prepared to achieve the target by the year
2022.
The capacity addition proposed for each
island is as follows:
Table 52: Year-wise planned Capacity Addition in Rooftop Solar (in MW)
Island FY 16 FY 17 FY 18 FY 19 FY 20 FY 21 FY 22
Agatti 0.10 1
Amini 0.10 1
Androth 0.32 1.5
Bitra 0.10
Chetlat 0.10 0.6
Kadmat 0.15 1
Kalpeni 0.10 0.8
Kavaratti 0.76 1 1
Kiltan 0.10 0.6
Minicoy 0.32 1.5
Capacity Addition During the Year 2.50 2.00 1.80 1.20 1.50 1.00
Aggregate Capacity 2.15 4.65 6.65 8.45 9.65 11.15 12.15
LEDA (Lakshadweep Energy Development
Agency), with the assistance of PWD, has
made an initial assessment that the RCC Roof
area is sufficient to install 1 MW roof top
solar plant in the capital island. Possibility is
being explored with the help of SECI to get a
third party installing the plant and dept.
having a Power Purchase agreement with
them at the tariff rate fixed by JERC.
Geographical separation of these islands
could be a hurdle in this aspect, in that case
dept. has to get fund either through budget
allocation or other possibilities including
availing loan from nationalized banks could
be explored.

24x7 Power For All (Lakshadweep Islands) 39
PRESENT STATUS OF EXISTING
SPV POWER PLANTS
i. 760 kWp Grid Interactive SPV plant at
Kavaratti: Three power conditioning
units are defective at this plant, 2 Nos 110
kVA and 1 No. 50 kVA, i.e. 270 kVA
capacity is kept idle.
ii. 320 kWp SPV power plant at Andrott:
100 kWp unit is kept idle and 220 kWp
new addition is functioning smoothly.
Decommissioning and erection works of
old plants are to be carried out.
iii. 220 kWp plant at Minicoy: The plant is
kept idle due to defective PCUs, 3 Nos
PCUs are defective.
iv. 100 kWp at Agatti: The plant is
generating at full capacity, but one of the
50 kVA PCUs are developed a snag,
tripping in between, which is to be
attended for smooth functioning of the
plant.
v. 100 kWP plant at Kiltan: Both the 50
kVA PCUs are defective and plant kept
idle. New RCC control is constructed and
it is to be occupied by shifting control
units from old bunk house. A 100 kWp
indoor transformer is to be purchased for
this plant.
vi. 100 kWp plant at Kalpeni: Both the 50
kVA PCUs are defective and hence the
plant is kept idle. Renovation by changing
old modules is to be carried out.
vii. 260 kWp plant at Kadmath: 110 kWp
new addition is working smoothly but old
150 kWp unit is kept idle due to defective
PCUs and want of battery bank.
viii. 50 kWp standalone SPV power plant
at Bitra: Erection works are completed at
this plant only commissioning is pending.
ix. 50 kWp plant at Bangaram: Plant is
kept idle due to defective PCUs. The
battery bank shifted from Kadmath is to
be commissioned.
GOI INTERVENTIONS REQUESTED
ISSUES WITH BHEL
Out of a total installed capacity of 1960 kWp,
only 920 kWp only is generating (490 kWp
at Kavaratti, 220 kWp at Andrott, 100 kWp
at Agatti and 110 kWp at Kadmath) and
1040 kWp is kept idle.
The work is held up due to pending
payments to M/s BHEL. The firm has
stopped attending the operation &
maintenance of the plant. Around 4.5 crore
is pending to be released to the firm for want
fund from MNRE. Ministry has released Rs. 3
crore during Aug. 2015 which is being
released to BHEL.
Ministry of Power is required to intervene
and take up the matter with MNRE /BHEL
for prompt resolution of this issue.
ADVISORY TO SECI
SECI may be advised to take up the field
survey so that the capacity of solar plants
that can be installed in the available roof
tops in each of the islands can be finalized
and implementation process could be
commenced at the earliest.
.

24x7 Power For All (Lakshadweep Islands) 40
CHAPTER 17: ENERGY EFFICIENCY PROGRAM
LED STREET LIGHTING
The Power Department has already replaced
2980 numbers of ordinary street lights with
energy efficient LED sets. Another 500
numbers are under supply which will
replace the remaining ordinary street lights
at Chetlat and Kiltan Island. With this Chetlat
island will be without ordinary street lights
along with Bitra which is already an LED
island. Distribution of street lights both LED
and ordinary at each island is as follows.
Island No of Street Lights
LED Street Lights
Balance
Agatti 541 305 236
Amini 664 435 229
Andrott 833 385 448
Bangaram 50 0 50
Bitra 80 80 0
Chetlat 380 380 0
Kadmat 664 310 354
Kalpeni 527 285 242
Kavaratti 1163 465 698
Kiltan 423 400 23
Minicoy 730 435 295
Total 6055 3480 2575
Estimated cost is Rs. 1 Crores (Rs. 3950/- per
set X 2575).
DOMESTIC EFFICIENT LIGHTING
PROGRAMME (DELP)
As per the industry statistics, a large
numbers of incandescent lamps are still
used in households to serve the lighting
needs. Incandescent lamps are highly
inefficient and 95% of electricity used by
them is converted to heat. They can be
replaced by LED lamps, which are 90%
more energy efficient.
Penetration of efficient lights in
households is constrained by the first
high cost barrier. The incandescent
lamps are available at Rs. 10-15 while
LED sell at Rs, 400-500 as a result the
penetration of LEDs in household sector
is less than 1%.
EESL has developed and implemented a
scheme called Domestic Efficient
Lighting Scheme (DELP) to provide
energy efficient LED lighting to grid-
connected consumers in the domestic
sector across Indian cities and states
where high quality LED bulbs are given
to households at an affordable price to
encourage them to invest in energy
efficiency. The large-scale replacement
of incandescent lamps and CFL’s with
LEDs leads to savings in peak power for
DISCOMs and lower power consumption
of households.
An independent mechanism for
monitoring and verification of savings
shall be established.
Under the programme LEDA will
purchase the required LED bulbs of 9W
and tubes of 18W. Two LED bulbs and
one LED tube will be provide to all
domestic consumers.
The LEDs will be given at an upfront cost
of Rs. 10/- each. The balance cost
towards actual price of the LED bulbs
and tubes as discovered through
competitive bidding will be recovered
from consumer’s electricity bill over a
period of 10-15 months. Subjected to a
maximum of Rs. 20/- for each LED bulb
& tube every month.

24x7 Power For All (Lakshadweep Islands) 41
Tentative cost of LED bulbs 9W and
tubes 18 W may be Rs. 80-90/- and Rs.
250-350/- respectively.
A 9 W LED could replace a 60 W
incandescent lamp and a 14 W CFL and
18W led tube will replace 40W
conventional tube. Through distribution
of two LED’s and 1 tube under DELP in
the domestic sector of Lakshadweep,
considering all domestic consumers
avail the scheme, the estimated overall
reduction of demand shall be 13.74 MW
and the annual total energy savings shall
be 17.55 Million kWH. The scheme shall
result into an estimated annual power
procurement cost savings of INR 3.79
Crores.
A plan to cover all the inhabited islands is
being prepared by the department. The
estimated annual energy savings and
estimated annual savings in power
procurement cost are indicated below:
S.N. Particulars Costs/
Savings
1 No. of Domestic Households (Nos.)
11,013
2 No. of LED bulbs to be distributed (@2Nos. to each)
22,026
3 Wattage of 1 ICL (60 W) and 1 CFL (14W) to be replaced (Watt)
37
4 Wattage of LEDs (Watt) 9
5 Reduction of power consumption per bulb (Watt)
28
6
Total annual energy consumption reduction in UT 3.5 Hours/day for 365 days (MU)
0.79
7 Total monetary savings @ Rs. 20/unit (Rs.)
1.58
S.N. Particulars Costs/
Savings
1 No. of Domestic households (Nos.)
11,013
2 No. of LED Tubes to be distributed (@1Nos. to each)
11,013
3 Wattage of 1 tube (40 W) to be replaced (Watt)
40
4 Wattage of LEDs Tube (Watt) 18
5 Reduction of power consumption per bulb (Watt)
22
6
Total annual energy consumption reduction in UT 3.5 Hours/day for 365 days (MU)
0.31
7 Total monetary savings @ Rs. 20/unit (Rs.)
0.62
GOVT. BUILDINGS – LED
CONVERSION
Govt. offices and institutions are the major
consumers during day time. Load at these
buildings are lights, fans and air
conditioners. The offices are electrified with
fluorescent tubes of 36/40 W, Compact
Fluorescent Lamps of 15 to 20 W. These FTs
can be replaced with 18 W or less LED tubes
and CFLs with LED bulbs of 7/9W which will
give as much lumen as their higher rated
counter parts. Hence by opting LED lighting,
the load at Govt. Offices can be reduced by
half. For electrification of new Govt.
buildings LED bulbs & tubes and star rated
(5 star or 3 star) energy efficient fans and air
conditioners will be made mandatory. While
replacing the defective fans the star rated
one should be used so that old fans will be
eliminated completely gradually.
The department is preparing proposal
for same and will submit same for
approval of competent authority by
September 2016. The UT will implement
this scheme completely by end of FY 17.
24x7 Power For All (Lakshadweep Islands) 42
CHAPTER 18: STRATERGIC INTIATIVES
It has been discussed in previous chapters
that the Lakshadweep Islands are already
supplying 24X7 power to all its consumers
and would continue to do so till FY 19.
However, it is observed that all the Islands
are standalone grid among themselves and
are not connected either within themselves
or with the National Grid. In the absence of
DG failures, there is no alternate supply
arrangement. The Power Department of
Lakshadweep had thus considered following
proposals for further review and
consideration of Administration of
Lakshadweep and Government of India.
Detailed proposals will be submitted in due
course of time.
2 MW BARGE MOUNTED DG SET
Unmortised powerships, known as power
barges, are power plants installed on a
deck barge. These are sometimes called
“floating power plants” or “barge mounted
power plants”.
Some of the advantages of the Power Barge
are as follows:
• Constructed in shipyards under controlled conditions
• Relatively fast Construction dependent upon equipment availability
• Can utilize any electrical generating technologies
• Transportable power; large capacity can be moved to areas of need quickly
• Fuels can be supplied by ocean transport and stored in adjacent barges
• Financially viable asset for installation in developing countries
FPP operations are carried out very much
the same as land based facilities, with the
plant being dispatched in accordance with
grid demand. Irrespective of the generating
technology installed, the FFP is fitted with an
onboard control room complete with data
acquisition and all machinery and
equipment controls. Switchgear, motor
controllers, main breakers and station and
step up transformers are all installed on the
barge.
The scheme is expected to cost around Rs 5-
10 Crores.
FLOATING SOLAR AT BITRA
ISLAND
At present existing 50 kWp standalone
power plant (which is under renovation) has
been able to meet the load demand of the
island during day time which is at 30-40 kW.
The peak demand during night is around 40-
50 kW only. Addition of another 50 kWp
solar plant should make Bitra entirely a
green powered island, the Diesel Generating
sets will be in standby. The capacity of the
existing battery bank will also be properly
augmented to feed the night load.
The consultant is expected to visit the island
soon for field study. After receiving the
report, necessary environmental clearance
is to be taken from concerned, if required.
The plant may be got installed through the
SECI or through open tender.
BIOMASS BASED POWER PLANTS
Department have earlier explored the
possibility of utilizing the biomass,
especially coconut waste, which is available
in plenty, for economical generation of
power with the technical assistance of
Indian Institute of Science, Bangalore. The
technology adapted was gasification of
biomass. A 250 kW biomass gasifier plant

24x7 Power For All (Lakshadweep Islands) 43
was installed where Diesel generating set
run on dual fuel mode i.e. 80% gas and 20%
diesel. The project could not succeed due to
various reasons.
However, determined to utilize the biomass
waste to meet a part of growing power
demand of these islands, the power
department decided to install biomass
combustion route, which is a proven
technology, based power plants at three
island viz. at Andrott (2 MW), Kavaratti (2
MW) and Kadmath (1 MW). The DPR and bid
documents for the proposed project got
prepared which was further vetted by the
Ministry of New & Renewable Energy.
Ministry will fund the project at the rate of
Rs. 2 core/MW. The CFA will be released
directly to the firm. Power Department will
provide the land and logistical support.
Supplier will provide a guaranteed quantity
of electricity every year for which the power
department will make payment at the rate
quoted by the firm. After 10 – 15 years the
plant will be handed over to the dept.
The tender floated during 06/14. Even
though two firms participated neither of
them were technically qualified. Again after
rectification of flaws in the tender document
it was retendered during 06/15 but failed
attract any of the interested parties.
Meanwhile during 09/15, Engineers from
M/s Arya Energy, Raipur, who is operating
such plants in Chhattisgarh, visited Kavaratti
and had detailed discussion with the
department of Electricity and Secretary
(Power). They expressed their interest
towards executing the project. They
explained the possible hurdles such as
availability of required quantity of biomass,
ash disposal etc.
Hence they suggested to take one plant at a
time i.e. install one plant of 2 MW capacity
either at Kavaratti or Andrott operate it
successfully for a year or two understand the
logistical difficulty and then other plants
could be installed.
They also suggested some modifications to
the bid document, which are being
scrutinized and will be submitted to the
Ministry for final approval. On receiving the
vetted document it will be tendered by the
power department.
OIL STORAGE FACILITES AND
DELIVERY POINT IN THE ISLAND
GOI, Min. of Petroleum & Natural Gas
conveyed the approval to install Bulk Oil
Storage Facilities at Kavaratti and Minicoy
Islands in the sites selected by the High
Power Committees as a deposit work by IOC
vide their letter dated 19/02/2004. The
works at Kavaratti and Minicoy were started
on the basis of the initial approval of CCE,
Nagpur and on the basis of advice of Deputy
Conservator of Forests in the
Administration.
One Writ Petition (WPI 3334/06)
challenging the installation of Bulk Oil
Storage Facilities at Kavaratti, filed before
Hon’ble High Court of Kerala. Which
ultimately led to stopping the construction
activities when all the works except laying of
pipe lines were completed at Kavaratti.
Expert Appraisal Committee on CRZ in their
115th Meeting suggested the Ministry to
refer back the proposal to State Coastal Zone
Management Authority for necessary action
as the activity falls within the purview of
SCZMA. Lakshadweep Administration
decided to deposit balance amount for the
completion of works to IOC after the visit of
IOC officials. IOC restarted the works and
completed the work at Kavaratti and
obtained PESO licensee. Commissioning the
24x7 Power For All (Lakshadweep Islands) 44
facility is pending due to non-availability of
Oil barge. IOC stopped the work at Minicoy
due non-payment of revised estimate cost.
The shifting of delivery point will result in
net saving of Rs 1 per litre of HSD (BS III) and
Rs 1.46 per litre of HSD (BS IV).
PREPAID METERING PLAN
As the Electricity Department of
Lakshadweep is primarily reliant on self-
meter reading by its consumers which are
99% LT Consumers, the utility has to plan for
switching to prepaid metering.
Installation of prepaid metering will help
the department in reducing its AT&C losses
and improve its realization. Some of the
improvements which the department
envisages post implementation of prepaid
metering are:
I. Multi fold increase in revenue
collection
II. 100% consumers satisfaction
service delivery achieved
III. 100% collection efficiency and
billing efficiency for prepaid
consumers
IV. Reduction in pilferage.
Accordingly, the department will prepare a
plan for 100% prepaid metering for
approval of competent authority by July
2016 and target the conversion of all
connections within one year of approval of
the plan by the competent authority and not
later than end of FY 18. The overall cost of
the scheme will be in range of Rs 6-8 Crores.
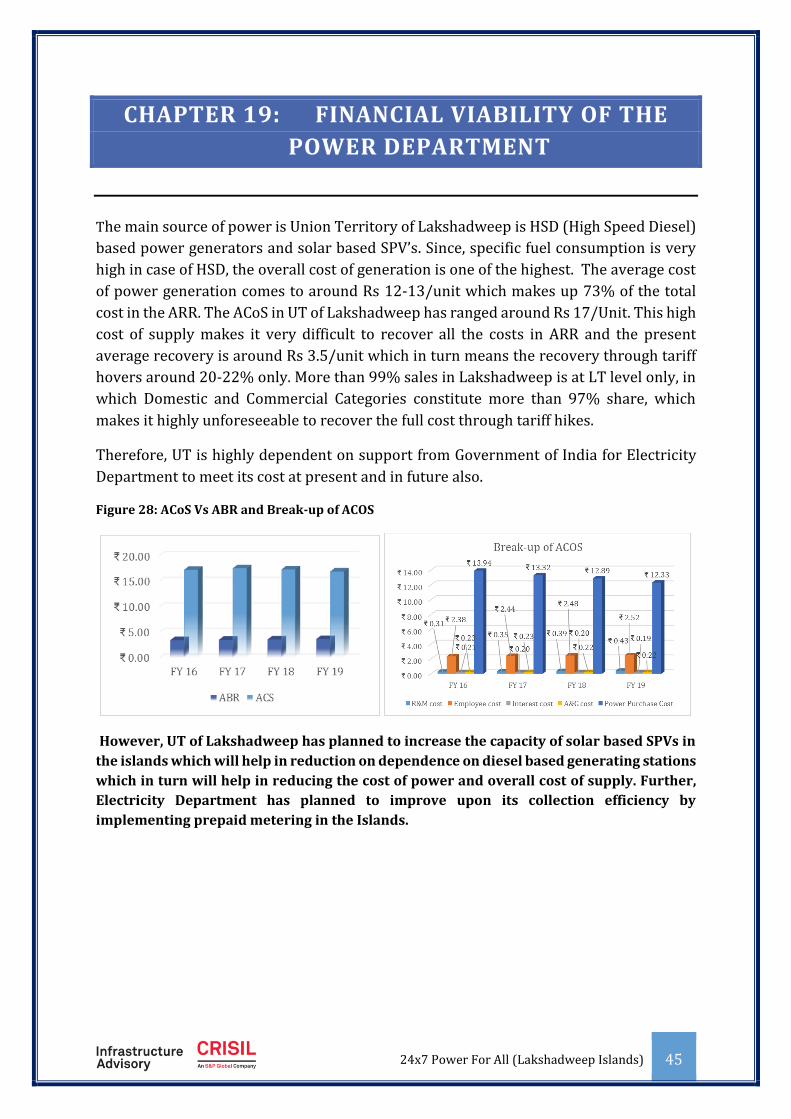
24x7 Power For All (Lakshadweep Islands) 45
CHAPTER 19: FINANCIAL VIABILITY OF THE
POWER DEPARTMENT
The main source of power is Union Territory of Lakshadweep is HSD (High Speed Diesel)
based power generators and solar based SPV’s. Since, specific fuel consumption is very
high in case of HSD, the overall cost of generation is one of the highest. The average cost
of power generation comes to around Rs 12-13/unit which makes up 73% of the total
cost in the ARR. The ACoS in UT of Lakshadweep has ranged around Rs 17/Unit. This high
cost of supply makes it very difficult to recover all the costs in ARR and the present
average recovery is around Rs 3.5/unit which in turn means the recovery through tariff
hovers around 20-22% only. More than 99% sales in Lakshadweep is at LT level only, in
which Domestic and Commercial Categories constitute more than 97% share, which
makes it highly unforeseeable to recover the full cost through tariff hikes.
Therefore, UT is highly dependent on support from Government of India for Electricity
Department to meet its cost at present and in future also.
Figure 28: ACoS Vs ABR and Break-up of ACOS
However, UT of Lakshadweep has planned to increase the capacity of solar based SPVs in
the islands which will help in reduction on dependence on diesel based generating stations
which in turn will help in reducing the cost of power and overall cost of supply. Further,
Electricity Department has planned to improve upon its collection efficiency by
implementing prepaid metering in the Islands.
24x7 Power For All (Lakshadweep Islands) 46
CHAPTER 20: OTHER INITIATIVES
COMMUNICATION
Successful implementation of 24x7 Power
Supply Scheme requires clear
communication among all the stakeholders
across the value chain, including the
consumers. In order to avoid potential
roadblocks in implementation due to poor
communication and flow of information, the
following table lists the primary
responsibility of each stakeholder and the
corresponding method in which it will be
carried out.
A centralized corporate communication
team can be formed at headquarters of the
Electricity Department for looking at
activities of overall communication strategy.
The financial situation in Electricity
Department of Lakshadweep makes it
imperative to raise tariffs while other
initiatives including 24x7 supply are
implemented. Such tariff increases would
inevitably impact consumers and meet with
resistance. To address this, the utilities
should clearly communicate their plans on
implementing the reliable 24x7 supply
scheme along with the other reliability and
efficiency improvement measures that they
are implementing. A high level of
involvement of the Administration of
Lakshadweep will also be required:
Table 53: Proposed Communication
Responsibilities
Communication Objective
Responsibility Frequency
“Power for All” – Roll Out Plan
Secretary, Energy
Quarterly
Status update on Deliverables
Secretary, Energy
Quarterly
Generation Projects Physical Progress, Achievements and Other Relates Issues
Executive Engineer
Quarterly
Distribution Progress, Achievements, Losses, Consumer Initiatives etc.
Executive Engineer
Monthly
Renewable Power LEDA Quarterly
INFORMATION TECHNOLOGY
The need to adopt IT in every sphere of
utility operation is self-evident. Power is a
complex product that must be consumed on
a real time basis. The overall value involved
in the process is very high. Even more
importantly it touches all citizens. Yet, the
information systems that drive the
operations of the sector are generally very
basic and information transparency and
consistency is poor.
While sporadic efforts have been made in the
past to improve this, quantum changes are
required to increase IT adoption in all
spheres of power sector operation.
Implementation of Enterprise Resource
Planning Systems (ERP) which would
cover critical aspects like Finance and
Accounts, Asset Management, Inventory
Management, Human Resource
Management, Project Management,
Personal information System (PIS). ERP
will help in timely capitalization of asset,
deriving better business value of
investment etc.
24x7 Power For All (Lakshadweep Islands) 47
Centralized Information & Monitoring
System for operational, enforcement &
litigation, vigilance activities and analysis
have to be operationalized.
Power management would require tools
like SCADA and Distribution Management
Systems (DMS) that allow for adequate
visualization of the networks and
response capabilities. Technologies for
sub-station automation, GIS, SCADA,
DMS, OMS, etc., shall be adopted. For the
urban areas SCADA is very useful for
improving reliability and reduction of
network downtime.
Requirement of Island wise Distribution
Control Centers (RDCC) within the State
will be identified in view of upcoming
projected load. This will be a key
initiative, not only for effectively
managing 24x7 supply, but also
thereafter for other functions like
forecasting.
Project monitoring tools shall be
incorporated in the PMU to ensure that
progress on the investments in the state
are monitored rigorously and bottlenecks
identified.
Standards of service specified under
Section 57 of the Electricity Act 2003 will
be monitored. The utilities shall use IT
tools to gather the information with
regard to service standards with minimal
manual.
The above measures, need to be
implemented on priority basis by Electricity
Department and also to be integrated with
each other to ensure that the systems are
inter-operable (i.e., they can talk to each
other). For this the utilities shall evolve a
detailed IT plan to implement the above in a
well-coordinated manner.
The present computerization status of
Electricity Department is shown below:
The cash collection counters since 1995.
Store Inventory Management.
Payroll of Employees.
Various kind of bills of employees.
Setup Local Area Networks in all the
offices under the Department.
Provided internet connection to all the
office through SWAN
Introduced various online applications
including Electricity Consumer
Management System & Inventory
Management System
Online Tapal Monitoring System has been
introduced and functions at Electricity
Division office
Online software for Power Generation
monitoring has been put on trial run since
27th October, 2012
Introduced online payment and online
application for new connection.
In future, the department plans to cover the
following
Computerization of entire activity of the
Department
Remote monitoring & Control of Power
Generation & Distribution system
INSTITUTIONAL ARRANGEMENT
A strong monitoring framework is essential
to ensure the success of the “Power for All”
scheme. The following structure is being
proposed to undertake regular monitoring
of the progress of all initiatives being
undertaken in this scheme.
Government of India (GOI) Level
Committee: It is proposed that this
committee will review the overall
progress of the scheme on a quarterly

24x7 Power For All (Lakshadweep Islands) 48
basis and provide necessary support to
ensure a coordinated response from the
Central Government – where necessary.
The committee may be constituted with
the following members – PFC, REC, CEA,
SECI, EESL, BEE, Ministry of Power,
MoEF and MNRE.
Administration Level Committee: It is
proposed that a Administration level
committee headed by the Secretary
(Power) will be formed to review the
progress of the scheme on a quarterly
basis. This committee will monitor the
progress of the works undertaken as
part of the scheme and issue directions
to enable faster execution.
Department Level Committee: It is
proposed that a Department level
committee headed by the Nodal Officer
will be formed which shall undertake
steps required to ensure the projects
are progressing as per the action plan.
This committee will undertake progress
reviews on a monthly basis.
Island Level Committee – It is
proposed to constitute an Island level
committee headed by the A.E. to take
action that is necessary to ensure the
projects are completed in a timely
manner and address any issues
pertaining to land or other relevant
approvals.
Project Monitoring Unit (PMU) – A
project monitoring unit shall be set up
for monitoring the progress of the
works being undertaken under this
scheme. The PMU will operate under the
Secretary, Energy and shall be operated
by an external independent agency.
The PMU shall be responsible for
undertaking coordination, preparing
the action plans and monitoring
progress of all works under the “Power
for all” scheme. The PMU would also
help facilitate in tracking the action
steps and providing feedback to the
various committee that are proposed to
be set up under the scheme.
Government of India shall provide
grants for the PMU operations.
The committees that are being proposed
above are required to be set up at the earliest
to kick start the whole scheme. It is
important that the committees keep meeting
on a regular basis as per the frequency/
timelines mentioned above – to ensure that
the objectives set out under the “Power for
all” scheme are achieved.
CAPACITY BUILDING
With the increase of IT applications in the
Distribution system and to meet the
expectations of 24x7 power supply for the
consumers in the state, it is important to
focus on capacity building of the employees
for enhancement of technical know-how and
keeping abreast with latest technological
developments. The capacity building may
also include consumer grievance system,
awareness regarding importance of working
with safety, outage management system,
demand side management etc. It is also
imperative that for transforming the
distribution utility into a customer friendly
one, change of mind-set of the employees
would be required. It is critical that Change
Management initiatives are rolled out and
institutionalized for achieving better results.
In view of the importance of training on new
technologies, there is a requirement for
development and implementation of a well-
structured Human Resource Training
Programme to help realize the dream of
24x7 power supply system in the state in its
true sense.
This also helps in training of subordinate
technical staff. Following training
programmes are proposed to be
implemented for the utility:

24x7 Power For All (Lakshadweep Islands) 49
Two Weeks trainings for technical staff
including officers & engineers once in
every two years.
One week training for non-technical
officers every two years.
One week training for subordinate
technical staff at each district
headquarters every year.
ORGANIZATIONAL STRUCTURE
The present sanctioned strength viz-a-viz
the vacancies is summarized below: S. No. Post Present Vacancy
1 Executive Engineer 1
2 Assistant Executive Engineer
1
3 Assistant Engineer 8
S. No. Post Present Vacancy
4 Junior Engineer 33 5
5 Tracer 5
6 Chargeman / Electrician/Mechanic
36 5
7 Operator/Meter Reader
24
8 Helper for Lineman / Engine Driver/Oil man/Line man
174 19
Total 282 29
However, there is need to revisit the
organizational requirement considering the
increased load growth as well as new
technologies already/being adopted by the
power department.
The present organizational structure of the
Electricity Department is shown below:

24x7 Power For All (Lakshadweep Islands) 50
CHAPTER 21: YEAR WISE ROLL OUT PLAN
SWOT ANALYSIS
In the above sections we have discussed in detail the existing status and its future needs. We have
also provided some actionable targets which will help Lakshadweep in achieving the set goal.
Before structuring the above targets, SWOT analysis of existing power sector in Lakshadweep has
been discussed. The exercise has been done to bring out some of the key risk indicators which
affect the overall market in Lakshadweep along with advantages present.
From the above analysis it is quite evident that most of the threats and weaknesses are external
factors which would need continuous efforts from both Administration of Lakshadweep as well
as Government of India to mitigate them as soon as possible.
Based on the above observations, a road map for Lakshadweep has been developed to mitigate
the above weaknesses and threats.
Strengths
• Small Island Size• 100% Connectivity of all consumers• 100% Underground Cable network
Weaknesses
• Remote Location• No interconnectivity within the Islands• No Interconnectivity with the mainland• High Cost of New Infrastructure• No Industrial Share• High Manpower Requirement
Opportunities
• Efficiency in Billing System• Efficiency in revenue collection system• Vast Solar Potential• Modernization of the utilities and infrastructure
Threats
• Fund availability from central government • Lower tariff hike• Non availabilitity of Broadband Connectivity
Lakshadweep Power Sector

24x7 Power For All (Lakshadweep Islands) 51
BEST PRACTICES
Some of the best practices followed by the power department of UT of Lakshadweep is
summarized below:
Round the clock power supply in all the inhabited Islands
Electrified 100% households
Connection available on demand
Self-meter reading by consumers from 1988 onwards.
Charges are paid directly at the computerized Billing counters in the Islands
Consumers have the option to temporarily generate bills online before making payment
at the Billing counters.
100% underground cabling
100% computerized billing
Inter linked all sub-divisions and sections through virtual connectivity
Bitra Island to become first LED village of Lakshadweep
Electronic Energy meters being installed now are having optical port to download data
directly to CMRI and then into computer for further processing.
Periodic surprise checking of energy meters are being carried out by the Department.

24x7 Power For All (Lakshadweep Islands) 52
ROAD MAP FOR POWER FOR ALL
Table 54: Roll Out Plan
Sl. No.
Category Base year scenario (FY 16)
Total expected capacity FY 19 FY 17 FY 18 FY 19 Total
GENERATION
A Availability (MW):
Own Generation
1 DG Sets 22.02 2.65 3.15 0.00 5.80 27.82
2 Solar 2.15 2.50 2.00 1.80 6.30 8.45
Total Availability (MW) 24.17 5.15 5.15 1.80 12.10 36.27
B Peak Demand (MW):
1 Peak Demand (MW) (8.24 MW in FY 15)
8.79 9.39 10.07 10.85 10.85
2 Per Capita Consumption 762 810 864 926 926
TRANSMISSION AND DISTRIBUTION
C Efficiency Improvement
1 T&D Losses (7.79% in FY 15)
7.23% 6.72% 6.23% 5.78%
5.78%
2 AT&C Losses (21.05% in FY 15)
17.48% 13.90% 10.32% 6.72% 6.72%
3 DELP (Number of consumers Covered)
11013 11013
D Capacity Addition/Augmentation
1 Step-Up Transformers (in MVA)
23.6 1 5 0 6 29.6
2 Step-Down Transformers (in MVA)
15.897 0.75 3.5 1 5.25 21.147
3 HT Lines (CKT Km.) 104.564 8.75 7.75 0 16.5 121.064
4 LT Lines (CKT Km.) 268.213 15 20 1.5 36.5 304.713
5 Street lights 5334 737 65 42 844 6178
6 Street lights (Solar) 1994 479 40 0 519 2513
The island-wise actionable roll-out plan has been detailed in Annexure – 3.

24x7 Power For All (Lakshadweep Islands) 53
CHAPTER 22: FUND REQUIREMENT
The fund requirement for various schemes (ongoing and proposed) for Generation, Transmission,
Distribution and Renewable energy plan as discussed in previous chapters is tabulated below:
Table 55: Fund Requirement
S. No. Particulars FY 17 FY 18 FY 19
1 Augmentation of DG set (Old) 4.55 4.55 4.55
2 Augmentation of DG Generating Capacity (New) 3.10 4.35
3 Augmentation of Solar Generating Capacity (New) 1.50 1.20 1.08
4 Setting up of Installation of transformers 0.70 0.70 0.70
5 Construction of HT Lines / RMU 1.10 1.10 1.10
6 Service connections /LT Line 0.30 0.30 0.30
7 Street Lights 0.30 0.30 0.30
8 Distribution Box 0.30 0.30 0.30
9 Energy Meter 0.75 0.75 0.75
10 Underground cable for consumers 0.20 0.20 0.20
11 Energy Conservation 0.05 0.05 0.05
12 e-Governance 0.15 0.15 0.15
13 Special Tools and Plants 0.20 0.20 0.20
14 Administrative set up 0.30 0.30 0.30
15 Oil Storage facilities 2.95 2.95 2.95
16 Civil works 2.75 2.75 2.75
17 Skill up gradation 0.40 0.40 0.40
Total 19.60 20.55 16.08
The entire capital expenditure incurred by Electricity Department of Lakshadweep will be funded
by GOI through budgetary support without any external borrowings for the capital expenditure.
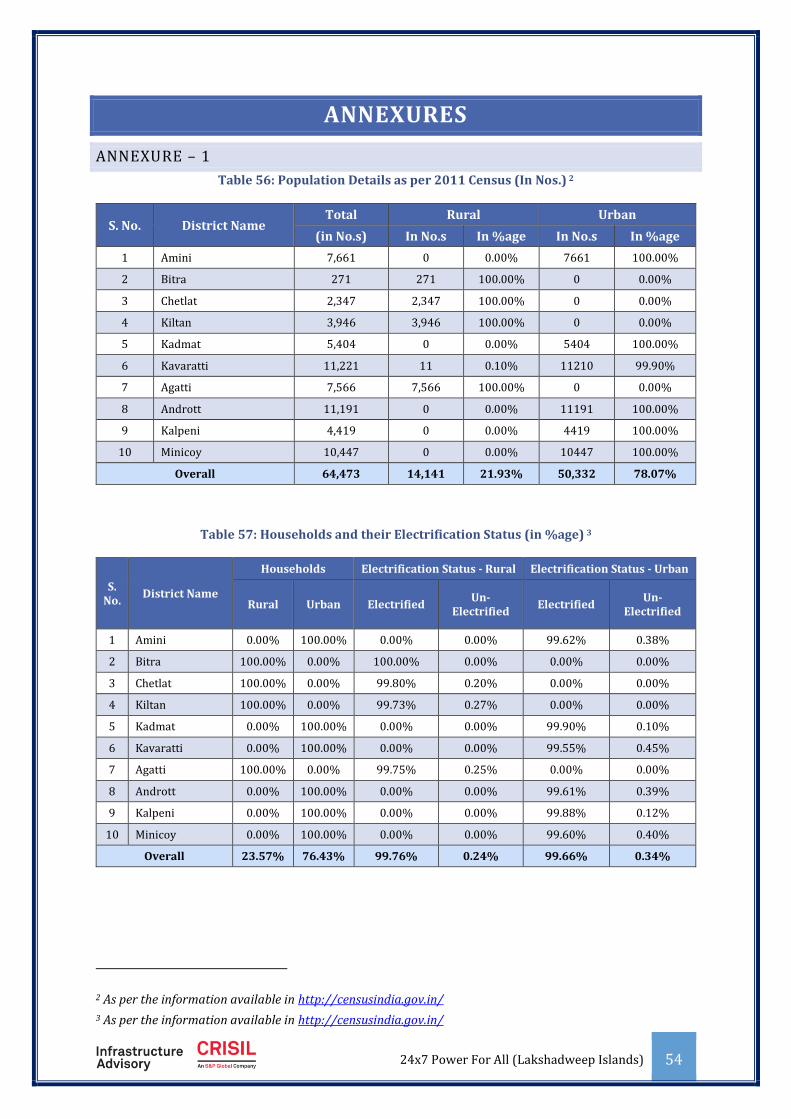
24x7 Power For All (Lakshadweep Islands) 54
ANNEXURES
ANNEXURE – 1
Table 56: Population Details as per 2011 Census (In Nos.) 2
S. No. District Name Total Rural Urban
(in No.s) In No.s In %age In No.s In %age
1 Amini 7,661 0 0.00% 7661 100.00%
2 Bitra 271 271 100.00% 0 0.00%
3 Chetlat 2,347 2,347 100.00% 0 0.00%
4 Kiltan 3,946 3,946 100.00% 0 0.00%
5 Kadmat 5,404 0 0.00% 5404 100.00%
6 Kavaratti 11,221 11 0.10% 11210 99.90%
7 Agatti 7,566 7,566 100.00% 0 0.00%
8 Andrott 11,191 0 0.00% 11191 100.00%
9 Kalpeni 4,419 0 0.00% 4419 100.00%
10 Minicoy 10,447 0 0.00% 10447 100.00%
Overall 64,473 14,141 21.93% 50,332 78.07%
Table 57: Households and their Electrification Status (in %age) 3
S. No.
District Name
Households Electrification Status - Rural Electrification Status - Urban
Rural Urban Electrified Un-
Electrified Electrified
Un-Electrified
1 Amini 0.00% 100.00% 0.00% 0.00% 99.62% 0.38%
2 Bitra 100.00% 0.00% 100.00% 0.00% 0.00% 0.00%
3 Chetlat 100.00% 0.00% 99.80% 0.20% 0.00% 0.00%
4 Kiltan 100.00% 0.00% 99.73% 0.27% 0.00% 0.00%
5 Kadmat 0.00% 100.00% 0.00% 0.00% 99.90% 0.10%
6 Kavaratti 0.00% 100.00% 0.00% 0.00% 99.55% 0.45%
7 Agatti 100.00% 0.00% 99.75% 0.25% 0.00% 0.00%
8 Andrott 0.00% 100.00% 0.00% 0.00% 99.61% 0.39%
9 Kalpeni 0.00% 100.00% 0.00% 0.00% 99.88% 0.12%
10 Minicoy 0.00% 100.00% 0.00% 0.00% 99.60% 0.40%
Overall 23.57% 76.43% 99.76% 0.24% 99.66% 0.34%
2 As per the information available in http://censusindia.gov.in/
3 As per the information available in http://censusindia.gov.in/

24x7 Power For All (Lakshadweep Islands) 55
ANNEXURE – 2
Table 58: Year-wise Projection of Power Generation/Availability (in MU) – Agatti Island
Particulars FY 16 FY 17 FY 18 FY 19
Power Purchase Quantum and Cost
Total Energy Requirement within Island (MU) 5.99 6.54 7.16 7.88
Energy Generated from Solar (MU) 0.10 0.10 0.10 1.10
Required Generation from DG Sets corresponding to Max Requirement (MU)
5.89 6.44 7.06 6.78
Cost of Energy Generation from Solar (Included in O&M Contract) (Rs Crores)
0.00 0.00 0.00 0.00
Specific Oil Consumption per kWH (ml) for Island 265.74 265.74 265.74 265.74
Estimated HSD Consumption (in Kl) 1565.65 1711.03 1876.72 1800.40
Cost of HSD Oil (Rs. Crores) @ Rs 46.21/L 7.23 7.91 8.67 8.32
Weighted Average lube oil consumption per kWh (ml) 0.87 0.87 0.87 0.87
Lube Oil Consumption (Litres) 5125.74 5601.71 6144.16 5894.30
Cost of Lube Oil (Rs Crores) @ Rs 215.62/L 0.11 0.12 0.13 0.13
Total Cost of Fuel (In Rs Crores) 7.35 8.03 8.80 8.45
Table 59: Year-wise Projection of Power Generation /Availability (in MU) – Amini Island
Particulars FY 16 FY 17 FY 18 FY 19
Power Purchase Quantum and Cost
Total Energy Requirement within Island (MU) 5.15 5.54 5.97 6.44
Energy Generated from Solar (MU) 0.10 0.10 1.10 1.10
Required Generation from DG Sets corresponding to Max Requirement (MU)
5.05 5.44 4.87 5.34
Cost of Energy Generation from Solar (Included in O&M Contract) (Rs Crores)
0.00 0.00 0.00 0.00
Specific Oil Consumption per kWH (ml) for Island 259.99 259.99 259.99 259.99
Estimated HSD Consumption (in Kl) 1311.98 1415.28 1267.44 1389.31
Cost of HSD Oil (Rs. Crores) @ Rs 46.21/L 6.06 6.54 5.86 6.42
Weighted Average lube oil consumption per kWh (ml) 0.87 0.87 0.87 0.87
Lube Oil Consumption (Litres) 4390.25 4735.93 4241.22 4649.01
Cost of Lube Oil (Rs Crores) @ Rs 215.62/L 0.09 0.10 0.09 0.10
Total Cost of Fuel (In Rs Crores) 6.16 6.64 5.95 6.52

24x7 Power For All (Lakshadweep Islands) 56
Table 60: Year-wise Projection of Power Generation /Availability (in MU) – Androth Island
Particulars FY 16 FY 17 FY 18 FY 19
Power Purchase Quantum and Cost
Total Energy Requirement within Island (MU) 7.23 7.66 8.12 8.61
Energy Generated from Solar (MU) 0.32 0.32 0.32 0.32
Required Generation from DG Sets corresponding to Max Requirement (MU)
6.91 7.34 7.80 8.29
Cost of Energy Generation from Solar (Included in O&M Contract) (Rs Crores)
0.00 0.00 0.00 0.00
Specific Oil Consumption per kWH (ml) for Island 274.46 274.46 274.46 274.46
Estimated HSD Consumption (in Kl) 1897.33 2013.72 2139.70 2276.57
Cost of HSD Oil (Rs. Crores) @ Rs 46.21/L 8.77 9.31 9.89 10.52
Weighted Average lube oil consumption per kWh (ml) 0.87 0.87 0.87 0.87
Lube Oil Consumption (Litres) 6014.28 6383.20 6782.57 7216.41
Cost of Lube Oil (Rs Crores) @ Rs 215.62/L 0.13 0.14 0.15 0.16
Total Cost of Fuel (In Rs Crores) 8.90 9.44 10.03 10.68
Table 61: Year-wise Projection of Power Generation /Availability (in MU) – Bitra Island
Particulars FY 16 FY 17 FY 18 FY 19
Power Purchase Quantum and Cost
Total Energy Requirement within Island (MU) 0.23 0.24 0.25 0.26
Energy Generated from Solar (MU) 0.10 0.10 0.10 0.10
Required Generation from DG Sets corresponding to Max Requirement (MU)
0.13 0.14 0.15 0.16
Cost of Energy Generation from Solar (Included in O&M Contract) (Rs Crores)
0.00 0.00 0.00 0.00
Specific Oil Consumption per kWH (ml) for Island 390.74 390.74 390.74 390.74
Estimated HSD Consumption (in Kl) 51.09 54.80 58.76 62.97
Cost of HSD Oil (Rs. Crores) @ Rs 46.21/L 0.24 0.25 0.27 0.29
Weighted Average lube oil consumption per kWh (ml) 0.87 0.87 0.87 0.87
Lube Oil Consumption (Litres) 113.76 122.02 130.82 140.20
Cost of Lube Oil (Rs Crores) @ Rs 215.62/L 0.00 0.00 0.00 0.00
Total Cost of Fuel (In Rs Crores) 0.24 0.26 0.27 0.29
Table 62: Year-wise Projection of Power Generation /Availability (in MU) – Chetlat Island
Particulars FY 16 FY 17 FY 18 FY 19
Power Purchase Quantum and Cost
Total Energy Requirement within Island (MU) 1.54 1.61 1.68 1.76
Energy Generated from Solar (MU) 0.10 0.10 0.10 0.10
Required Generation from DG Sets corresponding to Max Requirement (MU)
1.44 1.51 1.58 1.66
Cost of Energy Generation from Solar (Included in O&M Contract) (Rs Crores)
0.00 0.00 0.00 0.00
Specific Oil Consumption per kWH (ml) for Island 305.25 305.25 305.25 305.25
Estimated HSD Consumption (in Kl) 438.41 459.91 482.83 507.31
Cost of HSD Oil (Rs. Crores) @ Rs 46.21/L 2.03 2.13 2.23 2.34
Weighted Average lube oil consumption per kWh (ml) 0.87 0.87 0.87 0.87
Lube Oil Consumption (Litres) 1249.52 1310.81 1376.14 1445.91
Cost of Lube Oil (Rs Crores) @ Rs 215.62/L 0.03 0.03 0.03 0.03
Total Cost of Fuel (In Rs Crores) 2.05 2.15 2.26 2.38
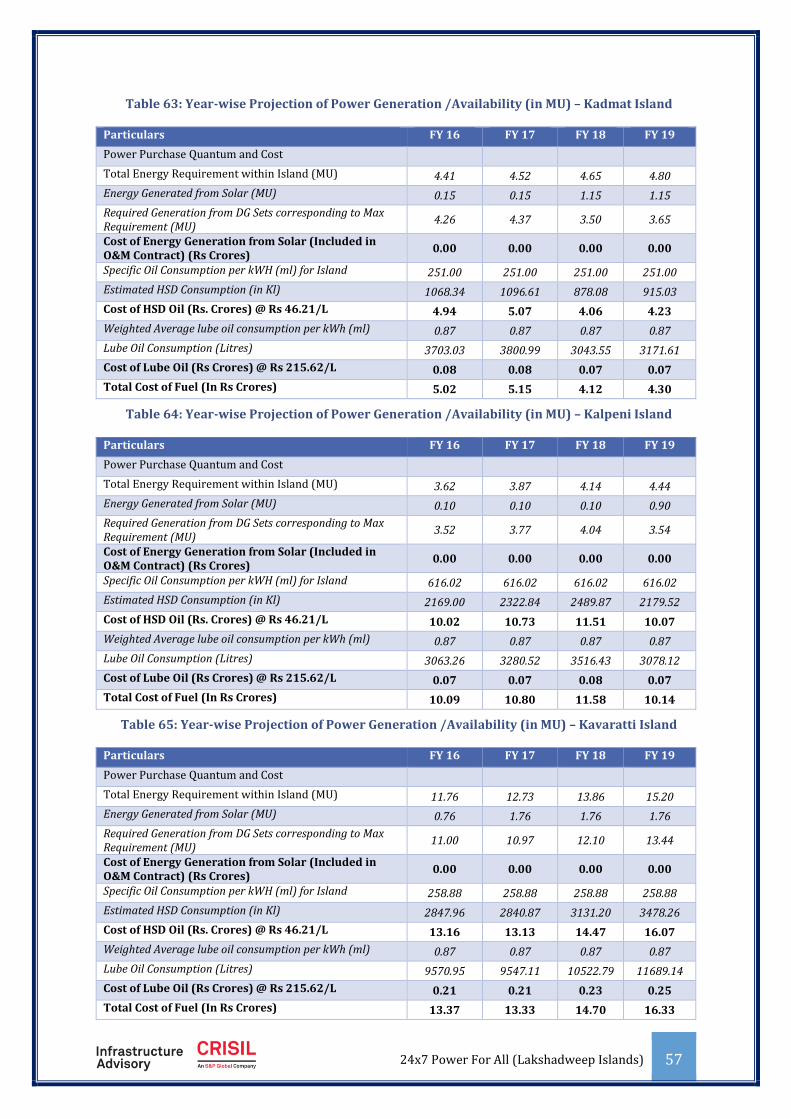
24x7 Power For All (Lakshadweep Islands) 57
Table 63: Year-wise Projection of Power Generation /Availability (in MU) – Kadmat Island
Particulars FY 16 FY 17 FY 18 FY 19
Power Purchase Quantum and Cost
Total Energy Requirement within Island (MU) 4.41 4.52 4.65 4.80
Energy Generated from Solar (MU) 0.15 0.15 1.15 1.15
Required Generation from DG Sets corresponding to Max Requirement (MU)
4.26 4.37 3.50 3.65
Cost of Energy Generation from Solar (Included in O&M Contract) (Rs Crores)
0.00 0.00 0.00 0.00
Specific Oil Consumption per kWH (ml) for Island 251.00 251.00 251.00 251.00
Estimated HSD Consumption (in Kl) 1068.34 1096.61 878.08 915.03
Cost of HSD Oil (Rs. Crores) @ Rs 46.21/L 4.94 5.07 4.06 4.23
Weighted Average lube oil consumption per kWh (ml) 0.87 0.87 0.87 0.87
Lube Oil Consumption (Litres) 3703.03 3800.99 3043.55 3171.61
Cost of Lube Oil (Rs Crores) @ Rs 215.62/L 0.08 0.08 0.07 0.07
Total Cost of Fuel (In Rs Crores) 5.02 5.15 4.12 4.30
Table 64: Year-wise Projection of Power Generation /Availability (in MU) – Kalpeni Island
Particulars FY 16 FY 17 FY 18 FY 19
Power Purchase Quantum and Cost
Total Energy Requirement within Island (MU) 3.62 3.87 4.14 4.44
Energy Generated from Solar (MU) 0.10 0.10 0.10 0.90
Required Generation from DG Sets corresponding to Max Requirement (MU)
3.52 3.77 4.04 3.54
Cost of Energy Generation from Solar (Included in O&M Contract) (Rs Crores)
0.00 0.00 0.00 0.00
Specific Oil Consumption per kWH (ml) for Island 616.02 616.02 616.02 616.02
Estimated HSD Consumption (in Kl) 2169.00 2322.84 2489.87 2179.52
Cost of HSD Oil (Rs. Crores) @ Rs 46.21/L 10.02 10.73 11.51 10.07
Weighted Average lube oil consumption per kWh (ml) 0.87 0.87 0.87 0.87
Lube Oil Consumption (Litres) 3063.26 3280.52 3516.43 3078.12
Cost of Lube Oil (Rs Crores) @ Rs 215.62/L 0.07 0.07 0.08 0.07
Total Cost of Fuel (In Rs Crores) 10.09 10.80 11.58 10.14
Table 65: Year-wise Projection of Power Generation /Availability (in MU) – Kavaratti Island
Particulars FY 16 FY 17 FY 18 FY 19
Power Purchase Quantum and Cost
Total Energy Requirement within Island (MU) 11.76 12.73 13.86 15.20
Energy Generated from Solar (MU) 0.76 1.76 1.76 1.76
Required Generation from DG Sets corresponding to Max Requirement (MU)
11.00 10.97 12.10 13.44
Cost of Energy Generation from Solar (Included in O&M Contract) (Rs Crores)
0.00 0.00 0.00 0.00
Specific Oil Consumption per kWH (ml) for Island 258.88 258.88 258.88 258.88
Estimated HSD Consumption (in Kl) 2847.96 2840.87 3131.20 3478.26
Cost of HSD Oil (Rs. Crores) @ Rs 46.21/L 13.16 13.13 14.47 16.07
Weighted Average lube oil consumption per kWh (ml) 0.87 0.87 0.87 0.87
Lube Oil Consumption (Litres) 9570.95 9547.11 10522.79 11689.14
Cost of Lube Oil (Rs Crores) @ Rs 215.62/L 0.21 0.21 0.23 0.25
Total Cost of Fuel (In Rs Crores) 13.37 13.33 14.70 16.33

24x7 Power For All (Lakshadweep Islands) 58
Table 66: Year-wise Projection of Power Generation /Availability (in MU) – Kiltan Island
Particulars FY 16 FY 17 FY 18 FY 19
Power Purchase Quantum and Cost
Total Energy Requirement within Island (MU) 2.74 2.94 3.19 3.52
Energy Generated from Solar (MU) 0.10 0.10 0.10 0.10
Required Generation from DG Sets corresponding to Max Requirement (MU)
2.64 2.84 3.09 3.42
Cost of Energy Generation from Solar (Included in O&M Contract) (Rs Crores)
0.00 0.00 0.00 0.00
Specific Oil Consumption per kWH (ml) for Island 280.51 280.51 280.51 280.51
Estimated HSD Consumption (in Kl) 740.36 795.45 865.96 959.72
Cost of HSD Oil (Rs. Crores) @ Rs 46.21/L 3.42 3.68 4.00 4.43
Weighted Average lube oil consumption per kWh (ml) 0.87 0.87 0.87 0.87
Lube Oil Consumption (Litres) 2296.22 2467.07 2685.78 2976.56
Cost of Lube Oil (Rs Crores) @ Rs 215.62/L 0.05 0.05 0.06 0.06
Total Cost of Fuel (In Rs Crores) 3.47 3.73 4.06 4.50
Table 67: Year-wise Projection of Power Generation /Availability (in MU) – Minicoy Island
Particulars FY 16 FY 17 FY 18 FY 19
Power Purchase Quantum and Cost
Total Energy Requirement within Island (MU) 7.99 8.53 9.14 9.82
Energy Generated from Solar (MU) 0.32 1.82 1.82 1.82
Required Generation from DG Sets corresponding to Max Requirement (MU)
7.67 6.71 7.32 8.00
Cost of Energy Generation from Solar (Included in O&M Contract) (Rs Crores)
0.00 0.00 0.00 0.00
Specific Oil Consumption per kWH (ml) for Island 246.81 246.81 246.81 246.81
Estimated HSD Consumption (in Kl) 1892.08 1657.22 1807.31 1974.25
Cost of HSD Oil (Rs. Crores) @ Rs 46.21/L 8.74 7.66 8.35 9.12
Weighted Average lube oil consumption per kWh (ml) 0.87 0.87 0.87 0.87
Lube Oil Consumption (Litres) 6669.53 5841.67 6370.74 6959.20
Cost of Lube Oil (Rs Crores) @ Rs 215.62/L 0.14 0.13 0.14 0.15
Total Cost of Fuel (In Rs Crores) 8.89 7.78 8.49 9.27
Table 68: Year-wise Projection of Category-wise Revenue (In Rs Crores) – Base Case (Agatti)
Categories ABR Projections
FY 16 FY 16 FY 17 FY 18 FY 19
Domestic 2.30 0.81 0.99 1.20 1.45
Commercial 6.43 1.26 1.73 2.37 3.26
Industrial 8.30 0.04 0.05 0.06 0.07
Public 4.40 0.04 0.05 0.06 0.07
Temporary 7.70 0.01 0.01 0.01 0.01
Grand Total 2.16 2.82 3.70 4.86

24x7 Power For All (Lakshadweep Islands) 59
Table 69: Year-wise Projection of Category-wise Revenue (In Rs Crores) – Base Case (Amini)
Categories ABR Projections
FY 16 FY 16 FY 17 FY 18 FY 19
Domestic 2.30 0.95 1.17 1.45 1.79
Commercial 6.43 0.47 0.62 0.81 1.07
Industrial 8.30 0.05 0.06 0.08 0.10
Public 4.40 0.05 0.06 0.08 0.10
Temporary 7.70 0.00 0.00 0.01 0.01
Grand Total 1.51 1.91 2.42 3.07
Table 70: Year-wise Projection of Category-wise Revenue (In Rs Crores) – Base Case (Androth)
Categories ABR Projections
FY 16 FY 16 FY 17 FY 18 FY 19
Domestic 2.30 1.29 1.56 1.90 2.30
Commercial 6.43 0.68 0.86 1.10 1.41
Industrial 8.30 0.14 0.20 0.30 0.43
Public 4.40 0.03 0.03 0.04 0.04
Temporary 7.70 0.01 0.01 0.02 0.02
Grand Total 2.14 2.67 3.35 4.20
Table 71: Year-wise Projection of Category-wise Revenue (In Rs Crores) – Base Case (Bitra)
Categories ABR Projections
FY 16 FY 16 FY 17 FY 18 FY 19
Domestic 2.30 0.03 0.04 0.05 0.06
Commercial 6.43 0.05 0.06 0.07 0.08
Industrial 8.30 0.00 0.00 0.00 0.00
Public 4.40 0.00 0.00 0.00 0.00
Temporary 7.70 0.00 0.00 0.00 0.00
Grand Total 0.09 0.10 0.12 0.15
Table 72: Year-wise Projection of Category-wise Revenue (In Rs Crores) – Base Case (Chetlat)
Categories ABR Projections
FY 16 FY 16 FY 17 FY 18 FY 19
Domestic 2.30 0.25 0.30 0.36 0.43
Commercial 6.43 0.19 0.24 0.31 0.39
Industrial 8.30 0.01 0.01 0.01 0.01
Public 4.40 0.01 0.01 0.01 0.02
Temporary 7.70 0.00 0.00 0.01 0.01
Grand Total 0.46 0.56 0.69 0.86

24x7 Power For All (Lakshadweep Islands) 60
Table 73: Year-wise Projection of Category-wise Revenue (In Rs Crores) – Base Case (Kadmat)
Categories ABR Projections
FY 16 FY 16 FY 17 FY 18 FY 19
Domestic 2.30 0.61 0.76 0.94 1.16
Commercial 6.43 0.37 0.47 0.60 0.77
Industrial 8.30 0.03 0.03 0.04 0.05
Public 4.40 0.10 0.13 0.17 0.23
Temporary 7.70 0.01 0.01 0.02 0.03
Grand Total 1.11 1.40 1.77 2.23
Table 74: Year-wise Projection of Category-wise Revenue (In Rs Crores) – Base Case (Kalpeni)
Categories ABR Projections
FY 16 FY 16 FY 17 FY 18 FY 19
Domestic 2.30 0.65 0.80 0.99 1.22
Commercial 6.43 0.31 0.38 0.48 0.60
Industrial 8.30 0.04 0.05 0.07 0.10
Public 4.40 0.03 0.03 0.04 0.04
Temporary 7.70 0.01 0.02 0.03 0.06
Grand Total 1.03 1.28 1.61 2.02
Table 75: Year-wise Projection of Category-wise Revenue (In Rs Crores) – Base Case (Kavaratti)
Categories ABR Projections
FY 16 FY 16 FY 17 FY 18 FY 19
Domestic 2.30 1.50 1.86 2.29 2.84
Commercial 6.43 2.47 3.16 4.05 5.18
Industrial 8.30 0.07 0.09 0.11 0.13
Public 4.40 0.05 0.05 0.06 0.07
Temporary 7.70 0.08 0.17 0.36 0.77
Grand Total 4.17 5.33 6.87 8.98
Table 76: Year-wise Projection of Category-wise Revenue (In Rs Crores) – Base Case (Kiltan)
Categories ABR Projections
FY 16 FY 16 FY 17 FY 18 FY 19
Domestic 2.30 0.43 0.52 0.63 0.77
Commercial 6.43 0.26 0.33 0.42 0.53
Industrial 8.30 0.01 0.01 0.02 0.02
Public 4.40 0.06 0.11 0.21 0.38
Temporary 7.70 0.00 0.00 0.00 0.00
Grand Total 0.76 0.98 1.28 1.70
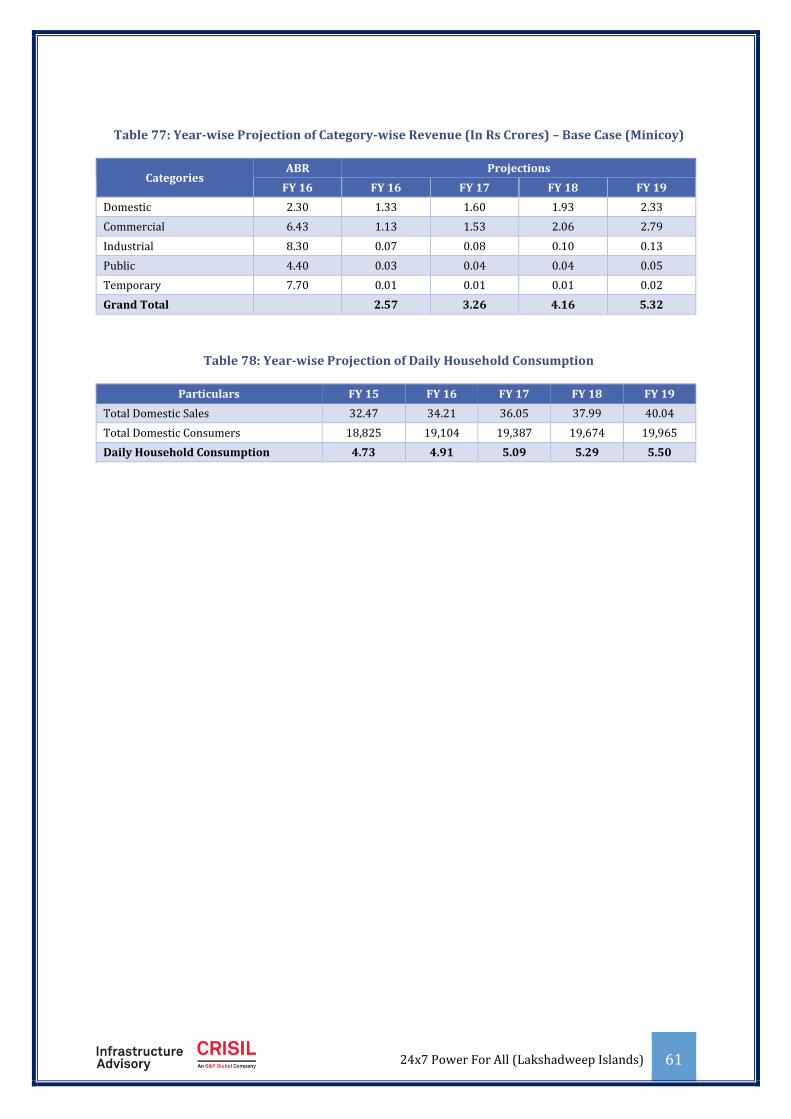
24x7 Power For All (Lakshadweep Islands) 61
Table 77: Year-wise Projection of Category-wise Revenue (In Rs Crores) – Base Case (Minicoy)
Categories ABR Projections
FY 16 FY 16 FY 17 FY 18 FY 19
Domestic 2.30 1.33 1.60 1.93 2.33
Commercial 6.43 1.13 1.53 2.06 2.79
Industrial 8.30 0.07 0.08 0.10 0.13
Public 4.40 0.03 0.04 0.04 0.05
Temporary 7.70 0.01 0.01 0.01 0.02
Grand Total 2.57 3.26 4.16 5.32
Table 78: Year-wise Projection of Daily Household Consumption
Particulars FY 15 FY 16 FY 17 FY 18 FY 19
Total Domestic Sales 32.47 34.21 36.05 37.99 40.04
Total Domestic Consumers 18,825 19,104 19,387 19,674 19,965
Daily Household Consumption 4.73 4.91 5.09 5.29 5.50

24x7 Power For All (Lakshadweep Islands) 62
ANNEXURE – 3
The Roll-Out Plan for Island –wise capacity addition in Generation is summarized below:
Table 79: Year-wise Projection of Maximum Demand (in MW)
Maximum Demand FY 16 FY 17 FY 18 FY 19
Agatti 1.07 1.16 1.27 1.40
Amini 0.86 0.93 1.00 1.08
Androth 1.24 1.32 1.40 1.48
Bitra 0.05 0.05 0.06 0.06
Chetlat 0.38 0.40 0.42 0.44
Kadmat 0.82 0.84 0.86 0.89
Kalpeni 0.73 0.78 0.83 0.89
Kavaratti 1.90 2.06 2.24 2.45
Kiltan 0.40 0.43 0.47 0.52
Minicoy 1.33 1.42 1.53 1.64
Total 8.79 9.39 10.07 10.85
Table 80: Island-wise Capacity Addition (DG Sets)
Sl. No. Island Base year scenario (FY 16)
Capacity Addition (in MW) Total expected capacity FY 19 FY 17 FY 18 FY 19 Total
1 Agatti 2.45 0.00 0.75 0.00 0.75 3.20
2 Amini 2.65 0.00 0.75 0.00 0.75 3.40
3 Androth 2.25 1.00 0.00 0.00 1.00 3.25
4 Bitra 0.52 0.00 0.00 0.00 0.00 0.52
5 Chetlat 1.00 0.00 0.00 0.00 0.00 1.00
6 Kadmat 2.30 0.00 0.75 0.00 0.75 3.05
7 Kalpeni 1.75 0.00 0.50 0.00 0.50 2.25
8 Kavaratti 3.20 1.00 0.00 0.00 1.00 4.20
9 Kiltan 1.50 0.65 0.00 0.00 0.65 2.15
10 Minicoy 4.40 0.00 0.40 0.00 0.40 4.80
Total 22.02 2.65 3.15 0.00 5.80 27.82
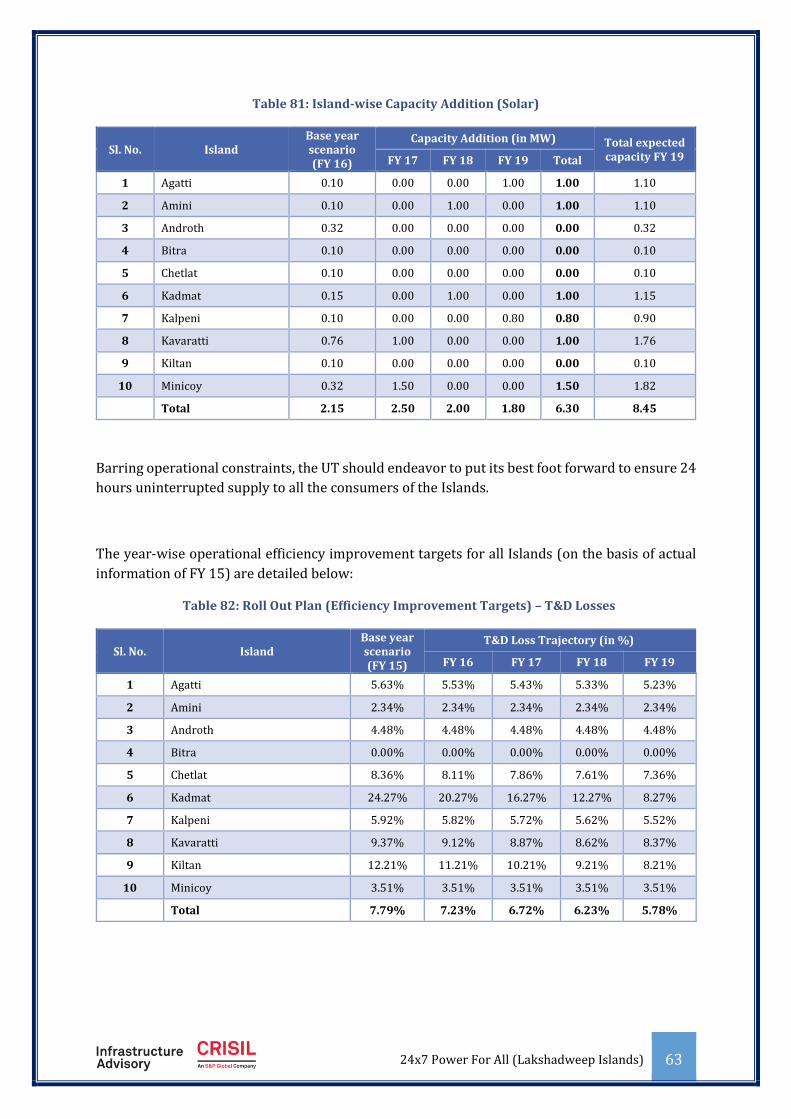
24x7 Power For All (Lakshadweep Islands) 63
Table 81: Island-wise Capacity Addition (Solar)
Sl. No. Island Base year scenario (FY 16)
Capacity Addition (in MW) Total expected capacity FY 19 FY 17 FY 18 FY 19 Total
1 Agatti 0.10 0.00 0.00 1.00 1.00 1.10
2 Amini 0.10 0.00 1.00 0.00 1.00 1.10
3 Androth 0.32 0.00 0.00 0.00 0.00 0.32
4 Bitra 0.10 0.00 0.00 0.00 0.00 0.10
5 Chetlat 0.10 0.00 0.00 0.00 0.00 0.10
6 Kadmat 0.15 0.00 1.00 0.00 1.00 1.15
7 Kalpeni 0.10 0.00 0.00 0.80 0.80 0.90
8 Kavaratti 0.76 1.00 0.00 0.00 1.00 1.76
9 Kiltan 0.10 0.00 0.00 0.00 0.00 0.10
10 Minicoy 0.32 1.50 0.00 0.00 1.50 1.82
Total 2.15 2.50 2.00 1.80 6.30 8.45
Barring operational constraints, the UT should endeavor to put its best foot forward to ensure 24
hours uninterrupted supply to all the consumers of the Islands.
The year-wise operational efficiency improvement targets for all Islands (on the basis of actual
information of FY 15) are detailed below:
Table 82: Roll Out Plan (Efficiency Improvement Targets) – T&D Losses
Sl. No. Island Base year scenario (FY 15)
T&D Loss Trajectory (in %)
FY 16 FY 17 FY 18 FY 19
1 Agatti 5.63% 5.53% 5.43% 5.33% 5.23%
2 Amini 2.34% 2.34% 2.34% 2.34% 2.34%
3 Androth 4.48% 4.48% 4.48% 4.48% 4.48%
4 Bitra 0.00% 0.00% 0.00% 0.00% 0.00%
5 Chetlat 8.36% 8.11% 7.86% 7.61% 7.36%
6 Kadmat 24.27% 20.27% 16.27% 12.27% 8.27%
7 Kalpeni 5.92% 5.82% 5.72% 5.62% 5.52%
8 Kavaratti 9.37% 9.12% 8.87% 8.62% 8.37%
9 Kiltan 12.21% 11.21% 10.21% 9.21% 8.21%
10 Minicoy 3.51% 3.51% 3.51% 3.51% 3.51%
Total 7.79% 7.23% 6.72% 6.23% 5.78%

24x7 Power For All (Lakshadweep Islands) 64
Table 83: Roll Out Plan (Efficiency Improvement Targets) – Collection Efficiency
Sl. No. Island Base year scenario (FY 15)
Collection Efficiency Trajectory (in %)
FY 16 FY 17 FY 18 FY 19
1 Agatti 78.98% 83.98% 88.99% 93.99% 99.00%
2 Amini 89.17% 91.63% 94.09% 96.54% 99.00%
3 Androth 83.34% 87.26% 91.17% 95.09% 99.00%
4 Bitra 84.34% 88.00% 91.67% 95.33% 99.00%
5 Chetlat 85.05% 88.54% 92.02% 95.51% 99.00%
6 Kadmat 90.61% 92.70% 94.80% 96.90% 99.00%
7 Kalpeni 85.67% 89.00% 92.33% 95.67% 99.00%
8 Kavaratti 85.71% 89.03% 92.36% 95.68% 99.00%
9 Kiltan 83.39% 87.29% 91.19% 95.10% 99.00%
10 Minicoy 89.79% 92.09% 94.40% 96.70% 99.00%
Total 85.62% 88.96% 92.30% 95.64% 99.00%
Table 84: Roll Out Plan (Efficiency Improvement Targets) – AT&C Losses
Sl. No. Island Base year scenario (FY 15)
AT&C Loss Trajectory (in %)
FY 16 FY 17 FY 18 FY 19
1 Agatti 25.47% 20.66% 15.84% 11.01% 6.17%
2 Amini 12.92% 10.52% 8.12% 5.72% 3.32%
3 Androth 20.39% 16.65% 12.91% 9.17% 5.43%
4 Bitra 15.66% 12.00% 8.33% 4.67% 1.00%
5 Chetlat 22.06% 18.64% 15.21% 11.76% 8.29%
6 Kadmat 31.38% 26.09% 20.62% 14.99% 9.19%
7 Kalpeni 19.40% 16.18% 12.95% 9.71% 6.46%
8 Kavaratti 22.32% 19.09% 15.84% 12.57% 9.29%
9 Kiltan 26.80% 22.50% 18.12% 13.66% 9.13%
10 Minicoy 13.36% 11.14% 8.91% 6.69% 4.47%
Total 21.05% 17.48% 13.90% 10.32% 6.72%

24x7 Power For All (Lakshadweep Islands) 65
The Roll-Out Plan for Capacity addition/ augmentation is summarized below:
Table 85: Roll Out Plan (Capacity Augmentation) – Step-Up Transformers (in MVA)
Sl. No. Island Base year scenario (FY 16)
Capacity Addition (in MVA) Total expected capacity FY 19 FY 17 FY 18 FY 19 Total
1 Agatti 2.00 1.00 0.00 0.00 1.00 3.00
2 Amini 1.00 0.00 1.00 0.00 1.00 2.00
3 Androth 4.50 0.00 0.00 0.00 0.00 4.50
4 Bitra 0.00 0.00 0.00 0.00 0.00 0.00
5 Chetlat 0.50 0.00 0.00 0.00 0.00 0.50
6 Kadmat 1.50 0.00 1.00 0.00 1.00 2.50
7 Kalpeni 1.00 0.00 1.00 0.00 1.00 2.00
8 Kavaratti 6.00 0.00 1.00 0.00 1.00 7.00
9 Kiltan 1.10 0.00 1.00 0.00 1.00 2.10
10 Minicoy 6.00 0.00 0.00 0.00 0.00 6.00
Total 23.60 1.00 5.00 0.00 6.00 29.60
Table 86: Roll Out Plan (Capacity Augmentation) – Step-Down Transformers (in MVA)
Sl. No. Island Base year scenario (FY 16)
Capacity Addition (in MVA) Total expected capacity FY 19 FY 17 FY 18 FY 19 Total
1 Agatti 1.60 0.50 0.00 0.50 1.00 2.60
2 Amini 1.30 0.00 0.75 0.00 0.75 2.05
3 Androth 2.56 0.25 0.25 0.50 1.00 3.56
4 Bitra 0.00 0.00 0.00 0.00 0.00 0.00
5 Chetlat 0.30 0.00 0.00 0.00 0.00 0.30
6 Kadmat 1.00 0.00 0.75 0.00 0.75 1.75
7 Kalpeni 1.00 0.00 0.75 0.00 0.75 1.75
8 Kavaratti 4.53 0.00 0.50 0.00 0.50 5.03
9 Kiltan 0.70 0.00 0.25 0.00 0.25 0.95
10 Minicoy 2.90 0.00 0.25 0.00 0.25 3.15
Total 15.90 0.75 3.50 1.00 5.25 21.15

24x7 Power For All (Lakshadweep Islands) 66
Table 87: Roll Out Plan (Capacity Augmentation) – HT Lines (in Ckt. Km)
Sl. No. Island Base year scenario (FY 16)
Capacity Addition (in Ckt KM) Total expected capacity FY 19 FY 17 FY 18 FY 19 Total
1 Agatti 14.51 1.00 1.00 2.00 16.51
2 Amini 6.86 1.00 1.00 2.00 8.86
3 Androth 12.00 2.00 1.00 3.00 15.00
4 Bitra 0.00 0.00
5 Chetlat 2.71 1.00 1.00 3.71
6 Kadmat 18.21 1.00 1.00 2.00 20.21
7 Kalpeni 7.57 1.00 1.00 2.00 9.57
8 Kavaratti 25.50 1.00 1.00 2.00 27.50
9 Kiltan 5.84 1.00 1.00 6.84
10 Minicoy 11.36 0.75 0.75 1.50 12.86
Total 104.56 8.75 7.75 0.00 16.50 121.06
Table 88: Roll Out Plan (Capacity Augmentation) – LT Lines (in Ckt. Km)
Sl. No. Island Base year scenario (FY 16)
Capacity Addition (in Ckt KM) Total expected capacity FY 19 FY 17 FY 18 FY 19 Total
1 Agatti 31.25 2.00 2.00 4.00 35.25
2 Amini 32.59 2.00 3.00 5.00 37.59
3 Androth 45.52 2.00 2.00 4.00 49.52
4 Bitra 0.00 0.00
5 Chetlat 8.49 1.50 1.50 9.99
6 Kadmat 32.69 1.00 3.00 4.00 36.69
7 Kalpeni 29.03 2.00 2.00 4.00 33.03
8 Kavaratti 41.98 3.00 5.00 8.00 49.98
9 Kiltan 12.30 1.00 1.00 2.00 14.30
10 Minicoy 34.37 2.00 2.00 4.00 38.37
Total 268.21 15.00 20.00 1.50 36.50 304.71

24x7 Power For All (Lakshadweep Islands) 67
Table 89: Roll Out Plan (Capacity Augmentation) – Street Lights (in No.s)
Sl. No. Island Base year scenario (FY 16)
Capacity Addition (in No.s) Total expected capacity FY 19 FY 17 FY 18 FY 19 Total
1 Agatti 541 159 159 700
2 Amini 690 60 60 750
3 Androth 583 167 167 750
4 Bitra 0 0
5 Chetlat 358 42 42 400
6 Kadmat 658 92 92 750
7 Kalpeni 568 132 132 700
8 Kavaratti 865 75 75 940
9 Kiltan 373 52 52 425
10 Minicoy 698 65 65 763
Total 5334 737 65 42 844 6178
Table 90: Roll Out Plan (Capacity Augmentation) – Solar Street Lights (in No.s)
Sl. No. Island Base year scenario (FY 16)
Capacity Addition (in No.s) Total expected capacity FY 19 FY 17 FY 18 FY 19 Total
1 Agatti 204 96 96 300
2 Amini 260 50 50 310
3 Androth 160 40 40 200
4 Bitra 80 20 20 100
5 Chetlat 80 20 20 100
6 Kadmat 210 65 65 275
7 Kalpeni 167 83 83 250
8 Kavaratti 298 50 50 348
9 Kiltan 100 50 50 150
10 Minicoy 435 45 45 480
Total 1994 479 40 0 519 2513
The concerned officials of the Electrical Divisions/Islands should be apprised about their
individual targets and effective and robust monitoring mechanism is required to be evolved and
put in place to achieve these targets.