24X7 POWER FOR ALL DADRA AND NAGAR...
44
24X7 POWER FOR ALL DADRA AND NAGAR HAVELI A Joint Initiative of Government of India and Administration of UT of Dadra and Nagar Haveli
Transcript of 24X7 POWER FOR ALL DADRA AND NAGAR...
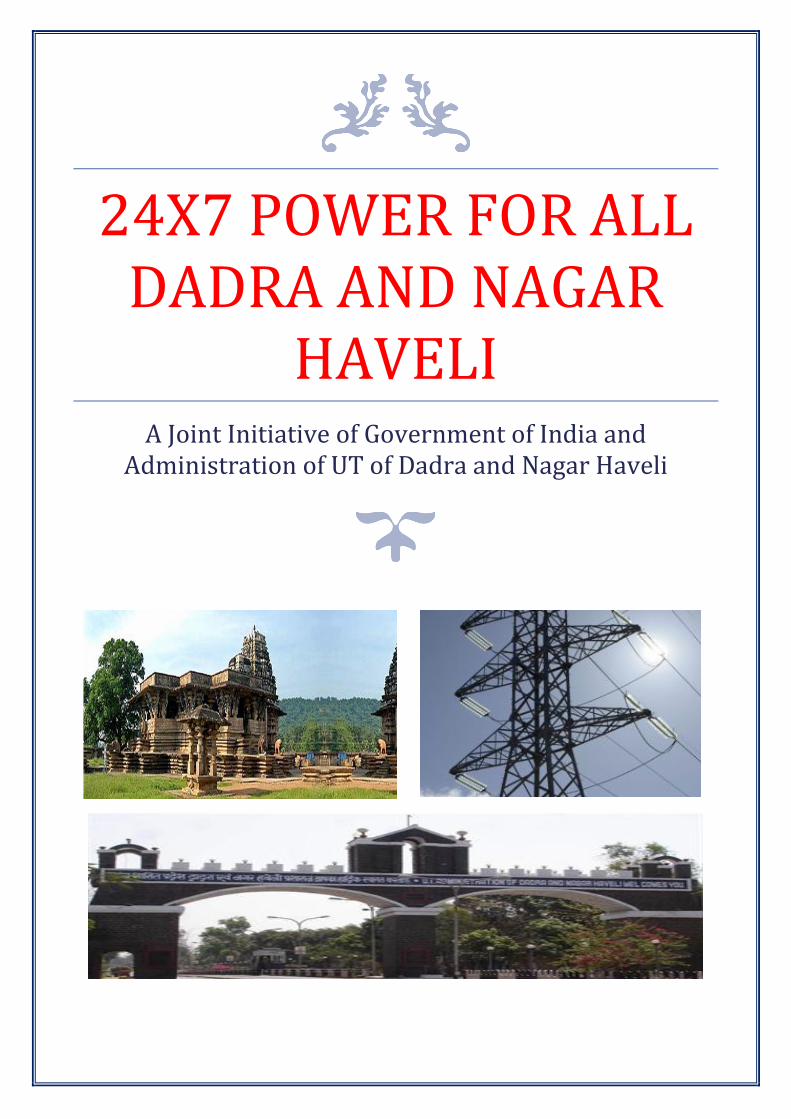
24X7 POWER FOR ALL DADRA AND NAGAR
HAVELI A Joint Initiative of Government of India and
Administration of UT of Dadra and Nagar Haveli
Government of India
Piyush Goyal
Union Minister of State (IC) Power, Coal, New & Renewable Energy
Foreword
Electricity consumption is one of the most important indices that
decide the development level of a nation. The Government of
India is committed to improving the quality of life of its citizens
through higher electricity consumption. Our aim is to provide
each household access to electricity, round the clock. The ‘Power
for !ll’ programme is a major step in this direction.
This joint initiative of Government of India and Administration of
Dadra and Nagar Haveli aims to further enhance the satisfaction
levels of the consumers and improve the quality of life of people
through 24x7 power supply. This would lead to rapid economic
development of the UT in primary, secondary & tertiary sectors
resulting in inclusive development.
I compliment the Administration of Dadra and Nagar Haveli and
wish them all the best for implementation of this programme. The
Government of India will complement the efforts of
Administration of Dadra and Nagar Haveli in bringing
uninterrupted quality power to each household, farmer, small &
medium enterprises and establishment in the UT.
Administration of Dadra
and Nagar Haveli
Vikram Dev Dutt, IAS Administrator of Dadra and Nagar Haveli
Foreword
The Power Sector plays a pivotal role in the economic
development of the country. The efficient power sector is a sine
qua non for the optional development of the nation. The
availability of the reliable, uninterrupted and quality power
supply to all the categories of the consumers is imperative to
achieve this goal.
I would like to thank the Government of India, Ministry of Power
for preparing this document for the UT of Dadra & Nagar Haveli
under the scheme of implementation of Power for All (PFA)
programme.
The UT of Dadra & Nagar Haveli is a small Union Territory
situated in the Western Part of the country which is sandwiched
between the States of Gujarat and Maharashtra.
The UT has a geographical area of 491 Sq. Km. and is a tribal
dominated territory. The Government of India has extended
various benefits for the industrial development in the territory
since 1982 as a result of which, homogenous industrial
development has taken place. The power sector has been a
prime mover in the overall development of the territory.
Our Administration is fully prepared to transform DNH into a
power cut-free State within a short period and provide every
citizen access to reliable and affordable electricity with
cooperation from the Central Government. The UT has initiated
all necessary steps to provide adequate infrastructure facilities
like Capacity Addition, strengthening of Transmission and
Distribution network, encouraging Renewable Generation of
power and reduction of Aggregate Technical and Commercial
losses.
The Power for All programme is an excellent platform for
addressing these issues and it would further provide an
opportunity to improve the power sector of the territory and
achieve the goal as envisaged by the nation.

Government of India Administration of Dadra and Nagar Haveli
Joint Statement The Government of India, Ministry of Power
has selected Dadra and Nagar Haveli as one of
the Union Territories for Power for All (PFA)
programme. This Programme will be
implemented by Administration of Dadra &
Nagar Haveli with active support of
Government of India, Ministry of Power.
The objective of the programme is to supply
24x7 quality, reliable, uninterrupted and
affordable power supply to all Domestic,
Commercial, Agricultural and Industrial
category of consumers within the territory. All
unconnected households will be provided
electricity as the goal of 100% electrification.
The Administration of UT Dadra & Nagar
Haveli is giving highest priority to power
sector of the territory and has created
adequate infrastructure to ensure better
power supply.
The Administration of Dadra & Nagar Haveli
would ensure that all the necessary steps
outlined in the PFA document are taken up in
terms of capacity addition, power procurement,
strengthening the required transmission and
distribution network, encouraging
renewables, energy efficiency measures, and
reduction of AT & C losses and following good
governance practices in implementation of all
Central and State Government schemes.
Government of India (GOI) would supplement
the efforts of Union Territory through
additional allocation of power from Central
Generating Stations.
It is envisaged to cover entire territory under
PFA programme in a phased manner and
provide 24 x 7 power supply to all Domestic,
Industrial Agricultural and Commercial
consumers by March 2017.
The matter would be reviewed by the Central
Government and Administration of UT Dadra
& Nagar Haveli and would meet regularly to
review the progress of the programme over
the next 3 years and would strive to achieve
the objectives of the programme by taking the
necessary actions as envisaged in the PFA
document.
J. B. Singh, IAS Secretary, Power Department,
Administration of Dadra and Nagar Haveli

EXECUTIVE SUMMARY
24x7- Power for All (24x7 PFA) is a Joint Initiative of
Government of India (GoI) and State
Governments/UT Administrations with the
objective to provide 24x7 power available to all
households, industry, commercial businesses, public
needs, any other electricity consuming entity and
adequate power to agriculture farm holdings by FY
19. This roadmap document aims to meet the above
objectives for the UT of Dadra and Nagar Haveli.
As per 2011 census, the population of UT of Dadra
and Nagar Haveli was 3.44 lakhs. The power
department of UT has been corporatizes recently
and DNHPDCL is the distribution licensee in the UT.
The UT has the highest per capita annual
consumption of 13,769 units (FY 15) in the country
which is way higher than national average of 1010
units during the same year (CEA). The same is due to
about 97% industrial consumption in the UT.
CONNECTING THE UNCONNECTED
Based on 2011 Census, there were around 3505 un-
electrified households in the UT but as per UT
Administration, there is no un-electrified household
in the UT at present.
FEEDER SEGREGATION
Keeping in view of the negligible sales in agriculture
category, the UT does not have any feeder
segregation and also has not estimated any
expenditure on this account.
24 X 7 SUPPLY
The UT is already supplying power to the extent of
24 hours in urban areas and rural areas except for
maintenance and operational issues. However, UT is
meeting the time line of power supply restoration as
per the Standards of Performance notified by JERC.
GROWTH IN DEMAND
In order to achieve the objective of 24 x 7 supply in
the state, the state would see an increase in peak
demand from 714 MW in FY 15 to 1013 MW in FY 19
with corresponding increase in energy requirement
from 5304 MU in FY 15 to 7715 MU in FY 19.
In the present conditions, the peak demand of 714
MW in FY 15 was almost fully met owing to power
allocation from central generating stations and
purchases on medium / long term basis by UT.
However some of the industrial consumer are opting
for open access and this issue may vary the projected
energy & maximum demand of the UT in future.
The future demands have been derived by
estimating household consumption after taking into
account the growth in number of electrified
households on the one hand and the growth in
average consumption per household on the other
hand. It has also been assumed that un-electrified
consumers arrived as per census projection would
be electrified in FY 17. Individual category-wise
growth rate equivalent to the 5 year CAGR has been
considered for other than domestic sectors.
The daily household consumption has been
computed for households for FY 15 and escalated by
9.23% annually in rural areas and urban areas (from
4.66 units to 6.63 units) to arrive at the daily
household consumption up to FY 19 while CAGR for
non-domestic consumption has been taken at 8%
growth rate for computation of demand by the end
of FY19.
SUPPLY ADEQUACY
UT does not has its own generation and is meeting
the most of the demand through allocation from
Central Generating Stations. The present long-term
availability of the state is 1028.30 MW from all
sources including share from unallocated quota from
Central Generating Stations.
In FY 15 about 65% of the power was sourced from
NTPC stations and 25% power from IPP (EMCO).
Rest Power was drawn from nuclear and renewable
based plants and from UI mechanism
In order to meet the increasing demand, the UT has
been allocated 168.07 MW from CGSs (tentative) in a
phased manner by FY 19. The UT has also planned to
set-up or procure 94.27 MW solar power by
investing Rs 126.39 Crores for own generation.
As Dadra and Nagar Haveli will be having projected
energy availability of almost 100% through long-
term share in FY 19, there is no requirement of
purchase through short term power as of now.
However 609.57 MW of unallocated power is
assigned to the UT from CGS which is not reliable in
long run, hence a part of unallocated power needs to
be converted to firm allocation by Ministry of Power.
However, there may be a reduction in demand of the
tune of about 200 MW in case some of existing
industrial consumers would go for open access.
Accordingly, UT needs to optimize its power
purchases as per requirement on short term basis
and should look forward for selling the surplus
power to prospective deficit states in case more
consumers opt for open access. .
ADEQUACY OF TRANSMISSION NETWORK
Presently, UT is getting power at 400 KV and 220 KV
from Western Grid through PGCIL Substations.
PGCIL has constructed a 400/220 KV, 2x315 MVA
S/S in UT (at Kala) exclusively for UT and UT is also
getting supply from 400/220 KV, 3x315 MVA S/S at
Vapi. The existing ISTS transmission line capacity
and transformation capacity is adequate for meeting
the present as well as future requirements.
The present 220 KV intra state capacity of 1000 MVA
is proposed to be increased to 1520 MVA by adding
520 MVA capacities at Vagchipa and Sayali S/Ss in
the UT.
The existing intra-state transmission system with
the planned investment of Rs 160 Crores towards
capacity addition would be adequate to meet the
requirement as envisaged for 24x7 PFA.
ADEQUACY OF DISTRIBUTION NETWORK
There are about 65000 consumers in the UT with
1389 MVA connected load. The 66/11 KV S/S
capacity in UT is about 712 MVA along with DT
capacity of about 219 MVA. Out of max demand of
714 MW, about 400 MW load is being supply to HT
consumers at 220 KV and 66 KV levels and keeping
in view the load incident at 66 KV and 11 KV, the
existing transformation capacities are adequate.
The UT has envisaged a requirement of Rs 180
Crores in strengthening of infrastructure in urban
areas under IPDS and Rs 129 Crores in strengthening
of infrastructure in rural areas under DDUGJY out of
which Rs 5 Crore cost has been approved by central
government. Further, Rs. 37 Crores have been
envisaged for strengthening of infrastructure. Also,
Rs 65Crores is estimated for IT initiatives to ensure
better consumer service and roll-out of smart grid.
The UT has planned capacity addition of 240 MVA at
66/11 kV level and 74 MVA at distribution
transformer level.
The existing distribution network with projected
addition would be adequate under projected peak
load conditions but the UT has to take necessary
steps to complete the planned works within
scheduled time period.
The T&D Losses (including intra-state transmission
losses) are also projected to be remain almost
constant at 4.70% by FY 19 from present level of
4.78% and AT&C is projected to reduce to 4.70% by
FY 19 from the present level of 5.76% owing to
increase in collection efficiency.
FINANCIAL TURNAROUND
DNHPDCL is showing a net profit of Rs 43 Crores
during FY 15 and the accumulated financial profit
(surplus) of DNHPDCL stands as Rs 110 Crores in FY
15. Since Power Purchase cost constitute 97% of
total expense, the utility will be profitable for future
years also if only increase in power purchase
expense is allowed in tariff by the regulator. The
utility also incurs capital expenditure from
budgetary support of central government and has
cash (and equivalent) of Rs 545 Crore, hence it is also
comfortably placed in terms of cash flow.
On the basis of above considerations, a roadmap to
achieve ‘24x7 Power for !ll’ targets has been
formulated and detailed in the report.

TABLE OF CONTENTS
CHAPTER 1: INTRODUCTION..........................................................................................................1
CHAPTER 2: FACTS ABOUT DADRA AND NAGAR HAVELI................................................3
CHAPTER 3: CONSUMPTION PATTERN AND ELECTRIFICATION STATUS ...............4
CHAPTER 4: DEMAND AND SUPPLY SCENARIO ....................................................................6
CHAPTER 5: GENERATION PLAN..................................................................................................9
CHAPTER 6: TRANSMISSION PLAN........................................................................................... 13
CHAPTER 7: DISTRIBUTION PLAN............................................................................................ 16
CHAPTER 8: RENEWABLE ENERGY INITIATIVES.............................................................. 22
CHAPTER 9: ENERGY CONSERVATION AND ENERGY EFFICIENCY PROGRAM ... 24
CHAPTER 10: FINANCIAL VIABILITY OF DISTRIBUTION COMPANY...................... 26
CHAPTER 11: OTHER INITIATIVES ......................................................................................... 27
CHAPTER 12: YEAR WISE ROLL OUT PLAN ........................................................................ 30
CHAPTER 13: FUND REQUIREMENT ...................................................................................... 32
ANNEXURES ......................................................................................................................................... 33
CHAPTER 1: INTRODUCTION
Power sector is a critical infrastructure
element for growth of an economy. The
availability of reliable, quality and affordable
power is vital for rapid growth in
agriculture, industry and for overall
economic development of a state/UT. For
this an efficient, resilient and financially
healthy power sector is an essential
requirement for growth of a state/UT and
economic empowerment of the common
man.
Under the Indian Constitution, electricity is a
concurrent subject. As per Electricity Act
2003, it is the duty of a distribution licensee
to develop and maintain an efficient,
coordinated and economical distribution
system in the mandated area of supply as
well as to supply electricity in accordance
with the provisions contained in the Act. The
State Electricity Regulatory Commission
(SERC), as per the provisions of the act,
specifies and enforces the standards with
respect to quality and reliability of supply by
licensees and also monitors the performance
of distribution companies (Licensees) on the
basis of notified performance standards.
OBJECTIVES AND KEY OUTCOMES OF
THE 24X7 POWER FOR ALL – JOINT
INITIATIVE
The 24x7 Power for All (24x7 PFA) is a Joint
Initiative of Government of India (GoI) and
Administration of Dadra and Nagar Haveli
with the objective to make 24x7 power
available to all households, industry,
commercial businesses, public needs, any
other electricity consuming entity and
adequate power to agriculture farm
holdings.
Towards this goal the 24x7 PFA initiative
seeks to:
i. Ensure reliable 24x7 supply to
consumers within a period of four years
of commencement of the program. The
hours of supply for agriculture
consumers will be decided by the State
Government as per requirement.
ii. Ensure that all unconnected households
are provided access to electricity in a time
bound manner in the next four years i.e.
by end of FY 19.
iii. Ensure adequate capacity addition
planning and tie ups for power from
various sources at affordable price to
meet the projected power demand in
future.
iv. Strengthen
distribution
the transmission
network to cater to
and
the
expected growth in demand of existing as
well as future consumers.
v. Assess the financial measures including
optimizing investments and undertaking
necessary balance sheet restructuring
measures to ensure liquidity in the
finances of the utility.
vi. Put in place a strategy to ensure
reduction of AT&C losses as per the
agreed loss reduction trajectory and
methodology and steps required to be
taken at every level of distribution.
vii. Identify steps for implementation and
adoption of modern technologies to
monitor reliability of supply.
viii. Identify steps for monitoring timely
commissioning of various generating
plants and transmission and distribution
infrastructure to meet the expected
growth in demand.
24X7 POWER FOR ALL (DADRA AND NAGAR HAVELI) 1

ix. To take measures for meeting the
performance standards as laid down by
the SERC.
This document is an action plan has been
drawn to achieve the above aims and
objectives. The plan will be executed by
the Administration of Dadra and Nagar
Haveli with the support of Government of
India, wherever necessary, as per their
approved plans, schemes and policies.
METHODOLOGY FOR PREPARATION
OF THE ACTION PLAN FOR 24X7
POWER FOR ALL
The plan aims at the following:
(1) bridging the gap between the demand and supply for the already identified/registered consumers and other consuming entities,
(2) connecting the unconnected households and unconnected farm holdings.
Accordingly the methodology adopted to
prepare the ‘!ction Plan’ for 24x7 PF!
includes inter-alia:
1) Projection of average per day
consumption of rural and urban
households based on respective
historical compounded annual growth
rates (CAGR) during the past five years.
2) Projection of demand of commercial,
industrial and agriculture consumers
based again on past data and historical
CAGR recorded during the past five years.
3) Assess the power requirement of un-
electrified households and draw up a
time bound plan for electrification of all
households.
4) Project the annual energy requirement
and maximum demand by aggregating
the requirement of all consumer
categories and applying an appropriate
load factor.
5) Draw up a broad plan to meet power
demand in future through
UT’s own upcoming generation
resources.
Allocation from upcoming central
sector power plants
Quantum for additional procurement
required.
6) Assess the additional energy requirement
for providing 24x7 power supply to all
households in the state/UT as well as to
other consumer categories and
determine financial implications on
utilities for procuring additional energy
and its implication on tariff.
7) Assess the adequacy of the network - both
inter-state and intra state transmission as
well as distribution so as to meet the
increased / expected / projected power
requirement of all consumer categories of
the state/UT.
8) To incorporate futuristic initiatives like
smart grid, energy efficiency measures
etc.
9) Conduct sensitivity analysis for cost of
service and resulting financial gap under
multiple scenarios, namely, tariff hike,
reduction in power procurement cost and
increase in interest and moratorium
period and AT&C loss reduction, etc.
10) Set monitorable targets to achieve the
goal of 24x7 Power for All in a cost
effective manner to the consumers of the
state/UT.
24X7 POWER FOR ALL (DADRA AND NAGAR HAVELI) 2

CHAPTER 2: FACTS ABOUT DADRA AND NAGAR
HAVELI
Key Facts
Constituted on 11th August 1961 As per 2011 Census Total Area - Rural Areas - Urban Areas
491 Sq. Km - 445 Sq. Km (90.69%) - 46 Sq. Km (9.31%)
Administrative Districts 1 No. of Villages -Inhabited villages - 65
Population - Rural - Urban
3,43,709 - 1,83,114 - 1,60,595
Dadra and Nagar Haveli (DNH) got independence from Portugese control in 1954 and was
formally merged in India on 11 August 1961. It is bordered by Gujarat in the north and
Maharashtra in the south.
The forests cover almost two-fifth area of the Dadra and Nagar Haveli. Northeast and Eastern
region of UT has got hilly terrain and elevations up to 300 meters can be found. Central plains
near Dadra are lowlands which come under the watershed areas of the Daman Ganga River and
the tributaries.
Economy of DNH is primarily dependent on Agriculture and Tourism. Agriculture is considered
as the economic activity that contributes most to the economy. Paddy, raggy and millets are main
crops. Approximately 60% of working population is engaged in agriculture and allied activities.
DNH Power Distribution Corporation Ltd (DNHPDCL) deemed licensee under Section 14 of the
Electricity Act 2003, is mainly engaged in the procurement and distribution of electricity to
various consumer categories in the Union Territory (UT) of DNH. DNHPDCL is part of the
Administration of Union Territory of Dadra & Nagar Haveli and headed by the Secretary (Power).
DNHPDCL does not have its own power generating station (except small solar plants) and relies
mainly on power from Central Generating Stations (CGSs) such as NTPC Ltd.
The power sector of UT is regulated by Joint Electricity Regulatory Commission for State of Goa
and UTs (JERC-UTS).
24X7 POWER FOR ALL (DADRA AND NAGAR HAVELI) 3

-
-
CHAPTER 3: CONSUMPTION PATTERN AND
ELECTRIFICATION STATUS
ELECTRIFICATION STATUS AND PER-
CAPITA CONSUMPTION
The population of Dadra and Nagar Haveli
has grown from 2,20,490 in 2001 to 3,43,709
in 2011 at a decadal CAGR of 4.54%. This
growth rate has been considered for
estimating the population beyond 2011.
Based on the annual energy availability from
FY 11 to FY 15, the per-capita consumption
of electricity in the period has been as shown
below:
Figure 1: Per-Capita Consumption of
Electricity (kWh per person) in recent years
STATUS OF ELECTRIFICATION AND
PROJECTION OF HOUSEHOLDS FOR
FY 15
The summary of electrified and un-
electrified households as per 2001 and 2011
census and projections for FY 15 based on
CAGR for past 10 years is tabulated below:
Table 1: Projection of households based on
Census 2001 and 2011
Particulars Electrified
Households
Un Electrified
Households
Total Households
Total
2001 37,813 6,160 43,973
in % 85.99% 14.01% 100.00%
2011 69,558 3,505 73,063
Particulars Electrified
Households
Un Electrified
Households
Total Households
in % 95.20% 4.80% 100.00%
CAGR 6.28% -5.48% 5.21% FY 15 (Projected Households)
86,656 2,861 89,516
Rural
2001 27,088 5,695 32,783
in % 82.63% 17.37% 74.55%
2011 32,452 2,956 35,408
in % 91.65% 8.35% 48.46%
CAGR 1.82% -6.35% 0.77% FY 15 (Projected Households)
41,108 2,274 43,382
Urban
2001 10,725 465 11,190
in % 95.84% 4.16% 25.45%
2011 37,106 549 37,655
in % 98.54% 1.46% 51.54%
CAGR 13.22% 1.67% 12.90% FY 15 (Projected Households)
45,548 587 46,135
From above it is inferred that:
In 2011, 48.46% of the households are in
rural areas and 51.54% are in urban areas.
In 2011, 95.20% households are electrified
of which Urban areas have electrification of
98.54% and rural areas have
electrification of 91.65%.
Overall number of households has grown at
a decadal CAGR of 5.21% with urban areas
showing higher decadal growth rate of
12.90% as compared to 0.77% in rural
areas.
Expected numbers of households in both
urban and rural areas have been arrived for
FY 15 by projecting them at decadal CAGR of
total households in the UT. Number of un-
electrified households in rural and urban
areas in FY 15 have been projected by
escalating them by respective CAGR of un-
electrified households in rural and urban
24X7 POWER FOR ALL (DADRA AND NAGAR HAVELI) 4

areas. As per projections, about 2861
households are un-electrified in the UT but
as per UT Administration, UT has achieved
100% electrification and there is no un-
electrified household in the UT.
UT Administration has shown only 53,193
electrified domestic consumers in FY 15 as
against the above projected figures of
86,656, electrified households derived by
extrapolating Census 2011 data.
The difference in census projections and
records of DNHPDCL is due to the fact that a
household may have single electrical
consumption but may have been considered
as separate household in census. For the
projection of daily household consumption
(for the estimation of demand) of both rural
and urban consumers in future years,
following methodology has been adopted:
The figure of the domestic consumers in FY
15 as given by DNHPDCL has been
considered as electrified households.
However different figures for urban and
rural consumers and their consumptions are
not available. Therefore for projection
consumers of DNHPDCL have been treated
as one entity
The issue of demand projections for future
years was discussed with the UT. For the
projection of daily household consumption
(for the estimation of demand) of both rural
and urban consumers in future years,
following methodology has been adopted:
(1) The figures of the domestic consumers
in FY 15 as given by DNHPDCL has been
considered as electrified households.
(2) The figures of the un-electrified
households in FY 15 has been
considered as per census projection by
methodology explained above for
demand projection only, however there
is no un electrified household in the UT
as per UT Administration.
Based on the above, the number of
electrified and un-electrified households in
Dadra and Nagar Haveli in FY 15 have been
arrived at. Accordingly, the demand
projections for the UT have been worked out
in the next chapter.
24X7 POWER FOR ALL (DADRA AND NAGAR HAVELI) 5
CHAPTER 4: DEMAND AND SUPPLY SCENARIO
PRESENT POWER SUPPLY
POSITION
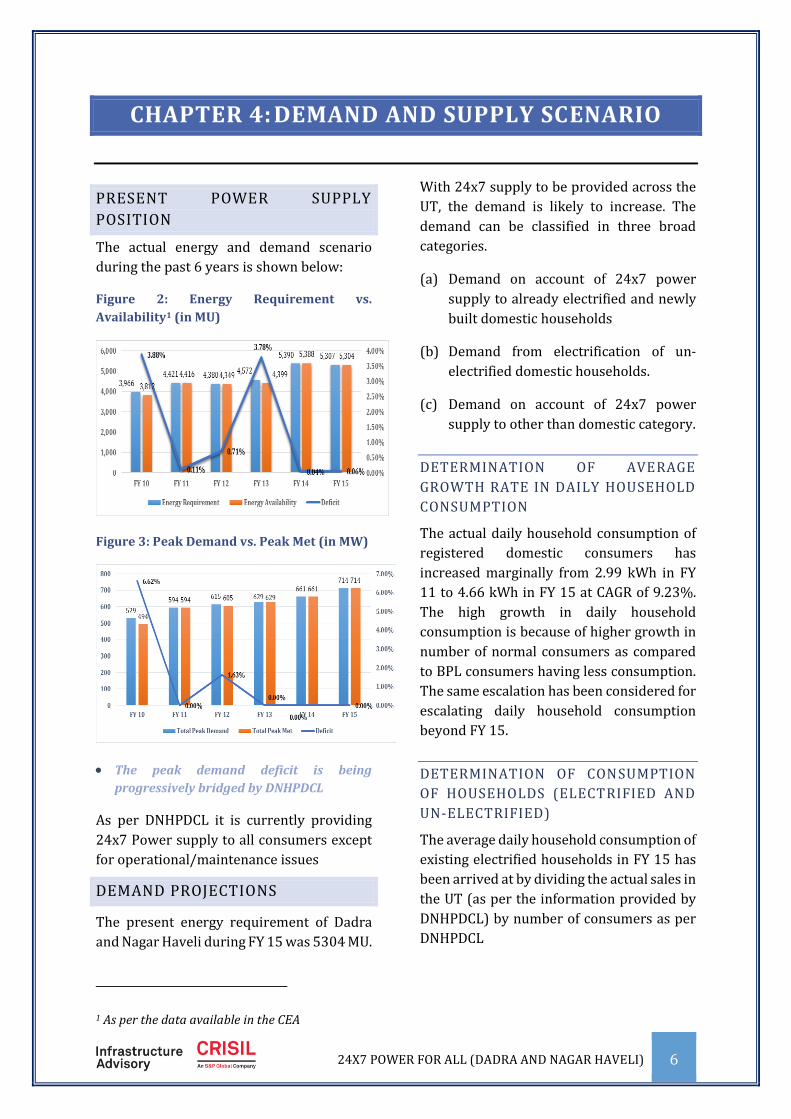
The actual energy and demand scenario
during the past 6 years is shown below:
Figure 2: Energy Requirement vs.
Availability1 (in MU)
With 24x7 supply to be provided across the
UT, the demand is likely to increase. The
demand can be classified in three broad
categories.
(a) Demand on account of 24x7 power
supply to already electrified and newly
built domestic households
(b) Demand from electrification of un-
electrified domestic households.
(c) Demand on account of 24x7 power
supply to other than domestic category.
DETERMINATION OF AVERAGE
GROWTH RATE IN DAILY HOUSEHOLD
CONSUMPTION
The actual daily household consumption of Figure 3: Peak Demand vs. Peak Met (in MW)
registered domestic consumers has
The peak demand deficit is being
progressively bridged by DNHPDCL
As per DNHPDCL it is currently providing
24x7 Power supply to all consumers except
for operational/maintenance issues
DEMAND PROJECTIONS
The present energy requirement of Dadra
and Nagar Haveli during FY 15 was 5304 MU.
increased marginally from 2.99 kWh in FY
11 to 4.66 kWh in FY 15 at CAGR of 9.23%.
The high growth in daily household
consumption is because of higher growth in
number of normal consumers as compared
to BPL consumers having less consumption.
The same escalation has been considered for
escalating daily household consumption
beyond FY 15.
DETERMINATION OF CONSUMPTION
OF HOUSEHOLDS (ELECTRIFIED AND
UN-ELECTRIFIED)
The average daily household consumption of
existing electrified households in FY 15 has
been arrived at by dividing the actual sales in
the UT (as per the information provided by
DNHPDCL) by number of consumers as per
DNHPDCL
1 As per the data available in the CEA
24X7 POWER FOR ALL (DADRA AND NAGAR HAVELI) 6

The projected daily household consumption
in the UT is shown below:
Figure 4: Projected Daily Household
Consumption Electricity (kWh per person)
for future years
However, it may also be kept in view that the
geographical features of the UT (i.e. the
location, accessibility, weather) along with
current tariff levels play a significant role is
determining the current and future
demands.
The number of electrified households is
expected to grow at the decadal CAGR of
5.21% in the UT. For purpose of Demand
projection it has been assumed that all un-
electrified households would be electrified
in FY 17.
Accordingly, the annual consumption of the
domestic households is tabulated below:
Table 2: Projected Sales from Existing and Newly Electrified Households
S. N. Particulars FY 15 FY 16 FY 17 FY 18 FY 19
A Electrified Consumers (Existing + Projected Growth)
Electrified Consumers (in Nos.) 53,193 55,964 58,879 61,945 65,172
Daily Household Consumption (in kWh) 4.66 5.09 5.56 6.07 6.63
Projected Annual Consumption (in MU) 90 104 120 139 159
B Electrification of Un-Electrified Consumers
Targeted Annual Addition (in Nos.) - 0 2,861 0 0
Cumulative Annual Addition (In Nos.) - 0 2,861 2,861 2,861
Projected Annual Consumption (in MU) - 0 3 6 7
C=A+B Total Projected Consumption (MU) 90 104 122 144 165
DETERMINATION OF CONSUMPTION
OF OTHER CONSUMERS
For projection of sales for FY 15 to FY 19, the
CAGR of previous 5 years has been
considered for all categories except public
water works. Consumption in Public Water
Works have started in FY 15 only and an
escalation of 5% has been considered for
projecting consumption till FY 19.
Based on this, the category-wise sales is as
per table below:
Table 3: Projected Category-wise Sales (In
MU)
Categories CAGR
Considered FY 16
Projections
FY 17 FY 18 FY 19
Domestic Category 103.93 122.34 143.60 164.67
LT Category - Other than domestic
Commercial 7.32% 29.03 31.16 33.44 35.88
Agriculture 7.52% 4.63 4.98 5.36 5.76
Industrial LT 8.45% 203.35 220.53 239.16 259.37
Public Lighting 25.43% 9.73 12.21 15.31 19.20
Public Water Works 5.00% 3.39 3.56 3.74 3.93
Temporary Supply 11.63% 2.90 3.24 3.62 4.04
HT/EHT Category
Industrial (IHT) 9.10% 5,281.37 5,762.23 6,286.87 6,859.28
Grand Total 5638.34 6160.25 6731.09 7352.13
As seen from above, the share of industrial sales (LT, HT) will continue to form bulk of demand at
97%, however in order to meet objective to meet objective of Power Supply to all 24 x 7 percentage
of power consumption by domestic segment will increase from 1.85% to 2.25%.
24X7 POWER FOR ALL (DADRA AND NAGAR HAVELI) 7

ENERGY AND DEMAND REQUIREMENT
The trajectory for T&D (including intra-state
transmission) and AT&C loss reduction for
DNHPDCL has been taken as submitted by it
for FY 2015-16 to FY 2018-19
Considering the collection efficiency
proposed by DNHPDCL, the T&D and AT&C
Loss trajectory is shown below:
Figure 5: Projected Loss Reduction Trajectory
maximum demand of OA consumers which
at 0.9 power factor arrives at 68 MW. Hence
total maximum demand handled by
Transmission and Distribution system has
been assumed as 1081 MW. The energy
consumed by OA consumer is 25 MU
As per projections made in 18th EPS of CEA,
the projected energy demand and peak load
for the UT of Dadra and Nagar Haveli was
7064 MU and 1072 MW in FY 19 as against
the now calculated energy demand of 7739
MU and peak load of 1081 MW in FY 19.
LOAD CURVE
Based on the loss reduction trajectory
approved as above, the energy and demand
requirement for the future years is tabulated
in table 5 below:
The load factor has been taken as average of
last 3 years actual PLF at 86.97%.
As seen from the above, the maximum
demand requirement of the UT is projected
to increase from 714 MW in FY 15 to 1013
MW in FY 19. Additionally there is 76 MVA
Table 4: Energy Requirement (In MU) and Peak Demand (in MW)
As can be seen from above graph seasonal
load-curve of the UT is almost flat with value
ranging from +/- 5%. The same is also
possible as most of the load is industrial
which do not exhibit much seasonal
variation.
Particulars Energy and Demand Scenario
FY 16 FY 17 FY 18 FY 19
Energy Requirement within UT
Sale within UT 5,638 6,160 6,731 7,352
Intra-State Transmission and Distribution Losses 4.70% 4.70% 4.70% 4.70%
Total Energy Requirement within State 5,916 6,464 7,063 7,715
Load Factor 86.97% 86.97% 86.97% 86.97%
Maximum Demand Requirement (DNHPDCL) 777 848 927 1,013
Maximum Demand (Open Access) 68 68 68 68
Maximum Demand (UT) 845 916 995 1081
However, the energy requirement and maximum demand may vary in case more industrial
consumers opt for open access, but UT has to establish & maintain the transmission system to
handle the total projected power of the UT.
24X7 POWER FOR ALL (DADRA AND NAGAR HAVELI) 8

-
CHAPTER 5: GENERATION PLAN
CUMULATIVE GENERATION
AVAILABILITY
DNHPDCL does not have any power plant of
its own and is dependent upon Central
Generating stations (CGS) and IPP. Long
Term allocation of the UT from CGS and IPP
as on 31.03.2015 stands at 1035 MW as
detailed in table below. The same also
includes 609 MW unallocated power from
CGS which has been allocated by Central
Government to Dadra and Nagar Haveli.
Station wise details are at Table 29 in
Annexure – 2. Coal based capacity
constitutes about 75% of total capacity
followed by gas based 18%.
Table 5: Availability Mix from Long-term Sources in FY 15 (in MW)
rise to 7715 MU in FY 19, taking into account
additional energy requirement for providing
24x7 power supply to the UT over the
normal load growth.
The actual energy availability from various
sources in FY 14 and FY 15 is summarized
below:
Figure 6: Availability Mix from Various Sources in FY 14 and FY 15 (in MU)
Source Latest Long term
Entitlement in MW
In %age
Availability Outside UT
Central Generating Stations
Coal 579.71 69.93%
Gas 178.10 21.50%
Nuclear 70.49 8.44%
Total 828.30 80.67%
Independent Power Producer
Coal 200 100%
Total 200 19.45%
Grand Total 1028.30
Dadra and Nagar Haveli has met a maximum
demand of 714 MW in FY 15 and the present
annual energy requirement of the UT is of
the order of 5307 MU.
The maximum demand (for DNHPDCL) is
expected to increase to 1013 MW in FY 19
and the energy requirement is projected to
During FY 15, about 65% of the power is
being sourced from NTPC Plants whose
average rate has decreased from Rs.
3.55/unit in FY 14 to Rs. 3.24/unit in FY 15
due to reduction in power offtake from
costly RGGPL.
Another 25% power is being sourced from
coal based IPP (EMCO Energy Ltd) whose
average rate is Rs 4.30/Unit.
PLANNED CAPACITY ADDITION
UT has the allocation of about 168.07 MW
from CGS which are planned to be
commissioned up to FY 19. Along with the
same 94.27 MW power is expected from
Solar Plants. The additional capacity
available from various sources (along with
the expected year of commissioning) is
summarized below:
24X7 POWER FOR ALL (DADRA AND NAGAR HAVELI) 9

-
Table 6: Summary of Additional Long-term Availability from Various Sources
Sr. No. Source Type Capacity
(MW)
Latest Long term Entitlement Availability
% MW
Availability Within UT
A Renewable Energy Sources
Solar Rooftop Solar 0.37 100.00% 0.37 FY 16
Solar Velugam Solar 3.00 100.00% 3.00 FY 17
Solar Kala Solar 0.90 100.00% 0.90 FY 18
Solar Kharadpada Solar 10.00 100.00% 10.00 FY 18
Subtotal Renewable Energy Sources 14.27 100.00% 14.27
Availability Outside UT
C CGS and Solar Plants - New
Solar JNNSM Solar 5.00 100.00% 5.00 FY 17
Solar Bidding Solar 75.00 100.00% 75.00 FY 17
Vindhyachal STPS - 5 Coal 1000.00 0.56% 5.55 FY 16
Lara STPS Coal 1600.00 0.56% 9.00 FY 18
Gadawara Coal 1600.00 0.7% 11.00 FY 18
Dhruvan Coal 1980.00 1.26% 24.95 FY 18
Mouda STPP-2 Coal 1320.00 1.11% 14.65 FY 17
Solapur Coal 1320.00 1.11% 14.65 FY 17
Khargaon Coal 1320.00 1.89% 24.95 FY 19
Barh Coal 1320.00 0.42% 5.54 FY 18
Karpakkar APS 3-4 Nuclear 1400.00 0.56% 7.78 FY 17
NSPCL Rourke;a Coal 250.00 20.00% 50.00 FY 17 Subtotal CGS - New 13190.0 1.28% 248.07
* Share allocation of some of the CGS is tentative as long-term allocation is yet to be done by MoP.
Share from Lara TPP, Solapur TPP, Mouda TPP St-II and Gadarwara TPP is tentative and MoP
allocation order yet to be issued. Share from Vindhyachal TPP-V & KAKRAPARA NPP U-3 & 4 is
firm.
The table below summarizes the availability of power from various sources including the existing
and upcoming capacity availability in FY 19:
Table 7: Projected Long-term Share Allocations from Various Sources (in MW)
Sr. No. Source Capacity Available in MW
FY 16 FY 17 FY 18 FY 19
Availability Within UT
A R.E. Sources – Solar 0.37 3.37 14.27 14.27
Subtotal Availability Within UT 0.37 3.37 14.27 14.27
Availability Outside UT
D CGS and IPP 1028.30 1028.30 1028.30 1028.30
E CGS and Solar Plants – New 5.55 172.63 223.12 248.07
Subtotal Availability Outside UT 1033.85 1200.93 1231.42 1276.37
Total Availability from long-term sources 1034.22 1204.30 1245.69 1290.64
As seen from above, after the completion of allocated CGS, the capacity availability from FY 15
24X7 POWER FOR ALL (DADRA AND NAGAR HAVELI) 10

to FY 19 for UT would be around 1276.37
MW from conventional sources and solar
power outside UT along with 14.27 MW from
Solar Plants inside the UT. (Date of
commissioning of CGS are based on the latest
expected dates of commercial operation as
available with Central Electricity Authority).
However, the availability is also from
renewable sources which inherently have
low capacity utilization factor and same has
been appropriately factored for computation
of energy availability from existing and
upcoming generating stations.
Accordingly, the projected energy
availability from the above mentioned
sources for future years is summarized in
table below.
Table 8: Projected Energy Availability from Long-term Share/Long Term Tie-Ups (in MU)
Source Adequacy of Energy Availability
FY 16 FY 17 FY 18 FY 19
Total Energy Requirement within UT 5,916 6,464 7,063 7,715
Energy Availability from Long-term Tie-ups 6,445 7,171 7,520 7,684
Energy Availability from Long Term Tie-ups (In %age) 108.93% 110.93% 106.47% 99.60%
Targeted Energy Availability from Long Term Tie-ups (In %age) 90.00% 90.00% 90.00% 90.00%
Targeted Energy Availability from Long Term Tie-ups (In MU) 5,325 5,818 6,357 6,943
Adequacy of Power Supply Adequate Adequate Adequate Adequate
Additional Energy Required on Long Term Basis (in MU) 0 0 0 0
Additional Long-term Tie-up Required (80% PLF) on RTC Basis (in MW) 0 0 0 0
Additional Energy Required on Short Term Basis (in MU) 0 0 0 31
It is seen from above table that the
availability from already tied-up long-term
share will remain in range of 100%-109% of
the energy requirement.
As Dadra and Nagar Haveli will be having
projected energy availability of more than
100% through long-term share in FY 19, the
UT has to just optimize the power purchase
and sale planning. The availability of excess
energy might be more in case more
industrial consumers opt for open access in
future.
It is also worth mentioning that the long-
term tie-ups consist of 609.57 MW from un-
allocated power of western region which
can’t be considered as reliable source in the
long run. Hence proper substitute of the
same should be searched. The breakup of the
power allocation from firm/ unallocated
/specific quota of power plants is given in
Table 31 in Annexure-2.
FUND REQUIREMENT
As all the UT allocations is from CGS, there is
no fund requirement for conventional
generation for UT. However, the fund
requirement for solar projects in UT is
summarized below:
Table 9: Fund Requirement for UT Generation Projects (in Rs Crores)
Sl. No. Category Fund Requirement (in Rs Crores)
FY 16 FY 17 FY 18 FY 19 Total
1 Own Solar Power Plant Kharadpada (22 MW) - 31.00 33.00 35.60 99.60
2 Solar Power Plant Velugam (3 MW) 18.77 5.00 - - 23.77
24X7 POWER FOR ALL (DADRA AND NAGAR HAVELI) 11

Sl. No. Category Fund Requirement (in Rs Crores)
FY 16 FY 17 FY 18 FY 19 Total
3 Solar Power Plant Athal (200 kW) 1.82 - - - 1.82
4 Solar Power Plant Rooftop (170 kW) 1.2 - - - 1.2
Total Fund Requirement (Generation) 21.79 36.00 33.00 35.60 126.39
However the same has not been considered for capex requirement in projected audited account
of DNHPDCL and the cost has been projected to be incurred as power-purchase cost in future
years as per Orders of JERC
ACTION POINTS FOR THE UT
OPTIMIZED POWER PURCHASE AND
SALE PLANNING
As seen from previous sections, there is
considerable surplus (0%-8%) available
with the UT. The UT needs to optimize its
power purchase and should look forward for
selling the surplus power to prospective
deficit states so as to earn revenue for the
UT. It is also expected that cost of power
procured from central generating stations
could increase in near future. Hence
DNHPDCL may go for Case-I bidding in order
to minimize its power procurement cost. If
successful in the endeavor it can also
surrender unallocated power assigned to it
from CGS
TIMELY COMPLETION OF PLANNED
SOLAR POWER PLANTS
The UT will need to commission solar power
plants based on PV technology timely to
ensure availability of power as planned. The
UT would also needs to select developer for
solar power plant timely using Case-I
bidding. Further timely completion of solar
plant by the chosen bidder should be
ensured by providing timely clearances and
infrastructure.
GOVERNMENT OF INDIA
INTERVENTION
UN-ALLOCATED SOURCE OF POWER
At Present 609 MW of power assigned to
DNH is from un-allocated quota. The same
forms more around 67% of present demand
of the UT and can create issues if the source
is allocated to other states/UT. The UT has
also apprehension that due to many
industrial consumers migrating to open
access route its demand will fall and
consequently this will lead to un-scheduling
of power from unallocated share. If this
scenario persists Government of India may
withdraw unallocated power assigned to the
UT. However if afterwards OA consumers
come back to DNHPDCL due to commercial
reasons, it will not have enough power to
cater to their needs. Hence Government of
India needs to take opinion of the UT before
committing any changes in un-
allocated/specific allocation of the UT.
24X7 POWER FOR ALL (DADRA AND NAGAR HAVELI) 12

CHAPTER 6: TRANSMISSION PLAN
POWER MAP OF DADRA AND NAGAR HAVELI
Figure 7: Power Transmission Map of Dadra and Nagar Haveli
EXISTING INTER-STATE
TRANSMISSION SYSTEM (ISTS)
Dadra and Nagar Haveli is getting power
from following PGCIL sub-stations situated
in Gujarat and DNH:
i. Vapi :400/220kV : 3x315MVA
ii. Kala: 400/220kV :2x315MVA
EXISTING INTRA STATE
TRANSMISSION SYSTEM
At present, there are 2 Nos of 220/66 KV
Sub-stations in UT with existing
transformation capacity available at 220 kV
for import from the western grid is 840 MVA
as give under-
Table 10: Existing Intra State Substations
(in MVA) The Vapi sub-station also feed neighboring
state of Gujarat and UT of Daman & Diu.
PLANNED INTER-STATE
TRANSMISSION SYSTEM (ISTS)
PGCIL has planned installation of additional
500 MVA Transformer in 400 kV Substation
at Kala. In addition Kala-Kudus section of
Vapi Kudus 400 kV Transmission line is to be
completed by FY 17.
Sl. No.
Name Voltage
Ratio (kV)
Transformation Capacity (In
MVA)
1 Kharadpada 220/66 520
2 Khadoli 220/66 320
Total Transformation Capacity (in MVA)
840
Recently an additional transformer of 160
MVA has been installed at Khadoli taking
total installed capacity at 1000 MVA.
Maximum import of power from western
24X7 POWER FOR ALL (DADRA AND NAGAR HAVELI) 13

-
grid is around 714 MW or 793 MVA and out
of which 139 MVA is consumed directly at
level of 220 kV, the available transmission
system is adequate to meet the power supply
requirement of Dadra and Nagar Haveli
during peak demand.
PLANNED INTRA STATE
TRANSMISSION SYSTEM (ISTS)
ED DNH-Transmission wing has planned
two new 220 kV sub-stations having
combined transformational capacity of 520
MVA to be connected to existing 220 kV
transmission lines by LILO arrangement. In
addition the department also has planned 27
Ckm of 220 kV D/C transmission line
emanating from 400 kV sub-station Kala to
Kharadpada.
The target date of commissioning of these
transmission lines and sub-stations is till FY
2016-17. The details are shown in below
tables:
Table 11: Planned Intra State Transmission
Sub-stations
Sl. No.
Name of the Project Total MVA
Target Date
1 220/66 kV S/s at Vaghchippa
320 Mar-17
2 220/66kV S/s at Sayli 200 Mar-17
Total: 220/132kV Transformers
520
Table 12: Planned Intra State Transmission Lines
Sl. No.
Name of the Project Ckt kms
Target Date
1 220 kV D/C from 400 kV Kala to 220 kV Kharadpada Sub-station
27 Mar-16
2 220 kV D/C from 400 kV Kala to 220 kV Khadoli Sub-station
6.2 Mar-16
3 LILO of Vapi-Khadoli line for proposed Vaghchhipa Sub-station
4.6 Mar-18
TOTAL 37.8
The peak demand of the UT is expected to
reach 1081 MW or 1201 MVA by FY 19.
Currently 139 MVA load is served at 220 kV
level. This load is projected to increase to
210 MVA by FY 10. Hence total peak load for
220 KV Sub-stations in FY 19 would be 990
MVA (1201-210). Expected capacity of 220
kV transformers in FY 19 is expected to
reach 1520 MVA. Hence the peak loading of
220 kV Sub-station would be 65.14% which
is within comfort zone.
INTRA-STATE LOAD FLOW STUDY
BY PGCIL
PGCIL has conducted load flow study for
Intra-state transmission system of Dadra
and Nagar Haveli. The study has shown that
most of transmission lines are loaded sub-
optimally at present, which leaves a scope
for accommodating future load growth.
However there are a few individual lines, for
example 220 KV transmission line feeding
Kharadpada which becomes overloaded at
time of peak loading. However it is expected
that with coming of two nos. new sub-
stations loading of this line will reduce by
2019. 66 kV sub-transmission lines feeding
66 kV sub-station at Athal, Masat and
Nakholi-1 also become over-loaded at time
of peak load. Distribution utility should
study the feasibility of increasing capacity of
said lines.
It has also been observed in the study that
voltage at 66 kV sub-stations fall to as low as
57 kV at time of overloading specially at sub-
stations located at end of sub-transmission
lines. To improve the same the utility will
have to strengthen existing transmission
lines and to install capacitor banks.
SYSTEM ANALYSIS UNDER PEAK
DEMAND OF 1081 MW IN FY 19
GENERAL
Results of load flow study will be required to
assess the adequacy of the power drawl by
the UT corresponding to FY 19 condition.
24X7 POWER FOR ALL (DADRA AND NAGAR HAVELI) 14

-
The fund requirement for UT projects is FUND REQUIREMENT summarized below:
Table 13: Fund Requirement for UT Transmission Projects (in Rs Crores)
Sl. No.
Category Fund Requirement (in Rs Crores)
FY 16 FY 17 FY 18 FY 19 Total
1 Intra UT - Transmission Lines 42.31 0.0 6.38 0.0 48.69
2 Intra UT - Substations 6.63 55.00 50.00 0.0 111.63
Total Fund Requirement (Transmission) 48.94 55.00 56.38 0.0 160.32
ACTION POINTS FOR THE UT
ED-Transmission is required to
complete all the proposed works within
the time limit.
To provide appropriate energy meters at
all interface points of the distribution
company of D&NH and compute the
monthly transmission loss based on the
energy input into the transmission grid
from various sources and the energy
outgo measured at interface points of the
DNHPDCL and EHT consumers.
The ED-Transmission is also required to
provide the transmission loss reduction
trajectory for the period FY 2016-17 to
FY 2018-19 (three years) based on the
actual transmission loss during FY 2015-
16.
ADOPTION OF BEST PRACTICES:
1. Monthly Thermal Vision with thermal camera to identify areas of preventive
maintenance.
2. Implementation of EMS system
3. New Sub stations to be GIS to save space.
24X7 POWER FOR ALL (DADRA AND NAGAR HAVELI) 15

CHAPTER 7: DISTRIBUTION PLAN
EXISTING DISTRIBUTION SYSTEM
The Electricity Department of UT of DNH has
been corporatized recently and DNHPDCL is
the only distribution licensee in the UT of
Dadra and Nagar Haveli. It is serving more
A snapshot of the existing distribution
system serving Dadra and Nagar Haveli is
given below.
Table 15: Existing Distribution System as on
March 2015
than 65,182 consumers of the UT and
providing 24 hours supply to all the
consumers in spite of hilly terrain and
difficult areas in the UT. Dadra and Nagar
Haveli is having a hilly terrain of which 75%
is covered by forest and the population also
consist of tribal populations (65%).
The category wise No of consumers and
energy being consumed during 2014-15 is as
under-
Table 14: Category-wise consumer number
and energy sales (MU)
S. No.
Category Number Energy Sales (MU)
1 Domestic 53.193 90.43
2 Commercial 6,986 27.05
3 Agriculture 1,179 4.31
4 LT Industries 2,001 187.51
5 HT Industries 887 4840.64
6 Public Lightening
310 7.76
7 Public water works
307 3.23
7 Temporary 319 2.60
Grand Total 65,182 5163.53
As it can be seen from above table majority
of sales is done to HT Industries. As per
Census 2011, there were about 2861 no of
un-electrified Households in the UT but it is
informed that DNHPDCL has provided
access to electricity to each household in the
UT. However, a small fraction of tribal
households may be there which have not
chosen to get electrified due to various
socio-economic reasons.
Particulars Qty.
Electricity Consumers 65,182
Connected Load 1389 MW
Peak Demand 714MW
Maximum Demand (66 kV & above)
408 MVA
Maximum Demand (11 kV Consumers)
435 MVA
66/11 KV Sub-stations 13 No.
Capacity of 66/11 KV Sub-stations
380 MVA
66KV Line 269 Km.
11 KV Line 831 Km.
LT Line 1775 Km.
11/0.4 KV DTR 1091 No.
Capacity of 11/0.4 KV DTR 219.54 MVA
The detail of existing 66/11 kV sub-stations
is given in Table 28 in Annexure-I.
INVESTMENTS PROPOSED FOR
URBAN AND RURAL
INFRASTRUCTURE
FOR URBAN INFRASTRUCTURE
The UT has now assessed the requirement of
strengthening of urban infrastructure and
accordingly proposed work amounting to Rs
180.03 Crores to be undertaken under the
new IPDS scheme which is summarized in
below table
Table 16: Work proposed for strengthening
of Urban Infrastructure
S. No.
Item Unit Quanti ty
Cost (Rs
Crores) 1 66/11 KV SS : New Nos. 1 8.14
66/11 KV SS : Additional Tr Nos. 1 2.70
24X7 POWER FOR ALL (DADRA AND NAGAR HAVELI) 16

S. No.
Item Unit Quanti ty
Cost (Rs
Crores) 66/11 KV SS : Capacity Enhancement
Nos. 3 5.78
2 66/11 KV SS : R&M Nos. 4 0.48
3 New 66 KV feeders- Bifurcation Km 3 3.77
66 KV feeders-Reconductoring/ Augmentation
Km 30 2.56
4 66 kV Bay extension Nos. 1 3.18
5 Distribution Transformer-New Nos. 231 47.34
6 Distribution Transformer-R&M Nos. 562 15.14
7 Capacitor Bank Nos. 5 2.12
8 Aerial Bunched Cables Km 24 1.74
9 Under-ground cables Km 231 69.91
10 Solar Panels with Net metering (in Government establishment)
KW 372 8.66
11 Metering Nos. 17886 16.21
12 RMU Sectionalizes Nos. 51 2.34
13 Others Nos. 507 5.07
Grand Total 180.03
FOR RURAL INFRASTRUCTURE
The expense to be incurred for DDUGJY
scheme is detailed in the below table:
Table 17: Work proposed for Rural
Infrastructure.
Item Total Amount
in Rs. Crores New 66 kV Sub-stations 30.97
66 kV Sub-stations Augmentation 58.75
11 kV Transmission Works 9.52
HT Capacitor Bank 2.7
Meter (Distribution Transformer, Consumers, Feeders)
1.68
Rural Household Electrification Works
25.05
Sansad Adarsh Gram Yojna 0.21
Grand Total 128.90
However Central government has only
approved project cost of Rs 5 Crore.
Component wise details of proposed
DDUGJY scheme is mentioned in Table 27 in
Annexure 1.
OTHER SCHEMES
DNHPDCL is also carrying out other schemes
to increase reliability of supply, reduce
losses and improve consumer service. The
details of works being under-taken by
DNHPCL are as follows:
Erection of various capacity of new
distribution transformer, extension of
HT/LT line work, releasing of new service
connection of all type of category under
Normal Development scheme
The following works are being taken up
under this Scheme:
Erection /Extension of HT Line Works
Erection /Extension of LT Line Works
Erection of Distribution Transformer
Centre
Release of Service Connections to
various categories of consumers.
System improvement works.
Strengthening of Electric lines
DNHPDCL has planned to incur Rs 3.0 Crore
on the scheme till FY 19.
Upgradation and modernization of
network
The scheme has been undertaken to upgrade
and modernize the present LT distribution
network of DNHPDCL to cater to the growing
energy demand of the UT of Dadra and Nagar
Haveli.
DNHPDCL plans to incur Rs. 11.00 Crore on
the scheme till FY 19.
Upgradation and Modernization of
existing 66/11 kV sub-station
The scheme is aimed to upgrade the existing
Amli, Khadoli and Masat sub-stations by
replacing circuit breakers, CTs and relays.
DNHPDCL would incur Rs 15 Crore till FY 19
on the scheme.
Installation of Capacitor Bank
DNHPDCL plans to install capacitor banks at
various sub-station to increase power factor
to ensure reduction in line losses. DNHPDCL
would incur Rs 5 Crore on the scheme till FY
19.
24X7 POWER FOR ALL (DADRA AND NAGAR HAVELI) 17

Procurement of fully automatic meter
test bench
As per the regulations of the JERC the meter
of the premises with connected load more
than 500 kVA needs to be tested twice every
year and the premises with connected load
less than 500 kVA needs to be tested once
every year. In order to comply the same,
DNHPDCL is in the process to procure fully
automatic meter test bench to meet the
growing need of meter testing in its
distribution area. DNHPDCL would incur Rs
3 Crore on the scheme till FY 19.
Table 18: Schemes undertaken by DNHPDCL.
S.N. Work Outlay (Rs Crore)
1 Normal Development Schemes 3
2 Upgradation and Modernization of network
11
3 66 kV Substations: Up-gradation and Modernization
15
4 Installation of Capacitor Bank 5
5 Procurement of fully automatic meter test bench
3
Total 37
ASSESSMENT OF ADEQUACY OF
DISTRIBUTION SYSTEM
AT 66/11 LEVEL
The transformation capacity at 66/11 kV
level is projected to grow from 712 MVA in
FY 15 to 952 MVA in FY 19.
The peak demand of the UT, including
demand of large industrial consumers at 220
kV and 66 kV level, has been recorded at 714
MW in FY 15.
The billed maximum demand of 2 nos. EHT
consumers is about 140 MVA and of 32 nos.
HT consumers at 66 kV is 268 MVA. Thus, the
peak demand of direct 66 kV and above
consumers works out to be 408 MVA or 367
MW (considering a power factor of 0.9).
Thus, a demand of 347 MW (=714-367) is
met at 11 kV and below which corresponds
to 386 MVA considering a power factor of
0.9.
Against this peak demand, the aggregate
installed capacity of 66/11 kV substations
available in the UT is 712 MVA. This
translates to an average loading of 54.19%
on 66/11 kV transformers under peak
demand conditions which is well within
comfort zone.
Following similar logic and taking the
projected peak demand of 1081 MW in FY 19
and assuming the proportion of demand met
at EHT and 66 kV in relation to the total peak
demand remains the same as at present, the
contribution of EHT and 66 kV direct
consumers to the peak demand of the UT
comes to 555 MW.
Correspondingly, the demand met at 11 kV
and below comes to 525 MW (1080-555)
which corresponds to 583 MVA considering
a power factor of 0.9. Against this peak
requirement, the installed capacity of 66/11
kV transformers in FY 19 is projected at 952
MVA. This translates to an average loading of
61.29% on 66/11 kV transformers under
peak demand conditions.
AT 11/.04 KV LEVEL
The transformation capacity at 11/0.44 kV
level is projected to grow from 219.53 MVA
in FY 15 to 293.78 MVA in FY 19.
The peak demand of the UT, including 367
MW demand of large industrial consumers at
220 kV and 66 kV level, has been recorded at
714 MW in FY 15. Thus, about 347 MW is
being met at 66 KV and below level.
At present maximum demand by consumers
at 11 kV level is about 265 MW thus, a
demand of 82 MW (=714-347-265) is met at
LT level which corresponds to 91 MVA
considering a power factor of 0.9.
Against this peak demand, the aggregate
installed capacity of distribution
24X7 POWER FOR ALL (DADRA AND NAGAR HAVELI) 18

transformer available in the UT is 219.53
MVA. This translates to an average loading of
41.27% on distribution transformers under
peak demand conditions which is well
within comfort zone.
Following similar logic and taking the
projected peak demand of 1081 MW in FY 19
and assuming the proportion of demand met
at HT/EHT in relation to the total peak
demand remains the same as at present, the
contribution of HT/EHT direct consumers to
the peak demand of the UT comes to 957
MW.
Correspondingly, the demand met at LT level
comes to 124MW (=1081-957) which
corresponds to 137 MVA considering a
power factor of 0.9. Against this peak
requirement, the installed capacity of
distribution transformers in FY 19 is
projected at 293.78 MVA. This translates to
an average loading of 46.67% on
distribution transformers under peak
demand conditions.
AT&C LOSSES
The actual and projected AT&C losses is
summarized below:
Figure 8: AT&C Losses over the years
The AT&C losses which were order of 7.50%
in FY 14 and have further decreased to
5.76% in FY 15. The low level of losses
indicate that they are primarily technical
losses with negligible commercial losses.
The same is only possible because of high
level of sale to industrial consumers (97%).
DNHPDCL has further aimed to reduce loss
by strengthening network under IPDS and
DDUGJY Schemes. Further steps like AMR
meters on Industrial consumers, laying of
ABC and underground cables have also been
implemented to reduce commercial losses.
RELIABILITY INDICES
As per JERC Standards of Performance (SoP)
Regulations, 2009 DNHPDCL has calculated
SAIFI for FY 15 as 36.41 translating to
average of every one sustained interruption
every 10 days. Further the SAIDI is
calculated to be 40 hours. This also translate
to wire availability of 99.39% at feeder level
which is better that reliability of 98% as
specified in JERC MYT Regulations.
DNHPDCL is required to maintain these
reliability indices in future also.
IT INITIATIVES TAKEN BY
DNHPDCL
Scheme for integrated solution for
Electrical network modelling and
distribution analysis software with allied
study of power sector in the territory
The objective of the scheme is undertaking
Consumer Indexing, GIS Mapping and Asset
Database Management System,
establishment of Customer Care Centres,
Meter Data Acquisition System and
Workflow Management, Document
Management, Business Intelligence etc.
DNHPDCL has to incur Rs 35 Crore on the
scheme till FY 19.
Scheme for Smart Grid in SMC Area of
Silvassa
The scheme will assist in implementing
Smart Grid technologies in Silvassa
Municipal Corporation (SMC) area to
address issues of energy efficiency and
24X7 POWER FOR ALL (DADRA AND NAGAR HAVELI) 19

AT&C losses and will also help in technology
upgradation of the distribution system of
DNHPDCL.
The project covers implementation of AMI,
DTMU, Integration of roof top solar through
net metering and Sub-station automation
system. The following areas can be improved
using Smart Grid technologies:
Online visualization of energy
consumption upto consumer level
Improvement in Billing Process including
correct recording of meters and timely
raising of bills
Continuous two way communication
facility between utility and consumers
and empowering consumers to
participate in Energy Management
Process
Monitoring of Outage & Quality of power
upto consumer level
Online information for utilization of
assets like distribution transformer, LT
lines etc.
Preventive maintenance of distribution
transformer
Control and monitoring of sub-station
equipment
Utilization of renewable resources
towards sustainability & green energy
benefits by net metering
DNHPDCL has to incur Rs 30 Crore on the
scheme till FY 19.
FUND REQUIREMENT
The fund requirement for UT projects is
summarized below:
Table 19: Fund Requirement for Distribution Projects (in Rs Crores)
Sl. No.
Category Fund Requirement (in Rs Crores)
FY 16 FY 17 FY 18 FY 19 Total
1 IPDS 45.01 45.01 45.01 45.01 180.03
2 DDUGJY 32.22 32.22 32.22 32.22 128.90
3 Other Schemes 16.00 9.00 6.00 6.00 37.00
4 IT Initiatives - 32.00 23.00 10.00 65.00
Total Distribution 103.23 118.23 106.23 93.23 410.93
ACTION POINTS FOR UT
DNHPDCL will do a survey regarding
unconnected households in UT and will
prepare plan to electrify them as per
trajectory specified in the report.
DNHPDCL will focus on energy efficiency
programs for Government Offices/
Institutions/ Panchayat / Municipal
Corporation and street lighting.
DNHPDCL will convene monthly public
grievance meetings with the consumers to
sort out issues related to the supply of
power/electricity/connections by the
Department.
DNHPDCL will ensure 100% metering.
Presently all consumers except 8% of Low
Income Domestic Consumers have been
provided metered supply. Proper steps
would be taken to convert remaining un-
metered consumers to metered consumers.
DNHPDCL will follow guaranteed standard
of performance to ensure reliable and
quality power supply.
24X7 POWER FOR ALL (DADRA AND NAGAR HAVELI) 20
DNHPDCL will improve the forecasting of
requirement of power especially by industry
to procure power at reasonable rate.
DNHPDCL will prepare a scheme to ensure
un-interrupted supply to industries and a
separate commercial mechanism.
DNHPDCL will prepare a road map for
reduction in Cross Subsidy between
industries and other category of consumers.
GOVERNMENT OF INDIA INTERVENTION
In order to ensure reliable and secure 24x7
quality power supply to all, the UT requests
that the investment sought under IPDS and
DDUGJY needs to be sanctioned expediently
by PFC/REC.
The Government of India is also requested to
consider the proposal for implementation of
Smart Grid in Dadra and Nagar Haveli.
The request of Government of Dadra and
Nagar Haveli would be considered by
Government of India as per its policies/
frameworks or otherwise Government of
Dadra and Nagar Haveli would make
arrangements for funding from other
sources.
24X7 POWER FOR ALL (DADRA AND NAGAR HAVELI) 21

CHAPTER 8: RENEWABLE ENERGY INITIATIVES
ACHIEVEMENTS IN RENEWABLE
ENERGY
DNHPDCL has recently commissioned 0.37
MW Solar Power Plant at various locations
in the UT including grid-connected rooftop
solar plant at starting of FY 15-16.
in units of RPO and at the forbearance price.
The defaulter shall also be liable for penalty
as may be decided by the Commission under
section 142 of the Act notwithstanding its
liability for any other action under
prevailing laws:
Table 20: Existing Status of RPO Compliance
RENEWABLE ENERGY POLICIES IN
THE UT
The UT has got the target to install 449 MW
Solar Capacity as a part of national goal
achieving 1 Lakh MW solar capacity by FY
22. Keeping in view small size of the UT, it
can have PPA with solar plants situated
outside the UT to achieve the target.
RPO AND REC STATUS IN DADRA
AND NAGAR HAVELI
RENEWABLE PURCHASE OBLIGATION
– CURRENT STATUS
Joint Electricity Regulatory Commission has
notified JERC (Procurement of Renewable
Energy) First Amendment Regulations, 2014
in which it has specified Solar and Non-Solar
Renewable Purchase Obligation for
distribution licensees at a defined minimum
percentage of the total consumption of all
the consumers in its area during a year.
!s per “JERC (Procurement of Renewable
Energy) Regulations, 2010" If the Obligated
Entity does not fulfill its commitment
towards Renewable Purchase Obligation
during any year as provided under JERC
Regulations, and also does not purchase
adequate certificate for meeting the
shortfalls, the Commission may direct the
Obligated Entity to deposit into a separate
RPO Fund such amount as the Commission
may determine on the basis of the shortfall
Particulars FY 12 FY 13 FY 14 FY 15
Compliance Requirement
Wind In %age
4232 4591 4960 5164
In MU 2.0% 3.0% 3.0% 3.3%
Other In %age
85 138 149 139
In MU 1.7% 2.6% 2.6% 2.7%
Solar In %age
72 120 129 31
In MU 0.3% 0.4% 0.4% 0.6%
Additionally there was 39 MU of RPO in FY
11. Against the RPO DNHPDCL has only
purchase REC certificate of 281MU (30
Solar) and 51.2 MU of renewable power.
There is cumulative gap of 61 MU of Solar
RPO and 185 MU of Non-Solar RPO. Due to
failure by DNHPDCL in meeting its RPO JERC
levied a fine of Rs 110 Crore as per
Regulation 4 of JERC (Procurement of
Renewable Energy) Regulations, 2010.
However later the same was revoked on the
condition that the licensee will meet its RPO
till FY 2014-15 latest on 09.02.2015.
As per National Tariff Policy, 2016 the UT
will have to procure 8% of its energy needs
from solar plants by March 2022. The same
translates to the UT to have 502 MW solar
power. Keeping in view small size of the UT,
it can have PPA with solar plants situated
outside the UT to achieve the target.
RENEWABLE ENERGY CERTIFICATES
JERC has designated Executive Engineer DNHPDCL as the State Agency for
24X7 POWER FOR ALL (DADRA AND NAGAR HAVELI) 22

accreditation and recommending the
renewable energy projects for registration
with Central Agency and to undertake
certain others functions as mention in the
Regulation 3 of JERC Procurement of
Renewable Energy Regulations 2010.
The Commission through sub clause 3.3 of
above said regulation has also provided the
responsibility to MNREDA for intimating
quarterly status of RPO compliance by the
distribution licensee to the Commission.
However as of now no renewable generator
has been accredited for REC certificate by
the Nodal agency.
PLAN FOR RENEWABLE ENERGY
ADDITION UP TO FY 19
PROPOSED ADDITION OF SOLAR
CAPACITY
DNHPDCL has planned to commission
additional 22 MW grid connected solar plant
Table 21: Proposed Capacity Addition
at cost of Rs 151 Crore at Kharadpada.
However out of 22 MW capacity only 10 MW
solar capacity would be commissioned till FY
19 at total capex of Rs 100 Crore.
SOLAR POWER PROCUREMENT FROM
JNNSM PROJECTS AND CASE-1
BIDDING
DNHPDCL has contracted 5 MW power from
JNNSM Solar Plants and has also floated bid
documents to procure 120 MU Solar Power
annually from 75 MW Solar PV Plants.
OFF-GRID RENEWABLE POWER
DNHPDCL plans to install 2 MW Off-Grid
Solar Power at various government
buildings till FY 18.
Accordingly, the proposed capacity addition
in Renewable Initiatives is summarized
below:
Sl. No.
Name of scheme Total
physical target
Year wise Physical Target
Existing FY 16 FY 17 FY 18 FY 19
1. Grid Connected Solar Plant
13.7 MW 0 MW 0.37 MW 3 MW 10.9 MW 0 MW
2
Off-Grid Rooftop Solar Plant at Government buildings
2 MW 0 MW 0 MW 0 MW 1 MW 1 MW
PROPOSED INVESTMENT IN RENEWABLE ENERGY
The proposed investment in additional renewable energy projects is shown below:
Table 22: Proposed Investment in New Renewable Projects (in Rs Crores)
Sl. No.
Name of scheme Total
project cost
Share FY 16 FY 17 FY 18 FY 19 Total
1 Off-Grid Rooftop Solar Plant at Government buildings
Central UT 0 8 8 0 16 Beneficiaries
24X7 POWER FOR ALL (DADRA AND NAGAR HAVELI) 23

CHAPTER 9: ENERGY CONSERVATION AND ENERGY
EFFICIENCY PROGRAM
PRESENT STATUS OF ENERGY
CONSERVATION ACTIVITIES
ACTIVITIES/SCHEMES INITIATED
UNDER ENERGY EFFECIENCY
SERVICES LTD.
DNHPDCL has implemented Domestic
Efficient Lighting Program (DELP) for LED
bulbs in the UT of DNH under Demand Side
Management (DSM) programme, a scheme
has prepared in consultation with EESL and
accorded JERC approval on the same. Key
features of the scheme will be to:
1. EESL will provide 2 LED bulbs each to all
domestic Consumers in the entire
Licensee area.
2. LED will be given at an upfront cost of Rs.
10 each. The balance cost towards the
actual price of the LED bulb will be
recovered from the consumer’s
electricity bill over a period of 10 months
subject to maximum of Rs. 10 for each
LED bulb every month.
3. The total annual savings of energy is
around 5.77 million kWh which, at the
average power purchase cost of Rs 3.66
per kWh, will lead to annual cost savings
of Rs. 2.11 Crore.
4. The implementation of DELP in its entire
area of operation would result into
reduction in power procurement cost of
Rs. 6.34 Crore over a period of three
years.
The total annual energy savings from the
above schemes would be 5.77 MU.
EESL’S N!TION!L LEVEL LED
PROGRAMME
Domestic Efficient Lighting Programme
(DELP): The service model enables
domestic households to procure LED lights
at an affordable price of Rs. 10 each and the
balance on easy instalment from their
electricity bill. DELP is under
implementation in AP, Delhi, Rajasthan, UP,
Himachal Pradesh, Maharashtra. EESL is
providing to consumers at a rate of Rs. 10
each as against their market price of Rs. 200-
350. The average cost saving per LED for a
domestic consumer is estimated between Rs.
160 – Rs. 400 (depending upon replacement
of CFL or ordinary bulb) based on 4 hour use
every day is more than the total cost of LED
bulb. The total cost charged to consumers by
EESL is Rs. 95-105 (based of applicable
VAT/Octroi in a state) and is less than the
savings of 1 year. The bulb will function for
at least 10-15 years and all savings after one
year is of the consumer. The cost of LED
bulbs and programme administration cost is
recovered from consumers by deduction of
easy instalments of Rs. 10 every month for 8-
12 months from their electricity bills. The
programme is delivering energy savings of
400 m kWh in Puducherry and AP as per the
online monitoring system installed by EESL.
So far more than 106 Lakh LED bulbs have
been distributed in 22 cities across India.
Street Light National Programme (SLNP):
EESL has evolved a service model to enable
Municipalities to replace conventional lights
with LEDs at no upfront cost. The balance
cost is recovered through the municipalities
by monetizing the energy savings. EESL has
24X7 POWER FOR ALL (DADRA AND NAGAR HAVELI) 24

implemented about 92,000 street light
retrofit project in Vizag this project will
reduce the energy consumption by 50%. The
entire upfront capital of Rs. 64 crore has
been invested by EESL and will be recovered
over a 7 year period. The municipality will
pay EESL a sum of Rs. 18.5 crore every year
whereas its overall costs savings would be
Rs. 31 crore annually. The actual energy
saving achieved 50% in electricity bill of
Greater Vizag Municipal Corporation
(GVMC) during January to April this year as
compared to same period last year. More
than 2.3 Lakh LED Street Lights have been
installed so far across India. Replacement
work of conventional Street light with LED
Street light is completed in 8 ULBs in
Rajasthan, Tripura, AP & installation work is
under progress in about 90 ULBs.
ACTION POINTS FOR UT
The UT will co-ordinate with BEE to conduct
a load research study with a view to improve
load factor and to reduce energy demand by
promoting energy efficiency. The UT has
97% Industrial Sales and hence
improvement brought by energy efficiency
in other categories would be negligible.
Hence major focus of the study would be
industrial load.
24X7 POWER FOR ALL (DADRA AND NAGAR HAVELI) 25

CHAPTER 10: FINANCIAL VIABILITY OF
DISTRIBUTION COMPANY
FINANCIAL POSITION OF
DISTRIBUTION UTILITIES
The existing accumulated profit for
Particulars FY 15 PBT (Post bad and doubtful debts) ₹ 67 Tax ₹ 24 Reported Net + Profit /- Loss ₹ 43 Transfer to Reserve + Dividend 1.76 Accumulated Profit ₹ 110
DNHPDCL (Surplus) as per the audited
financial accounts of FY 14 stands at Rs.
70.79 Crores, which has increased to 110.29
Crores in FY 15 (unaudited figures). .
The existing Profit and Loss statement of the
DNHPDCL for FY 15 is given below:
Table 23: Profit and Loss Statement of the
DNHPDCL – FY 15 (In Rs Crores)
Particulars FY 15
Opening Accumulated profit ₹ 70.79 Income Income from Sale of Power ₹ 2,297 Other Income ₹ 90.42 Total Income ₹ 2,388 Expenditure Transmission Charges ₹ 165 Power & Fuel Cost ₹ 2,110.83
Employee Cost ₹ 9.09 R&M cost ₹ 1.15 A&G Expenses ₹ 8.04 Total Expenses ₹ 2,294 Operating Profit ₹ 94 PBDIT ₹ 94 Interest ₹ 5 PBDT ₹ 89 Depreciation ₹ 14
Prior Period and Exceptional Items ₹ 2 Profit Before Tax ₹ 74 Provision for bad and doubtful debts ₹ 7
FUTURE COURSE
Power Purchase expense (including
transmission cost) constitutes Rs 2276
Crore out of total Rs 2294 Crore operational
expenditure and Rs 2345 Crore total
expenditure including interest,
depreciation, taxes and other items. Since
power purchase cost constitutes 97% of
total expense of the utility, therefore, if
future increase in power purchase
expenditure is allowed as pass-through in
tariff by JERC, the utility will be in a position
to repeat the financial performance it has
clocked in FY 15.
Capital Expenditure for proposed work
would also be incurred through budgetary
support of central government and the
utility already has cash (and equivalent) of
Rs 545 Crore. Hence the utility is also
comfortably placed in terms of cash flow for
financing future projects.
24X7 POWER FOR ALL (DADRA AND NAGAR HAVELI) 26
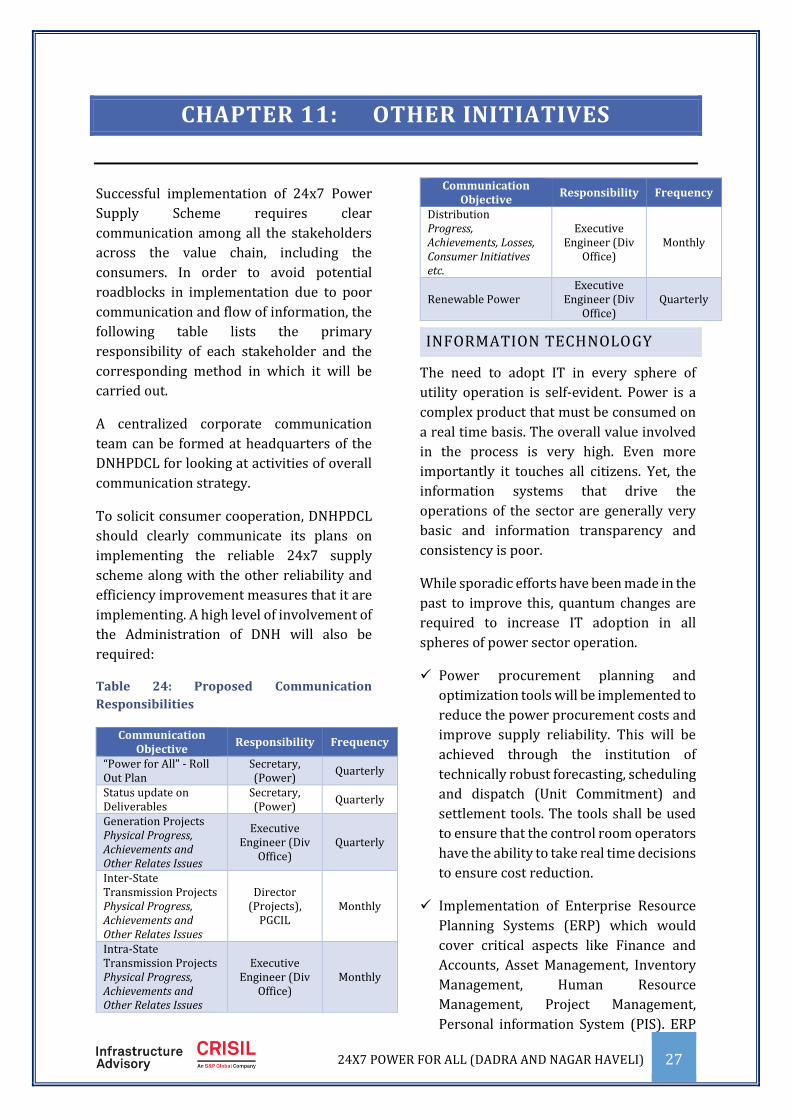
CHAPTER 11: OTHER INITIATIVES
Successful implementation of 24x7 Power
Supply Scheme requires clear
communication among all the stakeholders
across the value chain, including the
consumers. In order to avoid potential
roadblocks in implementation due to poor
communication and flow of information, the
following table lists the primary
responsibility of each stakeholder and the
corresponding method in which it will be
carried out.
A centralized corporate communication
team can be formed at headquarters of the
DNHPDCL for looking at activities of overall
communication strategy.
To solicit consumer cooperation, DNHPDCL
should clearly communicate its plans on
implementing the reliable 24x7 supply
scheme along with the other reliability and
efficiency improvement measures that it are
implementing. A high level of involvement of
the Administration of DNH will also be
required:
Table 24: Proposed Communication
Responsibilities
Communication Objective
Responsibility Frequency
“Power for !ll” - Roll Out Plan
Secretary, (Power)
Quarterly
Status update on Deliverables
Secretary, (Power)
Quarterly
Generation Projects Physical Progress, Achievements and Other Relates Issues
Executive Engineer (Div
Office) Quarterly
Inter-State Transmission Projects Physical Progress, Achievements and Other Relates Issues
Director (Projects),
PGCIL Monthly
Intra-State Transmission Projects Physical Progress, Achievements and Other Relates Issues
Executive Engineer (Div
Office) Monthly
Communication Objective
Responsibility Frequency
Distribution Progress, Executive Achievements, Losses, Engineer (Div Monthly Consumer Initiatives Office) etc.
Executive Renewable Power Engineer (Div Quarterly
Office)
INFORMATION TECHNOLOGY
The need to adopt IT in every sphere of
utility operation is self-evident. Power is a
complex product that must be consumed on
a real time basis. The overall value involved
in the process is very high. Even more
importantly it touches all citizens. Yet, the
information systems that drive the
operations of the sector are generally very
basic and information transparency and
consistency is poor.
While sporadic efforts have been made in the
past to improve this, quantum changes are
required to increase IT adoption in all
spheres of power sector operation.
Power procurement planning and
optimization tools will be implemented to
reduce the power procurement costs and
improve supply reliability. This will be
achieved through the institution of
technically robust forecasting, scheduling
and dispatch (Unit Commitment) and
settlement tools. The tools shall be used
to ensure that the control room operators
have the ability to take real time decisions
to ensure cost reduction.
Implementation of Enterprise Resource
Planning Systems (ERP) which would
cover critical aspects like Finance and
Accounts, Asset Management, Inventory
Management, Human Resource
Management, Project Management,
Personal information System (PIS). ERP
24X7 POWER FOR ALL (DADRA AND NAGAR HAVELI) 27
will help in timely capitalization of asset,
deriving better business value of
investment etc.
In order to curb the malpractices being
done at the level of meter readers while
entering the meter reading of the
consumers, “Mobile Based Photo Meter
Reading & Billing System” may be
adopted.
Centralized Information & Monitoring
System for operational, enforcement &
litigation, vigilance activities and analysis
have to be operationalized.
Power management would require tools
like SCADA and Distribution Management
Systems (DMS) that allow for adequate
visualization of the networks and
response capabilities. Technologies for
sub-station automation, GIS, SCADA,
DMS, OMS, etc., shall be adopted. For the
urban areas SCADA is very useful for
improving reliability and reduction of
network downtime.
Project monitoring tools shall be
incorporated in the PMU to ensure that
progress on the investments in the UT are
monitored rigorously and bottlenecks
identified.
Standards of service specified under
Section 57 of the Electricity Act 2003 will
be monitored. The utilities shall use IT
tools to gather the information with
regard to service standards with minimal
manual.
The above measures, need to be
implemented on priority basis by DNHPDCL
and also to be integrated with each other to
ensure that the systems are inter-operable
(i.e., they can talk to each other). For this the
utilities shall evolve a detailed IT plan to
implement the above in a well-coordinated
manner.
INSTITUTIONAL ARRANGEMENT
A strong monitoring framework is essential
to ensure the success of the “Power for All”
scheme. The following structure is being
proposed to undertake regular monitoring
of the progress of all initiatives being
undertaken in this scheme.
Government of India (GOI) Level
Committee: It is proposed that this
committee will review the overall
progress of the scheme on a quarterly
basis and provide necessary support to
ensure a coordinated response from the
Central Government - where necessary.
The committee may be constituted with
the following members – PFC, REC, CEA,
SECI, EESL, BEE, Ministry of Power,
MoEF and MNRE.
UT administration Level Committee:
It is proposed that a UT level committee
headed by the Secretary (Power) will be
formed to review the progress of the
scheme on a quarterly basis. This
committee will monitor the progress of
the works undertaken as part of the
scheme and issue directions to enable
faster execution.
Department Level Committee: It is
proposed that a Department level
committee headed by the Nodal Officer
will be formed which shall undertake
steps required to ensure the projects
are progressing as per the action plan.
This committee will undertake progress
reviews on a monthly basis.
District Level Committee – It is
proposed to constitute a district level
committee headed by the A.E. to take
action that is necessary to ensure the
projects are completed in a timely
manner and address any issues
pertaining to land or other relevant
approvals.
24X7 POWER FOR ALL (DADRA AND NAGAR HAVELI) 28

Project Monitoring Unit (PMU) – A
project monitoring unit shall be set up
for monitoring the progress of the
works being undertaken under this
scheme. The PMU will operate under the
Secretary, Power and shall be operated
by an external independent agency.
The PMU shall be responsible for
undertaking coordination, preparing the
action plans and monitoring progress of all
works under the “Power for all” scheme. The
PMU would also help facilitate in tracking
the action steps and providing feedback to
the various committee that are proposed to
be set up under the scheme. Government of
India shall provide grants for the PMU
operations.
The committees that are being proposed
above are required to be set up at the earliest
to kick start the whole scheme. It is
important that the committees keep meeting
on a regular basis as per the frequency/
timelines mentioned above – to ensure that
the objectives set out under the “Power for
all” scheme are achieved.
CAPACITY BUILDING
With the increase of IT applications in the
Transmission & Distribution system and to
meet the expectations of 24x7 power supply
for the consumers in the UT, it is important
to focus on capacity building of the
employees for enhancement of technical
know-how and keeping abreast with latest
technological developments. The capacity
building may also include consumer
grievance system, awareness regarding
importance of working with safety, outage
management system, demand side
management etc. It is also imperative that
for transforming the distribution utility into
a customer friendly one, change of mind-set
of the employees would be required. It is
critical that Change Management initiatives
are rolled out and institutionalized for
achieving better results.
In view of the importance of training on new
technologies, there is a requirement for
development and implementation of a well-
structured Human Resource Training
Programme to help realize the dream of
24x7 power supply system in the UT in its
true sense.
There is already a provision for Demand Side
Management (DMS) training under various
programmes of Bureau of energy Efficiency
(BEE) and the same should be implemented
to achieve the goal of 24 x 7 power.
A UT level officers training institute may be
required to be opened in the UT to fulfil the
ongoing training requirement for employees
of DNHPDCL. This also helps in training of
subordinate technical staff. Following
training programmes are proposed to be
implemented for the utility:
Two Weeks trainings for technical staff
including officers & engineers once in
every two years.
One week training for non-technical
officers every two years.
One week training for subordinate
technical staff at each district
headquarters every year.
24X7 POWER FOR ALL (DADRA AND NAGAR HAVELI) 29

CHAPTER 12: YEAR WISE ROLL OUT PLAN
SWOT ANALYSIS
In the above sections we have discussed in detail the existing status and its future needs. We have
also provided some actionable targets which will help Dadra and Nagar Haveli in achieving the
set goal. Before structuring the above targets, SWOT analysis of existing power sector in Dadra
and Nagar Haveli has been discussed. The exercise has been done to bring out some of the key
risk indicators which affect the overall market in Dadra and Nagar Haveli along with advantages
present.
Strengths
• Small Area • Low cost of power • Favorable mix of consumers (90%of Energy Sales to Industries) •Relatively Lower T&D and AT&C Losses •High level of electrification
Weaknesses
• High Cost of New Infrastructure • Lower growth in Industrial Demand
Opportunities
• Efficiency in revenue collection system • Underground Distribution system • Modernization of the utilities and infrastructure
Threats
• Dependent on power sources from outside •High Share of unallocated quota • Fate of Industries w.r.t. Industrial Policies/ Packages •Migration of Industrial consumers to open access
Dadra and Nagar Haveli Power Sector
From the above analysis it is quite evident that most of the threats are external factors which
would need continuous efforts from Dadra and Nagar Haveli to mitigate them as soon as possible.
Further, from the weaknesses tabulated it is seen that, with some strong and bold measures Dadra
and Nagar Haveli will be able to attain the target.
Based on the above observations, a road map for Dadra and Nagar Haveli has been developed to
mitigate the above weaknesses and threats.
24X7 POWER FOR ALL (DADRA AND NAGAR HAVELI) 30

ROAD MAP FOR POWER FOR ALL
Table 25: Roll Out Plan
Sl. No.
Category Base year scenario (FY 15)
Rollout Plan
FY 16 FY 17 FY 18 FY 19 Total
Total expected capacity
FY 19
GENERATION A Availability (MW):
1 Renewable 0.00 0.37 83.00 10.90 0.00 94.27 94.27
Solar 0.00 0.37 83.00 10.90 0.00 94.27 94.27
Central Sector
2 Thermal-Gas 178.10 0.00 0.00 0.00 0.00 0.00 178.10
3 Thermal-Coal 779.71 5.55 79.30 50.49 24.95 160.29 940.00
4 Nuclear 70.49 0.00 7.78 0.00 0.00 7.78 78.27
Total Availability (MW) 1028.30 5.92 170.08 61.39 24.95 262.34 1290.64
B Peak Demand (MW):
1 Peak Demand (MW) 714 777 848 927 1,013 1,013
2 Per Capita Consumption 5,304 5,916 6,464 7,063 7,715 7,715
TRANSMISSION
C Transmission Lines (CKM):
1 Inter State 77 0 175 0 0 175 252
400 kV 77 0 175 0 0 175 252
2 Intra State 59.44 33.2 0 4.6 0 37.8 97.24
220 kV 59.44 33.2 0 4.6 0 37.8 97.24
Total Transmission Line 136.44 33.2 175 4.6 0 212.8 349.24
D Transformation Capacity (MVA):
1 Inter State 630 0 0 500 0 500 1130
400/220 kV 630 0 0 500 0 500 1130
2 Intra State 840 160 0 520 0 680 1520
220/66 kV 840 160 0 520 0 680 1520
Total Transformation Capacity 1470 160 0 1020 0 1180 2650
DISTRIBUTION
E Efficiency Improvement
1 T&D Losses 4.78% 4.70% 4.70% 4.70% 4.70% 4.70%
2 AT&C Losses 5.76% 5.18% 4.94% 4.70% 4.70% 4.70%
F Capacity Addition/Augmentation
1 66 kV Substation (MVA Capacity)
712.00 0.00 20.00 20.00 200.00 240.00 952.00
2 66kV Lines (CKT Km.) 269.2 0 5 6 15 21 290.2
3 11 kV Lines (CKT Km.) 830.88 15 25 25 40 105 935.88
4 LT Lines (CKT Km.) 1775.22 20 20 20 50 110 1885.22
5 DTs (MVA Capacity) 219.54 0 22.71 24.62 26.92 74.24 293.78
RENEWABLE INITIATIVES
1 Solar PV at Government Building (MW)
0 0 0 1 1 2 2
24X7 POWER FOR ALL (DADRA AND NAGAR HAVELI) 31

CHAPTER 13: FUND REQUIREMENT
The fund requirement for various schemes (ongoing and proposed) for Generation, Transmission,
Distribution and Renewable energy plan as discussed in previous chapters is tabulated below:
Table 26: Fund Requirement
Sl. No. Category Fund Requirement (in Rs Crores)
FY 16 FY 17 FY 18 FY 19
Total
A Generation
1 Own Solar Power Plant Kharadpada (22 MW) - 31.00 33.00 35.60 99.60
2 Solar Power Plant Velugam (3 MW) 18.77 5.00 - - 23.77
3 Solar Power Plant Athal (200 kW) 1.82 - - - 1.82
4 Solar Power Plant Rooftop (170 kW) 1.2 - - - 1.2
Total Fund Requirement (Generation) 21.79 36.00 33.00 35.60 126.39
B Transmission
1 Intra State - Transmission Lines 42.31 0.0 6.38 0.0 48.69
2 Intra State - Substations 6.63 55.00 50.00 0.0 111.63
Total Fund Requirement (Transmission) 48.94 55.00 56.38 0.0 160.32
C Distribution
1 IPDS 45.01 45.01 45.01 45.01 180.03
2 DDUGJY 32.22 32.22 32.22 32.22 128.90
3 Other Schemes 16.00 9.00 6.00 6.00 37.00
4 IT Initiatives - 32.00 23.00 10.00 65.00
Total Fund Requirement (Distribution) 103.23 118.23 106.23 93.23 410.93
The request of Government of Dadra and Nagar Haveli for funds under IPDS and DDUGJY would
be considered by Government of India as per its policies/ frameworks or otherwise Government
of Dadra and Nagar Haveli would make arrangements for funding from FIs/Banks/Multilateral
funding agencies.
24X7 POWER FOR ALL (DADRA AND NAGAR HAVELI) 32

-
ANNEXURES
ANNEXURE – 1
Table 27: Work proposed Under DDUGVY scheme
Particulars Unit Qty Amount in Crores
A. Strengthening of Sub-Transmission and Distribution Network
66/11 KV SS :
New substation Nos. 3 30.79
Augmentation Enhancement 58.74
11 KV feeders
New Ckt. Kms. 9.52
Capacitor Bank MVArh 2.70
Metering
a) Feeder & Boundary (33Kv) Nos.
1.68
b) Feeder & Boundary (11Kv) Nos.
Distribution Transformer Nos.
Consumer Nos.
3-Phase Nos.
1-Phase Nos.
Sansad Adarsh Gram Yojna 1 0.21
Rural Household Electrification Works 25.06
Grand Total 128.90
Table 28: Details of existing 66/11 kV Sub-stations
Name of 66/11 kV Sub stations Transformers Capacity
(MVA) Wagdhara 1 x 20 MVA + 1 x 15 MVA 35
Dadra 1 x 10 MVA + 4 x20 MVA 90
Kharadpada 2 x 16 MA + 1 x 20 MVA. 52
Amli 3 x 15 MVA + 2 x 20 MVA 85
Athal 2 x 20 MVA 40
Mast 1 x 10 MVA +3 x 15 MVA + 1 x 20 MVA 75
Silli 2 x 15 MA + 1 x 20 MVA. 50
Rakholi 4 x 20 MVA. 80
Khadoli 3 x 10 MVA + 4 x 15 MVA 90
khanvel 1 x 10 MVA + 1 x 15 MVA 25
Piparia 2 x 20 MVA 40
Velugam 1 x 15 MVA 15
Kala 1 x 20 MVA + 1 x 15 MVA 35
Total 712
24X7 POWER FOR ALL (DADRA AND NAGAR HAVELI) 33
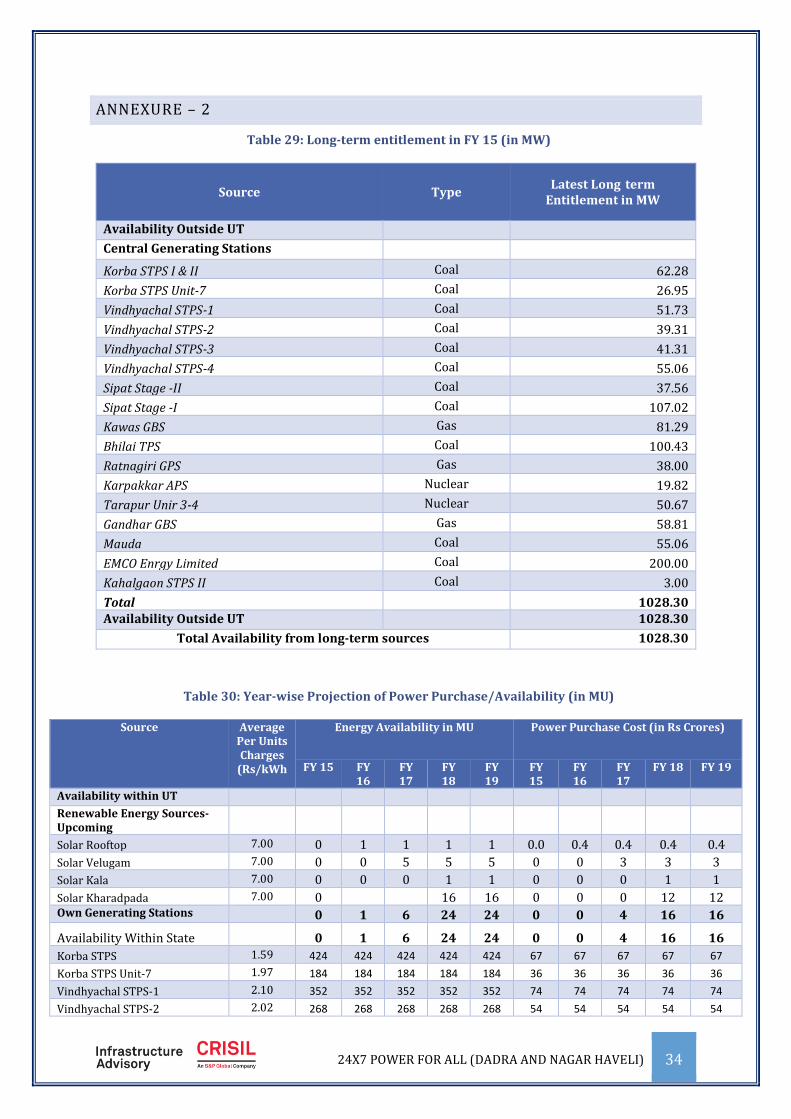
-
ANNEXURE – 2
Table 29: Long-term entitlement in FY 15 (in MW)
Source Type Latest Long term
Entitlement in MW
Availability Outside UT
Central Generating Stations
Korba STPS I & II Coal 62.28
Korba STPS Unit-7 Coal 26.95
Vindhyachal STPS-1 Coal 51.73
Vindhyachal STPS-2 Coal 39.31
Vindhyachal STPS-3 Coal 41.31
Vindhyachal STPS-4 Coal 55.06
Sipat Stage -II Coal 37.56
Sipat Stage -I Coal 107.02
Kawas GBS Gas 81.29
Bhilai TPS Coal 100.43
Ratnagiri GPS Gas 38.00
Karpakkar APS Nuclear 19.82
Tarapur Unir 3-4 Nuclear 50.67
Gandhar GBS Gas 58.81
Mauda Coal 55.06
EMCO Enrgy Limited Coal 200.00
Kahalgaon STPS II Coal 3.00
Total 1028.30 Availability Outside UT 1028.30
Total Availability from long-term sources 1028.30
Table 30: Year-wise Projection of Power Purchase/Availability (in MU)
Source Average Per Units Charges
(Rs/kWh
Energy Availability in MU
FY 15 FY 16
FY 17
FY 18
FY 19
Power Purchase Cost (in Rs Crores)
FY 15
FY 16
FY 17
FY 18 FY 19
Availability within UT
Renewable Energy Sources-Upcoming
Solar Rooftop 7.00 0 1 1 1 1 0.0 0.4 0.4 0.4 0.4
Solar Velugam 7.00 0 0 5 5 5 0 0 3 3 3
Solar Kala 7.00 0 0 0 1 1 0 0 0 1 1
Solar Kharadpada 7.00 0 16 16 0 0 0 12 12 Own Generating Stations 0 1 6 24 24 0 0 4 16 16
Availability Within State 0 1 6 24 24 0 0 4 16 16
Korba STPS 1.59 424 424 424 424 424 67 67 67 67 67
Korba STPS Unit-7 1.97 184 184 184 184 184 36 36 36 36 36
Vindhyachal STPS-1 2.10 352 352 352 352 352 74 74 74 74 74
Vindhyachal STPS-2 2.02 268 268 268 268 268 54 54 54 54 54
24X7 POWER FOR ALL (DADRA AND NAGAR HAVELI) 34

0 26 224 293 293 0 10 77 102 102
Source Average Per Units Charges
(Rs/kWh
Energy Availability in MU
FY 15 FY 16
FY 17
FY 18
FY 19
Power Purchase Cost (in Rs Crores)
FY 15
FY 16
FY 17
FY 18 FY 19
Vindhyachal STPS-3 2.43 281 281 281 281 281 68 68 68 68 68
Vindhyachal STPS-4 2.73 375 375 375 375 375 102 102 102 102 102
Sipat Stage -II 3.02 256 256 256 256 256 77 77 77 77 77
Sipat Stage -I 3.22 729 729 729 729 729 235 235 235 235 235
Kawas GBS 3.61 484 484 484 484 484 174 174 174 174 174
Bhilai TPS 3.72 684 684 684 684 684 254 254 254 254 254
Ratnagiri GPS 0 0 0 0 0 0 0.00 0.00 0.00 0.00
Karpakkar APS 2.31 143 143 143 143 143 33 33 33 33 33
Tarapur Unir 3-4 2.76 366 366 366 366 366 101 101 101 101 101
Gandhar GBS 4.42 350 350 350 350 350 155 155 155 155 155
Mauda 4.13 375 375 375 375 375 155 155 155 155 155
EMCO Enrgy Limited 4.30 1363 1363 1363 1363 1363 586 586 586 586 586
Kahalgaon STPS II 4.83 20 20 20 20 20 10 10 10 10 10
Central Generating Stations 6655 6655 6655 6655 6655 2183 2183 2183 2183 2183
CGS and RE - New
Vindhyachal STPS - 5 3.11 0 38 38 38 38 0 12 12 12 12
Solar JNNSM 7.00 0 0 8 8 8 0 0 6 6 6
Solar Bidding 7.00 0 0 124 124 124 0 0 87 87 87
LARA STPS 3.11 0 0 0 61 61 0 0 0 19 19
Gadawara 3.11 0 0 0 75 75 0 0 0 23 23
Dhruvan 3.11 0 0 0 170 170 0 0 0 53 53
Mouda STPP-2 3.11 0 0 100 100 100 0 0 31 31 31
Solapur 3.11 0 0 100 100 100 0 0 31 31 31
Khargaon 3.11 0 0 0 0 170 0 0 0 0 53
Barh 3.11 0 0 38 38 0 0 0 12 12
Karpakkar APS 3-4 2.31 0 0 56 56 56 0 0 13 13 13
NSPCL Rourkela 3.11 0 0 361 361 361 0 0 112 112 112
CGS - New
Availability Outside UT 1679 1706 1903 1973 1973 546 555 623 648 648 Less: Interstate Losses 60.45 61 69 71 71 Net Availability outside UT 1619 1644 1835 1902 1902 Total Availability from long-
term sources 1619 1651 1855 1929 1936 546 560 637 666 669
24X7 POWER FOR ALL (DADRA AND NAGAR HAVELI) 35

-
Table 31 Type of Allocation from Power Plants
Power Plant Total Allocation
(MW)
Firm Allocation
(MW)
Allocation from Un allocated quota (MW)
Specific Allocation
(MW)
Korba STPS 62.28 0.00 52.28 10.00
Korba STPS Unit-7 26.95 2.20 24.75 0.00
Vindhyachal STPS-1 51.73 5.00 46.73 0.00
Vindhyachal STPS-2 39.31 4.00 35.31 0.00
Vindhyachal STPS-3 41.31 6.00 35.31 0.00
Vindhyachal STPS-4 55.06 5.55 49.51 0.00
Sipat Stage -II 37.56 4.00 33.56 0.00
Sipat Stage -I 107.02 9.00 98.02 0.00
Kawas GBS 81.29 25.00 0.30 55.99
Bhilai TPS 100.43 100.43 0.00 0.00
Ratnagiri GPS 38.00 38.00 0.00 0.00
Karpakkar APS 19.82 2.00 17.82 0.00
Tarapur Unir 3-4 50.67 7.00 43.67 0.00
Gandhar GBS 58.81 2.00 0.35 56.46
Mauda 55.06 5.55 49.51 0.00
EMCO Enrgy Limited 200.00 200.00 0.00 0.00
Kahalgaon STPS II 3.00 3.00 0.00 0.00
Total 1028.30 418.73 487.12 122.45
24X7 POWER FOR ALL (DADRA AND NAGAR HAVELI) 36

24X7 POWER FOR ALL (DADRA AND NAGAR HAVELI) 37