
2.2 Australia region - Gold Fields long-hole sub-level stoping and others Waroonga: Long-hole...
52
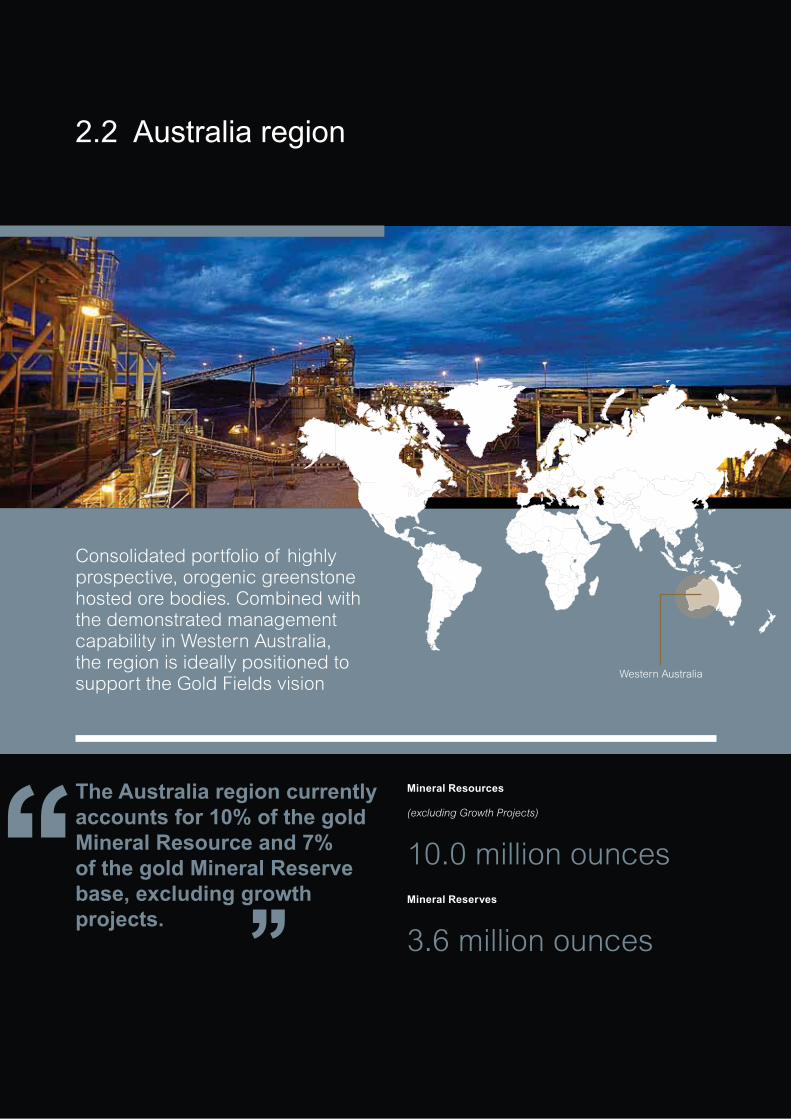
2.2 Australia region Western Australia Consolidated portfolio of highly prospective, orogenic greenstone hosted ore bodies. Combined with the demonstrated management capability in Western Australia, the region is ideally positioned to support the Gold Fields vision Mineral Resources (excluding Growth Projects) 10.0 million ounces Mineral Reserves 3.6 million ounces The Australia region currently accounts for 10% of the gold Mineral Resource and 7% of the gold Mineral Reserve base, excluding growth projects.
Transcript of 2.2 Australia region - Gold Fields long-hole sub-level stoping and others Waroonga: Long-hole...
The Gold Fields Mineral Resource and Mineral Reserve Supplement to the Integrated Annual Report 31 December 2014
2.2 Australia region
Western Australia
Consolidated portfolio of highly
prospective, orogenic greenstone
hosted ore bodies. Combined with
the demonstrated management
capability in Western Australia,
the region is ideally positioned to
support the Gold Fields vision
Mineral Resources
(excluding Growth Projects)
10.0 million ounces
Mineral Reserves
3.6 million ounces
The Australia region currently accounts for 10% of the gold Mineral Resource and 7% of the gold Mineral Reserve base, excluding growth projects.

REGIONS, OPERATIONS AND PROJECTS 35
The Gold Fields Mineral Resource and Mineral Reserve Supplement to the Integrated Annual Report 31 December 2014
Brownfield exploration momentum has been increased to realise
the discovery potential inherent across the region
Successful and rapid integration of the new Yilgarn South Assets
during 2014
The current Life-of-Mine’s (LoM’s) are based on the Proved and
Probable Mineral Reserves as at 31 December 2014. Historical
trends for these orogenic deposits show that with appropriate
investment for ongoing exploration, both new discovery and
resource extensions typically support a sustainable Mineral
Reserve and prolonged LoM.
OperationsAGNEW GOLD MINEMineral Resources
2.6 million ouncesMineral Reserves
0.9 million ouncesFBH represents the primary take-over mining front at Waroonga,
as the Kim lode advances to maturity
Increased Mineral Reserve ounces at FBH and proven high-grade
‘link’ between the Kim and FBH mineralised lodes
Continued positive exploration results at Waroonga North and the
Kath Projects
Positive results at Cinderella – situated approximately 300m from
New Holland development
Highly prospective areas targeted for resource growth contiguous
to the present mining at Waroonga and New Holland
LoM, based on current Mineral Reserves extends to 2019
(five years).
DARLOT GOLD MINEMineral Resources
0.3 million ouncesMineral Reserves
0.1 million ouncesImperative is to discover new Mineral Resources and convert to
Mineral Reserves to sustain mine production levels
Darlot continues to offer upside potential from the newly discovered
Centenary Depth Analogue (CDA) area
A reduction in bulk mining practice is delivering improvements in
ore recovery and dilution with improved head grade
Extensive portfolio of exploration targets to be tested
LoM based on current mineral reserves extend to mid-2016
(18 months)
WESTERN AUSTRALIA
Perth

The Gold Fields Mineral Resource and Mineral Reserve Supplement to the Integrated Annual Report 31 December 2014
REGIONS, OPERATIONS AND PROJECTS36
2.2 Australia region (continued)
PHILIPPINES
GRANNY SMITH GOLD MINEMineral Resources
3.7 million ouncesMineral Reserves
0.9 million ounces1.4 million ounce increase in Wallaby Underground Mineral Resource
Quality ore body with high grades and good continuity
Exploration drilling on Zones 130 – 150 has returned significant
intercepts that retain a very positive outlook for the Wallaby deposit
at depth
LoM based on current Mineral Reserves extend to 2019 (five years)
ST IVES GOLD MINEMineral Resources
3.5 million ouncesMineral Reserves
1.8 million ouncesInvesting in the next generation of mines with exploration focussed
at Invincible underground, Invincible trend and the recently acquired
Kambalda West tenements
Open-pit capital development has commenced on the newly
discovered high-grade Invincible deposit, with first production
planned during H1 2015. Invincible underground exploration
continues with maiden underground Mineral Reserve reported
Neptune open-pit stage 1 completed and evaluation of future stages
underway. Ongoing evaluation targeting the extensive palaeochannel
network with shallow high-grade positions and optionality for
bulk mining to be assessed
LoM based on current Mineral Reserves extend to 2020 (six years)
FAR SOUTHEAST (FSE) PROJECTMineral Resources
Au 19.8 million ounces
Cu 9,921 million poundsLarge copper-gold porphyry deposit in the Philippines
Various mining concept studies completed regarding mining
method, higher-grade extraction options and production rates
40% attributable to Gold Fields
WESTERN AUSTRALIA
Perth
Manila
REGIONS, OPERATIONS AND PROJECTS 37
The Gold Fields Mineral Resource and Mineral Reserve Supplement to the Integrated Annual Report 31 December 2014
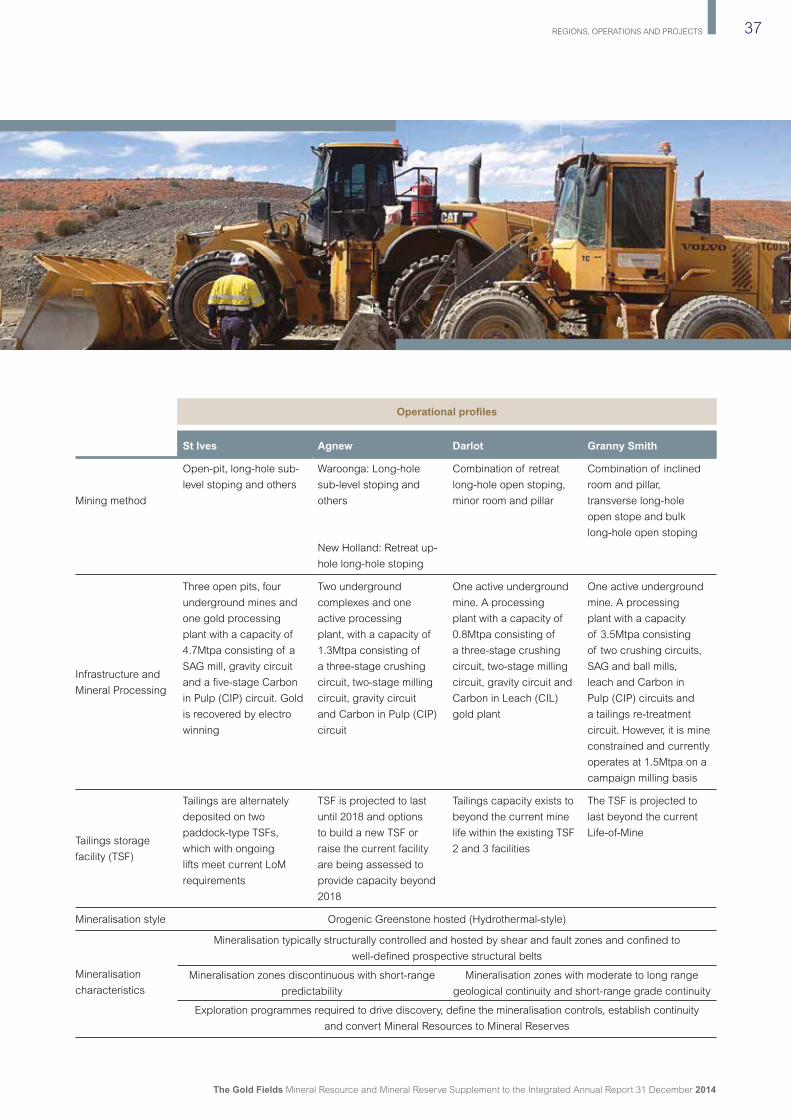
Operational pro les
St Ives Agnew Darlot Granny Smith
Mining method
Open-pit, long-hole sub-
level stoping and others
Waroonga: Long-hole
sub-level stoping and
others
Combination of retreat
long-hole open stoping,
minor room and pillar
Combination of inclined
room and pillar,
transverse long-hole
open stope and bulk
long-hole open stoping
New Holland: Retreat up-
hole long-hole stoping
Infrastructure and
Mineral Processing
Three open pits, four
underground mines and
one gold processing
plant with a capacity of
4.7Mtpa consisting of a
SAG mill, gravity circuit
and a five-stage Carbon
in Pulp (CIP) circuit. Gold
is recovered by electro
winning
Two underground
complexes and one
active processing
plant, with a capacity of
1.3Mtpa consisting of
a three-stage crushing
circuit, two-stage milling
circuit, gravity circuit
and Carbon in Pulp (CIP)
circuit
One active underground
mine. A processing
plant with a capacity of
0.8Mtpa consisting of
a three-stage crushing
circuit, two-stage milling
circuit, gravity circuit and
Carbon in Leach (CIL)
gold plant
One active underground
mine. A processing
plant with a capacity
of 3.5Mtpa consisting
of two crushing circuits,
SAG and ball mills,
leach and Carbon in
Pulp (CIP) circuits and
a tailings re-treatment
circuit. However, it is mine
constrained and currently
operates at 1.5Mtpa on a
campaign milling basis
Tailings storage
facility (TSF)
Tailings are alternately
deposited on two
paddock-type TSFs,
which with ongoing
lifts meet current LoM
requirements
TSF is projected to last
until 2018 and options
to build a new TSF or
raise the current facility
are being assessed to
provide capacity beyond
2018
Tailings capacity exists to
beyond the current mine
life within the existing TSF
2 and 3 facilities
The TSF is projected to
last beyond the current
Life-of-Mine
Mineralisation style Orogenic Greenstone hosted (Hydrothermal-style)
Mineralisation
characteristics
Mineralisation typically structurally controlled and hosted by shear and fault zones and confined to
well-defined prospective structural belts
Mineralisation zones discontinuous with short-range
predictability
Mineralisation zones with moderate to long range
geological continuity and short-range grade continuity
Exploration programmes required to drive discovery, define the mineralisation controls, establish continuity
and convert Mineral Resources to Mineral Reserves

The Gold Fields Mineral Resource and Mineral Reserve Supplement to the Integrated Annual Report 31 December 2014
REGIONS, OPERATIONS AND PROJECTS38
2.2 Australia region (continued)
Regional overview
Gold Fields’ mining assets in the Australia region
include a 100% interest in the St Ives, Agnew,
Darlot and Granny Smith mines in Western
Australia.
REGIONAL GEOLOGY
All four operations fall within the geological
region known as the Archaean Norseman-Wiluna
Greenstone Belt. This is part of the Yilgarn Craton
a 2.6Ga granite-greenstone terrain, which is well
endowed in gold and nickel mineralisation.
Much of the Yilgarn Craton is deeply weathered
and partially covered by Tertiary and Quaternary
regolith. Pre-Tertiary lateritic horizons are variably
exposed, stripped or buried by later deposits
that have in turn been lateritised. The depth of
weathering is strongly controlled by original rock
types, with mafic rocks generally being more
susceptible to weathering than felsic rocks.
Deposits are hosted within a diverse range
of rocks, including basalts and dolerites, fine
to coarse-grained sedimentary rocks, and
felsic to intermediate intrusions. Host rocks are
commonly metamorphosed to greenschist or lower
amphibolite facies. Gold mineralisation is typically
structurally controlled, occurring within a network
of shear zones proximal to major regional faults.
The most important gold mineralisation styles are
shear hosted quartz-carbonate bearing breccia
lodes and associated quartz vein arrays, together
with finely disseminated gold associated with
zones of strong hydrothermal alteration. Alteration
comprises silica or albite-rich zones, associated
with ankerite, sericite, biotite or amphibole,
together with pyrite, pyrrhotite or arsenopyrite as
sulphide bearing phases.
EXPLORATION DRILLING AND EXPENDITURE
Exploration activities in the region over the period
were dominated by resource conversion projects
through infill-drilling and extensions to existing
resources or upgrading known targets. Extensional
exploration activities are to be continued in 2015,
with several high-quality targets to be drill tested.
On-lease exploration metres drilled and
expenditure for the 12-month periods ending
31 December 2013 and 2014 are summarised
below. The region reflects a significant year-
on-year ramp up in exploration drilling to drive
discovery and build a solid project pipeline.
In accordance with the SAMREC 2007 Code,
the region maintains rigorous QA/QC protocols
on all its exploration programmes. It draws on
industry leading practice for data acquisition and
utilises accredited laboratories which are regularly
reviewed both internally and externally. Analytical
QA/QC is maintained and monitored through the
submission of blanks, certified reference material
and duplicates plus umpire laboratory checks.
December 2014 December 2013
Metres A$ US$ Metres A$ US$Exploration drilling drilled (millions) (millions) drilled (millions) (millions)
Operations
Agnew 56,137 15.11 13.60 20,212 4.40 4.23
Darlot 50,154 7.50 6.75 9,178 1.23 1.18
Granny Smith 77,433 13.04 11.74 20,455 2.59 2.49
St Ives 133,765 24.84 22.36 170,126 21.90 21.06
Total GFA 317,489 60.50 54.45 219,971 30.11 28.95
Average 2014 exchange rate: US$=A$1.1
December 2013 includes average quarterly cost for the Yilgarn South Assets in Q4
Exclusive of grade control drilling
Drilling unit costs are affected by the length, type (DD, RC, air core or sonic), ground conditions, rig and site availability, as well as whether drilling is from surface or underground.
Post the
Yilgarn
South
acquisition,
the
Australia
region now
contributes
45%
of Gold
Fields’ total
produced
ounces

REGIONS, OPERATIONS AND PROJECTS 39
The Gold Fields Mineral Resource and Mineral Reserve Supplement to the Integrated Annual Report 31 December 2014
Open-pit Mineral Resources comprise the material above
the nominated cut-off within a diluted optimised pit shell and
constrained to an optimised minimum mining width shape
Underground Mineral Resources comprise the material above
the nominated cut-off and constrained to a practical mining
shape and a minimum mining width.
MINERAL RESERVES
The Mineral Reserve estimates are based on appropriately
detailed and engineered LoM plans. All design and scheduling
work is undertaken to an appropriate level of detail by
experienced engineers using appropriate mine planning
software. The planning process incorporates appropriate
modifying factors and the use of cut-off grades and other
techno-economic investigations.
Mineral Resources and Mineral Reserves
MINERAL RESOURCES
The Mineral Resources declared within the Australia region are
classified as Measured, Indicated or Inferred, as described
in the SAMREC Code. Mineral Resource categories are
assigned with consideration given to geological complexity,
grade variance, drill hole intersection spacing, and mining
development. The following factors apply to the Mineral
Resources reported:
All Mineral Resources are declared using a cut-off grade
calculated for the individual deposit
Mineral Resources are further tested through the application
of realistic modifying factors to ensure that there is a
reasonable prospect of eventual economic extraction
Mineral Resources are quoted at an appropriate in situ
economic cut-off grade with tonnages and grades based
on the relevant resource block models. They also include
estimates of any material below the cut-off grade required
to be mined to extract the complete pay portion of the
Mineral Resource
AUSTRALIA REGION: SUMMARY MINERAL RESOURCE AND MINERAL RESERVE STATEMENT FOR OPERATIONAL MINES1
Mineral Resources (100%) Mineral Reserves (100%)
31 Dec 2014 Dec 13 31 Dec 2014 Dec 13
Tonnes Grade Gold Gold Tonnes Grade Gold Gold
Measured, Indicated and Inferred
(Mt) (g/t) (Moz) (Moz) Proved and Probable
(Mt) (g/t) (Moz) (Moz)
Australia operations Australia operations
Agnew 13.8 5.79 2.57 3.66 Agnew 3.6 7.44 0.87 0.95
Darlot 1.1 7.18 0.26 0.27 Darlot 0.4 7.36 0.09 0.15
Granny Smith 17.4 6.61 3.70 3.25 Granny Smith 4.5 6.02 0.87 0.84
St Ives 30.1 3.63 3.51 4.34 St Ives 17.8 3.14 1.80 2.02
Total Australia region
62.4 5.00 10.04 11.52 Total Australia region
26.3 4.28 3.63 3.97
1Managed, unless otherwise stated.
Mineral Resources are inclusive of Mineral Reserves.
All tonnes (t) relate to metric units and rounding-off of figures may result in minor computational discrepancies, where this happens, it is not deemed significant.

The Gold Fields Mineral Resource and Mineral Reserve Supplement to the Integrated Annual Report 31 December 2014
REGIONS, OPERATIONS AND PROJECTS40
2.2 Australia region (continued)
Social licence to operate
All operations in Gold Fields Australia have suitably resourced
departments responsible for Health, Safety, Environment, Risk,
Emergency and Security Management. The region subscribes
to a range of internationally recognised standards including
ISO 14001 for Environmental Management and OHSAS 18001 for
Health and Safety.
The Gold Fields Australia operations comply with the
requirements of the International Cyanide Management Code.
In 2014, Granny Smith achieved Cyanide Code re-certification,
ISO 14001 Certification and OHSAS 18001 Certification. During
2014 the Lawlers operations were amalgamated under the
Agnew certification through an expansion of the audit scope
by the certifying body. Darlot has achieved certification to the
OHSAS 18001 standard and re-certification for ISO 14001.
In terms of energy management, Gold Fields Australia had
undertaken a baseline review of the St Ives and Agnew assets
during 2012. Numerous action items were identified to improve
the energy efficiency of the operations. Ongoing review of
energy efficiency was conducted in 2014 geared towards
seeking further opportunities for improvement and to include
the newly acquired Yilgarn assets into the energy management
plan. Energy and carbon reduction targets were updated during
2014 in the case of St Ives, due to changes in the mine plan.
Agnew’s targets were also updated since its consolidation with
Lawlers and targets have been set for the Granny Smith and
Darlot Mines. All targets have been set till 2016.
Gold Fields has a well-established Enterprise-wide Risk
Management (ERM) system in place. This system requires
the formulation of risk registers for each operation, detailing
the most material business risks and the management actions
to mitigate these. During 2014, the requirements of the ERM
were implemented at the acquired Yilgarn assets through
the development of full risk registers for each site. These risk
registers have been integrated into CURA, the centralised Gold
Fields web-based risk management system. The risk registers
for all assets in Gold Fields Australia are reviewed quarterly.
Total Fatal Recordable CO2 Injury Injury Energy emissions Water Frequency Frequency consumption (000 tonnes) withdrawalSustainability factors Rate Rate (TJ) (scope 1 and 2) (million litres)
AgnewC2014 – 18.13 655 75.5 1,572C2013 – 21.881 426 49.9 803
DarlotC2014 – 13.17 262 33.0 542C2013 – na na na na
Granny SmithC2014 – 9.30 630 86.3 7,843C2013 – na na na na
St IvesC2014 – 22.39 1,738 186.5 9,571C2013 – 24.02 1,630 175.2 14,182
1 Excludes Lawlers data for Q4 2013.

REGIONS, OPERATIONS AND PROJECTS
The Gold Fields Mineral Resource and Mineral Reserve Supplement to the Integrated Annual Report 31 December 2014
41
www.goldfields.com
Agnew Gold Mine
Agnew has an intensified focus on defining new ore sources at New Holland and Waroonga in conjunction with targeted exploration
programmes testing an expanded area beyond current mining fronts, such as Waroonga North and the under-explored Cinderella
trend. The objective is to increase the Resource and Reserve base to sustain a robust five-year plan with an improved understanding
of the broader regional targets to discover the next generation mines. Development of the FBH area at Waroonga continues on plan to
compensate for Kim post-2016.
GENERAL LOCATION
Agnew is situated at latitude 27° 55’ S and longitude 120° 42’ E in the Norseman-Wiluna Greenstone Belt. It is located 23km west of
the town of Leinster in Western Australia, which is 375km north of Kalgoorlie and approximately 1,000km north-east of Perth. Well-
established power, access roads and supporting infrastructure are in place.
ASSET FUNDAMENTALS
LICENCE STATUS AND HOLDINGS
The Agnew Gold Mining Company Proprietary Limited (AGMC), ACN 098-385-883, was incorporated
in Australia in 2001 as the legal entity holding and conducting mining activity on the Agnew
mineral leases. The Gold Fields Limited Group holds 100% of the issued shares of AGMC through its
100% holding in the issued shares of Orogen Holding (BVI) Limited. Agnew controls exploration and
mineral rights over a total area of 69,269 hectares (total of granted tenements) and has security of
tenure for all current exploration and mining leases that contribute to future Mineral Reserves
OPERATIONAL INFRASTRUCTURE
Agnew currently operates two underground mines, Waroonga and New Holland. At Waroonga, ore
is sourced from the Kim and Main North lodes that are accessed via declines. New Holland mining
occurs in two primary areas – Genesis 500 and Sheba – that are accessed via declines. There are
also centralised administrative offices, engineering workshops at both Waroonga and New Holland
and one active CIP processing plant (1.3Mtpa capacity)
CLIMATE No extreme climate conditions are experienced that may affect mining operations
DEPOSIT TYPE
Orogenic greenstone gold deposits hosted in a number of different styles of lodes. Although all of
the Agnew deposits broadly occur at the intersections between structures and stratigraphy, there are
subtle differences in alteration and mineralisation, that are controlled in part by the local host rock
chemistry
LIFE-OF-MINE (LoM)Ongoing extensional and brownfields exploration continues, which could increase the LoM. It is
estimated that the current Mineral Reserves will be depleted in 2019 (five years)
ENVIRONMENTAL/ HEALTH AND SAFETY
Agnew continues to be certified to OHSAS 18001:2007 and ISO 14001:2004 Environmental
Management System. During 2014 the New Holland operations were amalgamated under these
certifications
Agnew was certified as compliant with the International Cyanide Management Code (ICMC) on
3 June 2009

The Gold Fields Mineral Resource and Mineral Reserve Supplement to the Integrated Annual Report 31 December 2014
REGIONS, OPERATIONS AND PROJECTS42
2.2 Australia region (continued)
Brief history of Agnew
Paddy Lawlers’ prospecting party discovered gold at Lamehorse
Soak in 1894, approximately 10km south of Agnew. The Great
Eastern and Donegal leases were pegged in the same year and
mining commenced. The discovery and subsequent mining of
the Waroonga, Glasgow Lass, New Holland and Cinderella areas
all commenced before 1899. East Murchison United commenced
the mining of nine underground levels at Main Lode in 1935 and
the mine was operational until 1948.
In 1976 Western Mining Corporation (WMC) purchased the
Waroonga leases and in 1984 Forsayth NL purchased the Great
Eastern leases and modern open-pit mining commenced at
both Waroonga (450 South) and Lawlers in the mid 1980s.
Additional discoveries at Redeemer (1985) Cox-Crusader (1987)
and Genesis (1990) ensured that both the Emu and Lawlers
mills operated at capacity while additional open-pit discoveries
at New Holland (1991) and Fairyland (1997) were made before
underground mining commenced at New Holland in 1998.
The Lawlers operation was purchased by Plutonic Resources
from Forsayth in 1992 and was subsequently acquired
by Homestake in 1998. During 2001, Barrick merged with
Homestake and Gold Fields acquired Agnew from WMC. The
Kim South lode at Waroonga was discovered in 2002, as was
Songvang OP, with production commencing in 2002 and 2004
respectively. Further discoveries were made at Fairyland UG
(2009) and Fitzroy, Bengal and Hastings (FBH) in 2012. Gold
Fields concluded the acquisition of the neighbouring Lawlers
Mine from Barrick in October 2013.
Key developments
Continued delineation of the high-grade ore shoots beneath
Main North – FBH reflects an improved Mineral Reserve of
348koz and Mineral Resource of 585koz in 2014.
Exploration drilling to the north of Kim lode has continued
to return positive results from the Kath and Waroonga North
projects, with initial resource models expected in 2015.
Drilling at Cinderella has confirmed the interpretation
and increased the size of two targeted lodes at depths of
approximately 80m and 140m.
Higher-grade shoots have been interpreted within the Main
North and Main South lodes during 2014.
Capital development to mine FBH commenced in late 2014
and is progressing on plan.

REGIONS, OPERATIONS AND PROJECTS 43
The Gold Fields Mineral Resource and Mineral Reserve Supplement to the Integrated Annual Report 31 December 2014
N
Map Grid of Australia Co-ordinate System
N
Map Grid of Australia Co-ordinate System
1
PLAN SHOWING AGNEW MINE INFRASTRUCTURE AS AT DECEMBER 2014
0
Map Grid of Australia Co-ordinate System
Kilometres
N
31 5
270000E
6915000N
6900000N
6885000N 6885000N
6900000N
6915000N
270000E
255000E
Leinster Townsite
GoldfieldsHighway
Agnew Sandstone Road
McCaffery
Pinnacles Road
Cams
Maria North Pit
Leinster Downs StationLeinster Airport
Maria South Pit
Genesis PitNew Holland Pit
Waroonga OfficeVivien Pit
FairylandLawlers
North Pit
Turet Pit Agnew Townsite
Emu OfficeWaroonga Pit
Emu Tailings Storage
Redeemer Office
Redeemer Pit
Crusader Pit
Songvang Pit
Emu Mill
Vivien PitVivien Pit
Old Agnew Road
Wee
boW
ildara
Roa
d
ReferenceRoads
Agnew mining Lease
Agnew Prospecting Licence
Agnew Exploration Licence
Open-pit
Waste Dump

The Gold Fields Mineral Resource and Mineral Reserve Supplement to the Integrated Annual Report 31 December 2014
REGIONS, OPERATIONS AND PROJECTS44
2.2 Australia region (continued)
OPERATING STATISTICS
Historic performance Agnew
Units C2014 C20131 C2012 C2011
Open-pit mining Total mined kt – – 262 1,612
– Waste mined kt – – 83 1,024
– Ore mined kt – – 179 588
Mined grade g/t – – 1.4 1.6
Strip ratio (tonnes) waste:ore – – 0.5 2.1
Underground mining Total mined kt 1,767 1,236 845 1,283
– Waste mined kt 573 506 222 662
– Ore mined kt 1,194 730 623 621
Mined grade g/t 7.2 9.1 8.5 9.7
Processing
Tonnes treated kt 1,246 974 943 935
Head grade g/t 7.1 7.5 6.1 7.0
Yield g/t 6.8 6.9 5.8 6.5
Plant recovery factor % 94.4 92.9 93.2 94.0
Total gold production koz 271 216 177 194
Financials
Exchange rate (annual average) USD: A$ 0.90 1.04
Operating cost A$/oz 708 647 808 691
Capital expenditure A$/oz 341 250 342 371
All-in Sustaining Cost (AISC)A$/oz 1,097 949 1,253 1,108
US$/oz 990 919 – –
Mineral Reserves
Mineral Reserves Mt 3.6 4.2 6.0 7.1
Mineral Reserves head grade g/t 7.44 7.05 5.96 5.70
Mineral Reserves Moz 0.87 0.95 1.15 1.30
1 Dec 2013 is inclusive of the New Holland Operation Q4 results only, Dec 2013 Mineral Reserves also inclusive of Lawlers
Rounding off of figures presented in this report may result in minor computational discrepancies. Where this occurs it is not deemed significant.

REGIONS, OPERATIONS AND PROJECTS 45
The Gold Fields Mineral Resource and Mineral Reserve Supplement to the Integrated Annual Report 31 December 2014
Agnew Gold Mine (continued)
Local geology
Agnew Gold Mine is situated in the northern portion of the
Norseman-Wiluna Greenstone Belt of the Yilgarn Craton,
Western Australia. Locally the Belt comprises a sequence
of mafic to ultramafic volcanics and associated interflow
sediments, which have been folded to form the Lawlers
Anticline. The Lawlers Anticline plunges in a northerly direction
at approximately 30°. The core of the anticline has been intruded
by granodiorite, which in turn has been intruded by late stage
leucogranite.
The mafic and ultramafic volcanics of the Lawlers Anticline are
unconformably overlain by a sequence of clastic sediments
comprising the Scotty Creek Formation. The sedimentary rocks
have been metamorphosed to lower greenschist facies and
comprise conglomerates and very fine- to very coarse-grained
pebbly sandstones and siltstones. The rocks within the AGMC
mining leases are dominantly covered by transported alluvium,
and minor residual soils, or by localised thick accumulations of
Permian sedimentary rocks blanketed by more recent clay and
sediments.
The Agnew deposits are broadly hosted by the intersections
between various structures and the relative stratigraphy. Gold
mineralisation largely occurs in quartz veins within the
sedimentary units of the Scotty Creek Formation.
EXPLORATION AND RESOURCE DEFINITION DRILLING
There is considerable endowment potential within the Agnew
tenement holdings and the greater land package cannot yet be
considered advanced in exploration terms.
Exploration in 2014 focussed on extensions to both the
Waroonga and New Holland mineralised systems and at
Cinderella, which is centrally located between the two mines.
At Waroonga, drilling delineated the ‘Link’ which comprises high-
grade mineralisation importantly bridging the Kim/Edmunds and
FBH lodes. Further drill testing north of Waroonga has continued
to return significant gold intersections with frequent visible gold
shows from both the Kath and Waroonga North projects. Early
stage resource models for both of these areas are expected
in early 2015, while mineralisation remains open at depth and
along strike.
At New Holland drilling focussed on extending the 500 Series
lode and also targeted the 600/700 Series, which is located
beneath the current mine development. Interpretation and
modelling of the results is continuing, but drilling has confirmed
the continuation of the 500 Series structure to the north, while
to the south several high-grade intervals have been returned
east of the 500 Series highlighting likely extensions east of the
current mine plan. New information provided by drill testing the
higher grade trends in the 200 Series is being modelled but the
potential for a significant new mining front appears limited.
Initial drilling of the Himitsu and extensional drilling of the
Cinderella targets was undertaken during late 2014. Himitsu is
located south of the New Holland mine and extends to Hidden
Secret. Drilling is targeting high-grade, flat westerly lodes similar
to the 500 Series, but at initial depths of approximately 200m
below surface. A number of mineralised intervals were observed
in some holes, with sulphide mineralisation and visible gold
also recorded. At Cinderella, a programme of RC drilling was
completed targeting extensions of the known lodes to the west
and south. Several high-grade intervals were returned and follow
up diamond core drilling has confirmed further extensions to two
lodes approximately 85m and 145m below surface and located
approximately 250m east of existing New Holland development.
No exploration was conducted in the extended regional areas at
Agnew in 2014.
Agnew maintains rigorous QA/QC protocols on all of its
exploration programmes. It draws on industry leading practice
for data acquisition and utilises accredited laboratories, which
are regularly reviewed, both internally and externally. Analytical
QA/QC is maintained and monitored through the submission of
sample blanks, certified reference material and duplicates, plus
umpire laboratory checks.
Mining
Current mining consists of the Waroonga and New Holland
underground complexes’, with the bulk of production presently
sourced from the high-grade Kim South lode and the high-grade
500 Series lode respectively. The Main North and Sheba lodes
provide valuable additional mining fronts; and combined, all four
areas form the basis of the 2015 Operational Plan.
MINING METHODS
Access to the Waroonga underground mine is via a decline with
the portal located in the previously mined Waroonga open-
pit. In 2014 the Waroonga mine produced from the Kim, Main
North and Rajah lodes. All primary infrastructures, including
escape ways and ventilation shafts, are located in the competent
sandstone of the hanging wall. The primary mining method at
Waroonga is long-hole sub-level stoping with paste fill.
Access to the New Holland underground mine is via declines
with portals located in the Genesis and New Holland open
pits. In 2014, the New Holland underground mine produced
from the Sheba, and 500 Series areas. The selection of the
stoping method is dependent upon the geometry of the ore
structure. The primary mining method employed at New Holland
is retreat up-hole long-hole mining.

The Gold Fields Mineral Resource and Mineral Reserve Supplement to the Integrated Annual Report 31 December 2014
REGIONS, OPERATIONS AND PROJECTS46
2.2 Australia region (continued)
MINE PLANNING AND SCHEDULING
The current mining areas situated at Waroonga include high-
grade ore from Kim South, supplemented with medium-grade
ore from Main North forming the basis for the 2015 Operational
Plan. At New Holland mining is planned to continue in the
500 Series and Sheba areas. The stope design takes practical
stope layouts and geometry into consideration, as well as
planning for mining losses in pillars or other parts of the
resource excluded for technical reasons. Dilution material
is included in the stope design. Ore losses can occur when
material cannot be practically extracted from the stopes.
LoM plans have been generated for these areas with the
necessary development, advance rates and sustaining capital to
maintain the planned production schedules and profiled grade
and tonnage.
Projects
In late 2014 capital development to access the FBH ore body
commenced. The capital programme to access FBH involves
access declines from the existing Kim infrastructure and
additional ventilation rises to provide ventilation to the FBH
mining areas.
A number of operational improvement projects were completed
at Agnew during 2014 and a dominant theme at both mines
was air quality and ventilation. At Waroonga, refrigerated air
was successfully incorporated into the ventilation system and
resulted in a significant drop in temperatures throughout the
mine. At New Holland, a new 4.5m diameter vent rise was
completed that extended from the 22 level to the surface,
approximately 490m in length. This project has reduced mine
temperatures and greatly improved ventilation, thereby allowing
mining to occur in a greater number of areas and improved
re-entry times after blasting.
Improvements to the current paste-fill backbone infrastructure at
Waroonga continue to be implemented with new holes designed
to bypass a large proportion of the old pipe infrastructure and
improve paste delivery at the bottom of the mine.
The operation continues to examine and review the possibility
of opportunistically exploiting small-scale open pitable deposits
for supplementary mill feed. Surface opportunities at Hidden
Secret, Cinderella, Zone 2, Claudius and Songvang continue to
be assessed.
Mineral Resources and Mineral Reserves
Geological and evaluation models have been updated as
at December 2014 to reflect the latest available data sets.
An integrated mine design and schedule, based on current
performance levels, takes cognisance of the inherent risks
associated with mining operations at Agnew.
MINERAL RESOURCES
The Mineral Resources are classified as Measured, Indicated
or Inferred, as described in the SAMREC Code 2007. Mineral
Resource categories are assigned with consideration given to
geological complexity, grade variance, drill hole intersection
spacing, and mining development. The impacts of year-on-year
changes are covered in the reconciliation section.
MINERAL RESOURCE CLASSIFICATION
Tonnes (000t) Grade (g/t) Gold (000 oz)
Classi cation Dec 14 Dec 13 Dec 12 Dec 14 Dec 13 Dec 12 Dec 14 Dec 13 Dec 12
Open-pit and underground
Measured 2,246 3,193 3,863 4.17 4.57 4.71 302 469 585
Indicated 8,655 11,059 11,983 6.43 6.02 4.86 1,789 2,139 1,873
Inferred 2,841 4,881 7,084 5.20 6.66 4.53 475 1,045 1,031
Total open-pit and underground 13,742 19,133 22,930 5.81 5.94 4.73 2,565 3,653 3,489
Surface
Measured stockpiles 56 62 223 2.62 1.81 1.55 5 4 11
Total surface 56 62 223 2.62 1.81 1.55 5 4 11
Grand total 13,798 19,196 23,153 5.79 5.92 4.70 2,570 3,657 3,501
Mineral Resources for 2012 – represent Agnew only as this was prior to the acquisition of Lawlers

REGIONS, OPERATIONS AND PROJECTS 47
The Gold Fields Mineral Resource and Mineral Reserve Supplement to the Integrated Annual Report 31 December 2014
Agnew Gold Mine (continued)
MINERAL RESOURCE CLASSIFICATION PER SOURCE AREA
Measured Indicated Inferred Total Mineral Resource
Tonnes Grade Gold Tonnes Grade Gold Tonnes Grade Gold Tonnes Grade GoldArea (000 t) (g/t) (000 oz) (000 t) (g/t) (000 oz) (000 t) (g/t) (000 oz) (000 t) (g/t) (000 oz)
Open-pit Miranda – Cams Pit – – – 262 4.50 38 – – – 262 4.50 38
Miranda – Maria Pit – – – 68 4.70 10 11 1.89 1 79 4.32 11
Waroonga – 450
South Pit 20 2.11 1 41 6.79 9 5 3.69 1 66 5.11 11
Waroonga – New
Woman Pit – – – 11 4.04 1 3 5.32 0.5 13 4.28 2
Waroonga –
Cinderella Pit – – – 228 3.34 25 12 2.13 1 240 3.29 25
Redeemer – North
Zone 2 Pit 74 3.50 8 60 3.33 6 – – – 134 3.41 15
Redeemer – South
Zone 2 Pit 28 2.27 2 93 3.40 10 51 3.45 6 172 3.23 18
Crusader –
Crusader Pits – – – 596 2.41 46 2 1.98 0.1 598 2.41 46
Songvang –
Songvang Pit
527 3.26 55 103 2.63 9 – – – 630 3.17 64
Total open-pit 650 3.22 67 1,463 3.29 155 83 3.10 8 2,196 3.26 230Underground
Waroonga – 450
South lode – – – 8 4.04 1 – – – 8 4.04 1
Waroonga – Kim
Lode 442 5.76 82 1,029 7.79 258 80 9.39 24 1,550 7.29 363
Waroonga – Rajah
lode 159 3.95 20 212 4.82 33 56 4.02 7 427 4.40 60
Waroonga – Main
Lode 979 4.11 130 1,117 6.28 226 259 5.99 50 2,355 5.35 405
Waroonga – FBH – – – 1,754 9.58 540 172 8.16 45 1,925 9.45 585
Waroonga –
Cinderella – – – 15 1.11 1 93 4.01 12 108 3.60 13
Redeemer – North
Zone 2 2 5.01 0.3 14 4.09 2 26 4.68 4 42 4.51 6
Redeemer – South
Zone 2 16 4.74 2 23 3.95 3 80 4.68 12 118 4.57 17
Crusader – Claudius – – – 400 6.42 83 3 5.69 1 403 6.43 83
GNH – 200 Series – – – 60 4.63 9 162 3.97 21 222 4.15 30
GNH – 500 Series – – – 529 6.78 115 25 5.16 4 554 6.72 120
GNH – Sheba – – – 601 5.89 114 657 5.86 124 1,258 5.88 238
GNH – Upper New
Holland – – – 427 5.16 71 836 4.36 117 1,263 4.64 188
GNH – Upper
Genesis – – – 402 5.85 76 180 5.24 30 582 5.67 106
GNH – New Holland/
Batavia – – – 316 5.93 60 114 3.68 14 430 5.34 74
GNH – NH126 – – – 288 5.81 44 13 3.94 2 301 4.76 46
Total underground 1,597 4.56 234 7,192 7.07 1,634 2,757 5.27 467 11,546 6.29 2,335Surface
Mill Stocks Agnew 56 2.62 5 – – – – – – 56 2.62 5
Total stockpiles 56 2.62 5 – – – – – – 56 2.62 5
Grand total 2,302 4.14 306 8,655 6.43 1,789 2,841 5.20 475 13,798 5.79 2,570

The Gold Fields Mineral Resource and Mineral Reserve Supplement to the Integrated Annual Report 31 December 2014
REGIONS, OPERATIONS AND PROJECTS48
2.2 Australia region (continued)
MODIFYING FACTORS
The Measured and Indicated Mineral Resources are inclusive of Mineral Reserves
Mineral Reserves are quoted in terms of Run of Mine (RoM) grades and tonnages as delivered to the metallurgical processing
facility and are therefore fully diluted
Mineral Reserve statement includes only Measured and Indicated Mineral Resources, modified to produce Mineral Reserves and
contained within the LoM plan
Mineral Resources and Mineral Reserves undergo regular internal and/or external audits, and any issues identified are rectified at
the earliest opportunity – usually during the current reporting cycle
December December December
Units 2014 2013 2012
Mineral Resource parameters
Mineral Resource gold priceUS$/oz 1,500 1,500 1,650
A$/oz 1,570 1,570 1,650
Exchange rate A$: US$ 1.05 1.05 1.00
Cut-off for underground g/t 2.77 – 4.75 3.31 – 4.34 1.6 – 3.7
Mineral Reserve parameters
Mineral Reserve gold priceUS$/oz 1,300 1,300 1,500
A$/oz 1,370 1,370 1,500
Exchange rate A$: US$ 1.05 1.05 1.00
Cut-off for fresh ore g/t 3.17 – 5.44 4.23 – 4.97 3.1 – 4.4
Mining recovery factor (underground) % 90-95 95 107
MCF % 100 100 100
Dilution underground % 10 10 26
Plant recovery factor % 94.9 96.0 94.5
Processing capacity Mtpa 1.3 1.3 1.3
Pre-2014 all figures are exclusive of Lawlers
GRADE TONNAGE CURVE
Grade tonnage curves for the underground and open-pit Mineral Resource.
Tonnes above cut-off
Average grade above cut-off
Cut-off grade (g/t)
Grade tonnage curve − Underground
0
2
4
6
8
10
12
14
16
20 1 3 4 5 6 7 8 9
Tonnes (
mill
ions)
Gra
de (g
/t)
0.0
2.0
4.0
6.0
8.0
10.0
12.0
14.0
16.0
18.0
Cut-off grade (g/t)
Grade tonnage curve − Surface
0
1
2
3
4
Tonnes (
mill
ions)
20 1 3 4 5 6 7 8 9
Tonnes above cut-off
Average grade above cut-off
Gra
de (g
/t)
0.0
2.0
4.0
6.0
8.0
10.0
12.0
14.0
16.0

REGIONS, OPERATIONS AND PROJECTS 49
The Gold Fields Mineral Resource and Mineral Reserve Supplement to the Integrated Annual Report 31 December 2014
Agnew Gold Mine (continued)
MINERAL RESERVES
The Mineral Reserve estimate for Agnew is based on an appropriately detailed and engineered LoM plan. All design and scheduling
work is undertaken to an appropriate level of detail by experienced engineers using appropriate mine planning software. The planning
process incorporates appropriate modifying factors and the use of cut-off grades and other techno-economic investigations.
The current Operational Plan reflects mining at both the Waroonga and New Holland Complex’s, with mining from the Kim South, Main
North, FBH, 500 Series and Sheba areas.
MINERAL RESERVE CLASSIFICATION
Tonnes (000t) Grade (g/t) Gold (000 oz)
Classi cation Dec 14 Dec 13 Dec 12 Dec 14 Dec 13 Dec 12 Dec 14 Dec 13 Dec 12
Open-pit and underground Proved 258 327 894 8.92 6.81 6.16 74 72 177
Probable 3,299 3,815 4,911 7.41 7.15 6.12 786 878 966
Total underground 3,556 4,142 5,805 7.52 7.13 6.12 860 949 1,143
Surface
Proved 56 62 222 2.62 1.80 1.54 5 4 11
Total surface 56 62 222 2.62 1.80 1.54 5 4 11
Grand total 3,612 4,204 6,027 7.44 7.05 5.96 865 953 1,154
Mineral Reserves for 2012 represent Agnew only as this was prior to the acquisition of Lawlers.
MINERAL RESERVE CLASSIFICATION PER MINING AREA
Proved Probable Total Mineral Reserve
Tonnes Grade Gold Tonnes Grade Gold Tonnes Grade GoldMining area (kt) (g/t) (koz) (kt) (g/t) (koz) (kt) (g/t) (koz)
Underground Waroonga – FBH – – – 1,193 9.08 348 1,193 9.08 348
Waroonga – Kim 206 9.68 64 753 7.48 181 959 7.95 245
Waroonga – Edmunds 10 9.85 3 294 6.21 59 303 6.33 62
Waroonga – Main – – – 146 6.59 31 146 6.59 31
Waroonga – Main South 13 4.66 2 345 6.20 69 358 6.14 71
Waroonga – Total 229 9.37 69 2,731 7.84 688 2,959 7.96 757
GNH – BA500 – – – 185 5.84 35 185 5.84 35
GNH – GI500 29 4.99 5 318 5.12 52 347 5.11 57
GNH – NH Upper – – – 16 6.79 4 16 6.79 4
GNH – NH 126 – – – 24 5.29 4 24 5.29 4
GNH – Sheba – – – 25 4.15 3 25 4.15 3
Genesis New Holland – Total 29 4.99 5 568 5.37 98 597 5.35 103
Total underground 258 8.88 74 3,299 7.41 786 3,556 7.52 860
Surface Agnew Surface Stockpiles 56 2.62 5 – – – 56 2.62 5
Total surface 56 2.62 5 – – – 56 2.62 5
Grand total 314 7.77 78 3,299 7.41 786 3,612 7.44 865

The Gold Fields Mineral Resource and Mineral Reserve Supplement to the Integrated Annual Report 31 December 2014
REGIONS, OPERATIONS AND PROJECTS50
2.2 Australia region (continued)
FACTORS THAT AFFECTED MINERAL RESOURCE RECONCILIATION
YEAR-ON-YEAR
FACTORS THAT AFFECTED MINERAL RESERVE RECONCILIATION
YEAR-ON-YEAR
Mined depletion
Increases in cut-off grade for Waroonga, Redeemer,
Crusader, Miranda and Songvang Complexes
Decrease in cut-off grade for New Holland Complex
Mineral Resources
Down grade of the Redeemer Deeps and Fairy
Land Mineral Resource to mineral inventory
Mineral Resource modelling – specifically the minimum
mining width applied for underground resources within
the Waroonga, Redeemer, Crusader, Miranda and
Songvang Complexes
Discovery (FBH)
Increase in cut-off grade for Kim, Edmunds, FBH and
Main lodes
Decrease in cut-off grade for all New Holland Complex
lodes
Mineral Resource modelling – changes to the Kim, FBH,
Edmunds, Main North and 500 Series interpretation
models
Discovery (FBH)
MINERAL RESERVE SENSITIVITY
To illustrate the impact of fluctuations in gold price and
exchange rates on the current declaration, Agnew, with the
incorporation of Lawlers has generated sensitivities with respect
to Mineral Reserves. The following graph indicates the Managed
Mineral Reserve sensitivity at -15% -10%, -5%, +5%, +10%,
+15% and +25% to the base (A$1,370) reserve gold price.
These sensitivities (other than for the base case) are not
supported by detailed plans and depletion schedules. They
should only be considered on an indicative basis; specifically as
such sensitivities assume 100% selectivity, without any operating
cost increases.
Mineral Resource Reconciliation (Gold − koz)
Dec 2
013
Min
ed
dep
letions
Econom
ic
facto
rs
Resourc
e
mod
elli
ng
Dec 2
014
Dis
covery
Inclu
sio
ns /
Exclu
sio
ns
0
500
1,000
1,500
2,000
2,500
3,000
3,500
4,000 3,656
(265)2,570
(64)
224
(313)
(668)
Mineral Reserve Reconciliation (Gold − koz)
Dec 2
013
Min
ed
dep
letions
Gold
price
Resourc
e
mod
elli
ng
Dec 2
014
Costs
Dis
covery
Inclu
sio
ns /
Exclu
sio
ns
0
200
400
600
800
1,000
1,200
953
(278)
865173
(19)
36
Base gold price (A$1,370/oz)
(15%) (10%) (5%) Base 5% 10% 15% 25%
Mineral Reserve Sensitivity (Gold − Moz)
0.0
0.2
0.4
0.6
0.8
1.0
1.2
Genesis PitNew Holland Pit
Batavia 500
200 Series
500 Series
600 Series
700 Series
Sheba
Cinderella
Hidden Secret Pit
North
1 400 RL
1 000 RL
600 RL
1 3500m N
1 2500m N
1 1500m N
1 0500m N
9 500NHimitsu
South
Schematic north-south cross-section through the New Holland/Genesis ore bodies and mine workings

REGIONS, OPERATIONS AND PROJECTS 51
The Gold Fields Mineral Resource and Mineral Reserve Supplement to the Integrated Annual Report 31 December 2014
Agnew Gold Mine (continued)
COMPETENT PERSONSInternal technical reviews have been conducted on the Agnew GM assets by the Competent Persons as listed, who are full-
time employees of Gold Fields Limited
Peter Johansen Mineral Resource ManagerBSc (Hons) Geology. AusIMM membership number 108674.
Industry experience: 26 years in exploration and mining in Australia and PNG. Commodities: gold, nickel, iron ore. Eight years
at Agnew.
Neil MorrissSenior Planning EngineerBEng (Hons) Mining Engineering. MAusIMM membership number 208320.
Industry experience: 11 years in mining in Australia. Commodities: gold, nickel, diamonds. One year at Agnew.
Robert UrieRegional Mining EngineerBEng (Hons) Mining Engineering. MAusIMM membership number 111309.
Industry experience: 19 years in mining in Australia. Commodities: gold, base metals, uranium. Four years at Agnew.
Paul FormanSenior Resource GeologistBSc (Geology), Postgrad (Mining). MAusIMM membership number 100163.
Industry experience: 31 years in mining in Australia. Commodities: gold, copper, iron ore, manganese, bauxite. Three years at
Agnew.
Jamie LoganResource GeologistBSc (Geology). GAIG membership number 5523.
Industry experience: six years in mining in Australia. Commodities: gold. Six years at Agnew.
Shaun HackettPrincipal Resource Geologist BSc Geology, MAusIMM membership number 211644.
Industry experience: 24 years in exploration and mining in Australia and globally. Commodities: gold, nickel, iron ore. Four
years’ experience with Agnew
Kath
Waroonga North
Kim South/ Edmunds
Link
Yeoman
Main South Deeps
450South
Rajah
Main North
MainSouth
FBH
Kath
Waroonga North
Kim South/ Edmunds
Link
Yeoman
Main South Deeps
450South
Main North
MainSouth
FBH
Rajah
41 0
00
40 5
00
40 0
00
39 5
00
39 0
00
9 000
9 500
10 000
10 500Schematic north-south
cross-section through the Waroonga ore bodies.

The Gold Fields Mineral Resource and Mineral Reserve Supplement to the Integrated Annual Report 31 December 2014
REGIONS, OPERATIONS AND PROJECTS52
2.2 Australia region (continued)
www.goldfields.com
Darlot Gold Mine
Darlot’s 2014 focus was on self-funding a meaningful exploration programme to replace production depletion and to extend the
LoM through discovery of a ‘game changer’ ore body capable of delivering a 15% free cash flow margin. An increased exploration
budget in 2014 of A$8m focussed on two prospective areas, Lords South Lower (LSL) and Centenary Depth Analogue (CDA) with
the objective of sourcing new quality mining fronts to deliver a franchise asset. Another year of mining in 2015 was defined at LSL,
creating the opportunity for an additional A$7m exploration spend in 2015.
Drilling at CDA has intersected a strongly mineralised sequence with similar characteristics to the previously mined Centenary deposit
showing potential for development of another significant resource. Additional near-mine targets include further extensions to LSL and
the CDA.
Darlot is mine-constrained and is currently targeting production of approximately 83koz in 2015. Success will be rooted in proving up
and converting inventory and exploration targets into Mineral Reserves, cost leadership and production efficiency to maximise value
through the plant.
GENERAL LOCATION
Darlot is located in the Eastern Goldfields Province of the Yilgarn Craton approximately 55km east of Leinster or 110km north of
Leonora and approximately 900km northeast of Perth in Western Australia. It sits at an elevation of 465m above sea level (amsl) and is
located at latitude 27°53’32” S and longitude 121°16’16” E.
ASSET FUNDAMENTALS
LICENCE STATUS AND HOLDINGS
The Darlot tenure consists of 27 mining leases and four prospecting licences. These tenements cover
an area of 11,358ha. Darlot is located on the Melrose Pastoral Lease in the Mount Malcolm District
of the Mount Margaret Mineral Field. The pastoral lease (243,000ha) on which the mine is located is
owned and managed by Gold Fields.
OPERATIONAL INFRASTRUCTURE AND MINERAL PROCESSING
Darlot is currently mining from two underground areas (Darlot and Centenary), accessed via
declines. In addition, there are centralised administrative offices, engineering workshops and one
CIP processing plant (~0.8Mtpa capacity).
CLIMATEThe climate is semi-arid, however, no extreme climate conditions are experienced that may affect
mining operations.
DEPOSIT TYPE
Orogenic greenstone gold deposits hosted in a number of different styles of lodes. Primarily all of
the Darlot deposits broadly occur at the intersections between structures and stratigraphy, however,
there are subtle differences in alteration and mineralisation that control the local disposition of metal
occurrence in thickness, continuity and mineralising texture.
LIFE-OF-MINE (LoM) Ongoing exploration could extend the Life-of-Mine, which currently extends to mid-2016 (18 months).
ENVIRONMENTAL/ HEALTH AND SAFETY
In October 2013 the Darlot mine was ISO 14001 accredited. Darlot is certified as fully compliant
to the International Cyanide Management Code (ICMC). In Q3 2014 Darlot was OHSAS 18001
accredited.

REGIONS, OPERATIONS AND PROJECTS
The Gold Fields Mineral Resource and Mineral Reserve Supplement to the Integrated Annual Report 31 December 2014
53
Continued exploration confirmed down-dip extensions to
the Darlot lodes. This work culminated with underground
development and mining of the Darlot lodes in October 1995.
During August 1996, a drill hole intersected a 33 metre section
grading 8.0g/t Au. This discovery drill hole for the Centenary
ore body was approximately 1.2km east of the Darlot open-pit.
Underground development to the Centenary ore body from the
Darlot workings was initiated during December 1996.
In May 1998, Homestake Mining Company acquired Plutonic
Resources Group and in June 2001 Barrick merged with
Homestake. In October 2013 Gold Fields acquired the Darlot
mine and tenement package from Barrick.
Key developments
Rapidly returned to solvency post the acquisition
Approximate 30% improvement in mined grade year-on-year
due to reduced dilution and more selective stoping to deliver
higher margin ounces
Maiden CDA Oval Inferred Resource reported
High-grade nuggety ore system that remains open-ended
Prospective and under-explored near mine and regional
tenement package
Exploration in 2014 focussed on replacing production depletion
and reserve growth to provide critical mass and flexibility
Confirmed presence of Centenary Depth Analogue, which
will be the key focus for exploration and resource definition
programmes in 2015
Brief history
Gold was first discovered in the Lake Darlot region in an alluvial
field in late 1894. Initial exploration and production focussed on
readily extractable gold from the alluvial deposits but production
from these areas is poorly documented.
The discovery of high-grade quartz vein hosted deposits and
the depletion of the alluvial fields changed the exploration focus
in the area. Mines at the time included King of the Hills, Saint
George, Monte Christo and Zangbar. These were all located
within the current Darlot tenement M37/155.
In 1935, a syndicate undertook limited drilling of the Zangbar
and Monte Christo quartz lodes. The high-grade lateritic gold
section of Monte Christo was mined by open-pit in the 1950s.
Modern exploration commenced in the Project area in the
late 1970s and focussed on a re-evaluation of historical
mining camps, as well as extensions and repetitions of known
mineralised veins. Interest in the area was renewed in the mid-
1980s. From 1986 to 1988 Sundowner Minerals NL undertook
an aggressive exploration programme around the Monte
Christo area and successfully delineated sufficient resources
to commence open cut mining at Monte Christo and Darlot
in 1988. Open cut mining continued until December 1995
and yielded approximately 400,000oz of gold. In the interim,
Plutonic Resources Group acquired Sundowner Minerals NL
in December 1992.

The Gold Fields Mineral Resource and Mineral Reserve Supplement to the Integrated Annual Report 31 December 2014
REGIONS, OPERATIONS AND PROJECTS54
ReferenceU/G Mines
Towns
Buildings
Offices
Roads
Darlot Mining Lease
Waste Dump
Open Pits Inactive
Stockpiles
Tailings/Leach Pad
N
0 1 2 3
Kilometres
Co-ordinate System: Map Grid of Australia Zone 51 (Geodetic Datum of Australia 1994)
PLAN SHOWING DARLOT MINE INFRASTRUCTURE AS AT 31 DECEMBER 2014
Darlot Pit
Darlot UG Offices
Darlot Mill
Darlot UG
Darlot Administration
Mine Village
Melrose Station
Road to Weebo(Darlot – Weebo Road)
6915000N
6925000N
6910000N6910000N
6915000N
6925000N
3250
00E
3300
00E
6920000N6920000N
3350
00E
3300
00E
3250
00E
3350
00E
Darlot Airstrip

REGIONS, OPERATIONS AND PROJECTS 55
The Gold Fields Mineral Resource and Mineral Reserve Supplement to the Integrated Annual Report 31 December 2014
Darlot Gold Mine (continued)
OPERATING STATISTICS
Historic performance
Units C2014 C2013 C2012 C2011
Underground mining
Total mined kt 695 876 876 963
– Waste mined kt 165 189 170 179
– Ore mined kt 530 687 706 784
Mined grade g/t 4.96 3.80 4.35 3.76
Processing
Tonnes treated kt 525 746 853 769
Head grade g/t 5.12 3.54 4.09 3.76
Yield g/t 4.96 3.28 3.82 3.48
Plant recovery factor % 95.2 92.6 93.5 92.5
Total gold production koz 83.6 79.8 105 86
Financials
Exchange rate (annual average) USD:A$ 0.90 1.03 0.97 0.97
Operating cost A$/oz 1,085 1,132 997 1,202
Capital expenditure A$/oz 195 81 220 403
All-in Cost (AIC) A$/oz 1,353 1,132
All-in Sustaining Cost (AISC)A$/oz 1,353 1,169 1,345 1,611
US$/oz 1,222 1,132
Mineral Reserves
Mineral Reserves Mt 0.4 1.0 2.4
Mineral Reserves head grade g/t 7.36 5.07 4.35 3.76
Mineral Reserves Moz 0.10 0.16 0.43 0.43
Rounding off of figures presented in this report may result in minor computational discrepancies. Where this occurs it is not deemed significant.
December 2013 production figures are inclusive of Gold Fields (Q4) and Barrick (Q1 – Q3), while the unit costs are only Q4.

The Gold Fields Mineral Resource and Mineral Reserve Supplement to the Integrated Annual Report 31 December 2014
REGIONS, OPERATIONS AND PROJECTS56
2.2 Australia region (continued)
Local geology
Darlot Mine is located within the Eastern Goldfields Province
of the Archean-aged Yilgarn Craton in Western Australia. The
Darlot-Centenary deposit is located within the Mount Margaret
Mineral Field which lies at the southern end of the Yandal
Greenstone Belt.
Gold mineralisation at Darlot Mine is associated with quartz veins
and alteration halos controlled by major structures or secondary
splays and cross-linking structures. The Darlot deposit has been
differentiated into two separate entities, namely the Darlot lodes
and Centenary ore body. The Centenary ore body is located
some 1.2km east of the Darlot open-pit and down dip from the
Darlot lode extensions.
In the Darlot lodes, gold mineralisation occurs within and around
quartz laminar and sheeted quartz veins in local dilation zones
along the Darlot thrust, in addition to sub-horizontal extensional
quartz veins in felsic volcanic and intrusive rocks above the
thrust.
The Centenary ore body has been defined from approximately
150m to 700m below surface. Gold mineralisation occurs within
sub-horizontal to 20° westerly dipping stacked quartz veins
bounded to the west by the oval fault and to the east by the
Lords fault. These reverse faults are marked by banded quartz
veins dipping 50° to the west.
EXPLORATION AND RESOURCE DEFINITION DRILLING
There is considerable endowment potential within the
current tenement holdings to add significantly to the Mineral
Resources and Mineral Reserves, through a combination of
in-mine resource extensions to known positions and near-mine
exploration. In terms of the extent of its tenement holdings
and the exploration undertaken thus far, Darlot cannot yet be
considered advanced in exploration terms due to the relatively
shallow drilling undertaken outside of the present mine footprint.
Recent drilling and geological studies continue to highlight
the potential of the Darlot area to deliver new high-grade ore
sources in close proximity to existing mine infrastructure.
Mine exploration for the 12 months to December 2014 focussed
on in-mine resource definition and near-mine targeting of
geophysical and geochemical anomalies. A key target for
2014, the Centenary Depth analogue (CDA), was successfully
intersected in a number of holes drilled from surface and will be
the focus of underground resource definition drilling in 2015.
Mining
The 2015 mine plan is focussed on the underground Darlot and
Centenary ore systems, as well as setting up access and take off
points for the Centenary Depth Analogue (CDA) area.
MINING METHODS
Mining is via a combination of long-hole open stoping, room and
pillar and narrow vein long-hole stoping. All mining is accessed
via two declines from the base of the Darlot open-pit. Paste fill is
utilised to backfill open stopes allowing maximum extraction of
the lode system.
MINE PLANNING AND SCHEDULING
The 2015 Operational Plan is dominated by underground mining
from the Centenary lode and accessing the new Lords South
Lower mining area. The mine schedule is sequenced in detail
and typically has only two stoping fronts open at any one time.
At Darlot, the stope design takes practical stope layouts into
consideration, as well as planning for mining losses in pillars
or other parts of the resource excluded for technical reasons.
Dilution material is included in the stope design. Ore losses
can occur when material cannot be practically extracted from
the stopes. Stope shapes were assessed using updated cut-
off grades.
A ground management plan is in place together with a
monitoring system to manage seismicity and potential
improvements to the production sequencing to further
mitigate risk.
Projects
A number of business improvement projects continue with the
primary aim of improving operational results through driving
greater efficiencies, reducing costs and increasing mine
flexibility.
The operation continues to examine and review the possibility of
opportunistic exploitation of small-scale open pittable deposits
with-low strip ratios for supplementary mill feed. In this regard
smaller open-pit opportunities continue to be assessed for
shallow oxide and supergene ore that could be brought into
production quickly and at minimal operating cost.
Future exploration will focus within and immediately around
the Darlot mine area. The objective is to define and bring into
production additional high-grade ore sources from the CDA.

REGIONS, OPERATIONS AND PROJECTS 57
The Gold Fields Mineral Resource and Mineral Reserve Supplement to the Integrated Annual Report 31 December 2014
Darlot Gold Mine (continued)
Mineral Resources and Mineral Reserves
The Mineral Resources and Mineral Reserves have been
updated using the current Gold Fields planning gold
price of US$1,500/oz and US$1,300/oz respectively and
reported in accordance with the SAMREC Code. The
December 2014 Mineral Resources have been stated inclusive
of Mineral Reserves.
MINERAL RESOURCES
The Mineral Resources are classified as Measured, Indicated
or Inferred. Mineral Resource categories are assigned with
consideration given to geological complexity, grade variance,
drill hole intersection spacing, and mining development.
The impacts of year-on-year changes are covered in the
reconciliation section.
MINERAL RESOURCE CLASSIFICATION
Tonnes (000t) Grade (g/t) Gold (000 oz)
Classi cation Dec 14 Dec 13 Dec 14 Dec 13 Dec 14 Dec 13
Underground
Measured 18 563 9.42 5.12 6 93
Indicated 773 863 7.37 5.38 183 149
Inferred 348 175 6.61 5.07 74 29
Total underground 1,140 1,601 7.17 5.26 263 271
Surface
Total surface – – – – – –
Grand total 1,140 1,601 7.17 5.26 263 271
Pre-2013, Mineral Resources are not shown as this was prior to the acquisition of Darlot.
MINERAL RESOURCE PER MINING AREA
Measured Indicated Inferred Total Mineral Resource
Tonnes Grade Gold Tonnes Grade Gold Tonnes Grade Gold Tonnes Grade GoldArea (000 t) (g/t) (000 oz) (000 t) (g/t) (000 oz) (000 t) (g/t) (000 oz) (000 t) (g/t) (000 oz)
Centenary 18 9.42 6 474 6.87 104 217 6.28 44 709 6.76 154
Lords South Lower – – – 253 8.24 67 76 5.82 14 329 7.68 81
CDA Oval – – – – – – 38 10.89 13 38 10.89 13
Darlot – – – 46 7.66 11 18 4.86 3 64 6.88 14
Total Darlot UG 18 9.42 6 773 7.37 183 348 6.61 74 1,140 7.17 263Surface
Surface stockpiles – – – – – – – – – – – –
Grand total 18 9.42 6 773 7.37 183 348 6.61 74 1,140 7.17 263

The Gold Fields Mineral Resource and Mineral Reserve Supplement to the Integrated Annual Report 31 December 2014
REGIONS, OPERATIONS AND PROJECTS58
2.2 Australia region (continued)
MODIFYING FACTORS
The declared Mineral Resources for December 2014 are
inclusive of Mineral Reserves
Mineral Reserves are quoted in terms of RoM grades and
tonnages as delivered to the metallurgical processing facility
and are therefore fully diluted
The Mineral Reserve statement includes only Measured and
Indicated Mineral Resources, modified to produce Mineral
Reserves and contained within the LoM plan
Mineral Resources and Mineral Reserves undergo regular
internal and/or external audits, and any issues identified are
rectified at the earliest opportunity – usually during the current
reporting cycle
Units December 2014 December 2013*
Mineral Resource parameters
Mineral Resource gold priceUS$/oz 1,500 1,500
A$/oz 1,570 1,429
Exchange rate A$: US$ 1.05 1.05
Cut-off for mill feed g/t 1.00 1.00
Cut-off for underground g/t 3.7 3.56
Mineral Reserve parameters
Mineral Reserve gold price*US$/oz 1,300 1,350
A$/oz 1,370 1,350
Exchange rate A$: US$ 1.05 1.00
Cut-off for fresh ore g/t 1.9 1.68
Cut-off for mill feed underground g/t 4.3 3.76
Mining recovery factor (underground) % 90 95
MCF % 100 100
Dilution underground % 15 10
Plant recovery factor % 95.5 95.5
Processing capacity Mtpa 0.8 0.8
* Barrick used variable exchange rates for Mineral Resources and Mineral Reserves.
GRADE TONNAGE CURVE
Grade tonnage curves for the underground and open-pit Mineral Resource.
Tonnes above cut-off
Average grade above cut-off
Tonnes (
mill
ions)
Gra
de (g
/t)
Cut-off grade (g/t)
Grade tonnage curve − Underground
0.0
2.0
4.0
6.0
8.0
10.0
12.0
14.0
16.0
18.0
20 1 3 4 5 6 7 8 90.0
2.0
4.0
6.0
8.0
10.0
12.0
14.0
16.0
REGIONS, OPERATIONS AND PROJECTS 59
The Gold Fields Mineral Resource and Mineral Reserve Supplement to the Integrated Annual Report 31 December 2014
Darlot Gold Mine (continued)
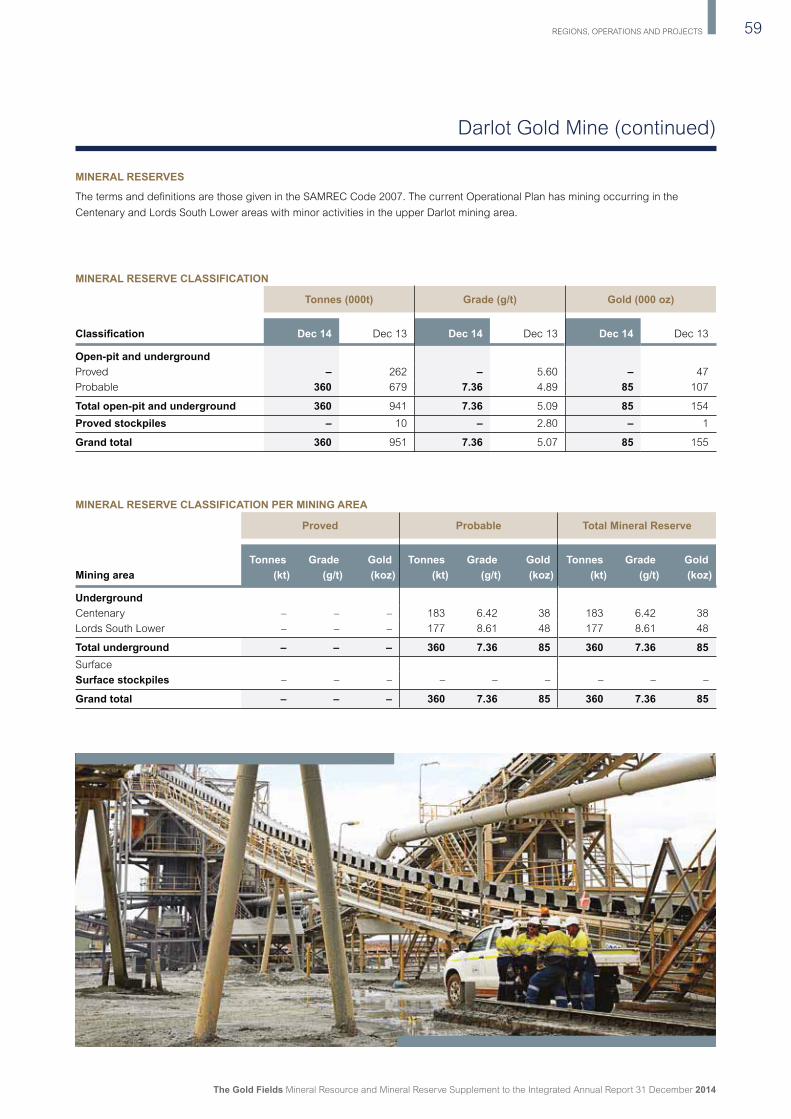
MINERAL RESERVES
The terms and definitions are those given in the SAMREC Code 2007. The current Operational Plan has mining occurring in the
Centenary and Lords South Lower areas with minor activities in the upper Darlot mining area.
MINERAL RESERVE CLASSIFICATION
Tonnes (000t) Grade (g/t) Gold (000 oz)
Classi cation Dec 14 Dec 13 Dec 14 Dec 13 Dec 14 Dec 13
Open-pit and underground
Proved – 262 – 5.60 – 47
Probable 360 679 7.36 4.89 85 107
Total open-pit and underground 360 941 7.36 5.09 85 154
Proved stockpiles – 10 – 2.80 – 1
Grand total 360 951 7.36 5.07 85 155
MINERAL RESERVE CLASSIFICATION PER MINING AREA
Proved Probable Total Mineral Reserve
Tonnes Grade Gold Tonnes Grade Gold Tonnes Grade GoldMining area (kt) (g/t) (koz) (kt) (g/t) (koz) (kt) (g/t) (koz)
Underground Centenary – – – 183 6.42 38 183 6.42 38
Lords South Lower – – – 177 8.61 48 177 8.61 48
Total underground – – – 360 7.36 85 360 7.36 85Surface
Surface stockpiles – – – – – – – – –
Grand total – – – 360 7.36 85 360 7.36 85

The Gold Fields Mineral Resource and Mineral Reserve Supplement to the Integrated Annual Report 31 December 2014
REGIONS, OPERATIONS AND PROJECTS60
2.2 Australia region (continued)
FACTORS THAT AFFECTED THE MINERAL RESOURCE RECONCILIATION
YEAR-ON-YEAR
FACTORS THAT AFFECTED THE MINERAL RESERVE RECONCILIATION
YEAR-ON-YEAR
Decrease in ounces due to increased cut-off grade
Gains through exploration (discovery)
Losses from narrow lodes through changes in the
application of the minimum mining width to underground
resources
Depletion by mining
Increased cut off grades adversely impacted ounces but
head grade improved due to increased selectivity
Removal of marginal remnants from the plan
Significant improvements to Mineral Reserve calculation
protocols replacing legacy models
Positive operational practices increasing mined grade
subsequent to acquisition
Mineral Resource Reconciliation (Gold − koz)
Dec 2
013
Min
ed
dep
letions
Econom
ic
facto
rs
Resourc
e
mod
elli
ng
Dec 2
014
Dis
covery
Inclu
sio
ns /
Exclu
sio
ns
0
50
100
150
200
250
300 271
(84)
263
(17)
112
(18)
Mineral Reserve Reconciliation (Gold − koz)
Dec 2
013
Min
ed
dep
letions
Gold
price
Resourc
e
mod
elli
ng
Dec 2
014
Costs
Dis
covery
Inclu
sio
ns /
Exclu
sio
ns
0
50
100
150
200
154
(79)
85
48
(38)

REGIONS, OPERATIONS AND PROJECTS 61
The Gold Fields Mineral Resource and Mineral Reserve Supplement to the Integrated Annual Report 31 December 2014
Darlot Gold Mine (continued)
MINERAL RESERVE SENSITIVITY
To illustrate the impact of fluctuations in gold price and
exchange rates on the current declaration, Darlot has generated
sensitivities with respect to Mineral Reserves. The following
graph indicates the Managed Mineral Reserve sensitivity at
-15% -10%, -5%, +5%, +10%, +15% and +25% to the base
(A$1,370) reserve gold price.
These sensitivities (other than for the base case) are not
supported by detailed plans and depletion schedules. They
should only be considered on an indicative basis; specifically as
such sensitivities assume 100% selectivity, without any operating
cost increases.
COMPETENT PERSONSInternal technical reviews have been conducted on the
Darlot GM assets by the Competent Persons as listed,
who are full-time employees of Gold Fields Limited.
Pascal BlampainMineral Resource ManagerBSc Geology. AusIMM membership number 205882.
AIG membership 2749.
Industry experience: 21 years in exploration and
mining in Australia and PNG. Commodities: gold, base
metals, mineral sands. Six years Archean gold.
Robert UrieRegional Mining EngineerBEng (Hons) Mining Engineering. MAusIMM
membership number 111309.
Industry experience: 19 years in mining in Australia.
Commodities: gold, base metals, uranium. Two years in
regional role.
Stephanie GotleySenior Resource GeologistBSc (Hons) Geology, Grad. Cert. Geostatistics. AusIMM
membership number 211515. AIG membership
number 2780.
Industry experience: 20 years in mining and consulting
in Australia, including 10 years in Archean gold.
Shaun HackettPrincipal Resource Geologist BSc Geology, MAusIMM membership number 211644.
Industry experience: 24 years in exploration and
mining in Australia and globally. Commodities: gold,
nickel, iron ore. Twenty years in Archean gold
Base gold price (A$1,370/oz)
(15%) (10%) (5%) Base 5% 10% 15% 25%
Mineral Reserve Sensitivity (Gold − Moz)
0.0
0.1

The Gold Fields Mineral Resource and Mineral Reserve Supplement to the Integrated Annual Report 31 December 2014
REGIONS, OPERATIONS AND PROJECTS
2.2 Australia region (continued)
62
www.goldfields.com
Granny Smith Gold Mine
The mine is characterised by a word-class, high-grade ore body that shows good continuity and significant upside potential for Mineral
Resource growth beyond current mining and brownfield generative exploration. The Wallaby underground Mineral Resource ounces
increased by 67% in 2014 as a result of a very successful resource definition and extensional drilling campaign. Mineral Resource to
Mineral Reserve conversion at Wallaby remains a priority to underpin the mining mix and production flexibility needed to deliver the
required cash flow margin. Granny Smith’s strategy is to discover and develop new and extensional Mineral Reserves within its flagship
Wallaby underground mine and from prospective and relatively unexplored tenements.
GENERAL LOCATION
Granny Smith is situated within the Yilgarn Craton at an elevation of 400m above sea level (amsl) and located at latitude 28°51’09” S
and longitude 122°18’35” E, and is located approximately 400km northeast of the town of Kalgoorlie in the Eastern Goldfields of
Western Australia in the Laverton District.
ASSET FUNDAMENTALS
LICENCE STATUS AND HOLDINGS
The Granny Smith Gold Mine (GSM) is owned by GSM Mining Company Pty Ltd a wholly owned
subsidiary of Gold Fields Ltd. This entity came into being on 1 October 2013 following Gold Fields’
acquisition of the asset from Barrick Corporation. GSM controls exploration and mineral rights
over a total area of 64,267 hectares (total of granted tenements) and has security of tenure for all
current exploration and mining leases that contribute to future Mineral Reserves.
OPERATIONAL INFRASTRUCTURE
Granny Smith is currently mining four lenses from the Wallaby ore body (Z70, Z80, Z90 and Z100),
accessed from a single decline. Mining administration and maintenance is located at the Wallaby mine.
Ore is processed at the 3.5 Mtpa capacity Granny Smith CIP processing plant (3.5Mtpa capacity) under
campaign milling conditions and is located 15km east of the Wallaby underground mine.
CLIMATEThe climate is semi-arid and temperatures vary from an average minimum of 4°C in June to an
average maximum of 36°C in January. The average annual rainfall total is 220mm. No extreme
climate conditions are experienced that may affect mining operations.
DEPOSIT TYPE
Orogenic greenstone gold deposits hosted in a number of different styles of lodes. The Granny
Smith lodes comprise vein stock works localised by a northerly trending shear at the margin of a
granodiorite. The Wallaby lodes are flat lying alteration zones hosted within magnetite amphibole
altered conglomerate.
LIFE-OF-MINE (LoM)Ongoing extensional and brownfields exploration continues and will sustain an extended LoM
beyond current reporting. It is estimated that the current Mineral Reserves will be depleted in
2019 (five years).
ENVIRONMENTAL/ HEALTH AND SAFETY
In 2014, GSM achieved Cyanide Code re-certification, ISO 14001 Certification and OHSAS 18001
Certification. GSM is in compliance with all environmental legislation.

REGIONS, OPERATIONS AND PROJECTS
The Gold Fields Mineral Resource and Mineral Reserve Supplement to the Integrated Annual Report 31 December 2014
63
Brief history
The Goanna and Granny Smith deposits were discovered
in 1979 by CSR Ltd. In 1988 Placer Pacific acquired CSR’s
60% interest with the remaining 40% held by Delta Gold NL.
In 1989, mining at the GSM commenced in the Granny Smith pit,
and continued in subsequent years with the development of the
Goanna pit, the Windich pit and nearby satellite pits. First gold
was poured in 1990.
In 1992 the Keringal and Sunrise deposits were discovered
18km and 34km south of Granny Smith respectively, with ore
production from both commencing in 1994. The Wallaby deposit
was discovered in 1998, 11km south-west of Granny Smith, with
first ore delivered to the mill in November 2001.
Barrick acquired 100% of Placer Dome shares on 20 January
2006. The Wallaby open-pit was mined from October 2001
until December 2006 and produced 13.6Mt at 3.44g/t Au for
1.5 million ounces of gold. Underground mining at Wallaby
commenced in December 2005 and is ongoing.
Gold Fields acquired 100% of the Granny Smith Gold Mine on
1 October 2013 as part of the purchase of the Yilgarn South
Operations.
Key developments
Robust Wallaby deposit continues to demonstrate consistent
capacity to replace and grow the Mineral Resource and
Mineral Reserve base
Positive results for extensions to Wallaby Z100 to the south
and Z110/120
Strong 1.4 million ounce increase in Wallaby underground
resources through exploration drilling and Mineral Resource
conversion during 2014
Life-of-Mine based only on current Reserves extends to
2019 (five years) although ongoing exploration and resource
conversion is profiled to extend life, typical of orogenic style
ore bodies
Exploration drilling has expanded the footprint and resource
base of the Z90, Z100, and Z110/120 lodes, and identified
new positions down to the Z150 position
The Granny Smith resource development strategy will focus
on identifying the potential of the Wallaby system down to
the Z150 level. In addition, the high-grade Inferred resource
domains in Z100 south and north-east are being infill drilled to
convert to Measured and Indicated resources for conversion
to reserves
Granny Smith schematic ore zone model looking west
Ore zones
Actinolite-magnetite alteration pipe
Zone 250
Zone 60
Zone 70
Zone 80
Zone 90
Zone 100
Zone 110
Zone 120
1,200 metres
View to the West

REGIONS, OPERATIONS AND PROJECTS64
The Gold Fields Mineral Resource and Mineral Reserve Supplement to the Integrated Annual Report 31 December 2014
ReferenceU/G Mines
Buildings
Roads
Granny Smith Mining Lease
Waste Dump
Open-pit Inactive
Stockpiles
Tailings Dams
Mount Weld Airstrip
Goanna Pit
Granny Smith Mill
Granny Smith Pit
Windich PitMine Village
Wallaby UG
Wallaby Pit
Wallaby UG Offices
Keringal Pit
Jubilee Pit
Road to Sunrise Dam
Core Farm/Exploration Office
Granny Smith Administration
Phoenix Pit
Laverton Townsite
0
Map Grid of Australia Co-ordinate System
1 3
PLAN SHOWING GRANNY SMITH MINE INFRASTRUCTURE AS AT 31 DECEMBER 2014
5Kilometres
N
6820000N
6800000N
6780000N
6800000N
6820000N
460000E
440000E
Lake Carey
6780000N
420000E
440000E
460000E
420000E

REGIONS, OPERATIONS AND PROJECTS
The Gold Fields Mineral Resource and Mineral Reserve Supplement to the Integrated Annual Report 31 December 2014
65
Granny Smith Gold Mine (continued)
OPERATING STATISTICS
Historic performance
Units C2014 C2013 C2012 C2011
Underground mining Total mined kt 1,761 1,887 1,928 1,676
– Waste mined kt 253 446 435 448
– Ore mined kt 1,508 1,442 1,492 1,228
Mined grade g/t 7.21 5.0 5.10 5.61
Processing
Tonnes treated kt 1,472 1,516 1,438 1,187
Head grade g/t 7.17 5.29 5.16 5.66
Yield g/t 6.66 4.74 4.61 5.11
Plant recovery factor % 92.5 89.6 89.4 90.3
Total gold production koz 315.2 231 213 195
Financials
Operating cost A$/oz 642 810 908 687
Capital expenditureA$ million 65.2
A$/oz 207
All-in Sustaining Cost (AISC)A$/oz 896 917 1,349 1,339
US$/oz 809
Mineral Reserves
Mineral Reserves Mt 4.5 4.1 31.5 3.6
Mineral Reserves head grade g/t 6.02 6.34 1.84 5.39
Mineral Reserves Moz 0.87 0.83 1.86 0.63
Rounding off of figures presented in this report may result in minor computational discrepancies. Where this occurs it is not deemed significant.

The Gold Fields Mineral Resource and Mineral Reserve Supplement to the Integrated Annual Report 31 December 2014
REGIONS, OPERATIONS AND PROJECTS66
2.2 Australia region (continued)
Local geology
The Granny Smith region is dominated by the Mt Margaret Dome
in the northwest and the Kirgella Dome in the southeast. These
domes are flanked to the east and west by north-northwest-
striking shear zones, with the central zone between the two
domes being dominated by north- to north-northeast-striking
sigmoidal shear zones. These distinctly different strikes to the
shear zones developed early in the tectonic evolution, and
resulted in a favourable architecture for late-stage orogenic gold
mineralisation at Wallaby and Granny Smith.
The majority of gold mineralisation at the Wallaby deposit
is contained within an actinolite-magnetite alteration pipe.
It crosscuts the host conglomerate and the majority of
magmatic intrusions, and overprints the actinolite-magnetite
alteration. Gold occurs along micro-fractures within pyrite.
EXPLORATION AND RESOURCE DEFINITION DRILLING
Exploration during 2014 focussed on resource conversion and
extensions in the Wallaby deposit. Regional exploration was
recommenced deploying geophysical surveys on the Lake
Carey, Barnicoat and Boomer environs, and drilling at the
Keringal, Jubilee, and Platypus prospects.
In mine exploration drilling in 2014 resulted in extensions of the
Z100 lode a further 130m to the south. The lode remains open
to the south. In mine drilling also continued the expansion of
the current footprints to Z110 and Z120, with selected holes
extended to frame the Z150 position within the Wallaby system.
This programme, consisting of 16 new diamond drill holes, plus
extending five Z100 south holes, has successfully extended
the footprint for Zones 110/120 to 800m by 300m, as well as
identifying numerous new potentially economic mineralised
zones between the Z120 and Z150 positions.
Initial drill programmes commenced at the Keringal, Jubilee and
Platypus projects with two reverse circulation drill holes and
10 diamond drill holes completed. Further work is planned for
Keringal and Jubilee.
Geophysical surveys to screen tenements were completed
on Lake Carey, Barnicoat and the Boomer prospects. These
comprised the completion of detailed gravity surveying on Lake
Carey and the Barnicoat tenements and sub-audio magnetics
(SAM) surveying at Boomer and selected Lake Carey targets.
Mining
The current operations consist of the Wallaby underground mine
with mining occurring in four ore lenses (Z70, Z80, Z90 and
Z100), which form the basis for the 2015 Operational Plan.
MINING METHODS
Access to the Wallaby underground mine is via a portal
established within the completed Wallaby open-pit. The mine
operation is trackless, with truck haulage from underground
via the pit ramp to the surface. The Wallaby underground mine
is currently designed to exploit the stacked mineralised lodes
(Z70, Z80, Z90 and Z100) to a depth of 1.0km.
Two primary underground mining methods are used, with minor
adjustments to suit localised geometry; Inclined Room and
Pillar (IRP) is used in areas with a moderate dip (10° to 35°)
and moderate width zones (four to six metres), and Transverse
Long-hole Stoping (TLHS) is used in zones, which are thicker
(six metres to 15m) with variable dips. Two other mining methods
are used to a lesser extent: Narrow Vein Long-hole Stoping may
be utilised in some areas with the benefit of reduced planned
footwall dilution, and Bulk Long-hole Stoping is used in thicker
zones (15m plus) under varying dip conditions.
MINE PLANNING AND SCHEDULING
At Wallaby, the mine design takes practical stope layouts into
consideration, as well as planning for mining losses in barrier
pillars and stope pillars, or other parts of the resource excluded
for geotechnical, accessibility or economic reasons. The
production scheduling uses rates based on historical mining
performance for Z70, Z80 and Z90 and were matched
appropriately for Z100.
Projects
Although the Granny Smith mill received significant upgrades
post the acquisition to reinstall structural integrity and improve
operating systems and metal recovery, a number of projects are
in place to maintain the performance of the mill going forward.
In mine exploration will focus on determining the extent of the
Wallaby deposit to Z150, while providing information required for
the commencement of a scoping study on potential extraction
and ore handling methods at these depths.
Business improvement priorities encompass improving stope
metal recovery and material movement efficiencies for the
loading and trucking fleet.
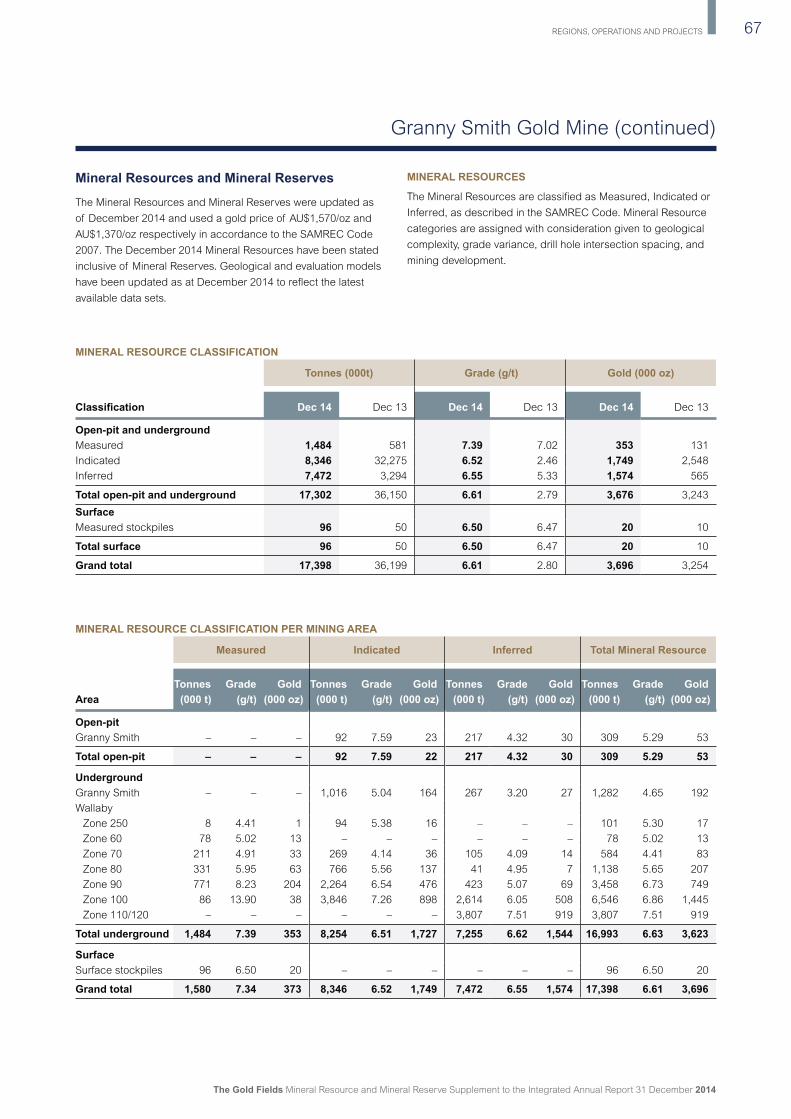
REGIONS, OPERATIONS AND PROJECTS 67
The Gold Fields Mineral Resource and Mineral Reserve Supplement to the Integrated Annual Report 31 December 2014
Granny Smith Gold Mine (continued)
Mineral Resources and Mineral Reserves
The Mineral Resources and Mineral Reserves were updated as
of December 2014 and used a gold price of AU$1,570/oz and
AU$1,370/oz respectively in accordance to the SAMREC Code
2007. The December 2014 Mineral Resources have been stated
inclusive of Mineral Reserves. Geological and evaluation models
have been updated as at December 2014 to reflect the latest
available data sets.
MINERAL RESOURCES
The Mineral Resources are classified as Measured, Indicated or
Inferred, as described in the SAMREC Code. Mineral Resource
categories are assigned with consideration given to geological
complexity, grade variance, drill hole intersection spacing, and
mining development.
MINERAL RESOURCE CLASSIFICATION
Tonnes (000t) Grade (g/t) Gold (000 oz)
Classi cation Dec 14 Dec 13 Dec 14 Dec 13 Dec 14 Dec 13
Open-pit and underground Measured 1,484 581 7.39 7.02 353 131
Indicated 8,346 32,275 6.52 2.46 1,749 2,548
Inferred 7,472 3,294 6.55 5.33 1,574 565
Total open-pit and underground 17,302 36,150 6.61 2.79 3,676 3,243
Surface
Measured stockpiles 96 50 6.50 6.47 20 10
Total surface 96 50 6.50 6.47 20 10
Grand total 17,398 36,199 6.61 2.80 3,696 3,254
MINERAL RESOURCE CLASSIFICATION PER MINING AREA
Measured Indicated Inferred Total Mineral Resource
Tonnes Grade Gold Tonnes Grade Gold Tonnes Grade Gold Tonnes Grade GoldArea (000 t) (g/t) (000 oz) (000 t) (g/t) (000 oz) (000 t) (g/t) (000 oz) (000 t) (g/t) (000 oz)
Open-pit Granny Smith – – – 92 7.59 23 217 4.32 30 309 5.29 53
Total open-pit – – – 92 7.59 22 217 4.32 30 309 5.29 53
Underground Granny Smith – – – 1,016 5.04 164 267 3.20 27 1,282 4.65 192
Wallaby
Zone 250 8 4.41 1 94 5.38 16 – – – 101 5.30 17
Zone 60 78 5.02 13 – – – – – – 78 5.02 13
Zone 70 211 4.91 33 269 4.14 36 105 4.09 14 584 4.41 83
Zone 80 331 5.95 63 766 5.56 137 41 4.95 7 1,138 5.65 207
Zone 90 771 8.23 204 2,264 6.54 476 423 5.07 69 3,458 6.73 749
Zone 100 86 13.90 38 3,846 7.26 898 2,614 6.05 508 6,546 6.86 1,445
Zone 110/120 – – – – – – 3,807 7.51 919 3,807 7.51 919
Total underground 1,484 7.39 353 8,254 6.51 1,727 7,255 6.62 1,544 16,993 6.63 3,623
Surface Surface stockpiles 96 6.50 20 – – – – – – 96 6.50 20
Grand total 1,580 7.34 373 8,346 6.52 1,749 7,472 6.55 1,574 17,398 6.61 3,696

The Gold Fields Mineral Resource and Mineral Reserve Supplement to the Integrated Annual Report 31 December 2014
REGIONS, OPERATIONS AND PROJECTS68
2.2 Australia region (continued)
MODIFYING FACTORS
The Measured and Indicated Mineral Resources are inclusive
of Mineral Reserves
Mineral Reserves are quoted in terms of RoM grades and
tonnages as delivered to the metallurgical processing facility
and are therefore fully diluted
Mineral Reserve statement includes only Measured and
Indicated Mineral Resources, modified to produce Mineral
Reserves and contained within the LoM plan
Mineral Resources and Mineral Reserves undergo regular
internal and/or external audits, and any issues identified are
rectified at the earliest opportunity – usually during the current
reporting cycle
Units December 2014 December 2013
Mineral Resource parameters
Mineral Resource gold price US$/oz 1,500 1,500
A$/oz 1,570 1,429
Exchange rate A$: US$ 1.05 1.05
Cut-off for open-pit g/t 1.04 0.48 – 0.50
Cut-off for underground g/t 3.06 – 3.53 3.44 – 3.92
Mineral Reserve parameters
Mineral Reserve gold price US$/oz 1,300 1,350
A$/oz 1,370 1,350
Exchange rate A$: US$ 1.05 1.00
Cut-off for underground g/t 3.50 – 3.81 3.63 – 4.11
Mining recovery factor (underground) % 91 80 – 95
MCF % 100 100
Dilution underground % 10 2 – 10
Plant recovery factor % 92 88.9
Processing capacity Mtpa 3.5 3.5
GRADE TONNAGE CURVES
The grade tonnage curve for the underground Mineral Resource is presented below.
Tonnes above cut-off
Average grade above cut-off
Cut-off grade (g/t)
Grade tonnage curve − Underground
0
5
10
15
20
25
30
35
Tonnes (
mill
ions)
Gra
de (g
/t)
20 1 3 4 5 6 7 8 90.0
2.0
4.0
6.0
8.0
10.0
12.0
14.0

REGIONS, OPERATIONS AND PROJECTS 69
The Gold Fields Mineral Resource and Mineral Reserve Supplement to the Integrated Annual Report 31 December 2014
Granny Smith Gold Mine (continued)
MINERAL RESERVES
The Mineral Reserve estimate for Granny Smith is based on
a detailed and engineered LoM plan. All detailed design and
scheduling work is undertaken by experienced engineers using
mine planning software. The planning process incorporates
modifying factors and the use of cut-off grades and other
techno-economic investigations.
The current Operational Plan has mining occurring in four zones
(Z70, Z80, Z90 and Z100) at Wallaby underground.
The Mineral Reserves are derived following the generation of
the LoM plan, supported by a detailed design and schedule
that takes account of prevailing geotechnical factors directing
optimal sequencing, cut-off grades, and incorporating
appropriate modifying factors. Capital requirements are
accommodated in the cash flow model to ensure sustainable
operations over the Life-of-Mine.
MINERAL RESERVE CLASSIFICATION
Tonnes (000t) Grade (g/t) Gold (000 oz)
Classi cation Dec 14 Dec 13 Dec 14 Dec 13 Dec 14 Dec 13
Underground
Proved 673 257 7.10 5.49 154 45
Probable 3,734 3,809 5.81 6.39 698 783
Total underground 4,408 4,066 6.01 6.33 852 828
Surface
Proved 96 50 6.50 6.47 20 10
Total surface 96 50 6.50 6.47 20 10
Grand total 4,503 4,116 6.02 6.34 872 838
MINERAL RESERVE CLASSIFICATION PER MINING AREA
Proved Probable Total Mineral Reserve
Mining areaTonnes Grade Gold Tonnes Grade Gold Tonnes Grade Gold
(kt) (g/t) (koz) (kt) (g/t) (koz) (kt) (g/t) (koz)
Wallaby underground Zone 250/60 88 4.22 12 – – – 88 4.22 12
Zone 70 60 3.96 8 65 3.46 7 126 3.70 15
Zone 80 23 4.09 3 293 5.01 47 316 4.94 50
Zone 90 372 7.92 95 1,149 5.68 210 1,520 6.22 304
Zone 100 130 8.72 36 2,227 6.06 434 2,357 6.21 470
Total underground 673 7.10 154 3,734 5.81 698 4,408 6.01 852
Surface
Surface stockpiles 96 6.50 20 – – – 96 6.50 20
Total surface 96 6.50 20 – – – 96 6.50 20
Grand total 769 7.03 174 3,734 5.81 698 4,503 6.02 872

The Gold Fields Mineral Resource and Mineral Reserve Supplement to the Integrated Annual Report 31 December 2014
REGIONS, OPERATIONS AND PROJECTS70
2.2 Australia region (continued)
FACTORS THAT AFFECTED MINERAL RESOURCE
RECONCILIATION YEAR-ON-YEAR
FACTORS THAT AFFECTED MINERAL RESERVE
RECONCILIATION YEAR-ON-YEAR
Mining depletion
Increase of 1.4Moz to the Wallaby underground Mineral
Resource primarily from resource extension
Decrease of 0.9Moz at the Granny Smith open-pit
project, following updates to the legacy open-pit mining
optimisations utilising updated but more realistic cost
inputs.
Upgrade of 0.25Moz of lower grade material to Mineral
Resource following lower cut-off grades defined at
Wallaby underground driven through a higher planning
gold price A$1,500/oz vs. A$1,429/oz.
Depletion by mining that occurred from zones 70, 80, 90
and 100 in Wallaby underground
The ~5% reduction in Wallaby underground grade is
primarily due to high-grade areas now depleted during
2014 through mining in Z80 and Z100; in addition the
Z100 2014 resource model update also added significant
new ounces but from, or proximal to intrusive domains at
a lower average grade than the 2013 resource grade and
the thinner ore zones drive increased planned dilution
Upgrades to portions of the Inferred Mineral
Resource permitting conversion to reserves (~396koz)
WATERFALL GRAPHS SHOWING YEAR-ON-YEAR CHANGES BY CATEGORY Mineral Resource Reconciliation (Gold − koz)
Dec 2
013
Min
ed
dep
letions
Econom
ic
facto
rs
Resourc
e
mod
elli
ng
Dec 2
014
Dis
covery
Inclu
sio
ns /
Exclu
sio
ns
0
500
1,000
1,500
2,000
2,500
3,000
3,500
4,000
3,254
(342)
3,696
(690)
1,464
Mineral Reserve Reconciliation (Gold − koz)
Dec 2
013
Min
ed
dep
letions
Resourc
e
mod
elli
ng
Dec 2
014
Costs
Sto
ckp
ile
0100200300400500600700800900
1,000838
(342)
872
(30)
396 10

REGIONS, OPERATIONS AND PROJECTS 71
The Gold Fields Mineral Resource and Mineral Reserve Supplement to the Integrated Annual Report 31 December 2014
Granny Smith Gold Mine (continued)
COMPETENT PERSONS Internal technical reviews have been conducted by
the Competent Persons as listed, who are full-time
employees of Gold Fields Limited.
Gary SparksMineral Resource Manager BapplSc, MSc. MAusIMM membership number 108663,
GSA membership number 5823.
Industry experience: 29 years in exploration and
mining in Australia. Commodities: gold, copper, silver,
lead, zinc. Five years at Granny Smith.
Marko VelezmoroSenior Engineer: Mining BSc Mining. MAusIMM membership number 305685.
Industry experience: 17 years in mining in Australia
and Peru. Commodities: gold, nickel, zinc, iron ore.
Three years at Granny Smith.
Richard TullySuperintendent: Resources BSc (Hons). MAusIMM membership number 992513,
AIG membership number 2716.
Industry experience: 12 years in mining and exploration
in Australia and PNG. Commodities: gold, nickel and
PGE. Eight years at Granny Smith.
Shaun HackettPrincipal Resource Geologist BSc Geology, MAusIMM membership number 211644.
Industry experience: 24 years in exploration and mining
in Australia and globally. Commodities: gold, nickel,
iron ore. Two years’ experience with Granny Smith.
MINERAL RESERVE SENSITIVITY
To illustrate the impact of fluctuations in gold price and
exchange rates on the current declaration, Granny Smith
has generated sensitivities with respect to Mineral Reserves.
The following graph indicates the Managed Mineral Reserve
sensitivity at -15% -10%, -5%, +5%, +10%, +15% and +25%
to the base (A$1,370) reserve gold price.
These sensitivities (other than for the base case) are not
supported by detailed plans and depletion schedules. They
should only be considered on an indicative basis; specifically
as such sensitivities assume 100% selectivity, without any
operating cost increases.
Base gold price (A$1,370/oz)
(15%) (10%) (5%) Base 5% 10% 15% 25%
Mineral Reserve Sensitivity (Gold − Moz)
0
0.2
0.4
0.6
0.8
1.0
1.2

The Gold Fields Mineral Resource and Mineral Reserve Supplement to the Integrated Annual Report 31 December 2014
REGIONS, OPERATIONS AND PROJECTS72
2.2 Australia region (continued)
www.goldfields.com
ASSET FUNDAMENTALS
LICENCE STATUS AND HOLDINGS
St Ives controls exploration and mineral rights over a total area of 112,810 hectares (total of
granted tenements) and has security of tenure for all current exploration and mining leases that
contribute to future Mineral Reserves.
OPERATIONAL INFRASTRUCTURE AND MINERAL PROCESSING
St Ives currently operates three underground mines, which are accessed via declines, several
open pits, a centralised administrative office, an engineering workshop and a 4.7Mtpa.
CIP processing plant.
CLIMATESt Ives is situated in an area of arid bush land. While occasional storm activity may cause minor
delays to open-pit mining operations, the climatic conditions do not materially impact on the
normal operations of the site.
DEPOSIT TYPEArchaean orogenic greenstone gold hosted in a number of different styles of mineralisation.
Lode, supergene and palaeoplacer style deposits characterise the range of ore body types
LIFE-OF-MINE (LoM)Ongoing extensional and brownfields exploration continues and could increase the LoM. It is
estimated that the current known Mineral Reserves will be depleted in 2020 (six years).
ENVIRONMENTAL/HEALTH AND SAFETY
The mine maintained OHSAS 18001 Occupational Health and Safety Management System
certification and ISO 14001 Environmental Management System certification. St Ives was
certified as fully compliant with the International Cyanide Management Code on 3 June 2009.
St Ives Gold Mine
St Ives is a well-established operation comprising a mix of ‘owner mined’ open-pit and underground operations feeding the Lefroy
CIL mill with a current capacity of 4.7Mtpa.
The tenement holdings are located in the highly prospective Norseman-Wiluna Greenstone Belt and encompasses under-explored
ground that has been recently acquired or is targeted because of innovative new exploration modelling. An appropriately funded
exploration programme continues to be a key anchor to replacing Mineral Reserves and growing operational flexibility going forward.
The new Invincible open-pit represents a major discovery and has emphasised the high prospectivity of the Speedway corridor which
is prioritised in the 2015 exploration campaign.
GENERAL LOCATION
The St Ives operations extend from 5km to 25km south-southwest of the town of Kambalda in Western Australia, approximately 630km
east of Perth at latitude 31°12’S and longitude 121°40’E. The nearest major settlement is the town of Kalgoorlie situated 80km to the
north. Well-established power, access roads and supporting infrastructure exist in the area.

REGIONS, OPERATIONS AND PROJECTS
The Gold Fields Mineral Resource and Mineral Reserve Supplement to the Integrated Annual Report 31 December 2014
73
Brief history
Gold was discovered at Kambalda Red Hill camp in 1897 and
during the following 10 years, other gold-bearing locations, such
as Victory, were discovered with an estimated total production of
31koz, mostly from the Red Hill group of mines.
Iron-nickel sulphides were discovered near the old Red Hill
mine. Western Mining Corporation (WMC) acquired ground and
developed a mining and milling operation. From 1966 to 1996
the region produced approximately 34.0Mt of ore at an average
grade of 3.1% nickel.
In 1981, the Victory-Defiance complex (Leviathan area) was
discovered. Gold production commenced at St Ives using a
0.5Mtpa treatment plant (later expanded to 1.2Mtpa) located at
the Kambalda Nickel Concentrator site. In 1988 a new 3.1Mtpa
CIL facility was constructed 25 kilometres south of Kambalda
at St Ives.
In 2001 a 2.0Mt heap leach facility was commissioned and Gold
Fields Limited acquired St Ives. In 2004 the 4.8Mtpa Lefroy mill
was constructed and fully commissioned in early 2005.
2006 saw the start of an aggressive exploration programme
with full field air core drilling and in 2007 the start-up and
establishment of Cave Rocks and Belleisle underground mines.
Initiation of new consolidated Leviathan open-pit commenced in
2008.
The Athena-Hamlet deposit was discovered in 2009. This was
followed by continued discovery and growth of the Hamlet
deposit and commencement of the Athena mine with the first ore
intersected in May 2010. Athena reached commercial levels of
production in September 2011. Hamlet development intersected
first ore in October 2011 as part of a new mine development
programme.
During 2012 stoping commenced at Hamlet. Cave Rocks
LoM was extended, as well as an early-stage discovery of a
new camp (Invincible deposit). In addition, conversion to open-
pit owner mining was completed and heap leach processing
stopped.
The ongoing successful exploration strategy delivered the
Invincible deposit in 2013, with current Mineral Resources in
excess of 1.3Moz and an open-pit and underground Mineral
Reserve of 628koz and 168koz respectively. Depth and lateral
extensions at Invincible were identified and will be actively
explored as part of the 2015 exploration programme.
Key developments
Commencement of Invincible open-pit infrastructure and
bunding in 2014 to facilitate open-pit mining on Lefroy Lake
in early 2015
Exploration of early stage targets along the highly prospective
Invincible (Speedway) trend are providing encouraging results
Maiden 168koz underground Mineral Reserve at Invincible
Neptune open-pit stage 1 mining completed in 2014,
evaluation of future stages underway
Athena is near completion and mining of final stopes is
scheduled in the latter part of 2015
Limited success with exploration at Cave Rocks in 2014,
mine closure mooted in 2015 with completion of drill
programme and final exploration close-out review
Ongoing evaluation and elimination of marginal Mineral
Resources and Mineral Reserves contributed to improved
quality but lower volumes primarily at Greater Santa Ana
and Cave Rocks

REGIONS, OPERATIONS AND PROJECTS74
The Gold Fields Mineral Resource and Mineral Reserve Supplement to the Integrated Annual Report 31 December 2014
Waste Dump
Open-pits Inactive
Stockpiles
Tailings/Leach Pad
Open-pits Active
Open-pits Proposed
ReferenceU/G Mines
Towns
Buildings
Roads
Lease outline
Gold rights only
N
GREATER REVENGEOPEN-PIT COMPLEX
GREATER VICTORY
0 2 4 6 8 10
KilometresCo-ordinate System : Map Grid of Australia Zone 51 (Geodetic Datum of Australia 1994)
PLAN SHOWING ST IVES MINE INFRASTRUCTURE AS AT 31 DECEMBER 2014
Paddys
Widgiemooltha
Argo U/G
GatehouseSilver Lake Facility
Neptune
Argo
Junction
Revenge
IntrepideSanta Ana
Thunderer
BahamaFormidable
Temeraire
Paris
West IdoughEast Idough
Athena-
Mars
Britannia
Kambalda West East
Kambalda
Invincible
Pistol Club
Redback
Swiftsure
Cave Rocks
350000E
370000E
390000E
6550000N
6530000N
6510000N
6490000N
370000E
6490000N
6510000N
6530000N
Lake Lefroy
Lefroy Mill
DianaHamlet U/G
Leviathan
A5
Bellerophon
Agamemnon
U/G
Core Farm
6550000N
HHH
OPEN-PIT COMPLEX
Lake Lefroy
Kambalda West
Eastern Causeway
Speedway Corridor
South West Dome

REGIONS, OPERATIONS AND PROJECTS 75
The Gold Fields Mineral Resource and Mineral Reserve Supplement to the Integrated Annual Report 31 December 2014
St Ives Gold Mine (continued)
OPERATING STATISTICS – ST IVES
Historic performance
Units C2014 C2013 C2012 C2011
Open-pit mining Total mined kt 16,758 13,834 16,518 18,728
– Waste mined kt 15,130 11,175 12,356 14,421
– Ore mined kt 1,628 2,659 4,162 4,307
Mined grade g/t 2.16 1.3 1.5 1.7
Strip ratio (waste/ore) waste 9.29 4.2 3.5 4
Underground mining
Total mined kt 2,759 3,231 2,528 2,524
– Waste mined kt 683 851 903 756
– Ore mined kt 2,077 2,380 1,626 1,768
Mined grade g/t 4.0 4.2 5.1 4.7
Processing
Tonnes treated kt 4,553 4,763 7,038 6,745
Head grade g/t 2.61 2.8 2.2 2.4
Yield g/t 2.42 2.6 2 2.1
Plant recovery factor % 93.8 96 89 90
Total gold productionkoz 362 403 443 466
kg 11,248 12,535 13,779 14,494
Tonnes milled kt 4,553 4,763 4,001 4,793
– Yield ex-millkoz 358 391 416 434
g/t 2.4 2.6 2.8 2.8
Tonnes to heap leach kt – n/a 2,287 1,952
– Yield ex-heap leachkoz 8 12 27 32
g/t n/a n/a 0.4 0.5
Financials
Operating cost A$/oz 895 887 884 867
Capital expenditure A$/oz 360 339 669 381
All-in Sustaining Cost (AISC) A$/oz 1,289 1,262 1,593 1,286
Mineral Reserves
Mineral Reserves Mt 17.8 20.7 25.8 37.9
Mineral Reserves head grade g/t 3.14 3.00 2.64 2.30
Mineral Reserves Moz 1.80 2.02 2.19 2.81
Rounding off of figures presented in this report may result in minor computational discrepancies, where this occurs it is not deemed significant.

The Gold Fields Mineral Resource and Mineral Reserve Supplement to the Integrated Annual Report 31 December 2014
REGIONS, OPERATIONS AND PROJECTS76
2.2 Australia region (continued)
Local geologySt Ives lies within the Kambalda domain, a subset of the
Norseman-Wiluna Belt. The Kambalda domain is bound by the
north-north west trending Boulder-Lefroy fault (BLF) and Zuleika
shear. The region has undergone four compressional events
predated by early extension and has been metamorphosed to
upper greenschist or lower amphibolite facies.
The main structural feature of the St Ives area is the gently
south-plunging Kambalda anticline, which extends 35 kilometres
from the south end of the Kambalda dome to the Junction Mine.
The majority of known gold deposits are proximal to the trace of
the anticlinal axis. A major second order structure known as the
Playa shear splays off the BLF shear zone and can be traced
through the St Ives field for a distance in excess of 10km.
There are several styles of gold mineralisation at St Ives. The
individual deposits may contain more than one of these styles:
lode mineralisation: Archaean lode mineralisation typically
consisting of 0.5 to 20 metre-wide mesothermal vein
complexes that may also have hydraulic breccia’s and/or
mylonites, indicating movement on a shear
supergene mineralisation: broad zones of flat-lying gold
mineralisation in weathered Archaean and overlying Tertiary
sediments
palaeoplacer mineralisation: placer deposits hosted by
palaeochannels in the unconsolidated Tertiary sediments
which overlie the Archaean basement
EXPLORATION AND RESOURCE DEFINITION DRILLING
St Ives continuously explores the 112,810 hectares of tenement
holding to discover new Mineral Resources. Exploration is split
between two teams, the first of which is tasked with discovering
new deposits while the second focuses on developing known
deposits. These teams are supported by in-house geophysics,
regional and corporate technical teams, along with an
established Mineral Resources team responsible for QA/QC,
data management and Mineral Resource modelling.
St Ives maintains rigorous QA/QC protocols on all its exploration
programmes. It draws on industry leading practice for data
acquisition and utilises accredited laboratories which are
regularly reviewed both internally and externally. Analytical QA/
QC is maintained and monitored through the submission of
blanks, certified reference material and duplicates plus umpire
laboratory checks. This ensures sign-off by Competent Persons
under the SAMREC 2007 and JORC 2012 Codes.
In 2014 exploration focussed on project generation, advancing
prospective targets, retiring projects that failed to meet milestone
hurdle criteria and developing a good understanding of the
Speedway corridor. The Speedway trend is a 20km plus
prospective belt where milestone success was achieved at the
Heracles, Far south and Incredible prospects and a number
of high potential targets are still to be tested in 2015. The
Kambalda West, South West Dome and Eastern Causeway areas
are effectively poorly explored to date and are also targeted for
exploration drilling in 2015.
Mining
Conventional drill and blast with truck and shovel mining
techniques are employed at all open pits. Grade control is
generally expedited by inclined Reverse Circulation (RC) drilling
on grids determined by the ore body characteristics. Certain
open-pit projects that include 10m to 40m of unconsolidated
sedimentary overburden do not initially require drilling and
blasting. In such projects, hard rock is imported for sheeting
to facilitate the access of equipment during mining, and/or
dewatering of the sedimentary overburden prior to mining.
Load-and-haul is carried out by 140 tonne dump trucks and
150 to 250 tonne excavators in backhoe and/or face shovel
configuration. Mining benches vary from five to 10m, and are
excavated in five passes (flitches) of about 2.5m per flitch.
Gold mineralisation is mined selectively to cut-off grades, and
segregated into grade ranges to balance the ore production
and processing capacities on-site and maximise cash flow from
operations.
Underground mines at St Ives are commonly extensions of
open-pit mines. Underground operations are characterised by
common features, which allow a high level of standardisation
in operating strategy, mine design, stoping methods, mining
equipment and utilisation. Mines are accessed via declines, with
additional raises for return airways and ladder-ways used as a
second means of egress. Drives are developed to access the
ore and future stoping production areas.
Underground mining at St Ives is predominantly mechanised and
conducted by long-hole open stoping (LHOS), with subordinate
cut-and-fill and room-and-pillar stoping for the shallower dipping
ore bodies. Paste fill and LHOS is used where mandated by
geotechnical factors. Electric-hydraulic drilling jumbos and
rubber-tyred diesel-powered LHDs are used for development
and stoping, while trucks are used for load-and-haul operations.
Ore from both open-pit and underground operations is
transported with road trains from individual mining operations to
the central St Ives processing facilities.

REGIONS, OPERATIONS AND PROJECTS 77
The Gold Fields Mineral Resource and Mineral Reserve Supplement to the Integrated Annual Report 31 December 2014
St Ives Gold Mine (continued)
MINE PLANNING AND SCHEDULING
The Mineral Reserve definition processes are similar for open-pit
and underground operations. Cut-off grades are used to define
potentially economic mining panels, taking into consideration
direct mining and processing costs, group set commodity prices
and other parameters. The economic viability of future mining
panels is tested by determining whether the optimal margin,
after applying the appropriate cut-off grade, is sufficient to
cover the required capital development and mining costs.
Open-pit optimisation software, in conjunction with economic
parameters and physical constraints is used to generate a
series of nested pits for open-pit mining. An optimal shell is then
selected and a detailed design used to confirm the mineability.
Underground mining methods are largely determined by the
geometry of the mineralised zones and evaluation may involve
review of more than one method. Sophisticated proprietary
software is used for mine design and scheduling.
Mine planning is based on three-dimensional block models of
in situ mineralisation, with allowances made for minimum mining
widths, dilution and ore loss in line with the mining method being
considered.
Infrastructure, waste disposal and ore stockpile management
requirements are incorporated into the planning process.
Ore stockpile management at St Ives strives to optimise the
metallurgical blend requirements of the Lefroy Mill, with regard
to material types and grade management. This in turn helps to
maximise cash flow from the operations.
Projects
The current major mine expansion project at St Ives is at the
new Invincible open-pit mine, which is in the production build-
up phase with ore production planned to commence in 2015.
Site infrastructure establishment commenced in late 2014.
The discovery and opportunity provided by the new Invincible
open-pit and associated exploration upside is a major
contributor to the future of St Ives. Amendments to existing
lake based mining permits, technical and feasibility studies
have all been completed to enable the mine to commence
production in early 2015. The Invincible underground potential
will be assessed further in 2015 as new drilling below the
designed open pit to test for mineralised shoot extensions and
geotechnical information becomes available.
Mineral Resources and Mineral Reserves
Geology and evaluation models have been updated to reflect
the latest available data sets. An integrated mine design and
schedule plan is based on current performance levels and
takes cognisance of the inherent risks associated with mining
operations at St Ives.
The Mineral Resources are classified as Measured, Indicated
and Inferred as defined in the SAMREC Code. Increasing
levels of geoscientific knowledge and confidence are based
on geological understanding, grade variance, drill hole/
sample spacing, mining development (amount of exposed
and mapped mineralisation) and mining history. The economic
evaluation is based on the Group planning gold price, taking into
account estimates of all costs, the impact of modifying factors
such as mining dilution and metal/ore recovery, processing
recovery and royalties. All Mineral Resources and Mineral
Reserves reported are 100% attributable to St Ives Gold Mine.

The Gold Fields Mineral Resource and Mineral Reserve Supplement to the Integrated Annual Report 31 December 2014
REGIONS, OPERATIONS AND PROJECTS78
2.2 Australia region (continued)
MINERAL RESOURCES
The Mineral Resource statement for St Ives is summarised in the
tables below. The Mineral Resources and Mineral Reserves have
been updated using the current Gold Fields planning gold price
of US$1,500/oz and US$1,300/oz respectively and reported
in accordance with SAMREC Code. The impacts of year-on-
year changes are discussed in the reconciliation section.
The surface sources include stockpiles that are supported by
adequate sampling, and are thus classified as Measured Mineral
Resources.
MINERAL RESOURCE CLASSIFICATION
Tonnes (000t) Grade (g/t) Gold (000 oz)
Classi cation Dec 14 Dec 13 Dec 12 Dec 14 Dec 13 Dec 12 Dec 14 Dec 13 Dec 12
Open-pit and underground
Measured 1,475 1,750 2,131 5.53 4.93 4.36 262 277 299
Indicated 17,496 20,511 29,905 3.98 3.87 3.09 2,238 2,551 2,967
Inferred 6,617 10,899 12,585 4.05 3.86 3.27 861 1,351 1,324
Total open-pit and underground
25,587 33,150 44,622 4.09 3.92 3.20 3,361 4,179 4,591
Surface
Measured stockpiles 4,498 5,294 4,129 1.02 0.94 0.98 147 160 129
Total surface 4,498 5,294 4,129 1.02 0.94 0.98 147 160 129
Grand total 30,085 38,444 48,751 3.63 3.51 3.01 3,508 4,340 4,720

REGIONS, OPERATIONS AND PROJECTS 79
The Gold Fields Mineral Resource and Mineral Reserve Supplement to the Integrated Annual Report 31 December 2014
St Ives Gold Mine (continued)
MINERAL RESOURCE CLASSIFICATION PER SOURCE AREA
Area
Measured Indicated Inferred Total Mineral Resource
Tonnes Grade Gold Tonnes Grade Gold Tonnes Grade Gold Tonnes Grade Gold(000 t) (g/t) (000 oz) (000 t) (g/t) (000 oz) (000 t) (g/t) (000 oz) (000 t) (g/t) (000 oz)
Open-pit
Apollo 7 2.46 1 271 3.36 29 161 2.63 14 440 3.08 44
Bondi – – – – – – 169 3.50 19 169 3.50 19
Clifton – – – 360 2.85 33 108 2.74 9 467 2.83 42
Delta Island – – – 151 2.43 12 49 5.44 9 201 3.17 21
Hamlet – – – 487 3.07 48 – – – 487 3.07 48
Idough – East – – – 117 1.71 6 0 1.11 0 118 1.70 6
Idough – West 34 1.63 2 120 2.14 8 12 2.29 1 166 2.05 11
Intrepide – – – – – – 247 2.69 21 247 2.69 21
Invincible Pit – – – 5,909 4.80 913 1,052 3.38 114 6,960 4.59 1,027
Invincible South – – – – – – 397 6.64 85 397 6.64 85
Junction – – – 125 3.07 12 66 4.03 8 191 3.40 21
Neptune – – – 4,477 2.94 423 858 3.08 85 5,334 2.96 508
Neptune South – – – 306 2.25 22 75 2.46 6 381 2.29 28
Pistol Club – – – 166 5.20 28 20 2.89 2 186 4.95 30
Redback 21 4.37 3 2 3.92 0 26 3.04 3 48 3.65 6
Santa Ana – – – 871 2.60 73 40 2.53 3 911 2.60 76
Swiftsure – – – 122 5.80 23 3 7.40 1 125 5.84 23
Temeraire – – – 206 1.54 10 – – – 206 1.54 10
Thunderer 27 2.95 3 142 3.37 15 11 1.72 1 180 3.20 19
Trinidad – – – 287 3.01 28 9 1.95 1 296 2.98 28
Yorick – – – 75 4.97 12 260 3.95 33 336 4.18 45
Total open-pit 89 2.73 8 14,195 3.72 1,696 3,562 3.62 414 17,846 3.69 2,118 Underground Argo 150 4.57 22 657 4.24 89 409 3.43 45 1,216 4.01 157
Athena 452 6.26 91 220 4.83 34 75 4.49 11 747 5.66 136
Cave Rocks 390 4.53 57 96 4.37 13 278 4.47 40 764 4.49 110
East Repulse 3 7.06 1 37 6.04 7 88 6.46 18 128 6.36 26
Hamlet 390 6.67 84 1,514 5.82 283 880 5.04 142 2,784 5.69 509
Invincible UG – – – 778 4.60 115 1,120 4.30 155 1,898 4.42 270
Invincible South – – – – – – 203 5.37 35 203 5.37 35
Total underground 1,386 5.71 254 3,301 5.11 542 3,054 4.55 447 7,741 5.00 1,243
Surface Surface stockpiles 4,498 1.02 147 – – – – – – 4,498 1.02 147
Grand total 5,973 2.13 409 17,496 3.98 2,238 6,617 4.05 861 30,085 3.63 3,508
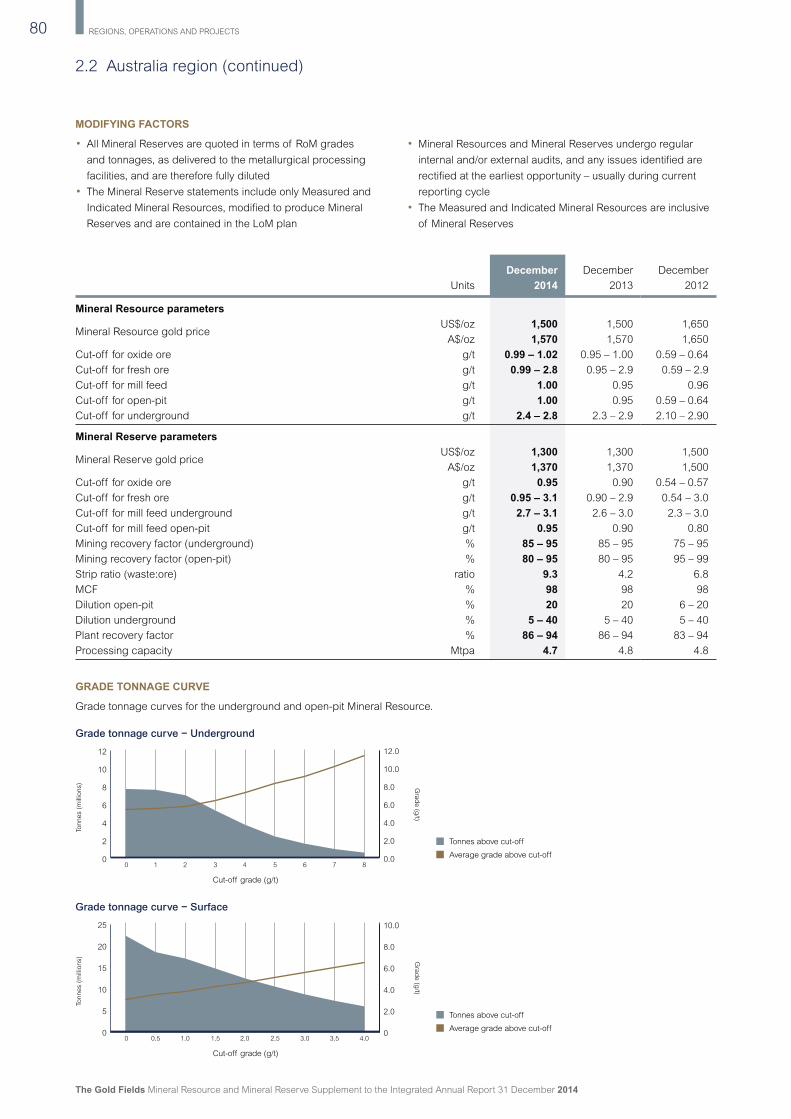
The Gold Fields Mineral Resource and Mineral Reserve Supplement to the Integrated Annual Report 31 December 2014
REGIONS, OPERATIONS AND PROJECTS80
2.2 Australia region (continued)
MODIFYING FACTORS
All Mineral Reserves are quoted in terms of RoM grades
and tonnages, as delivered to the metallurgical processing
facilities, and are therefore fully diluted
The Mineral Reserve statements include only Measured and
Indicated Mineral Resources, modified to produce Mineral
Reserves and are contained in the LoM plan
Mineral Resources and Mineral Reserves undergo regular
internal and/or external audits, and any issues identified are
rectified at the earliest opportunity – usually during current
reporting cycle
The Measured and Indicated Mineral Resources are inclusive
of Mineral Reserves
December December December
Units 2014 2013 2012
Mineral Resource parameters
Mineral Resource gold priceUS$/oz 1,500 1,500 1,650
A$/oz 1,570 1,570 1,650
Cut-off for oxide ore g/t 0.99 – 1.02 0.95 – 1.00 0.59 – 0.64
Cut-off for fresh ore g/t 0.99 – 2.8 0.95 – 2.9 0.59 – 2.9
Cut-off for mill feed g/t 1.00 0.95 0.96
Cut-off for open-pit g/t 1.00 0.95 0.59 – 0.64
Cut-off for underground g/t 2.4 – 2.8 2.3 – 2.9 2.10 – 2.90
Mineral Reserve parameters
Mineral Reserve gold priceUS$/oz 1,300 1,300 1,500
A$/oz 1,370 1,370 1,500
Cut-off for oxide ore g/t 0.95 0.90 0.54 – 0.57
Cut-off for fresh ore g/t 0.95 – 3.1 0.90 – 2.9 0.54 – 3.0
Cut-off for mill feed underground g/t 2.7 – 3.1 2.6 – 3.0 2.3 – 3.0
Cut-off for mill feed open-pit g/t 0.95 0.90 0.80
Mining recovery factor (underground) % 85 – 95 85 – 95 75 – 95
Mining recovery factor (open-pit) % 80 – 95 80 – 95 95 – 99
Strip ratio (waste:ore) ratio 9.3 4.2 6.8
MCF % 98 98 98
Dilution open-pit % 20 20 6 – 20
Dilution underground % 5 – 40 5 – 40 5 – 40
Plant recovery factor % 86 – 94 86 – 94 83 – 94
Processing capacity Mtpa 4.7 4.8 4.8
GRADE TONNAGE CURVE
Grade tonnage curves for the underground and open-pit Mineral Resource.
Tonnes above cut-off
Average grade above cut-off
Cut-off grade (g/t)
Grade tonnage curve − Underground
0
2
4
6
8
10
12
10 2 3 4 5 6 7 8
Tonnes (
mill
ions)
Gra
de (g
/t)
0.0
2.0
4.0
6.0
8.0
10.0
12.0
Cut-off grade (g/t)
Grade tonnage curve − Surface
0
5
10
15
20
25
Tonnes (
mill
ions)
0.50 1.0 1.5 2.0 2.5 3.0 3.5 4.0
Tonnes above cut-off
Average grade above cut-off
Gra
de (g
/t)
0
2.0
4.0
6.0
8.0
10.0

REGIONS, OPERATIONS AND PROJECTS 81
The Gold Fields Mineral Resource and Mineral Reserve Supplement to the Integrated Annual Report 31 December 2014
St Ives Gold Mine (continued)
MINERAL RESERVES
Reported Mineral Reserves at St Ives reduced nominally to
1.8Moz since December 2013. The dominant contributors to
Mineral Reserves are the Athena, Hamlet, Invincible, Neptune and
the Cave Rocks mines. The Mineral Reserve statement for St Ives
is summarised in the tables below. The following points apply:
Estimates for St Ives include allowances for all relevant
modifying factors
Mineral Reserves are reported in terms of tonnages, grades
and contained gold delivered for processing
Surface sources include stockpiles. St Ives assumes that
stockpiles are supported by adequate sampling, and are thus
classified as Proved Mineral Reserves
The Mineral Reserves are derived following the generation of the
LoM plan, supported by a detailed design and schedule, and
incorporating appropriate modifying factors.
MINERAL RESERVE CLASSIFICATION
Tonnes (000t) Grade (g/t) Gold (000 oz)
Classi cation Dec 14 Dec 13 Dec 12 Dec 14 Dec 13 Dec 12 Dec 14 Dec 13 Dec 12
Open-pit and underground
Proved 1,081 1,202 1,085 4.76 4.70 4.72 166 181 165
Probable 12,264 14,203 20,590 3.78 3.68 2.86 1,490 1,681 1,896
Total open-pit and underground 13,346 15,405 21,674 3.86 3.76 2.96 1,655 1,863 2,061
Surface
Proved 4,498 5,294 4,129 1.02 0.94 0.98 147 160 129
Total surface 4,498 5,294 4,129 1.02 0.94 0.98 147 160 129
Grand total 17,844 20,699 25,804 3.14 3.03 2.64 1,803 2,022 2,190
MINERAL RESERVE CLASSIFICATION PER MINING AREA
Mining area
Proved Probable Total Mineral Reserve
Tonnes Grade Gold Tonnes Grade Gold Tonnes Grade Gold(kt) (g/t) (koz) (kt) (g/t) (koz) (kt) (g/t) (koz)
Open-pit Clifton – – – 130 2.98 12 130 2.98 12
Delta Island – – – 138 2.30 10 138 2.30 10
Invincible Pit – – – 5,075 3.85 628 5,075 3.85 628
Neptune – – – 2,713 3.06 267 2,713 3.06 267
Neptune South – – – 272 2.02 18 272 2.02 18
Pistol Club – – – 108 5.26 18 108 5.26 18
Redback 18 4.29 2.4 1 3.46 0.2 19 4.22 3
Santa Ana – – – 756 2.34 57 756 2.34 57
Swiftsure – – – 140 4.77 21 140 4.77 21
Thunderer 5 2.45 0.4 127 2.96 12 132 2.94 12
Total open-pit 22 3.89 3 9,461 3.43 1,045 9,483 3.44 1,047
Underground Athena 415 4.98 66 107 4.22 15 523 4.82 81
Cave Rocks 360 3.87 45 124 3.59 14 484 3.80 59
Hamlet 284 5.64 51 1,584 4.88 248 1,868 4.99 300
Invincible UG – – – 988 5.29 168 988 5.29 168
Total underground 1,059 4.78 163 2,803 4.94 445 3,863 4.90 608
Surface Surface stockpiles 4,498 1.02 147 – – – 4,498 1.02 147
Grand total 5,579 1.74 313 12,264 3.78 1,490 17,844 3.14 1,803

The Gold Fields Mineral Resource and Mineral Reserve Supplement to the Integrated Annual Report 31 December 2014
REGIONS, OPERATIONS AND PROJECTS82
2.2 Australia region (continued)
Dec 2
013
Min
ed
dep
letions
Gold
price
Costs
Dis
covery
Resourc
e
mod
elli
ng
Dec 2
014
Inclu
sio
ns/
Exclu
sio
ns
Mineral Reserve Reconciliation (Gold − koz)
0
500
1,000
1,500
2,000
2,500
2,022
(381) (40)
345
(105) (39)
1,803
FACTORS THAT AFFECTED MINERAL RESOURCE
RECONCILIATION YEAR-ON-YEAR
Mined depletion since December 2013
Discovery was dominated by Invincible and small
extensions at Athena
At Cave Rocks the 2014 exploration drilling identified
additions down dip and across strike but at a lower grade
Economic factors (higher power cost) impacting Argo,
Conqueror and Cave Rocks
Additional Santa Ana Mineral Resources were removed
from the Mineral Resource to mineral inventory based on
prevailing economic factors
Mined depletion since December 2013
Discovery was dominated by Invincible, and nominal
extensions at Athena; Invincible underground defined a
maiden Reserve in 2014
Change in detailed geological widths on depth
extensions at Hamlet has reduced tonnes
At Athena, mining and the final stope removal at depth
are scheduled for late-2015/early-2016 with subsequent
mine closure
FACTORS THAT AFFECTED MINERAL RESERVE
RECONCILIATION YEAR-ON-YEAR
Mineral Resource Reconciliation (Gold − koz)
Dec 2
013
Min
ed
dep
letions
Econom
ic
facto
rs
Dis
covery
Resourc
e
mod
elli
ng
Dec 2
014
Inclu
sio
ns/
Exclu
sio
ns
0500
1,0001,5002,0002,5003,0003,5004,0004,5005,000
4,340
(381)(367)
271
(268) (86)
3,508
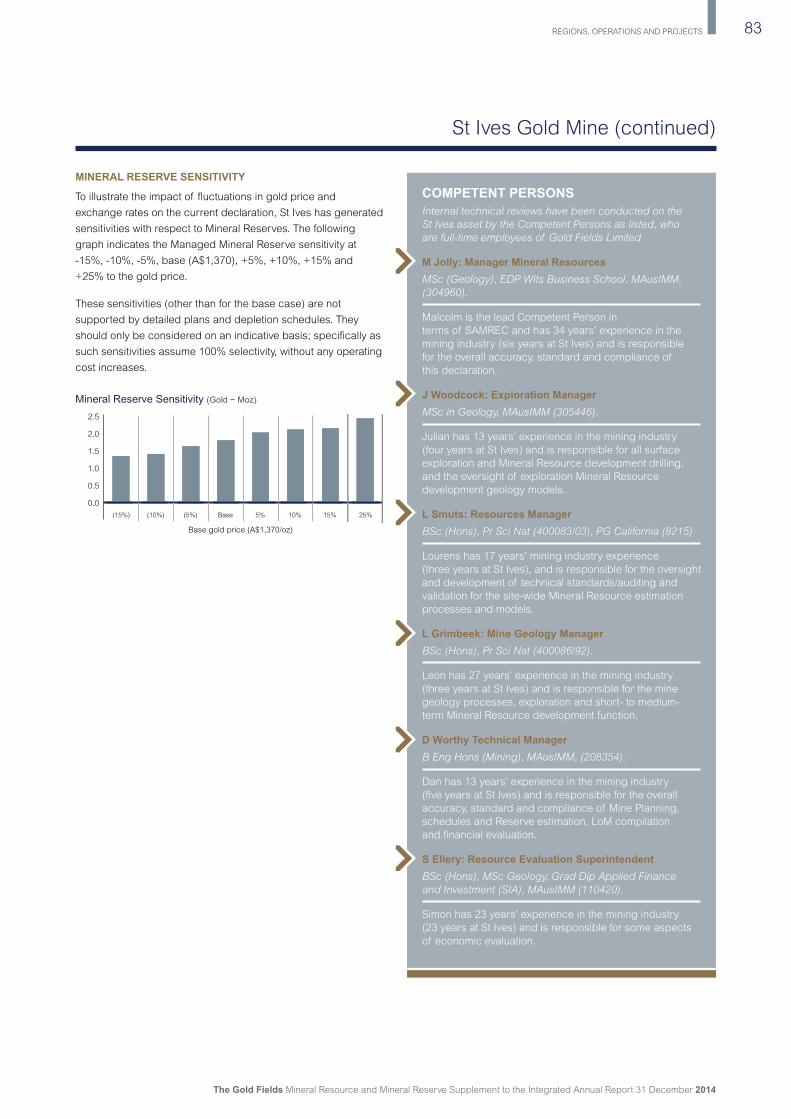
REGIONS, OPERATIONS AND PROJECTS 83
The Gold Fields Mineral Resource and Mineral Reserve Supplement to the Integrated Annual Report 31 December 2014
St Ives Gold Mine (continued)
Base gold price (A$1,370/oz)
(15%) (10%) (5%) Base 5% 10% 15% 25%
Mineral Reserve Sensitivity (Gold − Moz)
0.0
0.5
1.0
1.5
2.0
2.5
MINERAL RESERVE SENSITIVITY
To illustrate the impact of fluctuations in gold price and
exchange rates on the current declaration, St Ives has generated
sensitivities with respect to Mineral Reserves. The following
graph indicates the Managed Mineral Reserve sensitivity at
-15%, -10%, -5%, base (A$1,370), +5%, +10%, +15% and
+25% to the gold price.
These sensitivities (other than for the base case) are not
supported by detailed plans and depletion schedules. They
should only be considered on an indicative basis; specifically as
such sensitivities assume 100% selectivity, without any operating
cost increases.
COMPETENT PERSONSInternal technical reviews have been conducted on the
St Ives asset by the Competent Persons as listed, who
are full-time employees of Gold Fields Limited
M Jolly: Manager Mineral ResourcesMSc (Geology), EDP Wits Business School, MAusIMM,
(304960).
Malcolm is the lead Competent Person in
terms of SAMREC and has 34 years’ experience in the
mining industry (six years at St Ives) and is responsible
for the overall accuracy, standard and compliance of
this declaration.
J Woodcock: Exploration ManagerMSc in Geology, MAusIMM (305446).
Julian has 13 years’ experience in the mining industry
(four years at St Ives) and is responsible for all surface
exploration and Mineral Resource development drilling,
and the oversight of exploration Mineral Resource
development geology models.
L Smuts: Resources ManagerBSc (Hons), Pr Sci Nat (400083/03), PG California (8215)
Lourens has 17 years’ mining industry experience
(three years at St Ives), and is responsible for the oversight
and development of technical standards/auditing and
validation for the site-wide Mineral Resource estimation
processes and models.
L Grimbeek: Mine Geology ManagerBSc (Hons), Pr Sci Nat (400086/92).
Leon has 27 years’ experience in the mining industry
(three years at St Ives) and is responsible for the mine
geology processes, exploration and short- to medium-
term Mineral Resource development function.
D Worthy Technical ManagerB Eng Hons (Mining), MAusIMM, (208354).
Dan has 13 years’ experience in the mining industry
(five years at St Ives) and is responsible for the overall
accuracy, standard and compliance of Mine Planning,
schedules and Reserve estimation, LoM compilation
and financial evaluation.
S Ellery: Resource Evaluation SuperintendentBSc (Hons), MSc Geology, Grad Dip Applied Finance
and Investment (SIA), MAusIMM (110420).
Simon has 23 years’ experience in the mining industry
(23 years at St Ives) and is responsible for some aspects
of economic evaluation.

The Gold Fields Mineral Resource and Mineral Reserve Supplement to the Integrated Annual Report 31 December 2014
REGIONS, OPERATIONS AND PROJECTS84
2.2 Australia region (continued)
Project ownership and capital expenditure
Exploration is being conducted by Far Southeast Gold
Resources Inc. (FSGRI), a joint venture company of the Lepanto
Consolidated Mining Company (LCMC) and Gold Fields
Ltd (GFL). To date GFL has acquired 40% of the project for
payments of US$230 million and has the option to acquire a
further 20% for an additional payment of US$110 million.
Regional geology
The Mankayan district is underlain by a basement of pre-Middle
Miocene volcanic and intrusive rocks, which is unconformably
overlain by an extensive cover sequence of Late Pliocene-
Pleistocene dacitic tuffs and breccias, the eruption of which
was accompanied by the intrusion of diorite and dacite
stocks and domes. Major north-trending strike-slip faults
of the Philippine Fault system dominate the structure of the
district and have exerted fundamental controls on igneous
activity and mineralisation. The district-scale mineralisation is
characterised by intermediate sulphidation veins and fault-
controlled high-sulphidation enargite – luzonite deposits that
have been mined for precious and base metals principally at the
Victoria and Lepanto mines. A number of copper-gold porphyry
prospects also exist, which principally include the FSE porphyry
deposit itself.
Far Southeast – 40% attributable to GFI
Gold and copper deposit in the Philippines
Mineral Resources of 19.8Moz gold and 9,921Mlb copper
LOCATION
The Far Southeast (FSE) project is situated in the established mining district of Mankayan in the Cordillera Region of Northern Luzon,
approximately 250km north of Manila.
DEPOSIT GEOLOGY
The FSE copper-gold porphyry is a deeply concealed deposit
associated with a Pleistocene diorite – dacite intrusion complex
intruded into Eocene basaltic country rocks. The intrusion
complex is cross-cut by several large phreatomagmatic breccia
pipes, which are pre-, syn- and post-mineralisation. Most of
the mineralisation is hosted in the intrusion complex and to a
lesser extent the basaltic country rocks and is characterised
by disseminated sulphides and multi-phase sulphide-bearing
quartz and quartz-anhydrite vein sets and stock works.
EXPLORATION PROCESS, SAMPLING AND QAQC
No drilling took place at the FSE project during 2014. Much of
2014 was occupied with a study of the higher grade zones of
the deposit, involving detailed re-logging of all core intersections
within those zones. This resulted in a more refined geological
model for the higher-grade zone and a clearer understanding of
the controls on the mineralisation for the deposit as a whole.
The geological model and data stemming from the study have
been used to support a resource assessment of the higher-
grade zone of the deposit, which in turn, will feed into a scoping
study on selective mining of the higher grades. This study is due
for completion in the Q2 2015.
Sampling and assay of drill core at the FSE project is controlled
by strict QA/QC procedures in accordance with the SAMREC
Code, with regular internal and external audits. Prior to the
release of the 2012 Mineral Resource estimate all aspects of
sampling and assay were independently audited and the Mineral
Resource model was also externally audited. Routine external
audits of the project’s database have also been performed.

REGIONS, OPERATIONS AND PROJECTS
The Gold Fields Mineral Resource and Mineral Reserve Supplement to the Integrated Annual Report 31 December 2014
85
Social licence to operate
Negotiations with the local Council of Elders continued
throughout the year with the objective of obtaining a
Memorandum of Agreement to secure a Certificate of
Precondition from the National Commission on Indigenous
Peoples. The latter is a prerequisite to the company’s application
for a Financial or Technical Assistance Agreement (FTAA).
Gold Fields can only exercise its option agreement with LCMC
to acquire majority shareholding (additional 20%) of the FSE
project after obtaining a FTAA from the government, which is a
prolonged process.
Environmental baseline monitoring continued throughout the
year as part of FSGRI’s Environmental and Social Impact
Assessment.
MINERAL RESOURCES
An Inferred Mineral Resource for the FSE deposit was declared
in September 2012, within a mining constraint, which assumed
an eventual non-selective, bulk underground mining method.
The classification of Inferred Resource was applied based on
drill hole spacing, estimation quality, geological continuity and
geological understanding of the deposit in early 2012 and is
compliant with the SAMREC Code.
Tonnes Grade Content
Far Southeast Au Cu Au CuGold and Copper (Mt) (g/t) (%) (Moz) (Mlb)
Inferred – Gold and copper 891.7 0.69 0.50 19.800 9,921
Table – FSE Mineral Resources effective 31 August 2012 (unchanged)
Notes: 1 These Mineral Resources are not Mineral Reserves as an assessment to a minimum of a prefeasibility study is required.
2 The Mineral Resource is reported in accordance with the SAMREC Code.
3 The Mineral Resource is reported within an optimised underground bulk mining shell that is derived using a scoping study plus mining, processing and cost parameters, and
commodity prices of US$1,650/oz Au and US$8,600/t Cu. All Inferred Mineral Resource material within the shell is reported.
4 The Mineral Resource is reported without dilution and ore loss parameters.
5 Rounding-off of figures may result in minor computational discrepancies, where this happens, it is not deemed significant.
6 Lepanto Consolidated Mining Company holds a 60% interest, while Gold Fields holds a 40% interest in the Far Southeast Project. Attributable metal is 7.9Moz Au and
3,968Mlb (1.8Mt) Cu to Gold Fields.
COMPETENT PERSONInternal technical reviews have been conducted on the FSE project asset by the Competent Persons as listed, who are full-
time employees of Gold Fields Limited.
A Trueman: Lead Competent Person and Chief Resource GeologistBSc (Hons) Geology; PGeo, APEGBC 149753; MAusIMM CP (Geo) 110730.
Mr Trueman has geology and resource estimation experience spanning 23 years including more than five years of relevant
experience in the estimation of porphyry systems similar to FSE. Mr Trueman has been part of the project since Gold Fields’
first involvement in 2009.
Outlook
The main focus of the project will be to complete the negotiations and procedures required for obtaining the FTAA. Technical and
operating/capital cost studies will in the meantime focus on the high-grade selective mining scoping study and optimisation of costs.