22 21 S had very little 202triacetate membranes in natural ...
45
1 The impact of ethylene glycol and hydrogen sulfide on the performance of cellulose 2 triacetate membranes in natural gas sweetening 3 Authors: H. T. Lu 1 , S. Kanehashi 2 , C. A. Scholes 1 , S. E. Kentish 1,* 4 1 Department of Chemical and Biomolecular Engineering, The University of Melbourne, 5 Parkville, VIC3010 Australia 6 2 Department of Organic and Polymer Materials Chemistry, Tokyo University of Agriculture 7 and Technology, 3-8-1 Harumi-cho, Fuchu-shi, Tokyo 183-8538 Japan 8 Abstract 9 In natural gas sweetening, gas dehydration with glycols is typically carried out upstream of 10 membrane separation of carbon dioxide. This means that when process upsets occur, these 11 glycols can reach the membrane unit. In this work, we study the impact of two common 12 glycols (monoethylene glycol and triethylene glycol) on the gas transport performance of 13 CTA. We find that the glycol absorbed into the membrane initially obstructs the permeation 14 of CH 4 and CO 2, due to pore filling or antiplasticisation effects, but the permeability then 15 increases again, indicative of polymer relaxation and a loss of crystallinity in the polymer. 16 The smaller helium molecule is significantly less affected by the presence of the glycols, 17 possibly because its lower solubility within glycol limits its movement through the swollen 18 structure. However, after removing the glycols with a methanol wash, the membrane 19 performance recovers with only a slight residual plasticisation observed. In addition, the 20 permeation of H 2 S, a common contaminant within natural gas streams, was studied across a 21 range of temperatures. At the partial pressures studied (up to 0.75 kPa), H 2 S had very little 22 effect on the membrane performance even in long-term exposure for up to 300 days. 23 24 25 Keywords: Cellulose triacetate; hydrogen sulphide; ethylene glycol; triethylene glycol; 26 plasticization. 27 * Corresponding author: Tel: +61 3 8344 6682; fax: +61 3 8344 4153 28 E-mail address: [email protected] (S.E. Kentish) 29 30
Transcript of 22 21 S had very little 202triacetate membranes in natural ...

1 The impact of ethylene glycol and hydrogen sulfide on the performance of cellulose 2 triacetate membranes in natural gas sweetening
3 Authors: H. T. Lu1, S. Kanehashi2, C. A. Scholes1, S. E. Kentish1,*
4 1Department of Chemical and Biomolecular Engineering, The University of Melbourne, 5 Parkville, VIC3010 Australia
6 2Department of Organic and Polymer Materials Chemistry, Tokyo University of Agriculture 7 and Technology, 3-8-1 Harumi-cho, Fuchu-shi, Tokyo 183-8538 Japan
8 Abstract
9 In natural gas sweetening, gas dehydration with glycols is typically carried out upstream of 10 membrane separation of carbon dioxide. This means that when process upsets occur, these 11 glycols can reach the membrane unit. In this work, we study the impact of two common 12 glycols (monoethylene glycol and triethylene glycol) on the gas transport performance of 13 CTA. We find that the glycol absorbed into the membrane initially obstructs the permeation 14 of CH4 and CO2, due to pore filling or antiplasticisation effects, but the permeability then 15 increases again, indicative of polymer relaxation and a loss of crystallinity in the polymer. 16 The smaller helium molecule is significantly less affected by the presence of the glycols, 17 possibly because its lower solubility within glycol limits its movement through the swollen 18 structure. However, after removing the glycols with a methanol wash, the membrane 19 performance recovers with only a slight residual plasticisation observed. In addition, the 20 permeation of H2S, a common contaminant within natural gas streams, was studied across a 21 range of temperatures. At the partial pressures studied (up to 0.75 kPa), H2S had very little 22 effect on the membrane performance even in long-term exposure for up to 300 days.23
24
25 Keywords: Cellulose triacetate; hydrogen sulphide; ethylene glycol; triethylene glycol; 26 plasticization.
27 * Corresponding author: Tel: +61 3 8344 6682; fax: +61 3 8344 4153
28 E-mail address: [email protected] (S.E. Kentish)
29
30
1
1 1. Introduction
2 Natural gas is a primary energy resource that will occupy over 25% of the global electricity 3 market in the next decades, as well as acting as a transport fuel and direct heating resource 4 [1]. The composition of raw natural gas varies widely but typically contains impurities such 5 as nitrogen (N2), carbon dioxide (CO2), water (H2O) and hydrogen sulphide (H2S) that 6 require removal to meet pipeline specifications. Membrane separation has been used for 7 many decades for acid gas removal, known as natural gas sweetening, with advantages in 8 energy efficiency, land footprint and a lack of chemical consumption [2]. Although many 9 new membrane materials have been developed, cellulose triacetate (CTA) membranes still
10 retain the bulk of this separation market because of their high CO2 – methane (CH4) 11 selectivity, commercial readiness and acceptance as a low risk option by the industry [3, 4].
12 Raw natural gas is usually saturated with water which is generally removed upstream of the 13 membrane unit to avoid pipeline corrosion and hydrate formation [5-7]. Glycols such as 14 monoethylene glycol (MEG), diethylene glycol (DEG) and triethylene glycol (TEG) are the 15 most common solvents utilised for this purpose [8, 9]. Due to the extremely low vapour 16 pressure of glycols (28Pa for monoethylene glycol [10] and <1Pa for triethylene glycol [11] 17 at 35oC), carryover of these solvents in the vapor state is usually limited. However, carryover 18 of entrained glycol droplets can occur [7]. This is a significant issue, because glycol is known 19 to plasticise polymers [12], and the entrainment of the glycol solution into the membrane unit 20 can thus alter the permselectivity of the membrane [13]. A study on the effect of MEG and 21 TEG vapours on CO2/CH4 separation across a facilitated transport membrane has been 22 reported [14]. However, to the best knowledge of the authors, there is no study on the effect 23 of glycol solutions on the gas separation performance of CTA membranes.
24 Hydrogen sulfide is a common species in natural gas with concentration varying from 4 – 25 10000 ppm [15] that will enter the membrane unit with the natural gas. Many studies on CO2 26 removal from natural gas by cellulose acetate membranes have observed the co-permeation of 27 H2S with CO2 in the membrane unit [15-17]. Li et al (1987) reports the performance of 28 cellulose acetate membranes in the presence of H2S – H2O mixtures [18]. However, the 29 impact of temperature on H2S permeation through the CTA membrane has not been well 30 studied. Heilman et al. [19] reported the permeability and sorption of H2S into several 31 polymer films including a cellulose acetate film manufactured by Polaroid but the results 32 presented were limited. Data on the long term effect of H2S on CTA gas separation 33 performance is also limited.
34 In this investigation, the effect of two standard glycols, MEG and TEG, on the gas separation 35 of CTA membranes over a 2000 hour period is investigated. The permeation of H2S through 36 CTA membrane at different partial pressures (0.2 – 0.75 kPa) and temperatures (22 – 80oC) is 37 also reported, as is the long term impact of H2S on the membrane performance over a 7200 38 hour period.
3940
2
1 2. Experimental2 2.1. Membrane fabrication
3 The polymer utilised in the investigation was a commercial cellulose triacetate powder 4 supplied by Cellulose Company – Daicel Corporation, Japan. The degree of substitution of 5 acetyl groups on the polymer is 2.85, corresponding to a degree of acetylation of 61.6%.
6 Dense CTA membranes were fabricated by a solvent casting method. The polymer powder 7 was dried under vacuum at 100oC overnight prior to membrane fabrication. The dried powder 8 was then dissolved in dicholoromethane (ChemSupply, Australia) to form a 1 wt % solution. 9 The solution was filtered to remove any impurities before casting into glass petri-dishes. The
10 petri-dishes were kept covered for 24 hours for solvent evaporation. Afterward, the 11 membranes were dried under vacuum at 35oC for 24 hours and 100oC for another 24 hours 12 and the final membranes stored in a desiccator to prevent exposure to moisture. The 13 membranes were stored for two weeks before utilisation in permeability measurements, to 14 allow the initial rapid loss of permeability due to physical aging to occur. The thickness of 15 each membrane was measured with a micrometer to be in the range of 65 to 75 µm. At least 16 two membranes were tested for each experimental condition to confirm the reproducibility.
17 The membrane density () was determined by the buoyancy technique using a XS205 18 DualRange balance (Mettler Toledo, Australia) with maximum 0.06% error. The density was 19 based on the difference in weight of membrane samples in air (mair) and in n-hexane (mhexane) 20 at room condition (22 ± 1oC) (Equation 1). The density (hexane) of n-hexane (Chem-supply, 21 Australia, 95%) was 0.655 g/ml as measured by a calibrated pycnometer.
22 (1)𝜌 =𝑚air
𝑚air ‒ 𝑚hexane𝜌hexane
23 2.2. Gas permeation measurement
24 A variable volume constant pressure (VVCP) gas permeation apparatus was utilised to 25 measure the permeability of gas mixtures through CTA membranes across the pressure range 26 from 100 to 900 kPa gauge and temperature range from 22 to 80oC. The gas permeation set-27 up has been reported in previous studies [6, 20, 21]. The H2S mixed gas (1000ppm H2S in 28 balance N2, Coregas Australia) was fed into the feed side of the permeation cell with stage 29 cut less than 0.2%. A sweep gas of absolute helium (99.99% purity, Coregas Australia) at 1 30 atm absolute pressure flowed across the permeate side of the membrane cell at 35 ml/min and 31 was directed to a gas chromatograph (490 micro GC, Agilent technologies Australia) for 32 concentration analysis. The GC was calibrated against pure N2 and a mixture of 1000 ppm 33 H2S in N2 to generate the calibration curve. 3435 For measuring the permeability of individual gases (He (99.99% purity, Coregas Australia), 36 CH4 (99.9% purity, Coregas Australia) and CO2 (99.5% purity, BOC Australia), a constant 37 volume - variable pressure (CVVP) gas permeation apparatus was used. The gas permeation 38 rig was operated at 35oC and the setup was also as reported in previous studies [21, 22]. The 39 membrane with an effective area of 10.75 cm2 was installed into the permeation cell and 40 placed under a vacuum overnight prior to the gas permeation measurement. The gas 41 permeation coefficient, P (Barrer or 10-10 cm3(STP).cm/cm2.s.cmHg), was determined from 42 the slope of the pressure versus time curve, under steady state conditions.
3
1 2.3. Static long-term aging of CTA in glycol solutions and H2S
2 The long term impact of ethylene glycol (MEG, 99.8% purity - anhydrous, Sigma Aldrich 3 Inc., America) and triethylene glycol (TEG, 99% purity – 0.1% water, Chemsupply, 4 Australia) on the CTA membranes was determined by immersing the membranes into pure 5 glycol solutions, separately at ambient conditions (22 ± 2oC) for up to 2000 h (80 days). The 6 solutions were stored in glass containers and kept inside a desiccator to prevent exposure to 7 moisture. The water content of the glycol solutions was regularly determined by a volumetric 8 Karl Fischer titrator (915 KF Ti-Touch, Metrohm AG Switzerland) to ensure the glycol 9 concentration remained above 99.0%, which is similar to the concentration of lean glycol in
10 industrial dehydrators [7]. Membrane samples were removed regularly to test the sorption 11 uptake and the pure gas permeability in a “wet” state.
12 To determine the sorption uptake, the membrane was removed from the solution and excess 13 liquid droplets on the membrane surfaces removed by wiping with a tissue. The membranes 14 were then weighed to record the mass uptake (mt). The total glycol uptake was calculated via 15 Equation 2 where mo is the original mass of the membrane and m the value at equilibrium 16 sorption.
17 Glycol uptake (%) (2)=𝑚∞ ‒ 𝑚o
𝑚ox 100
18 Some “wet” membrane samples were also immersed in methanol (MeOH, 99.8% purity – 19 0.1% water, Chemsupply Australia) for 168 hours (1 week) to extract the glycol from the 20 membrane structure. The washed membranes were removed from the MeOH solution and 21 dried by vacuum overnight before testing the gas permeation in this “dry” state. To confirm 22 the extraction efficiency of MeOH, thermogravimetric analysis was conducted (TGA 209 F1 23 Libra®, Netzsch Australia).
24 Fresh CTA membranes were also aged in pure methanol at ambient conditions for up to 550 25 hours. The wet membranes were removed from the solution and dried in vacuum overnight to 26 evaporate all methanol before testing.
27 Similarly, the long-term impact of H2S on the performance of CTA membranes was 28 conducted by placing dense membranes in a sealed chamber at room temperature (22 ± 2oC). 29 The chamber was evacuated and then filled with the experimental gases (1000ppm H2S in 30 balance N2 or pure N2) to 750 kPa absolute pressure. After a specified aging period of up to 31 7200 hours (300 days), the membranes were removed and the permeability recorded. The 32 chamber was evacuated for around 5 minutes to remove the toxic gases before opening and 33 removing the membranes.
34 Differential scanning calorimetry (DSC) was used to determine the glass transition 35 temperature (Tg) of original and “wet” state CTA using a differential scanning calorimeter 36 DSC 8500 with a DSC high pressure cell addendum (Perkin Elmer, Australia). The heating 37 rate was 20oC/min, from 22oC to 250oC, under 1600 kPa nitrogen pressure to prevent glycol 38 evaporation. The Tg was determined by the centre point of the endothermic transition. The 39 result for MEG was compared to the Fox equation for ideal mixtures (Equation 3) [23, 24].

4
1 (3)1𝑇g
=𝑤1
𝑇g1+
𝑤1
𝑇g2
2 where w1, Tg1, w2, Tg2 are the weight fraction and glass transition temperature in Kelvin of 3 CTA and glycol, respectively. The Tg of pure CTA was taken as 190 ± 5oC [25] while that of 4 MEG was -118oC [26]. It was not possible to find the glass transition temperature for pure 5 TEG.
6 Wide angle X-ray diffraction (WAXD) analysis was conducted to study the impact of glycols 7 on the crystallinity of the CTA polymer. A D8 Advance Diffractometer (Bruker, Germany) 8 was used to analyse the membranes over a 2 range from 5o to 35o at a rate of 0.02o every 5 9 seconds with a Ni-filtered CuK radiation source, 30mA and 40kV. Bragg’s equation was
10 applied to calculate the mean distance, d-spacing, between polymer chains (Equation 4),
11 = 2d sin (4)
12 Where is the radiation wavelength (1.54 Å) and is the incident angle.
13 3. Results and discussion
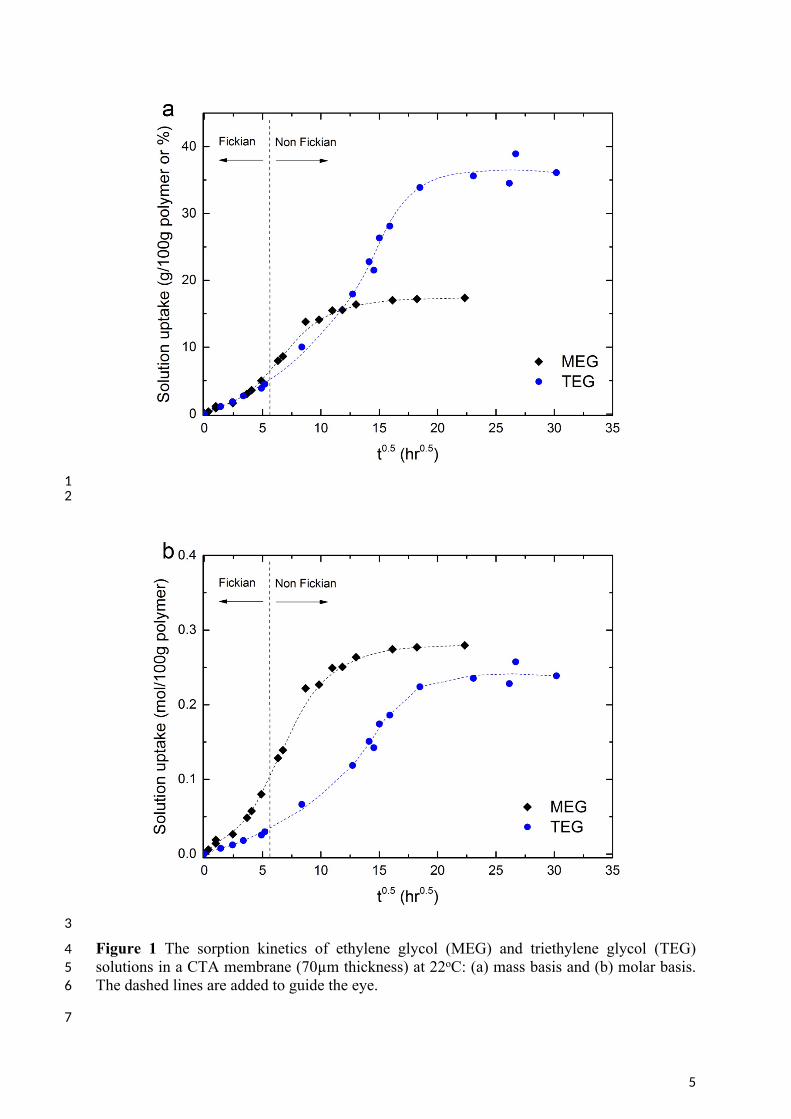
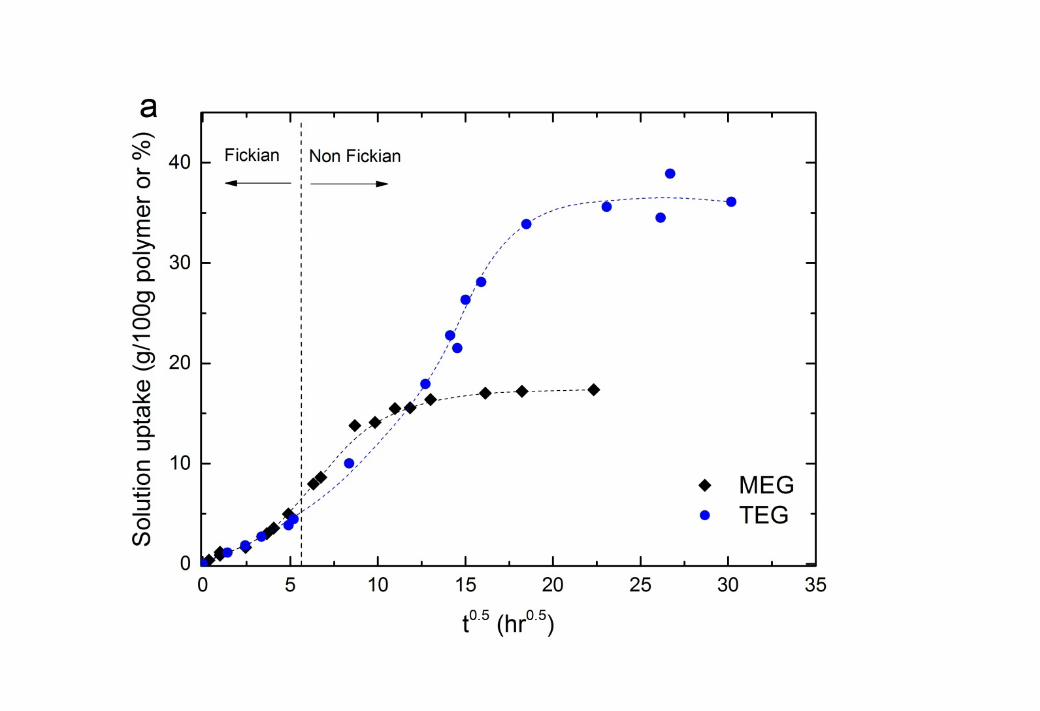
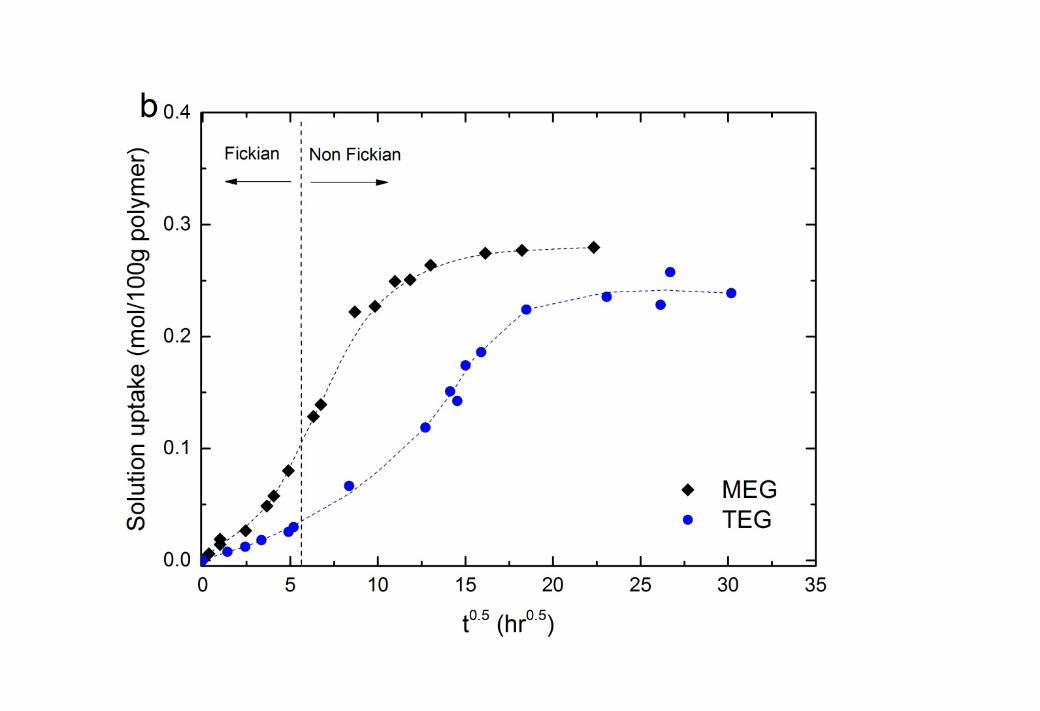
14 3.1. Sorption Uptake of glycol liquids in Cellulose Triacetate15 The sorption uptake of both MEG and TEG (Figure 1) shows a sigmoidal shape which 16 indicates that while the glycols initially swell the CTA membrane by Fickian diffusion, 17 polymer relaxation or plasticisation occurs as the solute concentration increases [27-30]. The 18 transition from Fickian diffusion to non-Fickian polymer relaxation occurs at roughly 30 19 hours of exposure of these 70µm membranes to the solution. It should be noted that the 20 transition time would be of the order of seconds for commercial membranes where the active 21 layer is of the order of a hundred nanometers in thickness.
22 The equilibrium solubilities of the two penetrants are summarised in Table 1. The solubility 23 of the glycols is greater for TEG than MEG by mass (Figure 1). However, comparison on a 24 molar basis indicates that the CTA membrane accommodates similar amounts of both glycols.
25
26 Table 1 Solubility of glycols in the CTA membrane
Liquids MEG TEGMolecular Weight (g/mol) 62.1 150.2
wt % 18.8 ± 0.4 37.7 ± 0.7Solubility
mol/100g polymer 0.30 ± 0.006 0.25 ± 0.00527
5
12
3
4 Figure 1 The sorption kinetics of ethylene glycol (MEG) and triethylene glycol (TEG) 5 solutions in a CTA membrane (70µm thickness) at 22oC: (a) mass basis and (b) molar basis. 6 The dashed lines are added to guide the eye.
7

6
1 3.2. Impact of glycol liquids on CTA membrane performance2 3.2.1. The impact of methanol on CTA membrane in glycol extraction step3 The impact of these glycols on CTA membrane performance was determined by testing the 4 permeation of pure He and CH4 through the original fresh membranes, the “wet” membranes 5 (after absorbing glycols for a specified time) and the “dry” membranes (after removal of the 6 glycols). As the saturation partial pressures of the glycols are relatively low (11 Pa for MEG 7 and <1 Pa for TEG at 20oC [7, 14]), the removal of the glycols from “wet” CTA membranes 8 was not possible by simple drying, but was instead conducted by solvent exchange with 9 methanol prior to drying. Thermogravimetric analysis for the “dry” CTA confirmed that both
10 glycols and methanol were removed totally by this solvent exchange.
11 The selection of methanol as a glycol solvent was based on Hildebrand and Hansen solubility 12 theory, which suggests that effective solubilisation is favoured between components having 13 least heat of sorption per unit volume [31-33]. The approach defines three solubility 14 parameters, a hydrogen bonding component (h), a polar interaction component (p) and a 15 nonpolar interaction component (d). The Hansen solubility parameter is the square root of 16 the sum of squares of these components [31, 33] with similar values indicating good mutual 17 solubility. Specifically, the mutual solubility of components is strongest when the radius of 18 interaction between the Hansen solubility parameters is smallest [31] (Table 2). As a result, 19 the solubility of methanol – glycol mixtures system is more favoured than methanol – CTA 20 or glycol – CTA mixtures. A solubility envelope for CTA polymer was constructed by Klein 21 et al. (1975) based on Hansen’s approach [34] and the liquids utilised in this study are outside 22 the boundary. This further indicates that there will be no dissolution of the CTA polymer into 23 the solutions during the sorption and aging experiments.
24 Table 2 Hildebrand and Hansen solubility parameters of different liquids and CTA [31, 33]
Components MEG MeOH TEG CTAHydrogen bonding components
(h), MPa0.5 26.0 22.3 18.6 11.0
Polar interaction components (p), MPa0.5 11.0 12.3 12.5 12.7
Nonpolar interaction components (d), MPa0.5 17.0 15.1 16.0 18.6
Hansen solubility parameter* ( ), MPa0.5 33.7 29.6 27.5 25.1
Radius of interaction** between components and CTA(Rcomponent - CTA), MPa0.5 15.4 13.3 9.2 0
Radius of interaction** between components and methanol(Rcomponent - methanol), MPa0.5 5.5 0 4.1 13.3
* Hansen solubility parameter , MPa0.5𝛿 = ℎ2 + 𝑝
2 + 𝑑2
** Radius of interaction: ), MPa0.5𝑅𝑖𝑗 = (𝑖ℎ ‒ 𝑗
ℎ)2
+ (𝑖𝑝 ‒ 𝑗
𝑝)2
+ 4(𝑖𝑑 ‒ 𝑗
𝑑)2
25
26
7
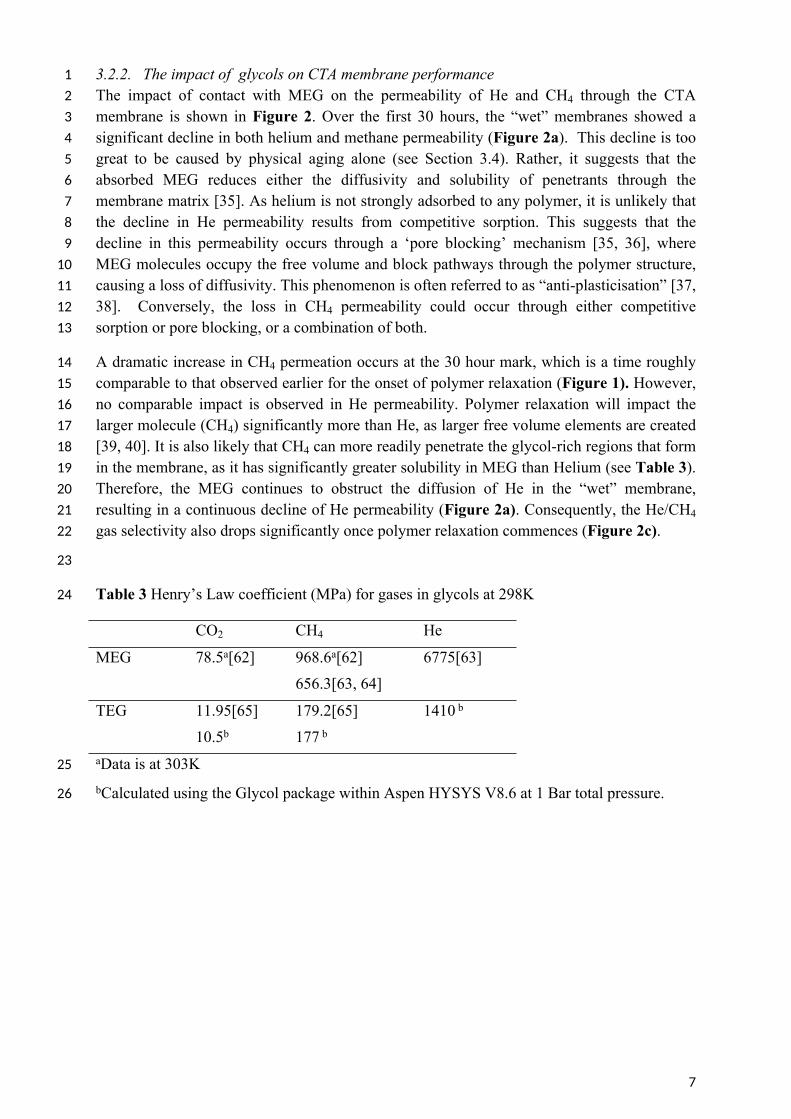
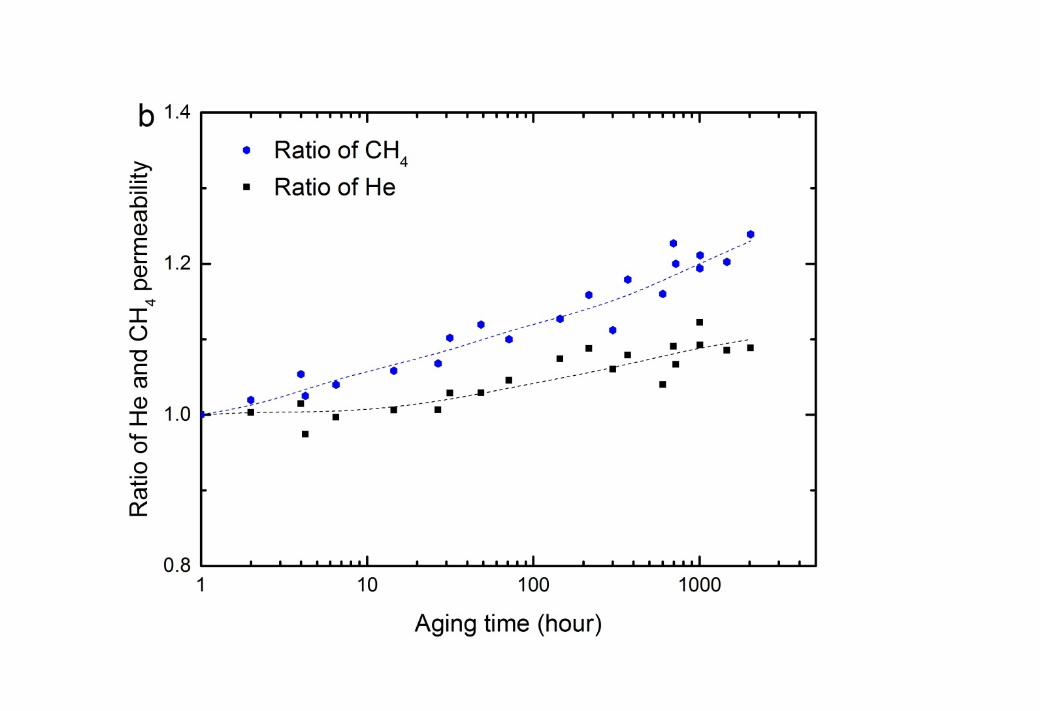
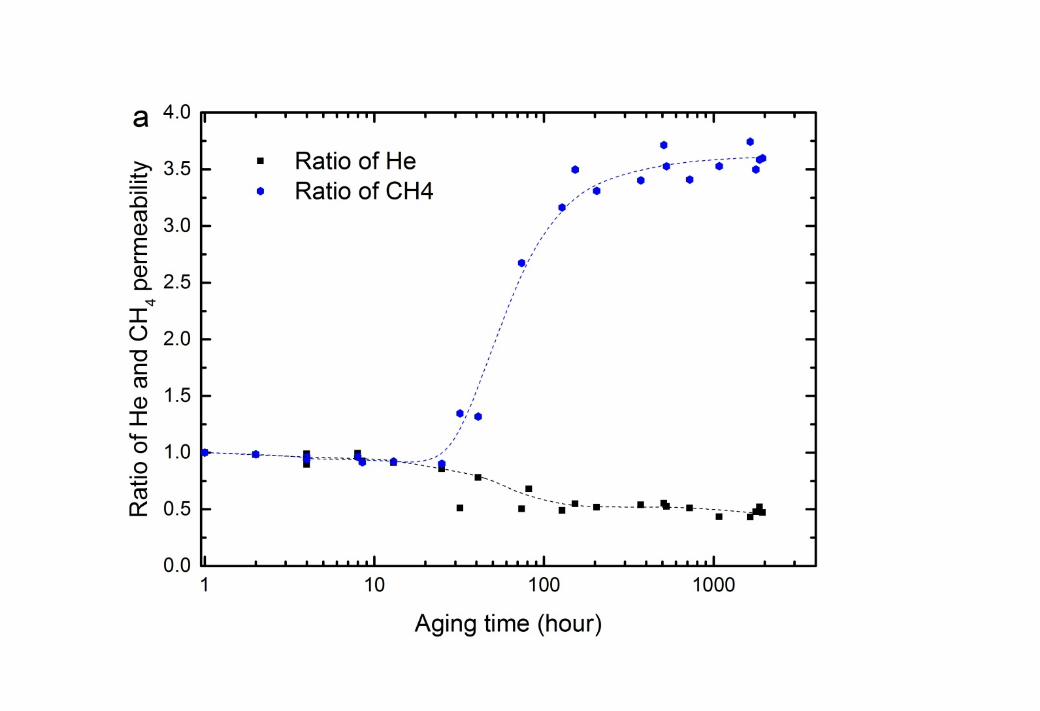
1 3.2.2. The impact of glycols on CTA membrane performance2 The impact of contact with MEG on the permeability of He and CH4 through the CTA 3 membrane is shown in Figure 2. Over the first 30 hours, the “wet” membranes showed a 4 significant decline in both helium and methane permeability (Figure 2a). This decline is too 5 great to be caused by physical aging alone (see Section 3.4). Rather, it suggests that the 6 absorbed MEG reduces either the diffusivity and solubility of penetrants through the 7 membrane matrix [35]. As helium is not strongly adsorbed to any polymer, it is unlikely that 8 the decline in He permeability results from competitive sorption. This suggests that the 9 decline in this permeability occurs through a ‘pore blocking’ mechanism [35, 36], where
10 MEG molecules occupy the free volume and block pathways through the polymer structure, 11 causing a loss of diffusivity. This phenomenon is often referred to as “anti-plasticisation” [37, 12 38]. Conversely, the loss in CH4 permeability could occur through either competitive 13 sorption or pore blocking, or a combination of both.
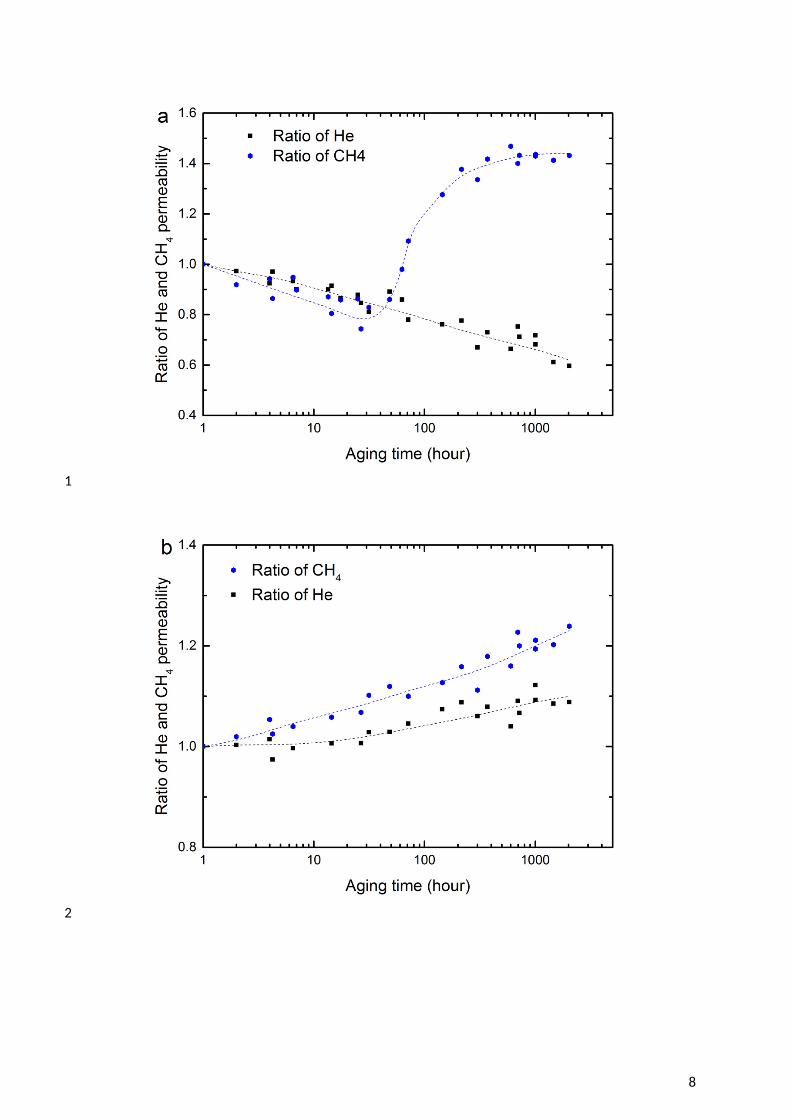
14 A dramatic increase in CH4 permeation occurs at the 30 hour mark, which is a time roughly 15 comparable to that observed earlier for the onset of polymer relaxation (Figure 1). However, 16 no comparable impact is observed in He permeability. Polymer relaxation will impact the 17 larger molecule (CH4) significantly more than He, as larger free volume elements are created 18 [39, 40]. It is also likely that CH4 can more readily penetrate the glycol-rich regions that form 19 in the membrane, as it has significantly greater solubility in MEG than Helium (see Table 3). 20 Therefore, the MEG continues to obstruct the diffusion of He in the “wet” membrane, 21 resulting in a continuous decline of He permeability (Figure 2a). Consequently, the He/CH4 22 gas selectivity also drops significantly once polymer relaxation commences (Figure 2c).
23
24 Table 3 Henry’s Law coefficient (MPa) for gases in glycols at 298K
CO2 CH4 He
MEG 78.5a[62] 968.6a[62]
656.3[63, 64]
6775[63]
TEG 11.95[65]
10.5b
179.2[65]
177 b
1410 b
25 aData is at 303K
26 bCalculated using the Glycol package within Aspen HYSYS V8.6 at 1 Bar total pressure.
8
1
2
9
1
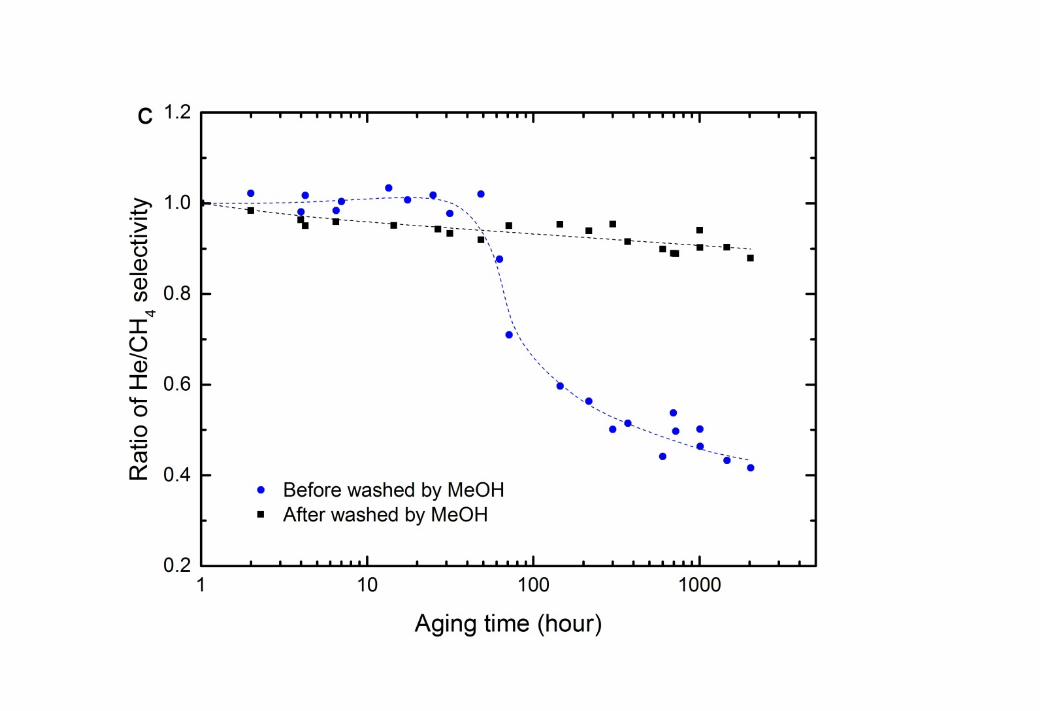
2 Figure 2 Change in permeability of He and CH4 as time progresses at 35oC and 750 kPa feed 3 pressure for CTA membranes: (a) aged in ethylene glycol (MEG) solution at 22oC; (b) aged 4 in MEG and washed by methanol for 168 hours at 22oC; and (c) He/CH4 selectivity. The 5 dashed lines are added to guide the eye.
6
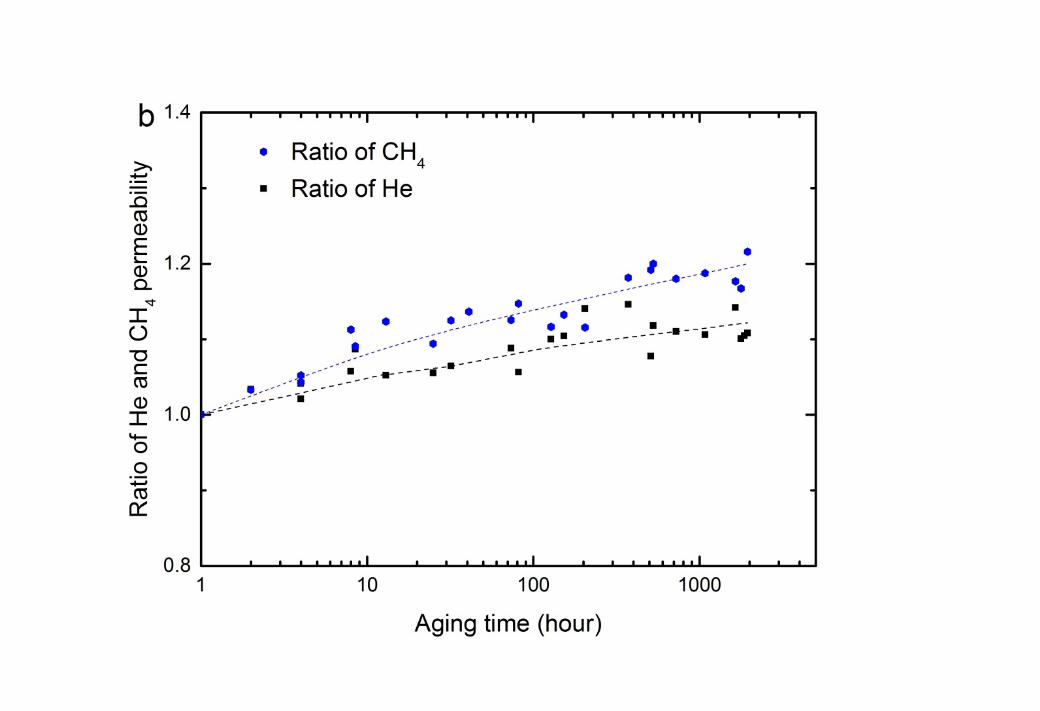
7 After extracting MEG from the CTA membrane with methanol, both He and CH4 show a 8 small, but significant increase in permeability with time (Figure 2b). The increase is greater 9 for the larger CH4 than for He, again suggesting that it is caused by a net increase in free
10 volume. This implies that even after the complete removal of the glycol, the polymer 11 structure is not fully recovered from the effects of polymer relaxation. This result is also 12 supported by a decrease in the density of the “dry” membranes after aging in glycols in 13 comparison with fresh CTA (Table 4).
14 Table 4 Density of CTA membranes before and after aging in glycol and methanol.
Density (g/ml)
Glycols “Dry” CTA membranes after aging in glycols for
2000 hours
“Dry” CTA membranes after aging in methanol
for 550 hours
Original CTA membranes
MEG 1.277 ± 0.008
TEG 1.270 ± 0.0101.297 ± 0.003 1.299 ± 0.001
15
10
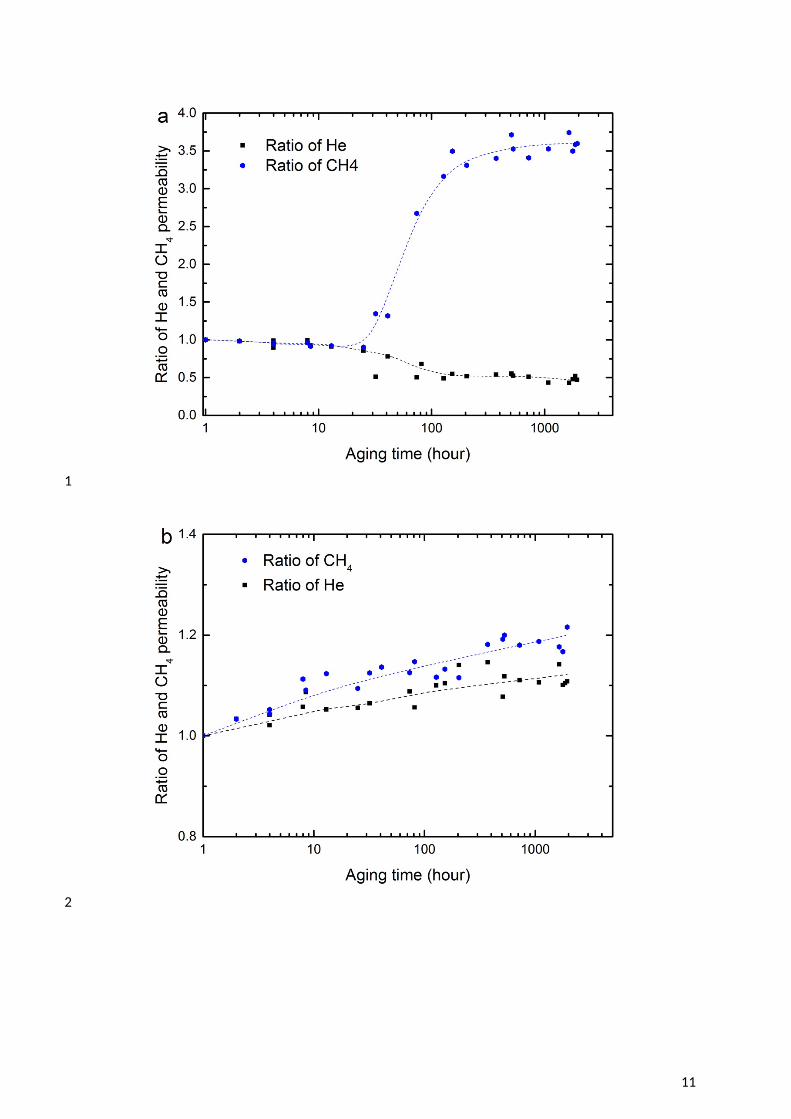
1 Control membranes aged in methanol alone did not show the same increase in permeability 2 with time (Supporting information, Fig. S1). Methanol has been reported to plasticise CTA 3 in a pervaporation study [41], but the effect is minimal here, relative to the greater impact of 4 the glycol exposure.
5 The impact of TEG on the CTA membrane was also studied as shown in Figure 3. The trends 6 in performance are identical, with the magnitude significantly greater. This reflects the higher 7 solubility of TEG in CTA (Table 1) and in turn, the higher solubility of CH4 in TEG (Table 8 3).
11
1
2

12
1
2 Figure 3 Change in permeability of He and CH4 as time progresses at 35oC and 750 kPa feed 3 pressure for CTA membranes: (a) aged in triethylene glycol (TEG) solution at 22oC; (b) aged 4 in TEG and washed by methanol for 168 hours at 22oC; and (c) He/CH4 selectivity. The 5 dashed lines are added to guide the eye.
6 It is notable that the permeability enhancement after removal of the glycols with methanol is 7 quite similar, at around 10% over the aging period. The plasticising effect of TEG on the 8 CTA membrane is likely stronger than MEG given the lower Hansen radius of interaction for 9 the TEG – CTA pair (Table 2). However, there are fewer moles of TEG absorbed per unit of
10 CTA membrane and the solution uptake is slower (Figure 1b), meaning that the effective 11 plasticising molar concentration is lower at any given time during the aging process. All these 12 aspects result in the similar plasticisation effect of TEG and MEG on the CTA membrane.
13
14 3.2.3. The impact of glycols on CO2 permeation through CTA membrane
15 The impacts of MEG and TEG on the permeation of CO2 were also studied by testing the 16 permeability of CO2 with 200 kPa feed pressure (Table 5). The feed pressure was selected to 17 prevent CO2 – induced plasticisation which can occur between 500 – 1200 kPa CO2 pressure 18 depending upon the degree of acetylation, membrane thickness and testing temperature [39, 19 42, 43]. In general, the impact of glycols on CO2 permeation is similar to the impact on CH4. 20 The absorption of glycols into membranes enhanced the permeability of CO2 and the impact 21 was more significant in membranes aged in TEG. In addition, the CO2 permeability through 22 the “dry” membranes was also enhanced due to the residual plasticisation arising from the 23 glycol absorption.
13
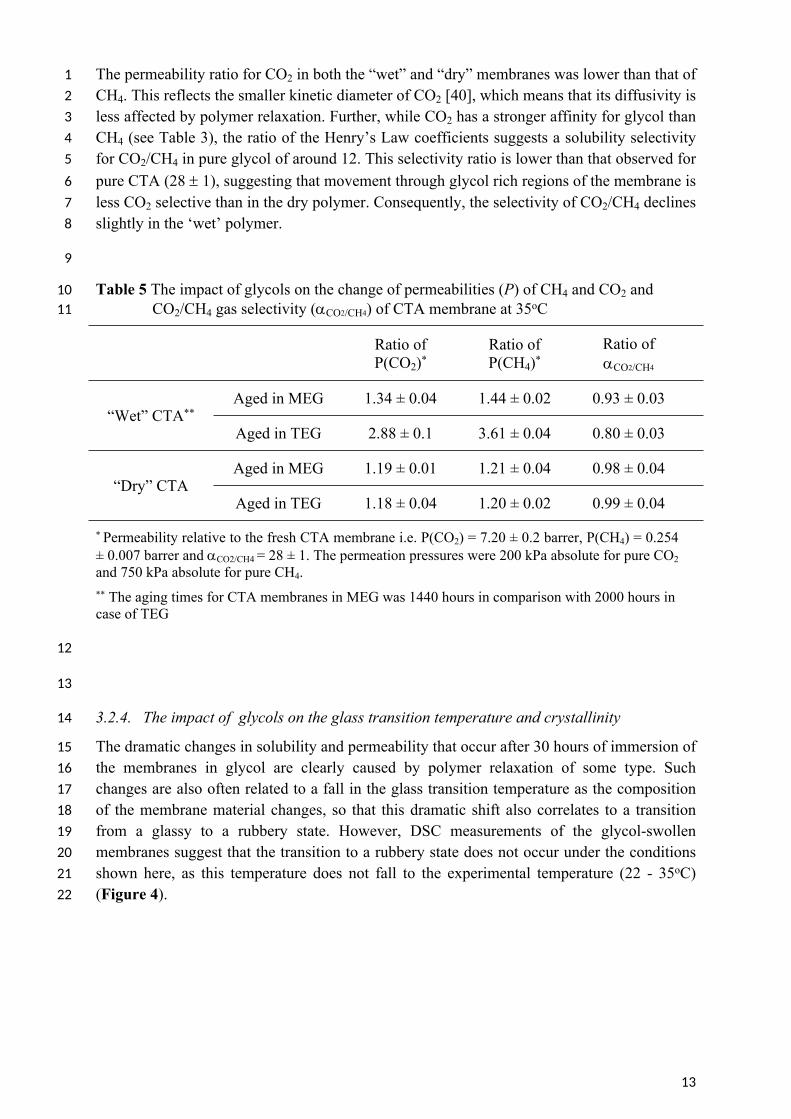
1 The permeability ratio for CO2 in both the “wet” and “dry” membranes was lower than that of 2 CH4. This reflects the smaller kinetic diameter of CO2 [40], which means that its diffusivity is 3 less affected by polymer relaxation. Further, while CO2 has a stronger affinity for glycol than 4 CH4 (see Table 3), the ratio of the Henry’s Law coefficients suggests a solubility selectivity 5 for CO2/CH4 in pure glycol of around 12. This selectivity ratio is lower than that observed for 6 pure CTA (28 1), suggesting that movement through glycol rich regions of the membrane is 7 less CO2 selective than in the dry polymer. Consequently, the selectivity of CO2/CH4 declines 8 slightly in the ‘wet’ polymer.
9
10 Table 5 The impact of glycols on the change of permeabilities (P) of CH4 and CO2 and 11 CO2/CH4 gas selectivity (CO2/CH4) of CTA membrane at 35oC
Ratio of P(CO2)*
Ratio of P(CH4)*
Ratio of CO2/CH4
Aged in MEG 1.34 ± 0.04 1.44 ± 0.02 0.93 ± 0.03“Wet” CTA**
Aged in TEG 2.88 ± 0.1 3.61 ± 0.04 0.80 ± 0.03
Aged in MEG 1.19 ± 0.01 1.21 ± 0.04 0.98 ± 0.04“Dry” CTA
Aged in TEG 1.18 ± 0.04 1.20 ± 0.02 0.99 ± 0.04
* Permeability relative to the fresh CTA membrane i.e. P(CO2) = 7.20 ± 0.2 barrer, P(CH4) = 0.254 ± 0.007 barrer and CO2/CH4 = 28 ± 1. The permeation pressures were 200 kPa absolute for pure CO2 and 750 kPa absolute for pure CH4.** The aging times for CTA membranes in MEG was 1440 hours in comparison with 2000 hours in case of TEG
12
13
14 3.2.4. The impact of glycols on the glass transition temperature and crystallinity
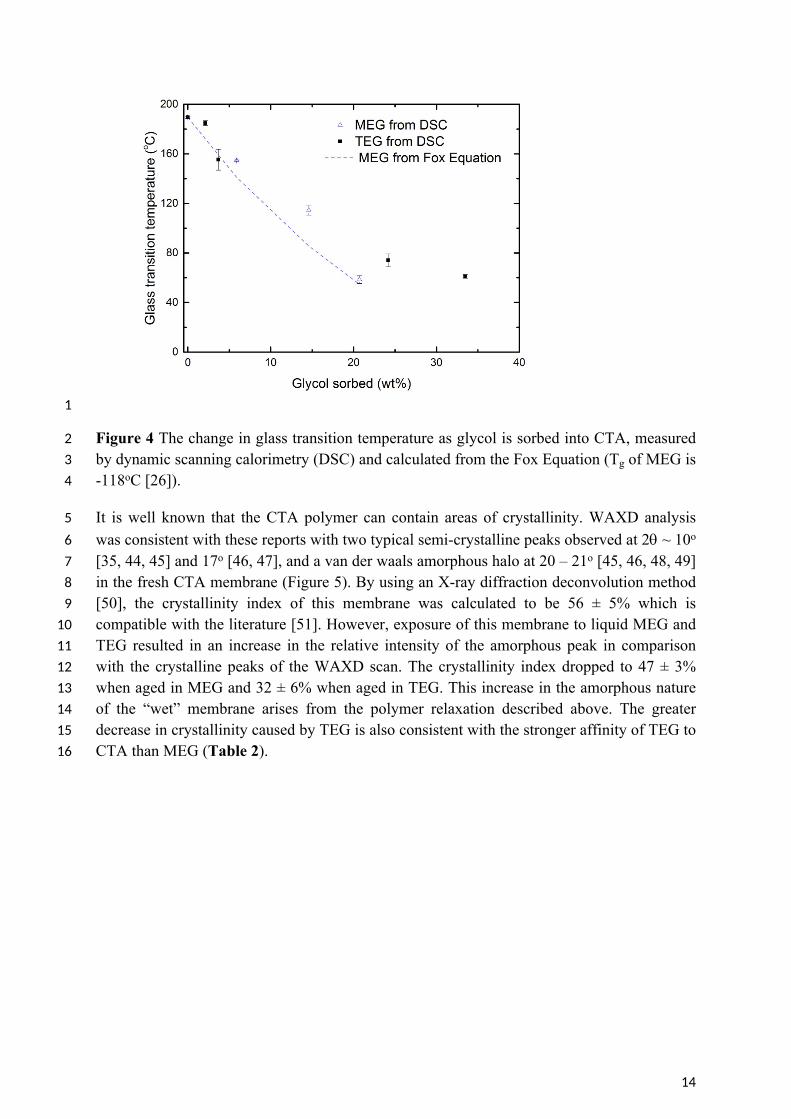
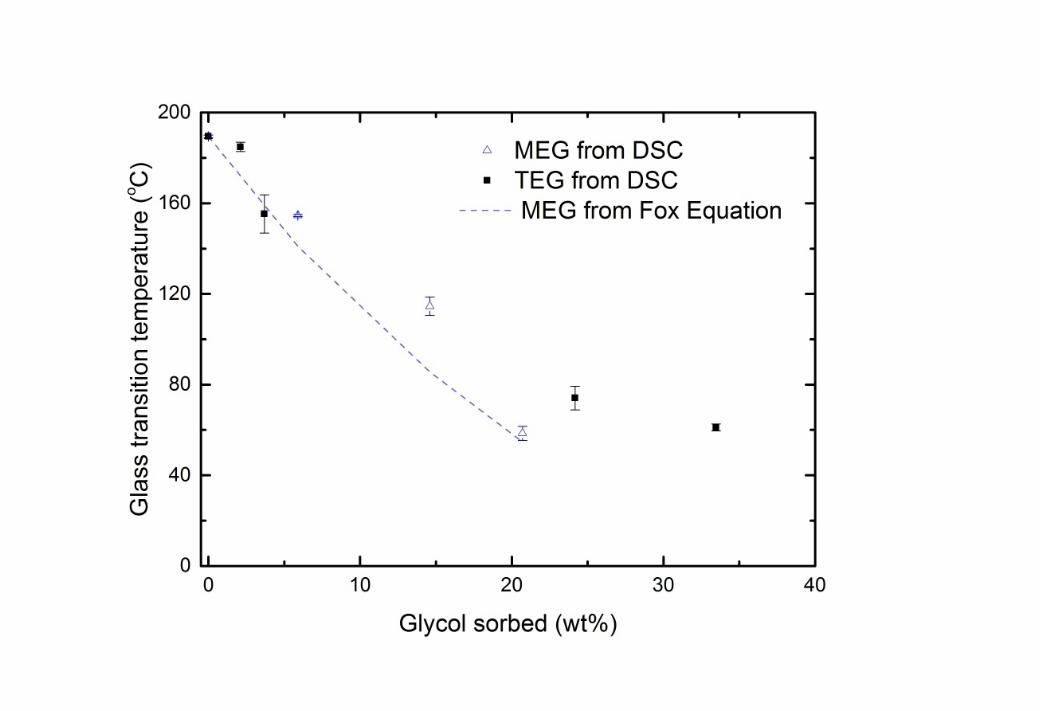
15 The dramatic changes in solubility and permeability that occur after 30 hours of immersion of 16 the membranes in glycol are clearly caused by polymer relaxation of some type. Such 17 changes are also often related to a fall in the glass transition temperature as the composition 18 of the membrane material changes, so that this dramatic shift also correlates to a transition 19 from a glassy to a rubbery state. However, DSC measurements of the glycol-swollen 20 membranes suggest that the transition to a rubbery state does not occur under the conditions 21 shown here, as this temperature does not fall to the experimental temperature (22 - 35oC) 22 (Figure 4).
14
1
2 Figure 4 The change in glass transition temperature as glycol is sorbed into CTA, measured 3 by dynamic scanning calorimetry (DSC) and calculated from the Fox Equation (Tg of MEG is 4 -118oC [26]).
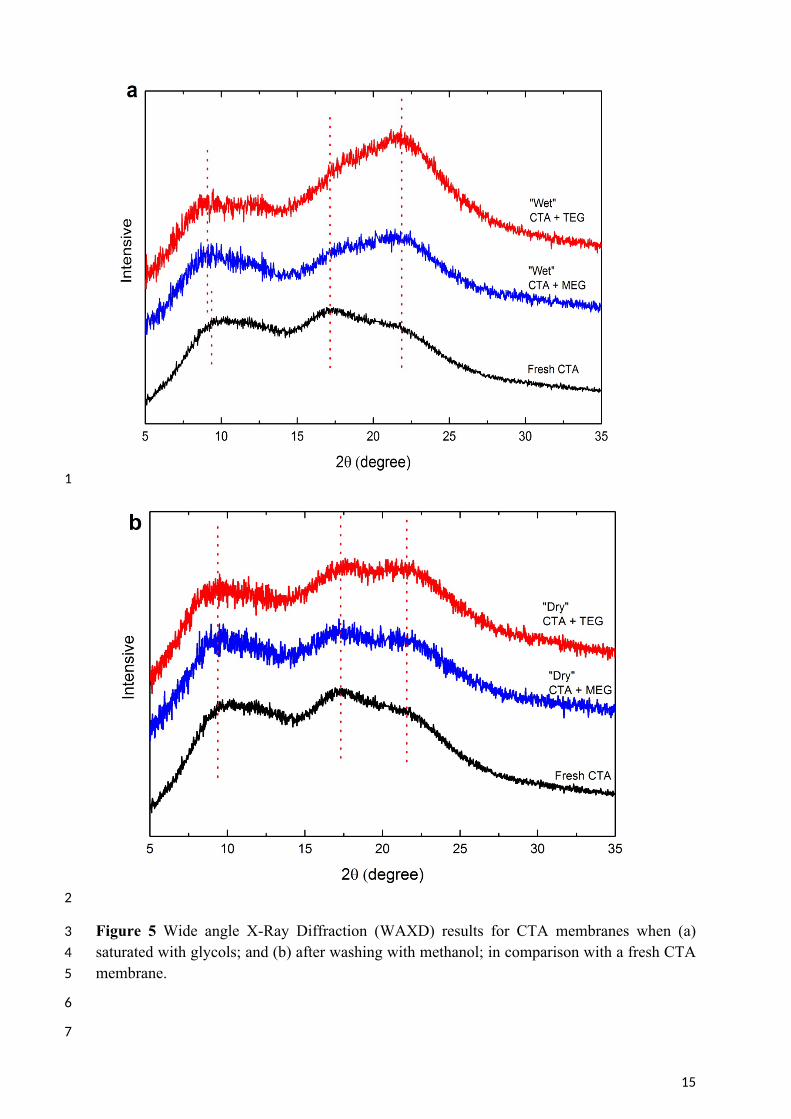
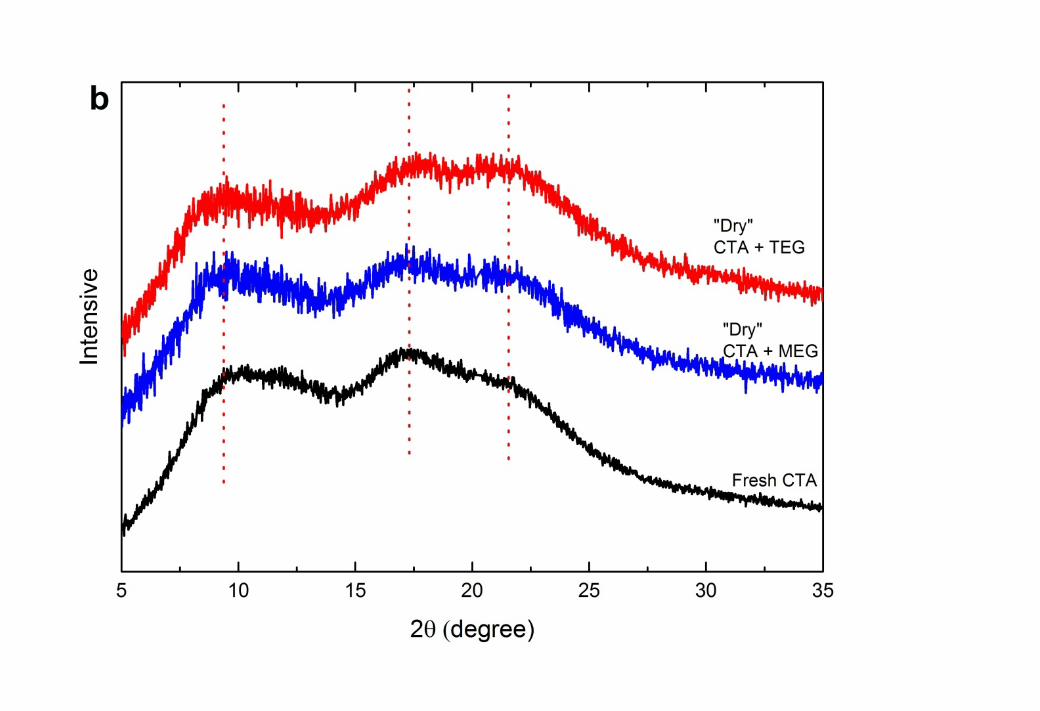
5 It is well known that the CTA polymer can contain areas of crystallinity. WAXD analysis 6 was consistent with these reports with two typical semi-crystalline peaks observed at 2 ~ 10o 7 [35, 44, 45] and 17o [46, 47], and a van der waals amorphous halo at 20 – 21o [45, 46, 48, 49] 8 in the fresh CTA membrane (Figure 5). By using an X-ray diffraction deconvolution method 9 [50], the crystallinity index of this membrane was calculated to be 56 ± 5% which is
10 compatible with the literature [51]. However, exposure of this membrane to liquid MEG and 11 TEG resulted in an increase in the relative intensity of the amorphous peak in comparison 12 with the crystalline peaks of the WAXD scan. The crystallinity index dropped to 47 ± 3% 13 when aged in MEG and 32 ± 6% when aged in TEG. This increase in the amorphous nature 14 of the “wet” membrane arises from the polymer relaxation described above. The greater 15 decrease in crystallinity caused by TEG is also consistent with the stronger affinity of TEG to 16 CTA than MEG (Table 2).
15
1
2
3 Figure 5 Wide angle X-Ray Diffraction (WAXD) results for CTA membranes when (a) 4 saturated with glycols; and (b) after washing with methanol; in comparison with a fresh CTA 5 membrane.
6
7
16
1 After removal of the glycols by methanol, the relative intensity of the amorphous peak 2 reduced again and the crystallinity index recovered to 53 ± 1% and 50 ± 3% for membranes 3 aged in MEG and TEG, respectively. Again, the lower crystallinity of “dry” membranes in 4 comparison with fresh CTA confirmed the partial recovery of the polymer as concluded in 5 section 3.2.2.
6
7 3.3. Permeation of hydrogen sulphide on CTA membrane
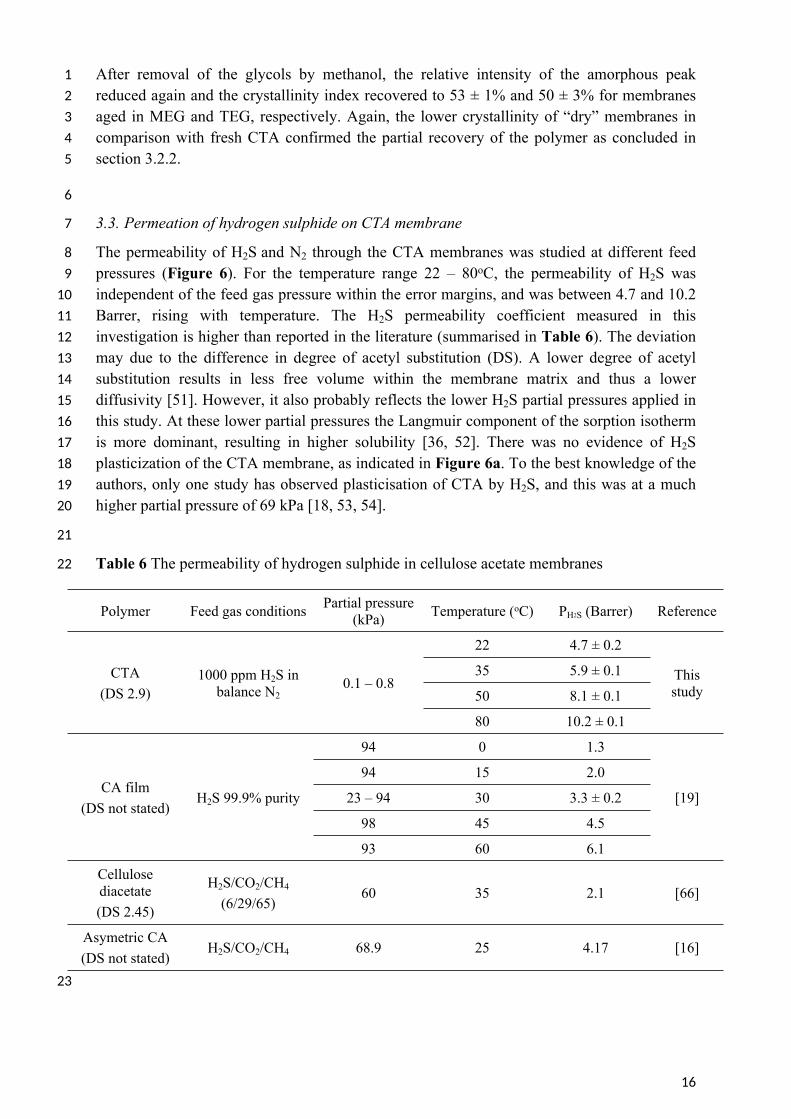
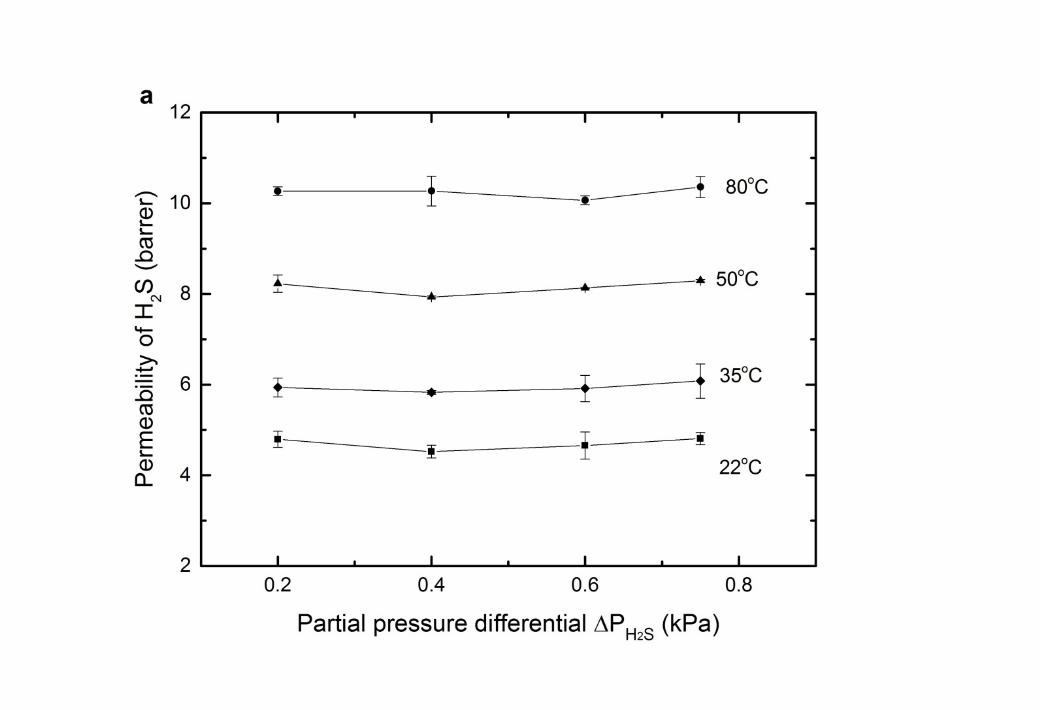
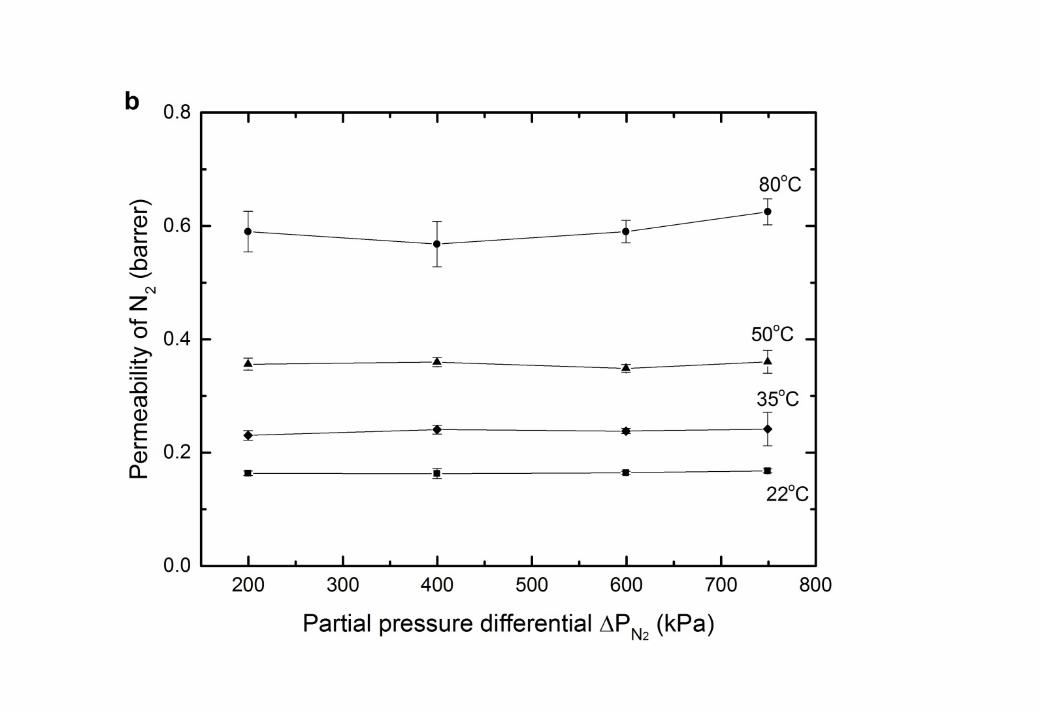
8 The permeability of H2S and N2 through the CTA membranes was studied at different feed 9 pressures (Figure 6). For the temperature range 22 – 80oC, the permeability of H2S was
10 independent of the feed gas pressure within the error margins, and was between 4.7 and 10.2 11 Barrer, rising with temperature. The H2S permeability coefficient measured in this 12 investigation is higher than reported in the literature (summarised in Table 6). The deviation 13 may due to the difference in degree of acetyl substitution (DS). A lower degree of acetyl 14 substitution results in less free volume within the membrane matrix and thus a lower 15 diffusivity [51]. However, it also probably reflects the lower H2S partial pressures applied in 16 this study. At these lower partial pressures the Langmuir component of the sorption isotherm 17 is more dominant, resulting in higher solubility [36, 52]. There was no evidence of H2S 18 plasticization of the CTA membrane, as indicated in Figure 6a. To the best knowledge of the 19 authors, only one study has observed plasticisation of CTA by H2S, and this was at a much 20 higher partial pressure of 69 kPa [18, 53, 54].
21
22 Table 6 The permeability of hydrogen sulphide in cellulose acetate membranes
Polymer Feed gas conditions Partial pressure (kPa) Temperature (oC) PH2S (Barrer) Reference
22 4.7 ± 0.2
35 5.9 ± 0.1
50 8.1 ± 0.1CTA
(DS 2.9)1000 ppm H2S in
balance N20.1 – 0.8
80 10.2 ± 0.1
This study
94 0 1.3
94 15 2.0
23 – 94 30 3.3 ± 0.2
98 45 4.5
CA film(DS not stated)
H2S 99.9% purity
93 60 6.1
[19]
Cellulose diacetate(DS 2.45)
H2S/CO2/CH4
(6/29/65)60 35 2.1 [66]
Asymetric CA(DS not stated)
H2S/CO2/CH4 68.9 25 4.17 [16]
23
17
1
2
18
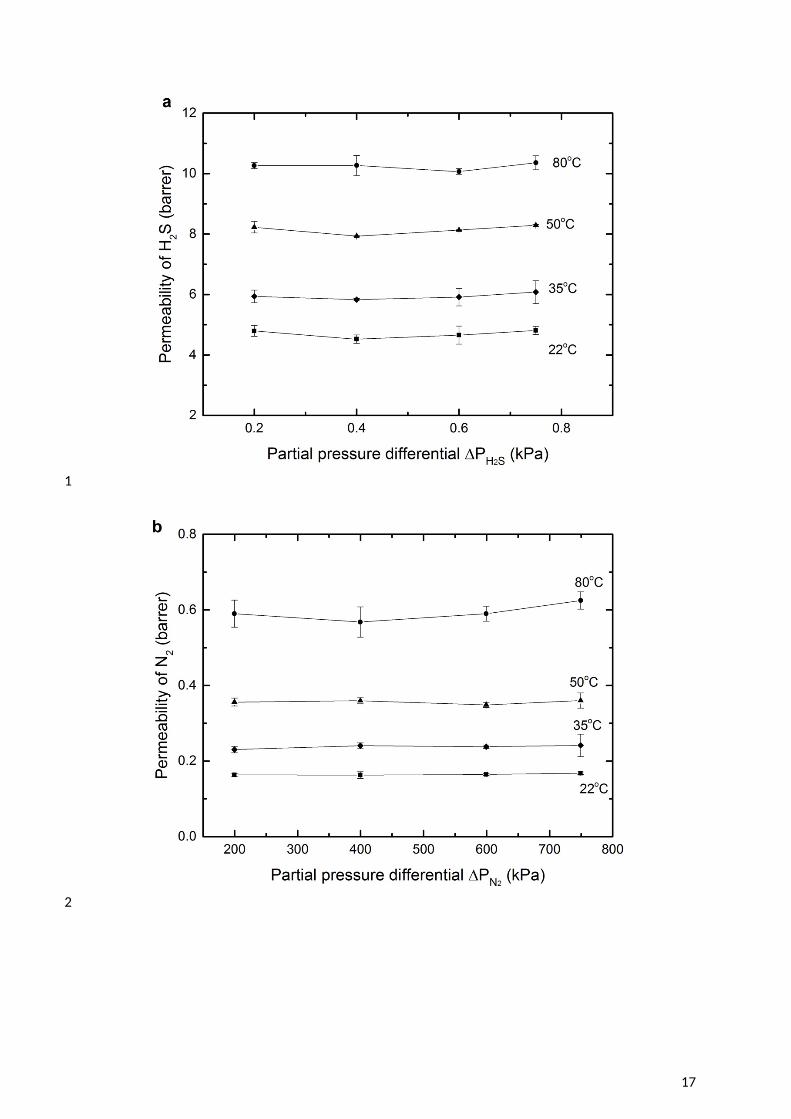
12 Figure 6 Gas permeability in CTA membranes with a feed gas of 1000ppm H2S in balance 3 N2 (a) permeability of H2S; (b) permeability of N2; (c) H2S/N2 gas selectivity.
45 The permeability of nitrogen was also independent of feed pressure, indicative of standard 6 behaviour for this inert gas (Figure 6b). The H2S/N2 gas selectivity (Figure 6c) showed the 7 favourable permeation of H2S in the membrane over N2. Similar phenomena has been 8 observed when introducing H2S – N2 gases through other glassy polymers, such as 9 polysulfone and cyclic perfluoroether [55]. This is due to the higher critical temperature of
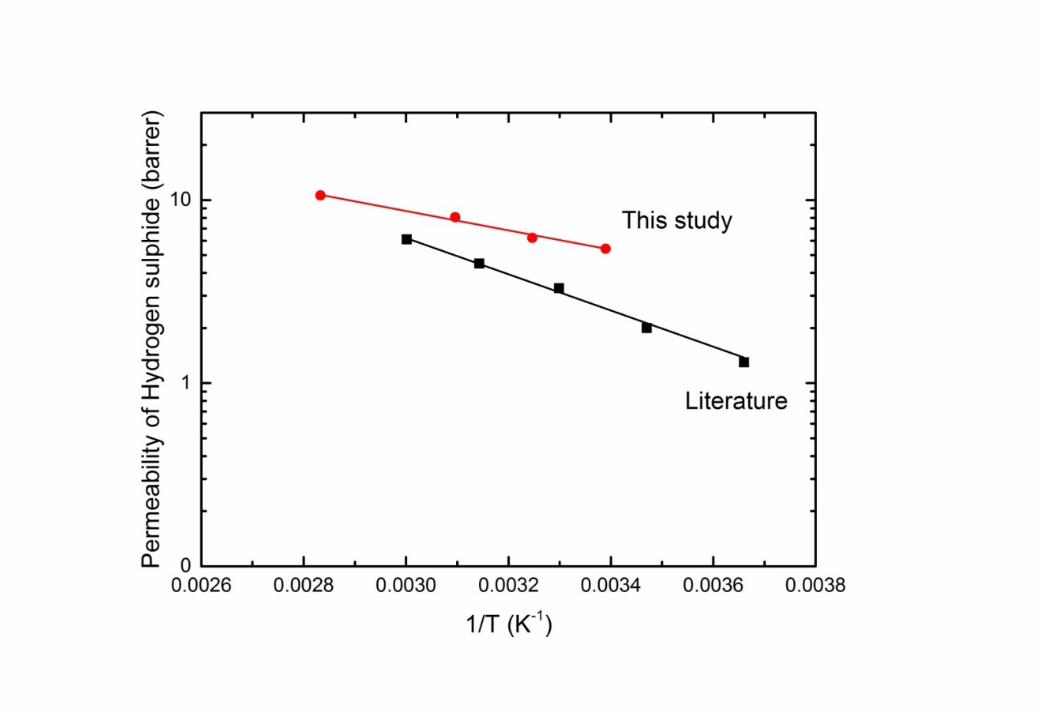
10 H2S which results in greater solubility. 1112 The permeability coefficients of H2S and N2 at a zero partial pressure differential (pi 0 13 kPa) were extrapolated from the data presented in Figure 6. This enables the activation 14 energy for permeation (EP) to be determined (Table 7). The positive values of EP for all gas 15 species in this investigation suggest that diffusivity is dominant over solubility [56]. 16 Furthermore, the activation energy is higher for the gas species with lower critical 17 temperature (lower gas sorption), again reflecting a lower heat of sorption [57, 58].
18 Table 7 Activation energy for permeation in CTA membrane at zero pressure
CH4* N2 CO2
* H2S SO2*
Kinetic diameter (Å) [67] 3.80 3.64 3.30** 3.60 3.60Critical temperature (K) [68] 190.6 126.2 304.2 373.2 430.8
Activation energy for permeation, Ep (kJ/mol)
18.6± 0.2
18.7 ± 2
8.5 ± 0.7
10.1 ± 0.7
7.3 ± 0.7
19 * The permeability of methane and carbon dioxide were reported in a previous study [21]20 ** Some recent studies argue that the kinetic diameter of CO2 relevant to diffusion could be larger at 3.43 – 3.63 21 Å [40, 69, 70]

19
1 Heilman et al. reported an activation energy for H2S permeation of 19 kJ/mol [19] when 2 operating with a feed pressure of 94 kPa in comparison with 10.1 kJ/mol calculated in this 3 study (Figure 7). Again, the deviation may be due to differences in both degree of acetylation 4 and operating pressures.
56 Figure 7 The permeability coefficients of H2S as a function of temperature at zero partial 7 pressure differential (this study) and 94 kPa (Heilman et al.[19])
89 3.4. Long-term aging of CTA membrane in H2S
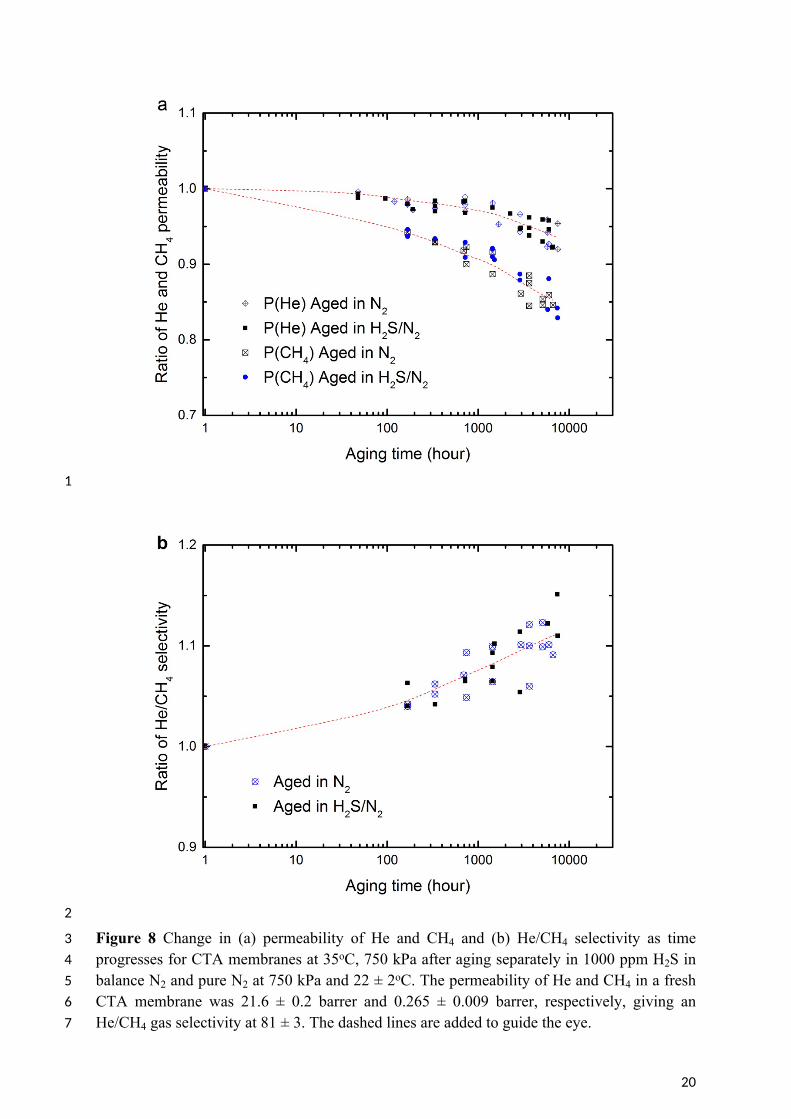
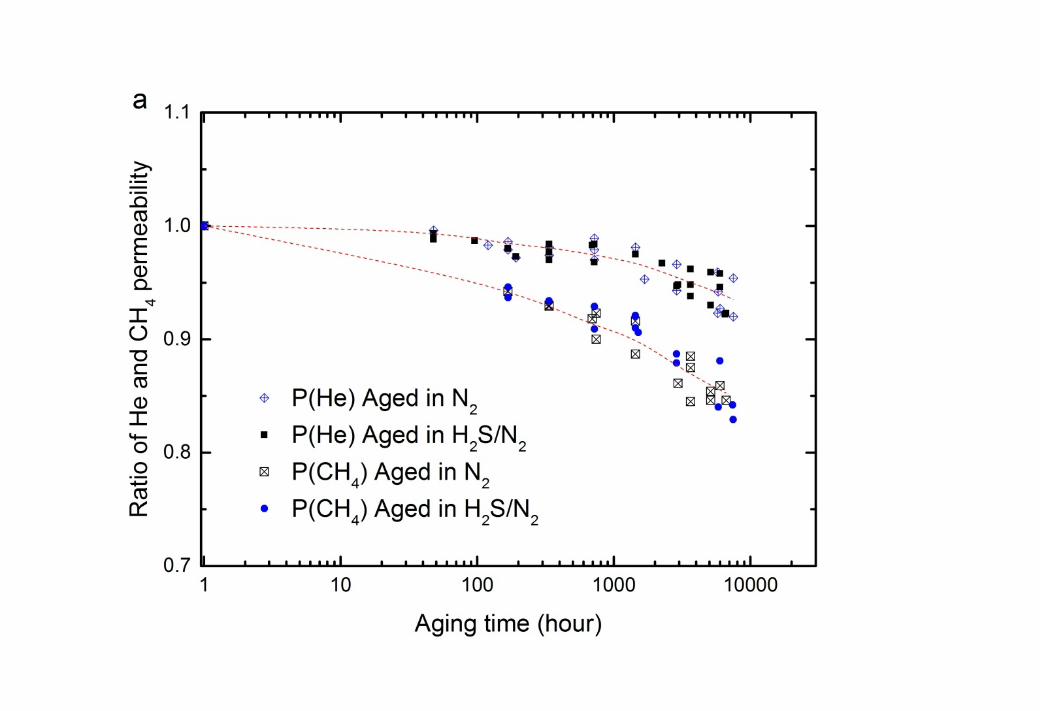
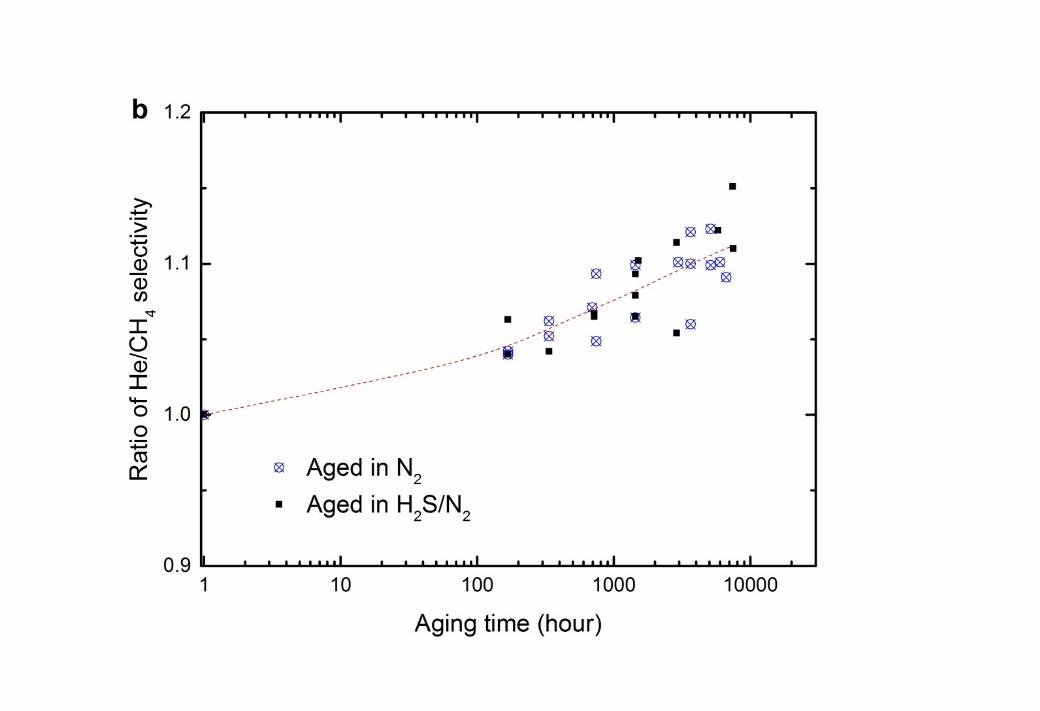
10 The long-term impact of H2S on CTA membranes was studied by aging the membranes 11 separately in 1000 ppm H2S in balance N2 and in pure N2. After a specified aging period up 12 to 7200 hours, the membranes were tested for the permeation of pure He and CH4 at 35oC and 13 750 kPa absolute feed pressure. To reduce the variability between membrane samples, the 14 change of permeability and selectivity of the aged membranes as time progresses is expressed 15 as the ratio of permeability and He/CH4 selectivity of the aged membranes to the original 16 fresh membrane (Figure 8).
20
1
2
3 Figure 8 Change in (a) permeability of He and CH4 and (b) He/CH4 selectivity as time 4 progresses for CTA membranes at 35oC, 750 kPa after aging separately in 1000 ppm H2S in 5 balance N2 and pure N2 at 750 kPa and 22 ± 2oC. The permeability of He and CH4 in a fresh 6 CTA membrane was 21.6 ± 0.2 barrer and 0.265 ± 0.009 barrer, respectively, giving an 7 He/CH4 gas selectivity at 81 ± 3. The dashed lines are added to guide the eye.

21
1 Gas permeability generally falls with time due to the densification of membrane matrix as 2 observed in Figure 8a and in other studies [21, 56, 59, 60]. As observed in section 3.2.2, the 3 changes in free volume impact most the penetrant of larger kinetic diameter (CH4) [21, 56, 4 59]. Consequently, the He/CH4 selectivity is enhanced during aging as indicated in Figure 5 8b.
6 Figure 8 showed that the aging process of CTA membranes was not affected by the presence 7 of 0.75 kPa partial pressure of H2S. This is consistent with the H2S permeability result in 8 Figure 6, where no plasticisation is observed for these partial pressures of H2S on the CTA 9 membranes at the same pressure and temperature. The partial pressure of H2S in a natural gas
10 sweetening process is typically 0.02 – 3 kPa (assuming 30 bar operating pressure) [15], which 11 is much lower than the plasticisation pressure for H2S, observed to be up to 69 kPa in the 12 presence of CO2 [18, 54]. This result is confirmed by the present work.
13
14 4. Conclusions
15 The impact of glycols on dense CTA membranes has been studied for up to 2000 hours. The 16 absorption of ethylene glycol and triethylene glycol into the CTA membrane enhanced the 17 permeation of CH4 and CO2 through the wet membranes but resulted in a gradual decline in 18 the permeation of He. This reflected relaxation of the polymer structure. In particular, 19 WAXD analysis confirmed that a significant loss of crystallinity occurred during exposure to 20 these glycols, providing more accessible free volume in the structure. Methane and CO2 were 21 able to move through the glycol-rich regions within the swollen membrane, whereas these 22 regions blocked the movement of He. It should be noted that the changes in free volume 23 observed here, while similar in magnitude, are expected to occur much faster in the thinner 24 active layers (<1 micron) used in industrial membrane systems [59, 61].
25 Importantly, the use of a methanol wash was able to reverse these effects, with only small 26 residual swelling observed after removal of the glycol. The use of such a methanol wash may 27 be an important mitigation strategy when glycol overflow into the membrane unit occurs in 28 industrial practice. However, it would require careful application to prevent a collapse of the 29 structure of the porous support layer of the membrane during methanol removal due to 30 surface tension effects.
31 This study has also shown that cellulose triacetate membranes are stable upon exposure to 32 0.75 kPa H2S for up to 7200 hours. No plasticisation was observed after aging the membranes 33 at 0.75 kPa H2S and 22oC for 7200 hours. However, it should be noted that in many 34 applications of CTA in natural gas sweetening, the H2S partial pressures are considerably 35 higher than studied here and the onset of plasticisation cannot be discounted in such 36 scenarios.
37
38 Acknowledgements
39 The authors would like to acknowledge the funding support for this research project from The 40 University of Melbourne, Particulate and Fluid Processing Centre (PFPC), the Peter Cook 41 Centre for Carbon Capture and Storage Research at the University of Melbourne and Brown 42 Coal Innovation Australia (BCIA). The X-ray diffraction anlaysis was performed within the

22
1 Materials Characterisation and Fabrication Platform (MCFP) at the University of Melbourne 2 and the Victorian Node of the Australian National Fabrication Facility (ANFF). The 3 specialist gas infrastructure was funded by the Australian Research Council (LE120100141) 4 and by the Australian Government Education Investment fund and this support is also 5 gratefully acknowledged.
6
7 References
8 1. Cole, W.J., K.B. Medlock Iii, and A. Jani, A view to the future of natural gas and 9 electricity: An integrated modeling approach. Energy Economics.
10 2. Wang, M., et al., Post-combustion CO2 capture with chemical absorption: A state-of-11 the-art review. Chemical Engineering Research and Design, 2011. 89(9): p. 1609-12 1624.13 3. Baker, R.W., Membrane Technology and Applications. 2nd Ed. 2004, California, 14 U.S.: John Wiley & Sons Ltd.15 4. Henis, J.M.S. and M.K. Tripodi, A Novel Approach to Gas Separation Using 16 Composite Hollow Fiber Membranes. Separation Science and Technology, 1980. 15: 17 p. 1059.18 5. Løkken, T., et al. Water content of high pressure natural gas: data, prediction and 19 experience from field. in IGRC (International Gas Union Research Conference). 20 2008.21 6. Anderson, C.J., et al., The performance of carbon membranes in the presence of 22 condensable and non-condensable impurities. Journal of Membrane Science, 2011. 23 378(1–2): p. 117-127.24 7. Kohl, A.L. and R.B. Nielsen, Chapter 11 - Absorption of Water Vapor by 25 Dehydrating Solutions, in Gas Purification (Fifth Edition). 1997, Gulf Professional 26 Publishing: Houston. p. 946-1021.27 8. Lokhandwala, K.A., R.W. Baker, and K.D. Amo, Sour gas treatment process. 1995, 28 Membrane Technology and Research, Inc., Menlo Park, California.29 9. Gavlin, G. and B. Goltsin, Gas dehydration process. 1998, Gas Research Institute. 30 Chicago. Illinois.31 10. MEGlobal. Ethylene Glycol - Product Guide. 2008 [cited 2014 9-Oct]; Available 32 from: http://www.meglobal.biz/media/product_guides/MEGlobal_MEG.pdf.33 11. DOW. Triethylene glycol. 2017 [cited 2017 9-May]; Available from: 34 http://www.meglobal.biz/media/product_guides/MEGlobal_MEG.pdf.35 12. Sata, T., K. Mine, and K. Matsusaki, Change in Transport Properties of Anion-36 Exchange Membranes in the Presence of Ethylene Glycols in Electrodialysis. Journal 37 of Colloid and Interface Science, 1998. 202(2): p. 348-358.38 13. Lokhandwala, K., A. Jariwala, and M. Malsam. High Performance Contaminant 39 Resistant Membranes Minimize Pretreatment and Improve CO2 Removal Economics. 40 in The 57th Laurance Reid Gas Conditioning Conference. 2007. Norman, OK.41 14. Washim Uddin, M. and M.-B. Hägg, Effect of monoethylene glycol and triethylene 42 glycol contamination on CO2/CH4 separation of a facilitated transport membrane for 43 natural gas sweetening. Journal of Membrane Science, 2012. 423–424(0): p. 150-158.44 15. Lokhandwala, K.A., R.W. Baker, and K.D. Amo, Sour gas treatment process. 1995, 45 Google Patents.46 16. Funk, E., S. Kulkarni, and A. Swamikannu. Effect of impurities on cellulose acetate 47 membrane performance. in Recent Adv. in Separation Tech. AIChE Symposium 48 Series. 1986.
23
1 17. Bhide, B.D. and S.A. Stern, Membrane processes for the removal of acid gases from 2 natural gas. I. Process configurations and optimization of operating conditions. 3 Journal of Membrane Science, 1993. 81(3): p. 209-237.4 18. Li, N.N., et al., Membrane separation processes in the petrochemicalindustry: Phase 5 II, in Final Report for U.S. Department of Energy. 1987, Allied-Signal: Des Plaines, 6 IL.7 19. Heilman, W., et al., Permeability of Polymer Films to Hydrogen Sulfide Gas. 8 Industrial & Engineering Chemistry, 1956. 48(4): p. 821-824.9 20. Chen, G.Q., et al., Water vapor permeation in polyimide membranes. Journal of
10 Membrane Science, 2011. 379: p. 479-487.11 21. Lu, H.T., et al., The potential for use of cellulose triacetate membranes in post 12 combustion capture. International Journal of Greenhouse Gas Control, 2016. 55: p. 13 97-104.14 22. Duthie, X., et al., Operating temperature effects on the plasticization of polyimide gas 15 separation membranes. Journal of Membrane Science, 2007. 294(1–2): p. 40-49.16 23. Fox, T.G.B., Influence of diluent and of copolymer composition on the glass 17 temperature of a polymer system. Am. Phys. Soc., 1956. 1: p. 123-125.18 24. Marcilla, A. and M. BeltrÁN, 5 - MECHANISMS OF PLASTICIZERS ACTION A2 - 19 Wypych, George, in Handbook of Plasticizers (Second Edition). 2012, William 20 Andrew Publishing: Boston. p. 119-133.21 25. Kamide, K. and M. Saito, Thermal Analysis of Cellulose Acetate Solids with Total 22 Degrees of Substitution of 0.49, 1.75, 2.46, and 2.92. Polym J, 1985. 17(8): p. 919-23 928.24 26. Angell, C.A., J.M. Sare, and E.J. Sare, Glass transition temperatures for simple 25 molecular liquids and their binary solutions. The Journal of Physical Chemistry, 26 1978. 82(24): p. 2622-2629.27 27. Harogoppad, S.B. and T.M. Aminabhavi, Diffusion and sorption of organic liquids 28 through polymer membranes. 5. Neoprene, styrene-butadiene-rubber, ethylene-29 propylene-diene terpolymer, and natural rubber versus hydrocarbons (C8-C16). 30 Macromolecules, 1991. 24(9): p. 2598-2605.31 28. Wessling, M., et al., Dilation kinetics of glassy, aromatic polyimides induced by 32 carbon dioxide sorption. Journal of Polymer Science Part B: Polymer Physics, 1995. 33 33(9): p. 1371-1384.34 29. Kesting, R.E. and A. Fritzsche, Membrane Polymers, in Polymeric gas separation 35 membranes. 1993, Wiley-Interscience: New York.36 30. Immergut, E.H. and H.F. Mark, Principles of Plasticization, in Plasticization and 37 Plasticizer Processes. 1965, American Chemical Society. p. 1-26.38 31. Archer, W.L., Determination of Hansen solubility parameters for selected cellulose 39 ether derivatives. Industrial & Engineering Chemistry Research, 1991. 30(10): p. 40 2292-2298.41 32. Belmares, M., et al., Hildebrand and Hansen solubility parameters from Molecular 42 Dynamics with applications to electronic nose polymer sensors. Journal of 43 Computational Chemistry, 2004. 25(15): p. 1814-1826.44 33. Hansen, C.M., Hansen solubility parameters: a user's handbook. 2007: CRC press.45 34. Klein, E., et al., Evaluation of semi permeable membranes for determination of 46 organic contaminants in drinking water. Water Research, 1975. 9(9): p. 807-811.47 35. Chen, G.Q., et al., Water vapor permeation through cellulose acetate membranes and 48 its impact upon membrane separation performance for natural gas purification. 49 Journal of Membrane Science, 2015. 487(0): p. 249-255.50 36. Wijmans, J. and R. Baker, The solution-diffusion model: a review. Journal of 51 Membrane Science, 1995. 107(1): p. 1-21.
24
1 37. Lee, J.S., et al., An advanced gas/vapor permeation system for barrier materials: 2 Design and applications to poly(ethylene terephthalate). Journal of Polymer Science 3 Part B: Polymer Physics, 2012. 50(17): p. 1262-1270.4 38. Maeda, Y. and D.R. Paul, Effect of antiplasticization on gas sorption and transport. I. 5 Polysulfone. Journal of Polymer Science Part B: Polymer Physics, 1987. 25(5): p. 6 957-980.7 39. Sada, E., et al., Permeation of carbon dioxide through homogeneous dense and 8 asymmetric cellulose acetate membranes. Journal of Polymer Science Part B: 9 Polymer Physics, 1988. 26(5): p. 1035-1048.
10 40. Robeson, L.M., et al., Contributions of diffusion and solubility selectivity to the upper 11 bound analysis for glassy gas separation membranes. Journal of Membrane Science, 12 2014. 453: p. 71-83.13 41. Yang, J.S., et al., Analysis of pervaporation of methanol-MTBE mixtures through 14 cellulose acetate and cellulose triacetate membranes. Polymer, 1998. 39(6–7): p. 15 1381-1385.16 42. Houde, A.Y., et al., Permeability of dense (homogeneous) cellulose acetate 17 membranes to methane, carbon dioxide, and their mixtures at elevated pressures. 18 Journal of Applied Polymer Science, 1996. 62(13): p. 2181-2192.19 43. Donohue, M.D., B.S. Minhas, and S.Y. Lee, Permeation behavior of carbon dioxide-20 methane mixtures in cellulose acetate membranes. Journal of Membrane Science, 21 1989. 42(3): p. 197-214.22 44. Ionita, M., et al., Fabrication of cellulose triacetate/graphene oxide porous 23 membrane. Polymers for Advanced Technologies, 2016. 27(3): p. 350-357.24 45. Das, A.M., A.A. Ali, and M.P. Hazarika, Synthesis and characterization of cellulose 25 acetate from rice husk: Eco-friendly condition. Carbohydrate Polymers, 2014. 112: p. 26 342-349.27 46. Braun, J.L. and J.F. Kadla, CTA III: A Third Polymorph of Cellulose Triacetate. 28 Journal of Carbohydrate Chemistry, 2013. 32(2): p. 120-138.29 47. Yang, J., et al., Application of cellulose acetate to the selective adsorption and 30 recovery of Au(III). Carbohydrate Polymers, 2014. 111: p. 768-774.31 48. Arous, O., M. Amara, and H. Kerdjoudj, Synthesis and characterization of cellulose 32 triacetate and poly(ethylene imine) membranes containing a polyether macrobicyclic: 33 Their application to the separation of copper(II) and silver(I) ions. Journal of Applied 34 Polymer Science, 2004. 93(3): p. 1401-1410.35 49. Kulshreshtha, A.K. and N.E. Dweltz, A study on the further acetylation of SPA cotton. 36 Journal of Applied Polymer Science, 1979. 24(4): p. 1139-1141.37 50. Park, S., et al., Cellulose crystallinity index: measurement techniques and their impact 38 on interpreting cellulase performance. Biotechnology for biofuels, 2010. 3(1): p. 10.39 51. Puleo, A.C., D.R. Paul, and S.S. Kelley, The effect of degree of acetylation on gas 40 sorption and transport behavior in cellulose acetate. Journal of Membrane Science, 41 1989. 47(3): p. 301-332.42 52. Baker, R.W., Membrane technology. 2000: Wiley Online Library.43 53. Sridhar, S., B. Smitha, and T.M. Aminabhavi, Separation of Carbon Dioxide from 44 Natural Gas Mixtures through Polymeric Membranes—A Review. Separation & 45 Purification Reviews, 2007. 36(2): p. 113-174.46 54. Bhide, B.D. and S.A. Stern, Membrane processes for the removal of acid gases from 47 natural gas. II. Effects of operating conditions, economic parameters, and membrane 48 properties. Journal of Membrane Science, 1993. 81(3): p. 239-252.49 55. Merkel, T. and L. Toy, Comparison of hydrogen sulfide transport properties in 50 fluorinated and nonfluorinated polymers. Macromolecules, 2006. 39(22): p. 7591-51 7600.
25
1 56. Lin, W.-H. and T.-S. Chung, Gas permeability, diffusivity, solubility, and aging 2 characteristics of 6FDA-durene polyimide membranes. Journal of Membrane Science, 3 2001. 186(2): p. 183-193.4 57. Ghosal, K. and B.D. Freeman, Gas separation using polymer membranes: an 5 overview. Polymers for Advanced Technologies, 1994. 5(11): p. 673-697.6 58. Yampolskii, Y., I. Pinnau, and B.D. Freeman, Materials science of membranes for gas 7 and vapor separation. 2006: Wiley Online Library.8 59. Huang, Y. and D.R. Paul, Effect of Film Thickness on the Gas-Permeation 9 Characteristics of Glassy Polymer Membranes. Industrial & Engineering Chemistry
10 Research, 2007. 46(8): p. 2342-2347.11 60. Landry, C.J.T., K.K. Lum, and J.M. O'Reilly, Physical aging of blends of cellulose 12 acetate polymers with dyes and plasticizers. Polymer, 2001. 42(13): p. 5781-5792.13 61. Scholes, C.A., et al., Plasticization of ultra-thin polysulfone membranes by carbon 14 dioxide. Journal of Membrane Science, 2010. 346(1): p. 208-214.15 62. Galvão, A.C. and A.Z. Francesconi, Solubility of methane and carbon dioxide in 16 ethylene glycol at pressures up to 14 MPa and temperatures ranging from (303 to 17 423) K. The Journal of Chemical Thermodynamics, 2010. 42(5): p. 684-688.18 63. Fernández-Prini, R., R. Crovetto, and N. Gentili, Solubilities of inert gases in ethylene 19 glycol. The Journal of Chemical Thermodynamics, 1987. 19(12): p. 1293-1298.20 64. Jou, F.Y., F. Otto, and A. Mather, Solubility of methane in glycols at elevated 21 pressures. The Canadian Journal of Chemical Engineering, 1994. 72(1): p. 130-133.22 65. Jou, F.Y., et al., Vapor-liquid equilibria for acid gases and lower alkanes in 23 triethylene glycol. Fluid Phase Equilibria, 1987. 36: p. 121-140.24 66. Chatterjee, G., A.A. Houde, and S.A. Stern, Poly(ether urethane) and poly(ether 25 urethane urea) membranes with high H2S/CH4 selectivity. Journal of Membrane 26 Science, 1997. 135(1): p. 99-106.27 67. Robeson, L.M., et al., An empirical correlation of gas permeability and 28 permselectivity in polymers and its theoretical basis. Journal of Membrane Science, 29 2009. 341(1–2): p. 178-185.30 68. Dean, J.A., Lange's handbook of chemistry. Knovel. 1973: Binghamton, N.Y. : 31 Knovel.32 69. Dal-Cin, M.M., A. Kumar, and L. Layton, Revisiting the experimental and theoretical 33 upper bounds of light pure gas selectivity-permeability for polymeric membranes. 34 Journal of Membrane Science, 2008. 323(2): p. 299-308.35 70. Shieh, J.J. and T.S. Chung, Gas permeability, diffusivity, and solubility of poly(4-36 vinylpyridine) film. Journal of Polymer Science, Part B: Polymer Physics, 1999. 37 37(20): p. 2851-2861.
38
39


The impact of ethylene glycol and hydrogen sulfide on the performance of cellulose triacetate membranes in natural gas sweetening
Authors: H. T. Lu1, S. Kanehashi2, C. A. Scholes1, S. E. Kentish1,*
1Department of Chemical and Biomolecular Engineering, The University of Melbourne, Parkville, VIC3010 Australia
2Department of Organic and Polymer Materials Chemistry, Tokyo University of Agriculture and Technology, 3-8-1 Harumi-cho, Fuchu-shi, Tokyo 183-8538 Japan
SUPPLEMENTARY INFORMATION
Figure S1
Change in permeability of He and CH4 as time progresses for CTA membranes at 35oC, 750 kPa feeding pressure after aging in methanol solution
Minerva Access is the Institutional Repository of The University of Melbourne
Author/s:
Lu, HT; Kanehashi, S; Scholes, CA; Kentish, SE
Title:
The impact of ethylene glycol and hydrogen sulphide on the performance of cellulose
triacetate membranes in natural gas sweetening
Date:
2017-10-01
Citation:
Lu, H. T., Kanehashi, S., Scholes, C. A. & Kentish, S. E. (2017). The impact of ethylene
glycol and hydrogen sulphide on the performance of cellulose triacetate membranes in
natural gas sweetening. JOURNAL OF MEMBRANE SCIENCE, 539, pp.432-440.
https://doi.org/10.1016/j.memsci.2017.06.023.
Persistent Link:
http://hdl.handle.net/11343/191142
File Description:
Accepted version