20212030 Electric Customer and Sales Forecasts
42
2021-2030 Electric Customer and Sales Forecasts Prepared by Regulated Pricing MidAmerican Energy Company Data Request 1-1 Attachment 2021 - 2030 Electricity Forecasts Page 1 ~ MidAm . ENERGY er1can
Transcript of 20212030 Electric Customer and Sales Forecasts

2021-2030 Electric Customer and Sales
Forecasts
Prepared by Regulated Pricing
MidAmerican Energy Company Data Request 1-1 Attachment 2021 - 2030 Electricity Forecasts
Page 1
~ MidAm . ~ ENERGY er1can

1
EXECUTIVE SUMMARY………………………………………………………………..….. 2
I. METHODOLOGY …………………………………………………..…………………….. 10
I.1 Economic and demographic variables……………………..……………………….. 11
I.2 Weather variables...........................................................................................…........ 12
I.3 Modeling …………………………………………………..………..………..…….. 13
II. 2021-2030 FORECASTS …………………………………………………..………..…… 15
II.1 Customer forecasts……….………………………………………………………… 15
II.1a Methodology…………………………………………………….…….. 15
II.1b Customer forecast results…………………………………………………. 16
II.2 Sales forecasts……….…………………………………………………………….. 22
II.2a Methodology……………..……………………………………………. 22
II.2b Sales forecast results……………………………………………………… 23
II.3 Usage per customer (UPC) forecasts………………………………………………. 29
II.3a Sampling of UPC forecast model variables …………………………………. 29
APPENDIX …………………………………………………………………………………….. 34
Appendix 1: Additive regression model (linear)……………………………………………… 34
Appendix 2: Statistical significance tests …………………………………………………….. 35
Appendix 3: Tables of allocated residential customers………………………………………… 36
Appendix 4: Tables of allocated commercial customers………………………………….……. 36
Appendix 5: Tables of allocated industrial customers………………………………………….. 37
Appendix 6: Tables of allocated public authority customers…………………………………… 37
Appendix 7: Tables of allocated street lighting customers……………………………………… 38
Appendix 8: Tables of allocated residential sales……………………………………………….. 39
Appendix 9: Tables of allocated commercial sales…………………………………………….. 39
Appendix 10: Tables of allocated industrial sales……………………………………………….. 40
Appendix 11: Tables of allocated public authority sales…………………………………………. 40
Appendix 12: Tables of allocated street lighting sales…………………………………………… 41
MidAmerican Energy Company Data Request 1-1 Attachment 2021 - 2030 Electricity Forecasts
Page 2
~ MidAm . ~ ENERGY er1can

2
EXECUTIVE SUMMARY
Iowa population growth has been considered as a proxy for the gas customer growth due to the fact
that a majority of MidAmerican’s retail customers reside in Iowa. The gas customer growth is
primarily driven by population, which is in turn driven by the economic factors such as gross state
product. According to the Census Bureau and IHS Markit, Inc., the Iowa population grew by 0.20% in
2019 versus 0.29% during the last five years and is expected to grow by 0.23% in 2020 and 0.31% in
the next five years. The economy, as measured by real gross state product, grew by 0.5% in 2019 and
grew by an average of 0.9% in the last five years. It is expected to grow by 1.0% in 2020 and increase
by an annual average of 1.6% in the next five years. The economic forecast underlying the natural gas
volumes and customer forecast was made in January 2020.
The residential electric customer count is expected to increase 0.95% annually for the next ten years,
which is higher than the growth rate of 0.87% during the last five years. The customer numbers in the
industrial and public authority classes will experience the annual growth of 0.33% and -0.03%,
respectively. For the commercial class, the forecasted customer growth rate is 0.70% annually.
The current forecast projects total electric sales to grow by 2.32% annually for the next ten years, less
than last year’s projection of 1.12%. In last five years, the weather normalized electric sales have
grown 2.70%.
Figure E1 Total electricity sales
15,000,000
18,000,000
21,000,000
24,000,000
27,000,000
30,000,000
33,000,000
To
tal M
Wh
Sale
s
Historical 2020-2029 Forecast 2021-2030 Forecast
-5 Year -3 Year -1 Year +1 Year +3 Year +10 Year
Historical 2.70% 2.84% 2.03%
2021-2030 Forecast 3.62% 3.98% 2.32%
2020-2029 Forecast 2.35% 1.42% 1.12%
MidAmerican Energy Company Data Request 1-1 Attachment 2021 - 2030 Electricity Forecasts
Page 3
-T - T
& -& ~ T
~ -. _A . - -. - - --- -
--~ ----- - -
-----~ ~ ~ ~ ~ ~ ~ ~ ~ ~ ~ ~ ~ ~ ~ ~ ~ ~ ~ ~ ~ ~ ~ ~ ~ ~ ~ ~ ~ ~ ~ ~ ~ ~
I ~ -A- ~ I

3
Energy Efficiency Impacts
Energy efficiency impacts as promoted through company demand-side management (DSM) programs
have been accounted for in the electric sales forecast. National level DSM is also implicitly included
in MEC’s electric MWh sales results. The regression models have incorporated the impacts of energy
efficiency program MWh savings since 2000. No out-of-model adjustments were made to the forecast
due to energy efficiency impacts.
The concept behind embedded energy efficiency savings is that as DSM programs mature, the impact
and momentum of past programs is already captured in the observed historical kWh sales series.
MidAmerican Energy Company Data Request 1-1 Attachment 2021 - 2030 Electricity Forecasts
Page 4

4
Customer forecasts
As compared to the 2020-2029 forecasts, the 2021-2030 customer forecasts decreased the ten year
annual growth rates in the industrial and public authority classes while increasing it in the residential
and commercial classes. The fastest customer growth is projected to occur in the residential class at
0.95% while the slowest customer growth is expected in the public authority class at -0.03%. Figure
E2 shows the comparison of historical, 2021-2030 forecast and 2020-2029 forecast average annual
customers for the residential, commercial, industrial and public authority classes. The tables
associated with these figures compare the -5 year, -3 year, -1 year, +1 year, +3 year and +10 year
growth rates.
In the residential class, the 2021-2030 forecast increased the ten year growth rate to 0.95% from
0.87% in the 2020-2029 forecast. This is quite close to the last five year’s historical growth rate of
0.97%. In this class, South Dakota is projected to be the fastest growing jurisdiction at 1.44% while
Illinois is the slowest growing at 0.17%. Iowa is growing at 1.04%.
In the commercial class, the 2021-2030 forecast increased the ten year growth rate to 0.70% from
0.67% in the 2020-2029 forecast. The current growth rate is less than the historical five year growth
rate of 1.90%. In this class, South Dakota is projected to be the fastest growing jurisdiction at 1.14%
while Illinois is the slowest growing at 0.39%. Iowa is growing at 0.73%.
In the industrial class, the 2021-2030 forecast decreased the ten year growth rate to 0.33% from 1.02%
in the 2020-2029 forecast. The growth rate during the last five years was 1.22%. In this class, Illinois
is projected to be the fastest growing jurisdiction at 1.35% while South Dakota increases at a 0.11%
rate. Iowa is projected to grow at 0.31%.
In the public authority class, the 2021-2030 forecast increased the ten year growth rate to -0.03% from
-0.13% in the 2020-2029 forecast. The historical five year growth rate was 0.24% for this class. In
this class, South Dakota is projected to be the fastest growing jurisdiction at 0.25% while Iowa shows
shows a decline at -0.03%.
In the street lighting class, the current forecast assumed that the customer numbers, using the most
recent monthly data, are to remain constant, as has been done in past forecasts.
.
MidAmerican Energy Company Data Request 1-1 Attachment 2021 - 2030 Electricity Forecasts
Page 5

5
Figure E2 Customer forecasts for a) residential, b) commercial, c) industrial and d) public authority
classes. Each graph shows the historical, 2021-2030 forecast and 2021-2030 forecast average
customers. The tables compare the -5 year, -3 year, -1 year, +1 year, +3 year and +10 year growth
rates.
a) Residential customers
550,000
590,000
630,000
670,000
710,000
750,000
790,000
Re
sid
en
tia
l C
us
tom
ers
Historical 2020-2029 Forecast 2021-2030 Forecast
-5 Year -3 Year -1 Year +1 Year +3 Year +10 Year
Historical 0.97% 1.08% 0.76%
2021-2030 Forecast 0.95% 0.95% 0.95%
2020-2029 Forecast 1.09% 0.93% 0.87%
b) Commercial customers
80,000
85,000
90,000
95,000
100,000
105,000
Co
mm
erc
ial C
us
tom
ers
Historical 2020-2029 Forecast 2021-2030 Forecast
-5 Year -3 Year -1 Year +1 Year +3 Year +10 Year
Historical 1.90% 1.65% 1.83%
2021-2030 Forecast 1.07% 0.80% 0.70%
2020-2029 Forecast 0.26% 0.56% 0.67%
MidAmerican Energy Company Data Request 1-1 Attachment 2021 - 2030 Electricity Forecasts
Page 6
---- - ...---.---- -
ii-- -
...._b< ...._<:> ...._fo ~ ...._<o ...._C!l ~ a," a,'l- a,":> a,b< (t' cf cc- a,'o &-> e,~ '1,~ '1,~ ~ ~ ~ ~ '1,~ '1,~ '1,~ '1,~ ~ ~ ~ ~ ~ '1,~ '1,~
I --- --.tr- -+- I
~ - -
-- --- r--
~ ~
~ ~ ~ ~ ~ ~ ~ ~ ~ ~ a,b< (t' cf cc- ~ &-> ~ ~ ~ ~ ~ ~ ~ ~ ~ ~ ~ ~ ~ ~ ~ ~ ~ ~
I --- --.tr- -+- I

6
c) Industrial customers
1,000
1,200
1,400
1,600
1,800
2,000
2,200
Ind
ustr
ial
Cu
sto
mers
Historical 2020-2029 Forecast 2021-2030 Forecast
-5 Year -3 Year -1 Year +1 Year +3 Year +10 Year
Historical 1.22% -0.46% -2.23%
2021-2030 Forecast 0.19% 0.43% 0.33%
2020-2029 Forecast 5.14% 2.20% 1.02%
d) Public authority customers
10,000
11,000
12,000
13,000
14,000
15,000
16,000
Pu
blic A
uth
ori
ty C
usto
mers
Historical 2020-2029 Forecast 2021-2030 Forecast
-5 Year -3 Year -1 Year +1 Year +3 Year +10 Year
Historical 0.24% 0.52% 0.32%
2021-2030 Forecast 0.26% -0.06% -0.03%
2020-2029 Forecast -0.52% -0.25% -0.13%
MidAmerican Energy Company Data Request 1-1 Attachment 2021 - 2030 Electricity Forecasts
Page 7
• • • • • • • - -
--- .........
- - - - - -- -
--- ......... --+-

7
Sales forecasts
The 2021-2030 electric sales forecasts decreased the ten year annual growth rates in the residential
class, while increasing it in the residential and industrial classes. The industrial class is the fastest
growing class at 3.78% annually over the next ten years. The increased industrial sales growth is due
to higher sales growth assumptions for the ICR class through 2023. The slowest growing class is
forecasted to be the street lighting class at -0.75%. Figure E3 shows the comparison of historical,
2020-2029 forecast and 2021-2030 sales forecasts for the residential, commercial, industrial and
public authority classes. The tables associated with these figures compare the -5 year, -3 year, -1 year,
+1 year, +3 year and +10 year growth rates.
In the residential class, the 2021-2030 forecast decreased the ten year sales growth rate to 0.34% from
0.51% in the 2020-2029 forecast. This new ten year growth rate number is slightly higher than the last
five year growth rate of 0.29%. In this class, the fastest growth is expected to be in South Dakota,
while the slowest growth is projected to be in Illinois.
In the commercial class, the 2021-2030 forecast increased the ten year sales growth rate to 0.42% from
0.37% in the 2020-2029 forecast. The historical five year growth rate is 0.58%. The fastest growth in
this class is expected to be in Illinois, while the slowest growth is projected to be in South Dakota.
In the industrial class, the 2021-2030 forecast decreased the ten year sales growth rate to 3.78% from
1.71% in the 2020-2029 forecast. The growth rate over the last five years is 5.03%. In this class, the
fastest growth is expected to be in Iowa with 3.92%, while Illinois is growing at a rate of 0.70%.
In the public authority class, the 2021-2030 forecast increased the ten year sales growth rate to -0.23%
from -0.24% in the 2020-2029 forecast. The growth rate over the last five years was -0.04%. The
fastest growth in this class is expected to be in Illinois, while the slowest growth is projected to be in
Iowa.
Street lighting sales are decreasing over the forecast period due to the implementation of the LED
lighting replacement program in the state of Iowa.
MidAmerican Energy Company Data Request 1-1 Attachment 2021 - 2030 Electricity Forecasts
Page 8

8
Figure E3 Billed sales forecasts for a) residential, b) commercial, c) industrial and d) public authority
classes. Each graph shows the historical, 2020-2029 forecast and 2021-2030 forecast annual sales. The
tables compare the -5 year, -3 year, -1 year, +1 year, +3 year and +10 year growth rates.
a) Residential sales
4,500,000
5,000,000
5,500,000
6,000,000
6,500,000
7,000,000
7,500,000
8,000,000
Resid
en
tial
MW
h S
ale
s
Historical Normal 2020-2029 Forecast 2021-2030 Forecast
-5 Year -3 Year -1 Year +1 Year +3 Year +10 Year
Historical 0.33% 1.03% -2.78%
2021-2030 Forecast 0.29% 0.29% -0.11% 1.05% 0.38% 0.34%
2020-2029 Forecast 1.05% 0.65% 0.51%
b) Commercial sales
3,500,000
4,000,000
4,500,000
5,000,000
5,500,000
Co
mm
erc
ial
MW
h S
ale
s
Historical Normal 2020-2029 Forecast 2021-2030 Forecast
-5 Year -3 Year -1 Year +1 Year +3 Year +10 Year
Historical -1.10% 0.89% -0.34%
2021-2030 Forecast 0.58% 0.60% 1.55% -0.86% 0.30% 0.42%
2020-2029 Forecast -0.21% 0.22% 0.37%
MidAmerican Energy Company Data Request 1-1 Attachment 2021 - 2030 Electricity Forecasts
Page 9
~ .
~ - - ,, - - - - - -·-- - ... -
~~~~~~~~~~&~~~~~~ ~~~~~~~~~~~~~~~~~
I --- ~ ............. -+- I
.... A
'\... - ~ ~ - - -~ - -- - - -... -- - - -
~~~~~~~~~~&~~~~~~ ~~~~~~~~~~~~~~~~~
I --- ~ ............. -+- I

9
c) Industrial sales
7,000,000
10,000,000
13,000,000
16,000,000
19,000,000
22,000,000
Ind
ustr
ial
MW
h S
ale
s
Historical 2020-2029 Forecast 2021-2030 Forecast
-5 Year -3 Year -1 Year +1 Year +3 Year +10 Year
Historical 5.03% 5.15% 3.48%
2021-2030 Forecast 6.61% 6.93% 3.78%
2020-2029 Forecast 4.08% 2.31% 1.71%
d) Public authority sales
1,200,000
1,400,000
1,600,000
1,800,000
2,000,000
Pu
blic A
uth
ori
ty M
Wh
Sale
s
Historical Normal 2020-2029 Forecast 2021-2030 Forecast
-5 Year -3 Year -1 Year +1 Year +3 Year +10 Year
Historical -0.10% 0.36% -1.35%
2021-2030 Forecast -0.04% 0.45% 0.07% -2.04% -0.79% -0.23%
2020-2029 Forecast -2.33% -0.78% -0.24%
MidAmerican Energy Company Data Request 1-1 Attachment 2021 - 2030 Electricity Forecasts
Page 10
-"s~
~ ~ ~
~~ ~
M' -____. ----- -
~~~~~~~~~~~~~~~~~ ~~~~~~~~~~~~~~~~~
1----- ----a- ~ I
~ • • • • • • • • • • •
~ ~ "" .__Co
~~ ~ .__q,.__Oj~o,,"n,'l-~~~~~~~~c::. ~ ~~~~~~~~'l,c::,~~~~
I - ~ --6- ~ I

10
I. METHODOLOGY The 2021-2030 electric customer and sales forecasts were produced using econometric models on a
monthly basis and are carried out in three steps using a bottom-up approach:
Step 1: The customer numbers were forecasted directly by state, by revenue class:
Residential
Commercial
Industrial
Public authority.
Industrial kWh sales were forecast directly, by state, to arrive at a total industrial class kWh sales
forecast. The industrial sales were forecast in two groups: Non-ICR customers and ICR customers.
Iowa is the only state that currently has customers on the ICR rate. The street lighting forecasts were
forecast using trending. In this class, as in prior forecasts, the current customer numbers were
assumed to remain constant throughout the forecast period. An LED lighting replacement program
currently being implemented in Iowa caused the street lighting MWh sales forecast to decline over the
forecast period.
Step 2: For residential, commercial and public authority, econometric models were built to forecast
kWh per customer. This was done for each state: Iowa, Illinois and South Dakota. The resulting
kWh per customer forecasts were multiplied by the appropriate customer forecasts to arrive at a kWh
sales forecast. For industrial, the kWh per customer values for each revenue class was calculated
using customer and sales forecasts, and employed to check the presence of any discontinuity between
the historical and forecasted values.
Step 3: The projected customers and sales numbers were modeled using data specific to the area being
forecast. Economic data for the state of Iowa, the Des Moines, IA metropolitan statistical area, the
Quad Cities’ metropolitan statistical area and the appropriate county level data in Iowa and South
Dakota were used in building the models for the different regions.
MidAmerican Energy Company Data Request 1-1 Attachment 2021 - 2030 Electricity Forecasts
Page 11
11
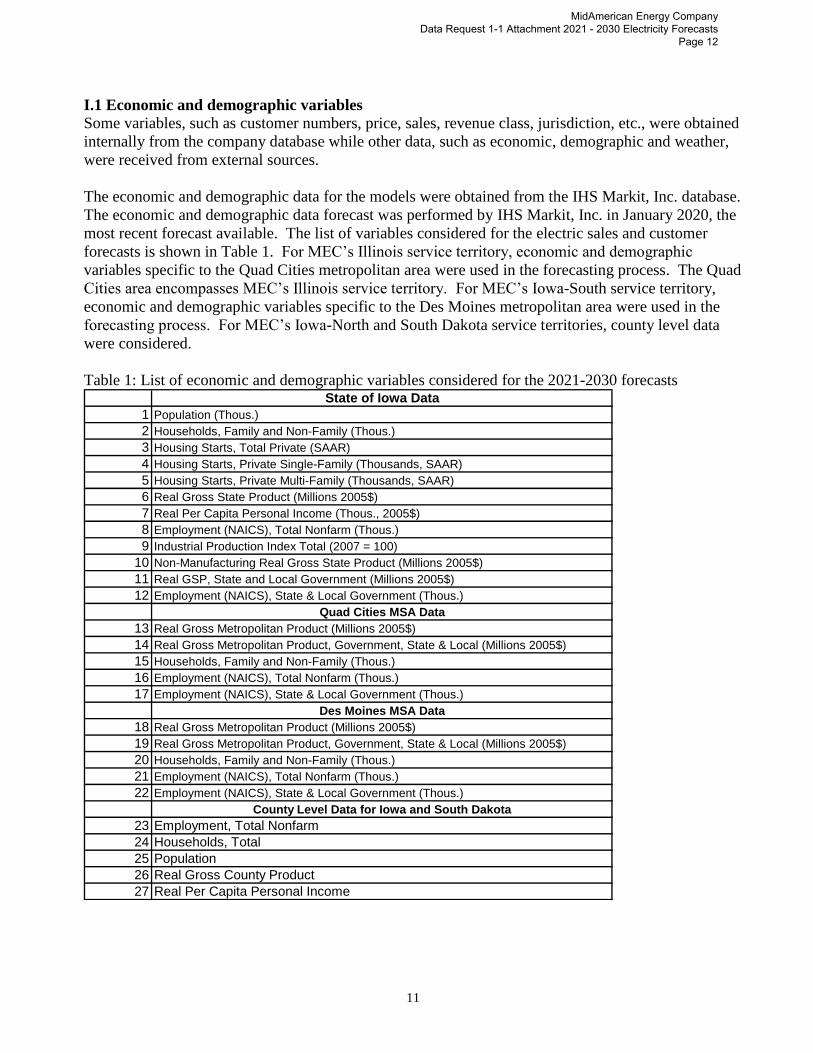
I.1 Economic and demographic variables Some variables, such as customer numbers, price, sales, revenue class, jurisdiction, etc., were obtained
internally from the company database while other data, such as economic, demographic and weather,
were received from external sources.
The economic and demographic data for the models were obtained from the IHS Markit, Inc. database.
The economic and demographic data forecast was performed by IHS Markit, Inc. in January 2020, the
most recent forecast available. The list of variables considered for the electric sales and customer
forecasts is shown in Table 1. For MEC’s Illinois service territory, economic and demographic
variables specific to the Quad Cities metropolitan area were used in the forecasting process. The Quad
Cities area encompasses MEC’s Illinois service territory. For MEC’s Iowa-South service territory,
economic and demographic variables specific to the Des Moines metropolitan area were used in the
forecasting process. For MEC’s Iowa-North and South Dakota service territories, county level data
were considered.
Table 1: List of economic and demographic variables considered for the 2021-2030 forecasts State of Iowa Data
1 Population (Thous.)
2 Households, Family and Non-Family (Thous.)
3 Housing Starts, Total Private (SAAR)
4 Housing Starts, Private Single-Family (Thousands, SAAR)
5 Housing Starts, Private Multi-Family (Thousands, SAAR)
6 Real Gross State Product (Millions 2005$)
7 Real Per Capita Personal Income (Thous., 2005$)
8 Employment (NAICS), Total Nonfarm (Thous.)
9 Industrial Production Index Total (2007 = 100)
10 Non-Manufacturing Real Gross State Product (Millions 2005$)
11 Real GSP, State and Local Government (Millions 2005$)
12 Employment (NAICS), State & Local Government (Thous.)
Quad Cities MSA Data
13 Real Gross Metropolitan Product (Millions 2005$)
14 Real Gross Metropolitan Product, Government, State & Local (Millions 2005$)
15 Households, Family and Non-Family (Thous.)
16 Employment (NAICS), Total Nonfarm (Thous.)
17 Employment (NAICS), State & Local Government (Thous.)
Des Moines MSA Data
18 Real Gross Metropolitan Product (Millions 2005$)
19 Real Gross Metropolitan Product, Government, State & Local (Millions 2005$)
20 Households, Family and Non-Family (Thous.)
21 Employment (NAICS), Total Nonfarm (Thous.)
22 Employment (NAICS), State & Local Government (Thous.)
County Level Data for Iowa and South Dakota
23 Employment, Total Nonfarm
24 Households, Total
25 Population
26 Real Gross County Product
27 Real Per Capita Personal Income
MidAmerican Energy Company Data Request 1-1 Attachment 2021 - 2030 Electricity Forecasts
Page 12

12
I.2 Weather variables
The weather variables used in the present forecast are:
Current month and previous month cooling degree days (CDD)
Current month and previous month heating degree days (HDD)
The forecast also contains a variable in which cooling degree days are interacted with a time trend and
a variable in which heating degree days are interacted with a time trend. These variables measure the
extent to which the relationship between degree days and electric sales changes over time.
The weather data was obtained from the NOAA (National Oceanic and Atmospheric Administration)
and are based on 65 degrees Fahrenheit. The values of weather variables were calculated through a
weighting scheme based on the readings from five weather stations:
Des Moines WSFO_AP
Sioux City WSO_AP
Waterloo WSO_AP
Moline WSO_AP
Omaha Eppley_Field
Weather Stations of Interest
The present energy forecasts are based on billed data. This means that the sales numbers reflect, in
part, the weather conditions from the previous month as well as the weather conditions for the current
month, depending on the meter read date. To take this into account, both current month and previous
month degree days are used in the modeling process. The forecasts used actual weather values for the
historical period and normal weather values for the forecast period. In the 2021-2030 forecast, normal
weather was defined as the MEC system load-weighted average monthly degree days from 1990-2019.
To compare the growth rates the historical sales figures were “weather normalized” using average
(normal) weather values. The normalization process consists of three steps. First, the historic
predicted numbers were obtained from a regression model using the actual weather values. Second, the
sales were re-calculated using average weather results.1 Third, the difference between them, which
defines the weather impact, was subtracted from the corresponding actual sales to arrive the
normalized sales. In mathematical terms, the weather normalization can be written as follows:
]Pr[Pr herNormalWeatherActualWeat esedictedSalesedictedSalsActualSaleSalesNormalized
1 The same equation obtained in the first step was used.
MidAmerican Energy Company Data Request 1-1 Attachment 2021 - 2030 Electricity Forecasts
Page 13

13
I.3 Modeling
The econometric forecasting method used in this study assumes that the relationship between the
dependent and independent variables is linear (additive) and defined as follows2:
where X, Y and Z are the variables, , and are the coefficients and r is the constant.
The forecasts were prepared using MetrixND software, version 4.7, developed by Itron, Inc. The
forecasts typically involve finding a mathematical relationship between the dependent and independent
variables. The steps taken in this forecast were as follows: The historical numbers since 2000 and the
forecast numbers for economic variables until 2048 were obtained. These values were then exported
into MetrixND and the analysis was carried out.
The primary criterion in selecting the variables was the relevance to the dependent variable being
forecasted. Other considerations were the sign (the direction of change) and impact (the magnitude of
elasticity coefficients) of variables on the forecasted dependent variable. Some of the statistical
parameters important to the econometric model are:
Adjusted R-Square: It indicates the fraction of total variation explained by the independent variables
in the regression. Its value ranges between 0 and 1, 1 being a perfect fit.
tionTotalVaria
ariationExplainedVR 2
Adjusted R2 takes into account the number of variables (k) with a constant sample size (n) as this leads
to a decrease in the degree of freedom (n-k). Thus, adjusted R2 is more conservative.
Adjusted
kn
nRR
1)1(1 22
F-Statistics (Probability): This is an alternative measure of goodness of the fit. F-statistics number
indicates the probability that the estimated regression fit is purely accidental. This number is preferred
to be as low as possible as compared to a critical number of 5%.
2 Appendix 1
ZYXry
MidAmerican Energy Company Data Request 1-1 Attachment 2021 - 2030 Electricity Forecasts
Page 14

14
Mean Absolute Percentage Error (MAPE): MAPE defines the magnitude of errors in the model. It is
the average of absolute values of the residual error percentages measured at each data point. The lower
the MAPE number the better the model is considered to be.
Durbin-Watson Statistic: It tests the hypothesis that the errors from a model do not exhibit first order
autocorrelation. In the absence of autocorrelation, the statistic has a value of 2. While it varies
between 0 and 4, a value above 2 indicates negative autocorrelation, while a value below 2 indicates
positive autocorrelation.
Test parameters for statistical significance
The t-statistics and P-values show the statistical significance of independent variables in 95%
confidence interval (or 5% significance level). Most of the explanatory variables presented in this
document are within the 95% confidence interval based on the t-statistics and P-values3.
To evaluate the reasonableness of the model, the residual patterns and model fit statistics were studied.
The residuals indicate the difference between the predicted and actual values. Any pattern associated
with residuals suggests a missing variable(s). The residuals were studied through the autocorrelation
factor and partial autocorrelation diagrams.
3 Appendix 3
MidAmerican Energy Company Data Request 1-1 Attachment 2021 - 2030 Electricity Forecasts
Page 15

15
II. 2021-2030 FORECASTS
II.1 Customer forecasts
II.1a Methodology
The customer forecasts in general were straight-forward and involved fewer variables. Customers were
modeled by state and by class. A sampling of variables included in the state of Iowa customer models
is listed below. Information about other states’ models is available upon request.
- Residential: weighted variable consisting of number of households and members per
household, monthly binary variables, binary variable for August 2014, binary variable for
December 2016 and ARMA (Autoregressive-Moving Average) errors
Commercial: Real per capita personal income multiplied by a time trend, total number of
households, monthly binary variables, binary variables for August 2014, December 2014,
March 2015, April 2015 and March 2016 and ARMA errors
Industrials: Non-farm employment, monthly binary variables, binary variables for August
2014, December 2014 and March 2016 and ARMA errors
Public authority: State and local government employment, monthly binary variables, binary
variable for August 2014 and ARMA errors.
MidAmerican Energy Company Data Request 1-1 Attachment 2021 - 2030 Electricity Forecasts
Page 16

16
II.1b Customer forecast results
The monthly customer numbers were forecasted at an aggregate level for each revenue class. The
system and jurisdiction level of forecasts were determined through an allocation. The annual historical
data and 10-year forecast values are summarized in Table 34.
Table 3: Summary of the historical and forecast average annual customer numbers in different classes
Residential Commercial Industrial
Public
Authority
Street
Lighting Total
2014 642,668 86,875 1,668 13,777 488 745,476
2015 646,431 89,967 1,748 13,692 486 752,324
2016 653,194 90,875 1,797 13,725 486 760,077
2017 661,688 92,055 1,816 13,889 484 769,932
2018 669,499 93,730 1,813 13,895 487 779,425
2019 674,579 95,447 1,773 13,940 487 786,226
2020 681,004 96,465 1,776 13,976 487 793,707
2021 687,407 97,107 1,786 13,928 487 800,716
2022 693,956 97,751 1,796 13,916 487 807,906
2023 700,449 98,396 1,803 13,910 487 815,044
2024 707,185 99,041 1,809 13,906 487 822,428
2025 713,859 99,687 1,815 13,906 487 829,754
2026 720,785 100,334 1,821 13,907 487 837,333
2027 727,736 100,982 1,825 13,906 487 844,936
2028 734,824 101,662 1,829 13,905 487 852,707
2029 741,746 102,350 1,832 13,903 487 860,319
2030 748,693 103,040 1,836 13,904 487 867,960
4 Annual values were calculated as the average of 12-months in a given year.
MidAmerican Energy Company Data Request 1-1 Attachment 2021 - 2030 Electricity Forecasts
Page 17

17
Residential customer forecasts
Figure 2 shows the comparison of historical, 2020-2029 forecast and 2021-2030 forecast customer
numbers. Note that these are aggregate numbers. The table associated with this figure compares the -5
year, -3 year, -1 year, +1 year, +3 year and +10 year growth rates.
Fig. 2 Comparison of historical, 2020-2029 forecast and 2021-2030 forecast average residential
customers
-5 Year -3 Year -1 Year +1 Year +3 Year +10 Year
Historical 0.97% 1.08% 0.76%
2021-2030 Forecast 0.95% 0.95% 0.95%
2020-2029 Forecast 1.09% 0.93% 0.87%
The aggregate customer numbers shown in Fig. 2 have been forecast for the Iowa, Illinois and South
Dakota jurisdictions. The growth rates of customer numbers in these jurisdictions are summarized in
Table 4. See Appendix 3 for the data tables.
Table 4: Growth rates of the residential customers Area -5 Year -3 Year -1 Year +1 Year +3 Year +10 Year
IA 1.16% 1.24% 0.86% 1.04% 1.04% 1.04%
IL -0.52% -0.19% -0.08% 0.22% 0.18% 0.17%
SD 2.10% 1.70% 1.03% 1.15% 1.36% 1.44%
MEC 0.97% 1.08% 0.76% 0.95% 0.95% 0.95% The biggest growth expected in South Dakota, and the smallest growth predicted in Illinois.
MidAmerican Energy Company Data Request 1-1 Attachment 2021 - 2030 Electricity Forecasts
Page 18
C/1 ... Q,)
E 0 +-' C/1 ::, u iii :;: C: Q,)
"C 'iii ~
790,000 --,-----------------------------,
750,000 --t------------------------------::,.__------::::.at_..t--1
710.000 L-------------:-----:=-.A~:!:~-~~~::J 670,000 +-------=--::;;::,l=~""-----~--------------------l
- ---630,000 -+-------------------------------<
590,000 +------------------------------1
--- Historical ---6-2020-2029 Forecast --+---- 2021-2030 Forecast

18
Commercial customer forecasts
Figure 3 shows the comparison of historical, 2020-2029 forecast and 2021-2030 forecast customer
numbers. Note that these are aggregate numbers. The table associated with this figure compares the -5
year, -3 year, -1 year, +1 year, +3 year and +10 year growth rates.
Fig. 3 Comparison of historical, 2020-2029 forecast and 2021-2030 forecast average commercial
customers
-5 Year -3 Year -1 Year +1 Year +3 Year +10 Year
Historical 1.90% 1.65% 1.83%
2021-2030 Forecast 1.07% 0.80% 0.70%
2020-2029 Forecast 0.26% 0.56% 0.67% The aggregate customer numbers have been forecast for the Iowa, Illinois and South Dakota
jurisdictions. The growth rates of customer numbers in these jurisdictions are summarized in Table 5.
See Appendix 4 for the data tables.
Table 5: Growth rates of the commercial customers Area -5 Year -3 Year -1 Year +1 Year +3 Year +10 Year
IA 1.59% 1.59% 1.86% 1.11% 0.84% 0.73%
IL 4.77% 2.10% 1.56% 0.66% 0.46% 0.39%
SD 2.26% 2.43% 2.32% 0.96% 0.99% 1.14%
MEC 1.90% 1.65% 1.83% 1.07% 0.80% 0.70%
The highest growth expected in South Dakota and the lowest growth predicted in Illinois.
MidAmerican Energy Company Data Request 1-1 Attachment 2021 - 2030 Electricity Forecasts
Page 19
105,000 ~~
Ill -... 100,000
-a., E -0 -- ~ -Ill i:----
-::::i 95,000 -u
~ "iii ·c:; 90,000 ...
/ a., E E 0 85,000 u
80,000
---Historical ----A---- 2020-2029 Forecast --+-2021-2030 Forecast

19
Industrial customer forecasts Figure 4 shows the comparison of historical, 2020-2029 forecast and 2021-2030 forecast customer
numbers. The table associated with this figure compares the -5 year, -3 year, -1 year, +1 year, +3 year
and +10 year growth rates.
Fig. 4 Comparison of historical, 2020-2029 forecast and 2021-2030 forecast average industrial
customers
-5 Year -3 Year -1 Year +1 Year +3 Year +10 Year
Historical 1.22% -0.46% -2.23%
2021-2030 Forecast 0.19% 0.43% 0.33%
2020-2029 Forecast 5.14% 2.20% 1.02% The aggregate customer numbers have been forecast for the Iowa, Illinois and South Dakota
jurisdictions. The growth rates of customer numbers in these jurisdictions are summarized in Table 6.
See Appendix 5 for the data tables.
Table 6: Growth rates of the industrial customers Area -5 Year -3 Year -1 Year +1 Year +3 Year +10 Year
IA 2.01% -0.34% -2.42% 0.11% 0.39% 0.31%
IL -16.44% -6.01% 5.22% 4.10% 2.40% 1.35%
SD 0.61% 1.42% -0.75% -0.02% 0.03% 0.11%
MEC 1.22% -0.46% -2.23% 0.19% 0.43% 0.33%
The highest growth is expected in Illinois while South Dakota is growing the least.
MidAmerican Energy Company Data Request 1-1 Attachment 2021 - 2030 Electricity Forecasts
Page 20
2,200
2,000
l!! E 1,soo 0 ... t/1 a 1,600
(ti
·E 1,400 t/1 ::i
"C c: 1,200
1,000
- - --
--- Historical
.. • • • . .
----T T T T
-+-2020-2029 Forecast
• • • • • • • . . . . T
~ 2021-2030 Forecast I

20
Public authority customer forecasts Figure 5 shows the comparison of historical, 2020-2029 forecast and 2021-2030 forecast customer
numbers. Note that these are aggregate numbers. The table associated with this figure compares the -5
year, -3 year, -1 year, +1 year, +3 year and +10 year growth rates.
Fig. 5 Comparison of historical, 2020-2029 forecast and 2021-2030 forecast average public authority
customers
-5 Year -3 Year -1 Year +1 Year +3 Year +10 Year
Historical 0.24% 0.52% 0.32%
2021-2030 Forecast 0.26% -0.06% -0.03%
2020-2029 Forecast -0.52% -0.25% -0.13%
The aggregate customer numbers have been forecast for the Iowa, Illinois and South Dakota
jurisdictions. The growth rates of customer numbers in these jurisdictions are summarized in Table 7.
See Appendix 6 for the data tables.
Table 7: Growth rates of the public authority customers Area -5 Year -3 Year -1 Year +1 Year +3 Year +10 Year
IA 0.21% 0.23% 0.25% 0.45% -0.04% -0.03%
IL 0.44% 3.36% 0.85% -1.46% -0.24% -0.03%
SD 0.20% -0.82% 1.02% 0.46% 0.36% 0.25%
MEC 0.24% 0.52% 0.32% 0.26% -0.06% -0.03%
The highest growth is expected in South Dakota while the lowest growth is predicted in Iowa.
MidAmerican Energy Company Data Request 1-1 Attachment 2021 - 2030 Electricity Forecasts
Page 21
16,000
,.,, ... 15,000 Q)
E 0 ...
14,000 -,.,, ::::, - - - - - -- - - - - - - - -u - - -~ ·;:: 13,000 0
..c: ... 12,000 ::::,
<(
-~ .c ::::,
11,000 Q.
10,000
~ ~ ~ ~ ~ ~ ~ ~ ~ w ~ ~ ~ ~ ~ ~ ~ ~ ~ ~ ~ ~ ~ ~ ~ ~ ~ ~
ev'o ev°> ~<;) 1,<;) 1,<;) 1,<;)
I ----Historical ___,._ 2020-2029 Forecast -+--2021-2030 Forecast I

21
Street lighting customer forecasts
As in the 2020-2029 forecasts, the present study assumed no change in the customer numbers of this
class. Based on this assumption, Figure 5 shows the comparison of historical, 2020-2029 forecast and
2021-2030 forecast customer numbers. Note that these are aggregate numbers. The table associated
with this figure compares the -5 year, -3 year, -1 year, +1 year, +3 year and +10 year growth rates. The
plots of customers in different regions are shown in Appendix 14.
Fig. 6 Comparison of historical, 2020-2029 forecast and 2021-2030 forecast average street lighting
customers
-5 Year -3 Year -1 Year +1 Year +3 Year +10 Year
Historical -0.03% 0.10% -0.03%
2021-2030 Forecast 0.00% 0.00% 0.00%
2020-2029 Forecast 0.00% 0.00% 0.00% The aggregate customer numbers have been forecast for the Iowa, Illinois and South Dakota
jurisdictions. The growth rates of customer numbers in these jurisdictions are summarized in Table 8.
See Appendix 7 for the data tables.
Table 8: Growth rates of the street lighting customers Area -5 Year -3 Year -1 Year +1 Year +3 Year +10 Year
IA -0.04% -0.04% -0.04% 0.00% 0.00% 0.00%
IL 0.08% 1.56% 0.00% 0.00% 0.00% 0.00%
SD 0.00% 0.00% 0.00% 0.00% 0.00% 0.00%
MEC -0.03% 0.10% -0.03% 0.00% 0.00% 0.00%
MidAmerican Energy Company Data Request 1-1 Attachment 2021 - 2030 Electricity Forecasts
Page 22
600 ti) ... Q)
E 550 0 ... ti) :::, u C)
500 C: ·.;:::; ..c: ■ ■ ■ ■ ■ ■ • • • • • • • • • • • .!'2'1 ...I ... Q) 450 Q) ... ...
(/)
400
---Historical -A- 2020-2029 Forecast --+--2021-2030 Forecast
I I

22
II.2 Sales forecasts
II.2a Methodology
The energy forecasts are more complicated and involve more variables than do the customer forecasts.
For residential and commercial, sales are determined by multiplying customers by use per customer.
For industrial and public authority, sales are modeled directly. For street lighting, sales are forecast
using trending. There is a sampling of variables used in the industrial sales models below:
Industrial: Weighted variable consisting of real gross state product and total industrial
production index, cooling degree days (current month), billing days, trend interacted
with heating degree day variable, binary for August 2014, monthly binaries and ARMA
errors
Better statistics were obtained for the customer models than sales models. The reason is that there is
more uncertainty in the sales forecasts due to the presence of multiple drivers and their possible
interactions. For example, a relatively small change in the historical usage pattern of a large industrial
customer could have big impact on the total energy usage in this class. Similarly, the changes in billing
cycle could have significant effect on the billed sales.
MidAmerican Energy Company Data Request 1-1 Attachment 2021 - 2030 Electricity Forecasts
Page 23
23
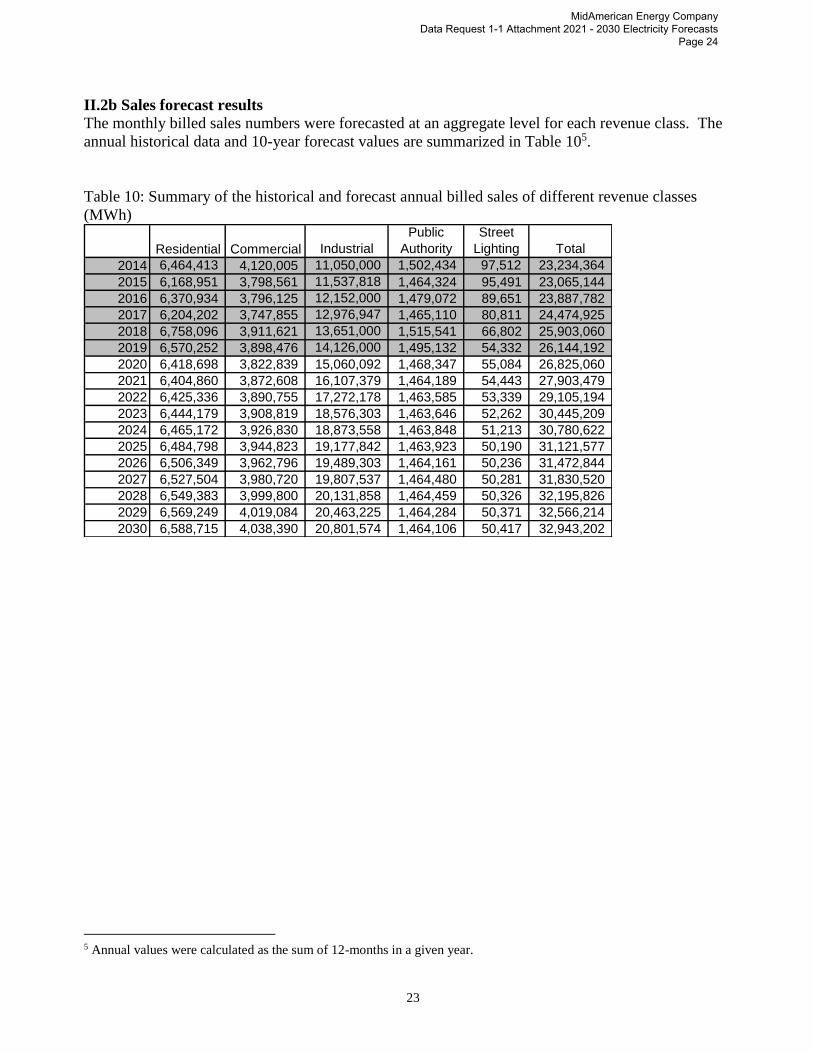
II.2b Sales forecast results
The monthly billed sales numbers were forecasted at an aggregate level for each revenue class. The
annual historical data and 10-year forecast values are summarized in Table 105.
Table 10: Summary of the historical and forecast annual billed sales of different revenue classes
(MWh)
Residential Commercial Industrial
Public
Authority
Street
Lighting Total
2014 6,464,413 4,120,005 11,050,000 1,502,434 97,512 23,234,364
2015 6,168,951 3,798,561 11,537,818 1,464,324 95,491 23,065,144
2016 6,370,934 3,796,125 12,152,000 1,479,072 89,651 23,887,782
2017 6,204,202 3,747,855 12,976,947 1,465,110 80,811 24,474,925
2018 6,758,096 3,911,621 13,651,000 1,515,541 66,802 25,903,060
2019 6,570,252 3,898,476 14,126,000 1,495,132 54,332 26,144,192
2020 6,418,698 3,822,839 15,060,092 1,468,347 55,084 26,825,060
2021 6,404,860 3,872,608 16,107,379 1,464,189 54,443 27,903,479
2022 6,425,336 3,890,755 17,272,178 1,463,585 53,339 29,105,194
2023 6,444,179 3,908,819 18,576,303 1,463,646 52,262 30,445,209
2024 6,465,172 3,926,830 18,873,558 1,463,848 51,213 30,780,622
2025 6,484,798 3,944,823 19,177,842 1,463,923 50,190 31,121,577
2026 6,506,349 3,962,796 19,489,303 1,464,161 50,236 31,472,844
2027 6,527,504 3,980,720 19,807,537 1,464,480 50,281 31,830,520
2028 6,549,383 3,999,800 20,131,858 1,464,459 50,326 32,195,826
2029 6,569,249 4,019,084 20,463,225 1,464,284 50,371 32,566,214
2030 6,588,715 4,038,390 20,801,574 1,464,106 50,417 32,943,202
5 Annual values were calculated as the sum of 12-months in a given year.
MidAmerican Energy Company Data Request 1-1 Attachment 2021 - 2030 Electricity Forecasts
Page 24

24
Residential sales forecasts
Figure 7 shows the comparison of historical, 2020-2029 forecast and 2021-2030 forecast sales
numbers. Note that these are aggregate numbers. The table associated with this figure compares the -5
year, -3 year, -1 year, +1 year, +3 year and +10 year growth rates.
Fig. 7 Comparison of historical, 2020-2029 forecast and 2021-2030 forecast annual residential billed
sales
-5 Year -3 Year -1 Year +1 Year +3 Year +10 Year
Historical 0.33% 1.03% -2.78%
2021-2030 Forecast 0.29% 0.29% -0.11% 1.05% 0.38% 0.34%
2020-2029 Forecast 1.05% 0.65% 0.51% The aggregate sales numbers have been forecast for the Iowa, Illinois and South Dakota jurisdictions.
The growth rates sales numbers in these jurisdictions are summarized in Table 12. See Appendix 8 for
the data tables.
Table 12: Growth rates of the residential sales -5 Year -3 Year -1 Year +1 Year +3 Year +10 Year
IA 0.45% 0.43% 0.01% 1.11% 0.46% 0.41%
IL -1.14% -1.06% -0.90% -0.10% -0.50% -0.46%
SD 1.06% 1.73% -3.34% 8.06% 2.67% 1.48%
MEC_Total 0.29% 0.29% -0.11% 1.05% 0.38% 0.34%
The highest growth is expected in South Dakota while the lowest growth is predicted in Illinois.
MidAmerican Energy Company Data Request 1-1 Attachment 2021 - 2030 Electricity Forecasts
Page 25
8,000,000
t/1 7,500,000 ~ ca
(/) 7,000,000 ..c: 3: 6,500,000 ::E
?------. . . . . - - ~
-..,,_ - / ... - T T T T
-· ..• T
ca 6,000,000 ·.:
C:
- T ----
Cl)
:'5! 5,500,000 t/1 Cl)
Q'. 5,000,000
4,500,000
----- Historical ~ Normal -+-2020-2029 Forecast --+-2021-2030 Forecast

25
Commercial sales forecasts Figure 8 shows the comparison of historical, 2020-2029 forecast and 2021-2030 forecast sales
numbers. Note that these are aggregate numbers. The table associated with this figure compares the -5
year, -3 year, -1 year, +1 year, +3 year and +10 year growth rates.
Fig. 8 Comparison of historical, 2020-2029 forecast and 2021-2030 forecast annual commercial billed
sales
-5 Year -3 Year -1 Year +1 Year +3 Year +10 Year
Historical -1.10% 0.89% -0.34%
2021-2030 Forecast 0.58% 0.60% 1.55% -0.86% 0.30% 0.42%
2020-2029 Forecast -0.21% 0.22% 0.37% The aggregate sales numbers have been forecast for the Iowa, Illinois and South Dakota jurisdictions.
The growth rates of sales numbers in these jurisdictions are summarized in Table 13. See Appendix 9
for the data tables.
Table 13: Growth rates of the commercial sales -5 Year -3 Year -1 Year +1 Year +3 Year +10 Year
IA 0.23% 0.73% 2.00% -2.40% -0.15% 0.31%
IL 2.79% -0.82% -2.07% 11.32% 3.78% 1.20%
SD 6.75% 7.09% 6.81% -8.93% -2.73% -0.12%
MEC_Total 0.58% 0.60% 1.55% -0.86% 0.30% 0.42%
The highest growth area in this class is Illinois, while the lowest growth area is South Dakota.
MidAmerican Energy Company Data Request 1-1 Attachment 2021 - 2030 Electricity Forecasts
Page 26
5,500,000
ti)
.!! (ti
(/) 5,000,000 .c 3:: :E -~ 4,500,000 (.) ... Q)
E E 4,000,000 0 u
3,500,000
---Historical -,111---- Normal ---6-2020-2029 Forecast ~ 2021-2030 Forecast

26
Industrial sales forecasts Figure 9 shows the comparison of historical, 2020-2029 forecast and 2021-2030 forecast sales
numbers. The table associated with this figure compares the -5 year, -3 year, -1 year, +1 year, +3 year
and +10 year growth rates.
Fig. 9 Comparison of historical, 2020-2029 forecast and 2021-2030 forecast annual industrial billed
sales
-5 Year -3 Year -1 Year +1 Year +3 Year +10 Year
Historical 5.03% 5.15% 3.48%
2021-2030 Forecast 6.61% 6.93% 3.78%
2020-2029 Forecast 4.08% 2.31% 1.71% The aggregate sales numbers have been forecast for the Iowa, Illinois and South Dakota jurisdictions.
The growth rates of sales numbers in these jurisdictions are summarized in Table 12. See Appendix
10 for the data tables.
Table 14: Growth rates of the industrial sales -5 Year -3 Year -1 Year +1 Year +3 Year +10 Year
IA 5.48% 5.50% 3.72% 6.82% 7.22% 3.92%
IL -1.88% -0.79% -1.02% 3.44% 1.48% 0.70%
SD 0.73% 1.09% 1.06% 0.67% 1.29% 1.36%
MEC_Total 5.03% 5.15% 3.48% 6.61% 6.93% 3.78%
The biggest growth area is Iowa while the smallest growth area is Illinois.
MidAmerican Energy Company Data Request 1-1 Attachment 2021 - 2030 Electricity Forecasts
Page 27
22,000,000
!/J ~ a:,
19,000,000 (/)
.c: 16,000,000 s: :!: a:,
·;:: 13,000,000 ... !/J :::,
"C 10,000,000 -=
7,000,000
I -a- Historical _._2020-2029 Forecast -+-2021-2030 Forecast!

27
Public authority sales forecasts Figure 10 shows the comparison of historical, 2020-2029 forecast and 2021-2030 forecast sales
numbers. Note that these are aggregate numbers. The table associated with this figure compares the -5
year, -3 year, -1 year, +1 year, +3 year and +10 year growth rates.
Fig. 10 Comparison of historical, 2020-2029 forecast and 2021-2030 forecast annual public authority
billed sales
-5 Year -3 Year -1 Year +1 Year +3 Year +10 Year
Historical -0.10% 0.36% -1.35%
2021-2030 Forecast -0.04% 0.45% 0.07% -2.04% -0.79% -0.23%
2020-2029 Forecast -2.33% -0.78% -0.24% The aggregate sales numbers have been forecast for the Iowa, Illinois and South Dakota jurisdictions.
The growth rates of sales numbers in these jurisdictions are summarized in Table 15. See Appendix
11 for the data tables.
Table 15: Growth rates of the public authority sales IA 0.09% 0.56% 0.14% -3.11% -1.16% -0.34%
IL -1.18% -0.50% -0.46% 6.47% 2.01% 0.56%
SD 2.83% 3.25% -0.79% -2.82% 0.01% 0.51%
MEC_Total -0.04% 0.45% 0.07% -2.04% -0.79% -0.23%
The highest growth area is Illinois while the smallest growth area is Iowa.
MidAmerican Energy Company Data Request 1-1 Attachment 2021 - 2030 Electricity Forecasts
Page 28
2,000,000 Ill ~ (U
(/)
.s::. 1,800,000 :i: :i.:
-~ 1,600,000 ... 0
.s::. ... ::I <(
-~ 1,400,000 ~ • • • • • • • • • • •
.0 ::I Q.
1,200,000
----Historical --¾- Normal ----6- 2020-2029 Forecast -+-2021-2030 Forecast

28
Street lighting sales forecasts In this class, trending based on historical data was used. Sales will decline throughout the forecast
period due to the implementation of an LED replacement program currently underway in the state of
Iowa. Figure 11 shows the comparison of historical, 2020-2029 forecast and 2021-2030 forecast sales
numbers. The table associated with this figure compares the -5 year, -3 year, -1 year, +1 year, +3 year
and +10 year growth rates.
Fig. 11 Comparison of historical, 2020-2029 forecast and 2021-2030 forecast annual street lighting
billed sales
-5 Year -3 Year -1 Year +1 Year +3 Year +10 Year
Historical -11.04% -15.37% -18.67%
2021-2030 Forecast 1.38% -0.61% -0.75%
2020-2029 Forecast 16.22% 2.46% -0.13% The aggregate customer numbers have been forecast for the Iowa, Illinois and South Dakota
jurisdictions. The growth rates of customer numbers in these jurisdictions are summarized in Table 16.
See Appendix 12 for the data tables.
Table 16: Growth rates of the street lighting sales -5 Year -3 Year -1 Year +1 Year +3 Year +10 Year
IA -10.99% -15.86% -15.00% -3.65% -2.89% -1.59%
IL -11.77% -12.19% -37.80% 36.54% 12.84% 3.73%
SD -2.14% -3.73% -9.97% 3.92% 3.12% 0.96%
MEC_Total -11.04% -15.37% -18.67% 1.38% -0.61% -0.75%
MidAmerican Energy Company Data Request 1-1 Attachment 2021 - 2030 Electricity Forecasts
Page 29
120,000 ti)
110,000 ~ (0
(/) 100,000 .c 3:: :E 90,000 C)
80,000 s:: ·,.:; .c
70,000 -~ ..J .... 60,000 Q) Q) ... .... 50,000 (/)
40,000
----- Historical ----6--- 2020-2029 Forecast --+-2021-2030 Forecast I

29
II.3 Usage per customer (UPC) forecasts For the residential, commercial and public authority classes, kWh per customer values was forecast
using econometric models. For the industrial and street lighting classes, the kWh per customer
forecast values were calculated using the forecast sales and customer numbers data.
II.3a State of Iowa UPC forecast model variables:
Residential model – Weighted variable consisting of real per capita personal income and non-
farm employment, heating degree days (current and lagged), cooling degree days (current
month), hours of light, monthly billing days, monthly binaries, binary for August 2014 and
ARMA errors
Commercial model – Weighted economic variable made up of members per household and the
total industrial production index, monthly billing days, heating degree days (current and
lagged), cooling degree days (current month), monthly binaries, binary variable for August
2014, and ARMA errors
Public Authority model – Weighted variable consisting of members per household and state
and local government employment, heating degree days (current and lagged), cooling degree
days (current month), monthly billing days, hours of light, binary for winter storm in December
2012, monthly binaries, binary variable for August 2014 and ARMA errors
Residential forecast Figure 12 shows the comparison of historical, normalized, 2020-2029 forecast and 2021-2030 forecast
kWh per customer numbers. The table associated with this figure compares the -5 year, -3 year, -1
year, +1 year, +3 year and +10 year growth rates.
Fig. 12 Comparison of historical, 2020-2029 forecast and 2021-2030 forecast residential kWh per
customer
6,000
7,000
8,000
9,000
10,000
11,000
12,000
Resid
en
tial
kW
h p
er
Cu
sto
mer
Historical Normal 2020-2029 Forecast 2021-2030 Forecast
-5 Year -3 Year -1 Year +1 Year +3 Year +10 Year
Historical -0.64% -0.05% -3.51%
2021-2030 Forecast -0.68% -0.78% -0.86% 0.10% -0.56% -0.61%
2020-2029 Forecast -0.04% -0.28% -0.36%
MidAmerican Energy Company Data Request 1-1 Attachment 2021 - 2030 Electricity Forecasts
Page 30
- .. -... -
--- --llE- -+-
I I I I I I I
30
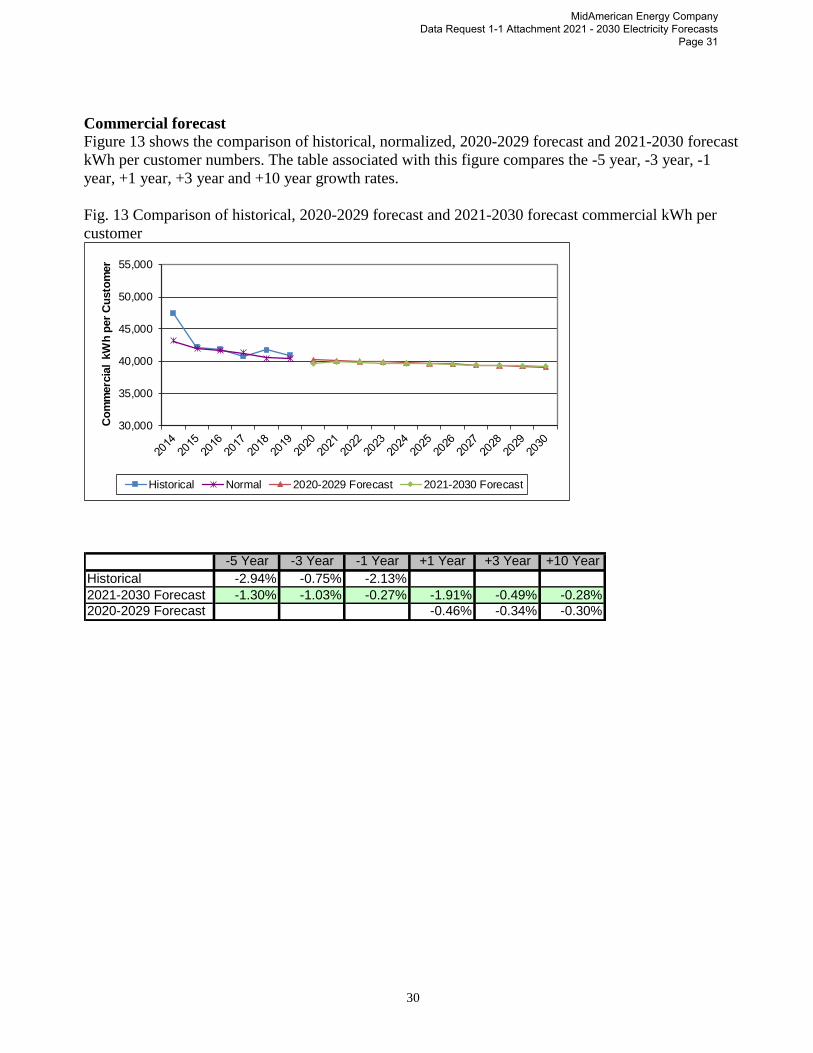
Commercial forecast
Figure 13 shows the comparison of historical, normalized, 2020-2029 forecast and 2021-2030 forecast
kWh per customer numbers. The table associated with this figure compares the -5 year, -3 year, -1
year, +1 year, +3 year and +10 year growth rates.
Fig. 13 Comparison of historical, 2020-2029 forecast and 2021-2030 forecast commercial kWh per
customer
30,000
35,000
40,000
45,000
50,000
55,000
Co
mm
erc
ial
kW
h p
er
Cu
sto
mer
Historical Normal 2020-2029 Forecast 2021-2030 Forecast
-5 Year -3 Year -1 Year +1 Year +3 Year +10 Year
Historical -2.94% -0.75% -2.13%
2021-2030 Forecast -1.30% -1.03% -0.27% -1.91% -0.49% -0.28%
2020-2029 Forecast -0.46% -0.34% -0.30%
MidAmerican Energy Company Data Request 1-1 Attachment 2021 - 2030 Electricity Forecasts
Page 31
'\ ~- "' ...... - - -
1--- -+-
I I I I I I I

31
Industrial forecast
Figure 14 shows the comparison of historical, 2020-2029 forecast and 2021-2030 forecast kWh per
customer numbers. The table associated with this figure compares the -5 year, -3 year, -1 year, +1
year, +3 year and +10 year growth rates.
Fig. 14 Comparison of historical, 2020-2029 forecast and 2021-2030 forecast industrial kWh per
customer
5,000,000
6,000,000
7,000,000
8,000,000
9,000,000
10,000,000
Ind
ustr
ial
kW
h p
er
Cu
sto
mer
Historical 2020-2029 Forecast 2021-2030 Forecast
-5 Year -3 Year -1 Year +1 Year +3 Year +10 Year
Historical 3.77% 5.64% 5.84%
2021-2030 Forecast 6.41% 6.47% 3.43%
2020-2029 Forecast -1.00% 0.11% 0.69%
MidAmerican Energy Company Data Request 1-1 Attachment 2021 - 2030 Electricity Forecasts
Page 32
-- -+-
I I I I

32
Public authority forecast
Figure 15 shows the comparison of historical, normalized, 2020-2029 forecast and 2021-2030 forecast
kWh per customer numbers. The table associated with this figure compares the -5 year, -3 year, -1
year, +1 year, +3 year and +10 year growth rates.
Fig. 15 Comparison of historical, 2020-2029 forecast and 2021-2030 forecast public authority kWh
per customer
90,000
95,000
100,000
105,000
110,000
115,000
120,000
Pu
blic A
uth
ori
ty k
Wh
per
Cu
sto
mer
Historical Normal 2020-2029 Forecast 2021-2030 Forecast
-5 Year -3 Year -1 Year +1 Year +3 Year +10 Year
Historical -0.33% -0.16% -1.66%
2021-2030 Forecast -0.27% -0.07% -0.25% -2.30% -0.74% -0.21%
2020-2029 Forecast -1.82% -0.53% -0.10%
MidAmerican Energy Company Data Request 1-1 Attachment 2021 - 2030 Electricity Forecasts
Page 33
.......... -- ~ "' ......__,, - .;.
1-- -A- -+-
I I I I I I I

33
Street lighting forecast
Figure 16 shows the comparison of historical, normalized, 2020-2029 forecast and 2021-2030 forecast
kWh per customer numbers. The table associated with this figure compares the -5 year, -3 year, -1
year, +1 year, +3 year and +10 year growth rates.
Figure 16 Comparison of historical, 2020-2029 forecast and 2021-2030 forecast street lighting kWh
per customer
100,000
120,000
140,000
160,000
180,000
200,000
220,000
Str
eet
Lig
hti
ng
kW
h p
er
Cu
sto
mer
Historical 2020-2029 Forecast 2021-2030 Forecast
-5 Year -3 Year -1 Year +1 Year +3 Year +10 Year
Historical -11.01% -15.46% -18.64%
2021-2030 Forecast 1.38% -0.61% -0.75%
2020-2029 Forecast 16.22% 2.46% -0.13%
MidAmerican Energy Company Data Request 1-1 Attachment 2021 - 2030 Electricity Forecasts
Page 34
• • • • •
----
I I I I I I I

34
APPENDIX
Appendix 1: Additive regression model (linear)
If the relationship between the dependent and independent variables is truly linear6, the multiple
regression equation has the form of:
where X, Y and Z are the variables, , and are the coefficients and r is the constant.
In this model, the coefficients , and , are the slopes, not the elasticity values. The slope only
shows the change in demand in response to “one-unit” change in a given independent variable,
assuming that all others independent variables are held constant. Thus, the elasticity (the ratio of %
change in the dependent variable to % change in the independent variable) in this model is calculated
as the slope coefficient multiplied by the ratio of independent variable to dependent variable.
6 Occasionally, it may be necessary to transform the actual data to arrive a linear relationship, as in the case of logarithmic
transformation.
ZYXry
dX
dySlope
XChange
yChange
y
X
dX
dy
y
X
y
XSlopeElasticity
in %
in %
MidAmerican Energy Company Data Request 1-1 Attachment 2021 - 2030 Electricity Forecasts
Page 35

35
Appendix 2: Statistical significance tests
In multiple regressions, the initial assumption (Null Hypothesis) is that the independent variables have
zero coefficients. The goal is to prove that this is not the case (Alternative Hypothesis).
Null Hypothesis H0: coefficient for a variable = 0
Alternative Hypothesis H1: coefficient for a variable ≠ 0
dardErrorSdardErrorS
edValueHypothesiztCoefficient
tan
0
tan
If calculated t value satisfies one of these two conditions,
Criticaltt or
Criticaltt
the variable is said to be statistically significant. tcritical has a value around ±2 depending of the number
of sample used in the analysis.
The P-value (probability) also leads to a similar conclusion regarding the statistical significance of
independent variables. Typically, P-values are reported at 5% significance level, i.e., 95% confidence
interval. In this case, the P-values are required to be less than 5%. The smaller the P-value, the more
confident one becomes about the significance of that variable. The relationships between t, tcritical and
P-value are shown in figure below.
.
Criticalt
t
P-value
Reject Null Reject Null
MidAmerican Energy Company Data Request 1-1 Attachment 2021 - 2030 Electricity Forecasts
Page 36

36
Appendix 3: Tables of residential customers
Figure A3.1 Table of average customers in Iowa, Illinois and South Dakota
Historical
2020-2029
Fcst
2021-2030
Fcst Historical
2020-2029
Fcst
2021-2030
Fcst Historical
2020-2029
Fcst
2021-2030
Fcst
2014 563,119 75,812 3,737
2015 568,142 74,455 3,834
2016 574,953 74,298 3,942
2017 583,485 74,159 4,044
2018 591,461 73,933 4,104
2019 596,559 73,873 4,147
2020 603,655 602,775 73,976 74,035 4,284 4,194
2021 609,355 608,997 73,975 74,155 4,389 4,255
2022 615,055 615,364 73,971 74,275 4,497 4,317
2023 620,755 621,673 73,964 74,395 4,610 4,381
2024 626,455 628,223 73,958 74,515 4,731 4,447
2025 632,317 634,711 73,948 74,635 4,861 4,514
2026 638,317 641,448 73,936 74,755 4,996 4,582
2027 644,317 648,211 73,930 74,875 5,123 4,650
2028 650,317 655,111 73,925 74,995 5,247 4,719
2029 656,317 661,848 73,913 75,115 5,366 4,783
2030 662,372 668,611 73,900 75,235 5,486 4,847
Iowa Illinois South Dakota
Appendix 4: Tables of commercial customers
Figure A4.1 Table of average customers in Iowa, Illinois and South Dakota
Historical
2020-2029
Fcst
2021-2030
Fcst Historical
2020-2029
Fcst
2021-2030
Fcst Historical
2020-2029
Fcst
2021-2030
Fcst
2014 78,379 7,765 731
2015 80,221 8,998 748
2016 80,905 9,209 760
2017 81,894 9,401 760
2018 83,279 9,653 799
2019 84,827 9,803 817
2020 84,850 85,772 10,021 9,867 821 825
2021 85,444 86,370 10,095 9,903 828 833
2022 86,042 86,970 10,169 9,939 838 842
2023 86,644 87,570 10,244 9,975 850 850
2024 87,250 88,170 10,320 10,011 864 859
2025 87,861 88,770 10,396 10,047 879 869
2026 88,476 89,370 10,472 10,083 895 880
2027 89,096 89,970 10,550 10,119 909 892
2028 89,719 90,603 10,628 10,155 923 904
2029 90,347 91,243 10,708 10,191 935 915
2030 90,980 91,887 10,788 10,227 948 926
Iowa Illinois South Dakota
MidAmerican Energy Company Data Request 1-1 Attachment 2021 - 2030 Electricity Forecasts
Page 37

37
Appendix 5: Tables of industrial customers
Figure A5.1 Table of average customers in Iowa, Illinois and South Dakota
Historical
2020-2029
Fcst
2021-2030
Fcst Historical
2020-2029
Fcst
2021-2030
Fcst Historical
2020-2029
Fcst
2021-2030
Fcst
2014 1,548 99 22
2015 1,671 56 22
2016 1,728 49 21
2017 1,755 39 22
2018 1,752 38 22
2019 1,710 40 22
2020 1,802 1,712 39 42 23 22
2021 1,816 1,722 40 43 23 22
2022 1,829 1,730 40 43 23 22
2023 1,841 1,737 40 44 23 22
2024 1,851 1,743 41 44 23 22
2025 1,861 1,748 41 45 23 22
2026 1,870 1,753 41 45 23 22
2027 1,879 1,757 42 46 23 22
2028 1,888 1,761 42 46 24 22
2029 1,895 1,764 42 46 24 22
2030 1,903 1,767 42 46 24 22
Iowa Illinois South Dakota
Appendix 6: Tables of public authority customers
Figure A6.1 Table of average customers in Iowa, Illinois and South Dakota
Historical
2020-2029
Fcst
2021-2030
Fcst Historical
2020-2029
Fcst
2021-2030
Fcst Historical
2020-2029
Fcst
2021-2030
Fcst
2014 12,254 1,392 131
2015 12,256 1,302 134
2016 12,301 1,288 136
2017 12,384 1,371 133
2018 12,354 1,410 131
2019 12,385 1,422 133
2020 12,308 12,441 1,425 1,402 134 133
2021 12,291 12,387 1,425 1,407 135 134
2022 12,274 12,370 1,425 1,412 135 134
2023 12,258 12,363 1,426 1,413 135 134
2024 12,243 12,359 1,426 1,413 136 135
2025 12,232 12,356 1,426 1,415 136 135
2026 12,223 12,355 1,426 1,417 136 135
2027 12,214 12,353 1,426 1,418 137 135
2028 12,202 12,351 1,426 1,419 137 136
2029 12,191 12,349 1,426 1,419 138 136
2030 12,179 12,346 1,426 1,422 138 136
Iowa Illinois South Dakota
MidAmerican Energy Company Data Request 1-1 Attachment 2021 - 2030 Electricity Forecasts
Page 38

38
Appendix 7: Tables of street lighting customers
Figure A7.1 Table of average customers in Iowa, Illinois and South Dakota
Historical
2020-2029
Fcst
2021-2030
Fcst Historical
2020-2029
Fcst
2021-2030
Fcst Historical
2020-2029
Fcst
2021-2030
Fcst
2014 440 44 4
2015 440 42 4
2016 440 42 4
2017 437 43 4
2018 439 44 4
2019 439 44 4
2020 439 439 44 44 4 4
2021 439 439 44 44 4 4
2022 439 439 44 44 4 4
2023 439 439 44 44 4 4
2024 439 439 44 44 4 4
2025 439 439 44 44 4 4
2026 439 439 44 44 4 4
2027 439 439 44 44 4 4
2028 439 439 44 44 4 4
2029 439 439 44 44 4 4
2030 439 439 44 44 4 4
Iowa Illinois South Dakota
MidAmerican Energy Company Data Request 1-1 Attachment 2021 - 2030 Electricity Forecasts
Page 39

39
Appendix 8: Tables of residential sales
Figure A8.1 Table of annual billed MWh sales in Iowa, Illinois and South Dakota
Historical
2020-2029
Fcst
2021-2030
Fcst Historical
2020-2029
Fcst
2021-2030
Fcst Historical
2020-2029
Fcst
2021-2030
Fcst
2014 5,555,266 655,434 49,300
2015 5,594,431 639,637 50,932
2016 5,608,701 638,937 49,362
2017 5,647,193 617,812 54,996
2018 5,680,776 624,464 53,760
2019 5,681,174 618,862 51,965
2020 5,750,021 5,744,269 611,342 618,273 57,392 56,155
2021 5,781,106 5,736,803 607,228 612,350 58,812 55,708
2022 5,811,851 5,759,433 603,630 609,661 60,277 56,243
2023 5,842,257 5,780,413 600,381 606,982 61,812 56,784
2024 5,872,327 5,803,514 597,099 604,313 63,452 57,346
2025 5,903,537 5,825,224 594,174 601,655 65,203 57,920
2026 5,935,725 5,848,841 591,425 599,006 67,030 58,501
2027 5,967,561 5,872,055 588,178 596,368 68,766 59,080
2028 5,999,047 5,895,996 584,729 593,740 70,446 59,647
2029 6,030,186 5,917,963 581,943 591,122 72,055 60,165
2030 6,061,487 5,939,541 579,170 588,514 73,700 60,660
Iowa Illinois South Dakota
Appendix 9: Tables of commercial sales
Figure A9.1 Table of annual billed MWh sales in Iowa, Illinois and South Dakota
Historical
2020-2029
Fcst
2021-2030
Fcst Historical
2020-2029
Fcst
2021-2030
Fcst Historical
2020-2029
Fcst
2021-2030
Fcst
2014 3,318,759 395,923 32,318
2015 3,278,098 458,556 34,346
2016 3,284,739 465,786 36,475
2017 3,285,480 471,828 39,693
2018 3,291,019 464,039 41,942
2019 3,356,793 454,411 44,796
2020 3,336,903 3,276,192 469,471 505,852 41,626 40,795
2021 3,350,716 3,324,387 471,947 507,332 41,884 40,890
2022 3,364,417 3,341,623 474,401 507,903 42,346 41,230
2023 3,377,951 3,358,789 476,909 508,468 42,993 41,562
2024 3,391,461 3,375,884 479,416 509,027 43,737 41,919
2025 3,404,942 3,392,909 481,926 509,581 44,579 42,333
2026 3,418,417 3,409,865 484,455 510,128 45,480 42,804
2027 3,432,048 3,426,750 487,005 510,669 46,277 43,300
2028 3,445,978 3,444,796 489,584 511,205 46,819 43,798
2029 3,460,041 3,463,082 492,194 511,735 47,270 44,268
2030 3,474,162 3,481,399 494,818 512,258 47,725 44,733
Iowa Illinois South Dakota
MidAmerican Energy Company Data Request 1-1 Attachment 2021 - 2030 Electricity Forecasts
Page 40

40
Appendix 10: Tables of industrial sales
Figure A10.1 Table of annual billed MWh sales in Iowa, Illinois and South Dakota
Historical 2020-2029 Fcst
2021-2030
Fcst Historical
2020-2029
Fcst
2021-2030
Fcst Historical
2020-2029
Fcst
2021-2030
Fcst
2014 10,243,783 681,658 124,559
2015 10,771,839 641,935 124,043
2016 11,392,005 634,925 125,070
2017 12,207,415 637,991 131,541
2018 12,896,819 626,337 127,844
2019 13,376,859 619,944 129,198
2020 13,917,222 14,288,742 652,705 641,282 133,037 130,069
2021 14,120,309 15,333,654 658,301 642,426 133,924 131,298
2022 14,327,225 16,490,008 663,949 647,916 134,918 134,254
2023 14,538,885 17,791,519 668,795 649,036 136,043 135,748
2024 14,754,234 18,085,959 674,129 650,467 137,153 137,132
2025 14,974,503 18,386,388 678,694 652,504 138,358 138,950
2026 15,198,954 18,692,939 683,259 655,335 139,725 141,029
2027 15,427,016 19,005,743 688,498 658,568 141,240 143,225
2028 15,659,341 19,324,939 693,869 661,372 142,889 145,547
2029 15,896,231 19,650,667 699,218 664,621 144,622 147,938
2030 16,136,705 19,983,068 704,609 668,090 146,376 150,415
Iowa Illinois South Dakota
Appendix 11: Tables of public authority sales
Figure A11.1 Table of annual billed MWh sales in Iowa, Illinois and South Dakota
Historical
2020-2029
Fcst
2021-2030
Fcst Historical
2020-2029
Fcst
2021-2030
Fcst Historical
2020-2029
Fcst
2021-2030
Fcst
2014 1,318,367 177,044 6,589
2015 1,293,398 163,711 6,891
2016 1,302,724 169,394 6,883
2017 1,294,025 163,501 7,473
2018 1,322,712 167,652 7,637
2019 1,324,550 166,874 7,576
2020 1,292,188 1,283,314 164,400 177,670 7,412 7,363
2021 1,293,065 1,279,242 163,526 177,454 7,408 7,494
2022 1,293,925 1,278,843 162,656 177,163 7,419 7,579
2023 1,294,778 1,279,515 161,776 176,478 7,446 7,652
2024 1,295,629 1,280,375 160,894 175,739 7,477 7,734
2025 1,296,474 1,280,460 160,010 175,669 7,517 7,794
2026 1,297,304 1,280,605 159,132 175,734 7,564 7,822
2027 1,298,132 1,280,554 158,268 176,088 7,600 7,838
2028 1,299,004 1,280,218 157,411 176,340 7,584 7,901
2029 1,299,889 1,279,857 156,553 176,453 7,558 7,975
2030 1,300,775 1,279,480 155,700 176,568 7,531 8,057
Iowa Illinois South Dakota
MidAmerican Energy Company Data Request 1-1 Attachment 2021 - 2030 Electricity Forecasts
Page 41

41
Appendix 12: Tables of street lighting sales
Figure A12.1 Table of annual billed MWh sales in Iowa, Illinois and South Dakota
Historical
2020-2029
Fcst
2021-2030
Fcst Historical
2020-2029
Fcst
2021-2030
Fcst Historical
2020-2029
Fcst
2021-2030
Fcst
2014 84,498 12,595 419
2015 84,943 10,129 419
2016 79,280 9,949 422
2017 69,906 10,487 417
2018 55,555 10,829 418
2019 47,220 6,735 376
2020 53,025 45,496 9,704 9,197 415 391
2021 50,562 44,359 9,713 9,671 415 412
2022 48,306 43,250 9,723 9,676 416 413
2023 46,050 42,169 9,733 9,681 416 413
2024 44,003 41,114 9,743 9,686 417 413
2025 42,750 40,087 9,752 9,691 417 413
2026 42,918 40,127 9,762 9,696 417 413
2027 43,086 40,167 9,772 9,700 418 414
2028 43,464 40,207 9,782 9,705 418 414
2029 43,423 40,247 9,791 9,710 419 414
2030 43,381 40,287 9,801 9,715 419 414
Iowa Illinois South Dakota
MidAmerican Energy Company Data Request 1-1 Attachment 2021 - 2030 Electricity Forecasts
Page 42