2021 Investment Themes
8
Equities Focus Summary 1. Strong earnings season, favourable seasonality for equities: a very strong Q3 earnings season for US companies drives global equities to fresh all-time highs, led by a 20% earnings beat on average for banks. Positive Q4 seasonality continues to play out, while real yields remain solidly negative. Trend-following indicators support our continued positive equities stance. 2. The French CAC-40 hits a new all-time high after 21 years: the 7000 point barrier has finally been breached, suggesting further upside for French equities. 3. Renewable energy stocks start to shine post COP26: as per the previous COP24 and COP25 conferences, the renewable energy theme is gathering steam again post COP26. This should be a positive trend for the next few months. 4. Taking profits on Indian equities: we downgrade our Indian equities view to neutral from positive, after impressive outperformance versus Emerging Market equities since February. 5. What could go wrong? Do not get carried away by 2021’s buoyant stock markets. Risks always loom large, notably the risk of overtightening by central banks and a renewed surge in energy prices crimping global economic growth. LAST 2 COP SUMMITS FOCUSED MINDS ON RENEWABLE ENERGY INVESTMENT NOVEMBER 2021 Contents Global Equities view 2 Theme: selective bubbles re-emerge 3 Trend in corporate profits 4 Sector outlook 5 Sector preferences 6 Appendix: IBES sector forecasts 7 Disclaimer 8 Alain Gerard, MSc, MBA Senior Investment Advisor, Equities BNP Paribas Wealth Management Edmund Shing, PhD Global CIO BNP Paribas Wealth Management 50 100 150 200 250 300 50 100 150 200 250 300 Nov Feb May Aug Nov Index rebased: Nov 2018, Nov 2019 = 100 Wilderhill Clean Energy Index 2018-19 2019-20 December: COP 24, 25 summits
Transcript of 2021 Investment Themes

EquitiesFocus
Summary
1. Strong earnings season, favourable seasonality
for equities: a very strong Q3 earnings season
for US companies drives global equities to fresh
all-time highs, led by a 20% earnings beat on
average for banks. Positive Q4 seasonality
continues to play out, while real yields remain
solidly negative. Trend-following indicators
support our continued positive equities stance.
2. The French CAC-40 hits a new all-time high
after 21 years: the 7000 point barrier has
finally been breached, suggesting further upside
for French equities.
3. Renewable energy stocks start to shine post
COP26: as per the previous COP24 and COP25
conferences, the renewable energy theme is
gathering steam again post COP26. This should
be a positive trend for the next few months.
4. Taking profits on Indian equities: we
downgrade our Indian equities view to neutral
from positive, after impressive outperformance
versus Emerging Market equities since February.
5. What could go wrong? Do not get carried away
by 2021’s buoyant stock markets. Risks always
loom large, notably the risk of overtightening by
central banks and a renewed surge in energy
prices crimping global economic growth.
LAST 2 COP SUMMITS FOCUSED MINDS ON RENEWABLE ENERGY INVESTMENT
NOVEMBER 2021
Contents
Global Equities view 2
Theme: selective bubbles re-emerge 3
Trend in corporate profits 4
Sector outlook 5
Sector preferences 6
Appendix: IBES sector forecasts 7
Disclaimer 8
Alain Gerard, MSc, MBA
Senior Investment Advisor, EquitiesBNP Paribas Wealth Management
Edmund Shing, PhD
Global CIO BNP Paribas Wealth Management
50
100
150
200
250
300
50
100
150
200
250
300
Nov Feb May Aug Nov
Inde
x r
eba
se
d:
No
v 2
01
8,
No
v
201
9 =
100
Wilderhill Clean Energy Index
2018-19
2019-20December:COP 24, 25 summits
2
Global Equities view
The trend remains your friend
Equity markets progressed over October: a 3% gain
in the US over the last month and modest gains in
Europe, combined with a surprising 6% bounce in the
Hong Kong Hang Seng Index all fit with the typical
bullish Q4 seasonal effects.
Strong earnings momentum on the back of a bullish
Q3 result season, allied with rising buybacks, negative
real yields and boosted M&A activity are key drivers
for stocks. The huge levels of cash savings still on the
side-lines highlight the potential firepower that could
still flow into stock markets in Q4 2021. The major risk
to stock markets remains a shift in macro liquidity
conditions on a tightening in global monetary policy.
COP26 a catalyst for renewable energy: the COP24
and COP25 global climate conferences acted as a
positive catalyst for clean energy stocks in 2018 and
2019. We expect COP26 to similarly refocus attention
on clean energy stocks, after a cooling in renewable
energy enthusiasm since February of this year.
Taking profits on Indian equities
We have decided to take profits on India largely due
to the extremely strong price action, moving from
Positive to Neutral. The Sensex has appreciated 52%
over the last 12 months, and is the best-performing
major equity market in the world in 2021. It trades at
a record 60% premium to Asian stocks. The Sensex 30
Index trades at a 26x current year earnings and 22x
next year earnings. Furthermore, higher energy prices
and higher inflation will lead to RBI rate hikes as we
are seeing globally.
India’s long-term fundamentals remain strong: i)
improving business landscape under PM Modi; ii)
young population – demographics key to growth in an
ageing world; iii) lower levels of debt compared with
other major countries; iv) large and growing domestic
market, and v) strong culture of high return on equity
with company returns. We would revisit the case on a
market pullback. India also provides diversification
potential from China with lower correlation.
EQUITIES FOCUS: NOVEMBER 2021
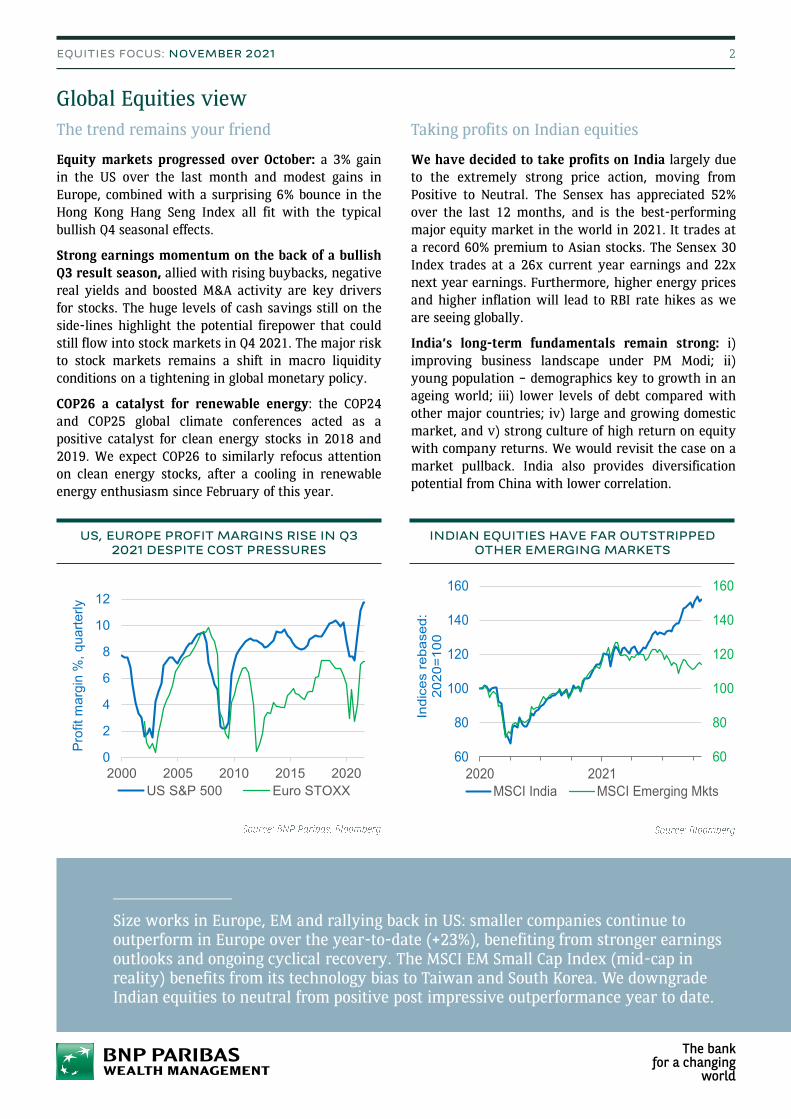
Size works in Europe, EM and rallying back in US: smaller companies continue to outperform in Europe over the year-to-date (+23%), benefiting from stronger earnings outlooks and ongoing cyclical recovery. The MSCI EM Small Cap Index (mid-cap in reality) benefits from its technology bias to Taiwan and South Korea. We downgrade Indian equities to neutral from positive post impressive outperformance year to date.
US, EUROPE PROFIT MARGINS RISE IN Q3 2021 DESPITE COST PRESSURES
INDIAN EQUITIES HAVE FAR OUTSTRIPPED OTHER EMERGING MARKETS
0
2
4
6
8
10
12
2000 2005 2010 2015 2020
Pro
fit
marg
in %
, quart
erly
US S&P 500 Euro STOXX
60
80
100
120
140
160
60
80
100
120
140
160
2020 2021
Indic
es r
ebased:
2020=
100
MSCI India MSCI Emerging Mkts
3
Theme in Focus
Selective bubbles re-emerge
Animal spirits are alive and well: several of 2020’s
hot investment “memes” have rallied once again to
new highs, highlighting investor euphoria in certain
pockets of the financial markets. Two clear examples
of this recurrent euphoria exist in the cryptocurrency
and US mega-cap tech stock spaces.
Since May 2021, Tesla (in the NYSE FANG+ Index) has
nearly doubled, while the Shiba Inu meme coin (SHIB)
has risen more than 1,000% since the end of
September.
Cheap money is the driver: the underlying driver for
this euphoria remains the very cheap cost of money,
combined with enhanced unemployment benefits
(which have now ended) and the issuance of
“helicopter money” in the form of cheques mailed
directly to qualifying US households.
These two examples raise the spectre of euphoric
investment bubbles emerging once again – a sign in
our view that investors should exercise some caution
in risky assets.
But not all recent investment memes are working:
though this euphoria seems to be very selective. The
Renaissance IPO Index has traded sideways over 2021.
Social sentiment, alternative harvest, hydrogen
themes have not reignited: equally well, other
investment themes that enjoyed a sharp rise in early
2021 such as the social sentiment (an ETF that buys
stocks mentioned often on social media), alternative
harvest (cannabis stocks) and hydrogen indices have
not rallied back. Rather, all three indices remain some
way off their February 2021 highs.
This is similarly true for hyper-growth ETFs, such as
the ARK Innovation ETF and the Direxion Moonshot
Innovators ETF.
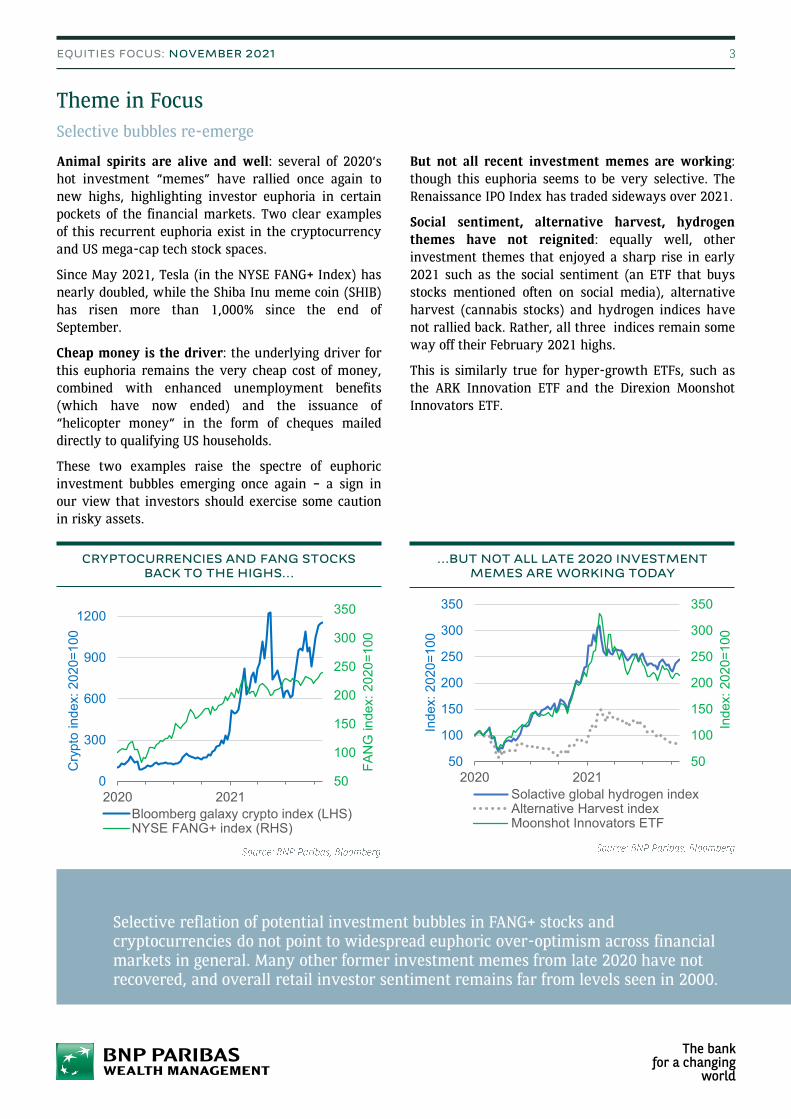
CRYPTOCURRENCIES AND FANG STOCKS BACK TO THE HIGHS…
EQUITIES FOCUS: NOVEMBER 2021
…BUT NOT ALL LATE 2020 INVESTMENT MEMES ARE WORKING TODAY
Selective reflation of potential investment bubbles in FANG+ stocks and cryptocurrencies do not point to widespread euphoric over-optimism across financial markets in general. Many other former investment memes from late 2020 have not recovered, and overall retail investor sentiment remains far from levels seen in 2000.
50
100
150
200
250
300
350
0
300
600
900
1200
2020 2021
FA
NG
index:
2020=
100
Cry
pto
index:
2020=
100
Bloomberg galaxy crypto index (LHS)NYSE FANG+ index (RHS)
50
100
150
200
250
300
350
50
100
150
200
250
300
350
2020 2021
Index:
2020=
100
Index:
2020=
100
Solactive global hydrogen indexAlternative Harvest indexMoonshot Innovators ETF

4
Trend in corporate profits
USA
There were fears prior to the Q3 earnings season thatsupply chain disruptions would hit corporate profits.While final demand remains robust, boosted by theneed to rebuild inventories, there are ongoingproduction concerns linked to the pandemic (forcingplants to cut production or even shut down), as wellas rising energy costs.
In the end, US corporate results turned out to bemuch better than expected. They were not asspectacular as the previous five quarters.Nonetheless, by 5 November (when 88% ofcompanies had reported), US companies had beatenexpected earnings in 81% of cases, by slightly morethan 10% on average – an excellent outturn. Saleswere also better than expected in 65% of cases. Thebest results were announced in the Banking, Energyand Pharmaceutical sectors. Many companies havementioned rising costs, but thus far, most companieshave managed to keep their elevated profit margins,even improving them in some cases.
Earnings expectations are still being revised upwardsin a number of sectors including Energy, Financials,Consumer Services and Communications Services.
In Europe, prior to the Q3 corporate results season,
expectations were also elevated but there was less fear
of disappointments in view of the rise in the US dollar,
social aid, stimulus plans, and high COVID-19
vaccination rates (among the highest in the world),
supporting Europe’s economic recovery.
In the end, European corporate results also turned
out to be better than expected, though less
spectacular than in the US. By 5 November (when
49% of companies had reported), European companies
had beaten expected earnings in 68% of cases, by
slightly more than 10% on average. Sales were also
better in 55% of cases.
The STOXX Europe 600 Index looks relatively cheap:
the price-to-earnings ratio is around 15.5x expected
next 12 months earnings. The US remains relatively
expensive with a forward price-to-earnings ratio of
close to 22x.
Sector-wise, upward earnings revisions have been
recently concentrated in Energy, Financials, Retail and
Transportation. Many cyclical stocks remain cheap.
Defensives are showing more downward revisions.
STRONG EARNINGS RECOVERY CONTINUES & EXPECTATIONS ARE STILL GOING UP
EQUITIES FOCUS: NOVEMBER 2021
GLOBAL CYCLICALS LOOK PARTICULARLY CHEAP, ONCE AGAIN
Despite cost increases, the Q3 earnings season has still surprised to the upside. Most companies have maintained elevated profit margins, and even increasing them in some cases. Visibility is not that high for Q4 2021 but pent-up demand, inventories to be replenished and diminishing supply chain bottlenecks should strongly support profits in the coming quarters. We remain optimistic about 2022.
Europe
5
Sector outlook
Rising bond yields and Seasonality favour Cyclical Value stocks
Rate-sensitive Energy and Financials sectors
continue to lead the way higher, boosted by higher
yields and inflation breakevens now as high as 2.6%.
Strong Q3 earnings results and positive earnings
revisions provide further fuel for continued upwards
momentum in these sectors.
Since 2005, European cyclical stocks (as defined by
STOXX) have posted an average 5.4% return over Q4,
versus only 0.9% for defensive stocks. This cyclical
outperformance tends to continue at the beginning of
the following year as well, up until the end of April.
However, several cyclical sectors (mainly Materials,
Industrials and Consumer Discretionary) are still
under pressure due to their dependence on China,
and the slowdown in global economic growth. Many
suffer from rising (energy) costs.
YTD, our favourite sectors are doing well: Financials
(+) and US Real Estate (+) are outperforming. Energy
(the very cheap European energy sector is in ‘+’),
Health Care (+) and Tech are also performing nicely.
Sell into Tech strength: we continue to recommend
reducing names with disappointing, weak or no
earnings. Earnings are clearly the key explanatory
factor of stock markets’ performance over the last
few months (cf. chart below).
In the tech space, Semiconductors (+) still have
potential due to the unmet demand and their pricing
power. Other opportunities found in the fast-growing
tech segments include Artificial Intelligence, 5G,
Cloud and Cybersecurity, all part of the ‘Metaverse’,
one of our 2022 Investment Themes.
We remain positive on Health Care, Financials and
European Energy, also due to their still relatively
cheap valuations and huge cash flow generation,
supporting dividends and share buybacks.
Battery metals (copper, lithium, nickel) are the best
ways to play the American and European renewable
infrastructure plans as well as Construction Materials
as long as China avoids contagion from Evergrande to
financial markets.
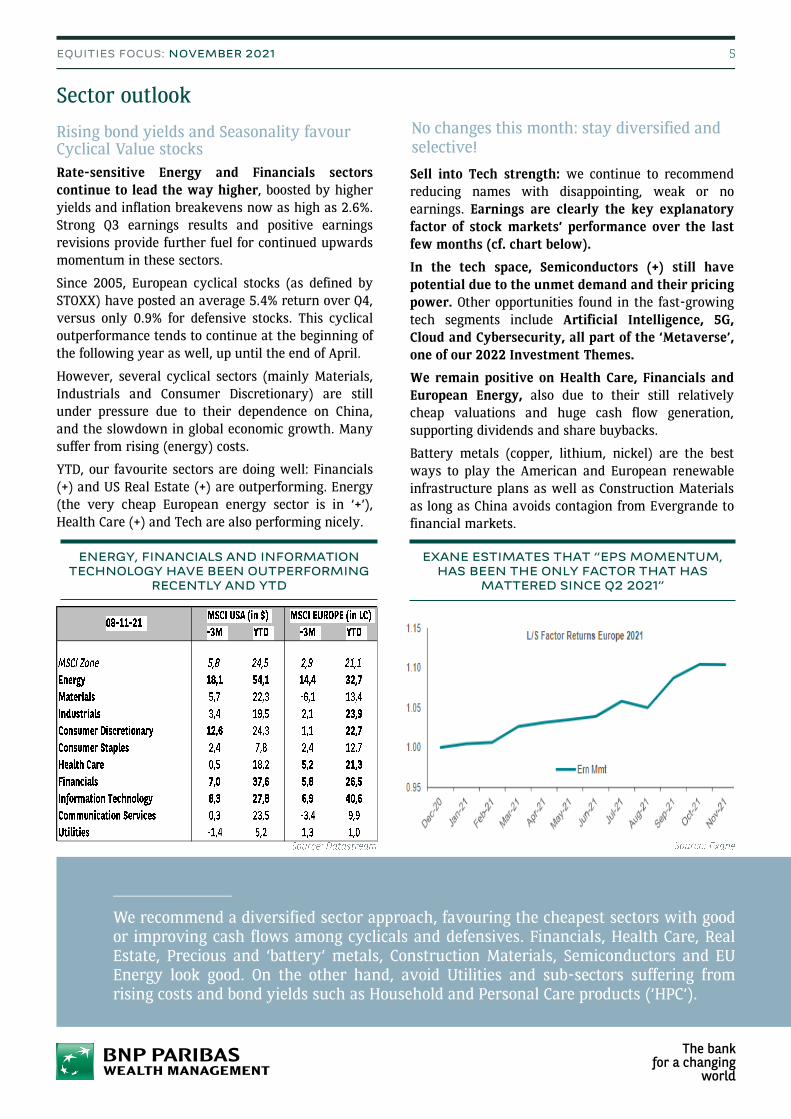
ENERGY, FINANCIALS AND INFORMATION TECHNOLOGY HAVE BEEN OUTPERFORMING
RECENTLY AND YTD
EQUITIES FOCUS: NOVEMBER 2021
EXANE ESTIMATES THAT “EPS MOMENTUM, HAS BEEN THE ONLY FACTOR THAT HAS
MATTERED SINCE Q2 2021”
We recommend a diversified sector approach, favouring the cheapest sectors with goodor improving cash flows among cyclicals and defensives. Financials, Health Care, RealEstate, Precious and ‘battery’ metals, Construction Materials, Semiconductors and EUEnergy look good. On the other hand, avoid Utilities and sub-sectors suffering fromrising costs and bond yields such as Household and Personal Care products (‘HPC’).
No changes this month: stay diversified and selective!
6
Sector preferences
EQUITIES FOCUS: NOVEMBER 2021
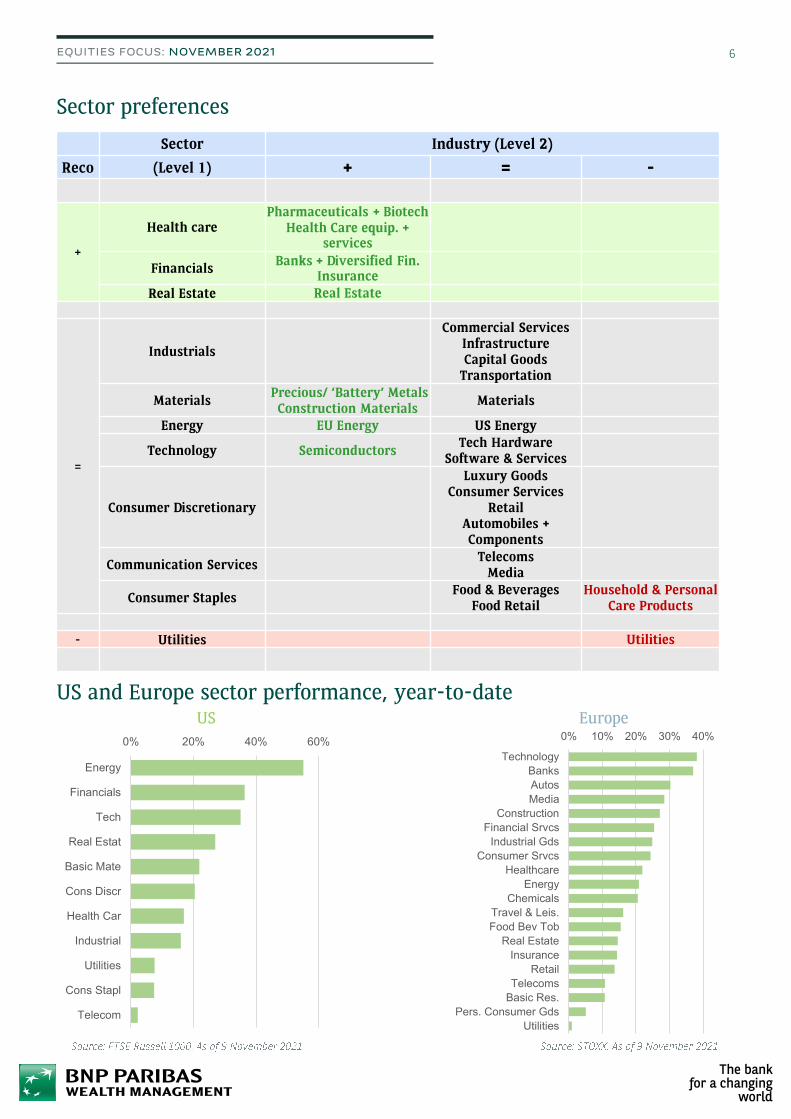
US and Europe sector performance, year-to-date
Sector Industry (Level 2)
Reco (Level 1) + = -
+
Health carePharmaceuticals + Biotech
Health Care equip. + services
FinancialsBanks + Diversified Fin.
Insurance
Real Estate Real Estate
=
Industrials
Commercial ServicesInfrastructureCapital Goods
Transportation
MaterialsPrecious/ ‘Battery’ MetalsConstruction Materials
Materials
Energy EU Energy US Energy
Technology SemiconductorsTech Hardware
Software & Services
Consumer Discretionary
Luxury GoodsConsumer Services
RetailAutomobiles + Components
Communication ServicesTelecoms
Media
Consumer StaplesFood & Beverages
Food RetailHousehold & Personal
Care Products
- Utilities Utilities
US Europe0% 10% 20% 30% 40%
Technology
Banks
Autos
Media
Construction
Financial Srvcs
Industrial Gds
Consumer Srvcs
Healthcare
Energy
Chemicals
Travel & Leis.
Food Bev Tob
Real Estate
Insurance
Retail
Telecoms
Basic Res.
Pers. Consumer Gds
Utilities
0% 20% 40% 60%
Energy
Financials
Tech
Real Estat
Basic Mate
Cons Discr
Health Car
Industrial
Utilities
Cons Stapl
Telecom

7
IBES forecasts for Europe & US (Source: IBES)
EQUITIES FOCUS: NOVEMBER 2021
Price index - in €
2021 2022 202312m
fwd2021 2022 2023
12m
fwd2021 2022 2023
MSCI EUROPE (€) (*) 16,5 15,5 14,5 15,6 57,2 6,5 7,1 12,1 1,1 5,0 1,0 3,2 0,8 2,5 1,0 3,5 12,3 5,2 2,32 0,3 0,79 2,6
(*) EU15 + Switzerland + Norway
MSCI UK (£) 12,5 12,2 11,8 12,3 79,6 2,4 3,2 9,9 0,7 4,2 0,6 1,9 0,6 1,7 0,6 2,3 17,8 5,7 -0,5 0,5 -1,0 3,6
MSCI Switzerland (CHF) 20,8 19,1 17,7 19,4 13,3 8,8 8,4 9,5 1,1 2,4 0,6 1,0 0,5 0,9 0,6 1,2 6,2 4,7 2,4 0,5 1,5 2,3
MSCI Germany 15,1 13,9 12,7 14,1 58,2 8,4 9,8 13,6 1,1 3,4 0,4 2,1 0,4 1,6 0,5 2,3 9,2 4,7 4,3 0,0 1,2 2,4
MSCI France 17,2 15,7 14,6 15,9 97,2 9,3 7,3 17,3 1,2 6,6 1,9 5,7 1,4 4,5 1,8 5,8 14,3 4,8 2,6 0,5 1,7 2,3
MSCI Spain 14,9 13,3 11,9 13,5 42,3 11,8 11,7 15,9 0,5 5,7 1,7 3,1 1,5 2,7 1,5 3,5 5,3 3,7 3,0 -0,1 0,2 3,1
MSCI The Nertherlands 27,9 24,8 21,8 25,4 27,3 12,6 13,5 14,3 0,1 3,9 0,3 1,4 0,1 1,8 0,3 1,9 7,9 5,7 4,5 0,2 1,4 1,5
MSCI Belgium 19,0 19,1 17,0 19,1 38,4 -0,2 12,3 4,6 -0,9 4,4 -1,3 -0,9 -0,6 -1,4 -1,3 -0,1 6,1 10,3 21,2 0,1 -1,4 2,0
MSCI EUROPE ENERGY 10,0 8,8 9,0 9,0 1028,4 14,1 -2,7 31,8 3,3 11,3 7,2 15,6 4,6 10,0 6,6 15,0 47,4 8,0 -4,6 1,8 0,8 4,1
MSCI EUROPE MATERIALS 10,3 12,0 13,2 11,7 107,9 -14,1 -9,2 -4,6 -0,4 5,0 -1,0 0,8 -0,5 1,9 -0,8 1,7 29,8 0,3 -2,5 0,6 0,3 3,9
MSCI EUROPE INDUSTRIALS 22,7 20,1 18,0 20,4 114,9 13,3 11,5 21,7 0,8 6,2 0,5 4,2 0,6 3,6 0,6 4,5 10,1 6,9 4,7 0,1 1,5 1,9
MSCI EUROPE CAP GDS 23,7 20,1 17,7 20,6 77,1 17,9 13,8 23,5 0,2 2,8 -0,1 2,5 0,5 3,4 -0,1 2,6 7,6 7,0 5,2 -0,2 0,9 1,9
MSCI EUROPE COML SVS/SUP 26,8 24,0 21,9 24,5 22,8 11,5 9,5 13,3 0,0 1,3 0,3 1,4 0,3 1,4 0,2 1,3 8,4 6,5 5,4 -0,1 0,3 1,9
MSCI EUROPE TRANSPT 15,7 16,5 16,3 16,3 -4,7 1,1 19,9 3,9 27,7 4,2 17,1 1,0 6,4 4,1 18,8 25,5 6,9 1,8 1,2 5,2 1,4
MSCI EUROPE CONS DISCR 18,7 16,1 14,2 16,5 190,3 16,3 12,9 27,7 0,8 6,6 1,0 4,2 0,8 3,6 1,0 4,6 18,3 9,6 6,3 -0,8 -1,1 1,3
MSCI EUROPE AUTO & COMPO 8,0 7,2 6,7 7,4 405,9 9,9 8,6 24,9 1,0 9,9 1,4 6,8 1,0 4,9 1,4 7,3 17,1 8,2 5,1 -1,5 -2,6 1,4
MSCI EUROPE CONS DUR/APP 27,6 24,2 21,7 24,8 98,9 14,4 11,2 22,3 0,5 4,4 1,3 4,4 1,6 4,6 1,2 4,4 24,0 8,8 7,3 0,7 1,3 1,4
MSCI EUROPE CONS SVS 61,4 29,8 22,8 31,7 203,0 105,8 30,9 114,5 1,1 -0,7 0,3 -1,0 1,1 3,2 0,4 -1,0 2,7 21,2 9,2 0,4 1,5 0,2
MSCI EUROPE RETAILING 34,5 27,3 21,3 29,1 50,3 26,4 28,0 29,0 0,5 -1,6 -1,6 -4,9 -1,7 -3,6 -1,1 -4,0 29,0 12,9 10,3 0,4 3,3 1,3
MSCI EUROPE CONS STAPLES 21,9 20,1 18,6 20,3 8,6 9,2 8,0 9,5 0,2 0,5 0,1 0,0 0,1 0,3 0,1 0,1 3,2 4,1 3,4 0,4 1,0 2,6
MSCI EUROPE FD/STAPLES RTL 16,6 15,9 15,1 16,1 18,1 4,6 5,7 9,4 2,2 5,6 1,6 3,3 1,0 3,3 1,8 3,9 2,0 2,0 2,3 0,4 1,6 3,0
MSCI EUROPE FD/BEV/TOB 22,2 20,1 18,5 20,3 10,5 10,5 8,6 10,7 -0,2 0,0 0,0 -0,1 0,0 0,2 0,0 0,0 4,9 6,2 4,3 0,3 0,6 2,5
MSCI EUROPE H/H PERS PRD 23,5 21,9 20,4 22,1 0,0 7,5 7,1 6,3 0,1 -0,3 -0,2 -1,1 -0,2 -0,7 -0,1 -1,0 2,4 4,3 3,9 0,4 0,5 2,5
MSCI EUROPE HEALTH CARE 19,8 18,1 16,4 18,4 7,7 9,2 10,8 8,9 0,7 2,4 0,4 1,6 0,3 2,1 0,4 1,7 7,0 5,9 5,5 0,4 1,7 2,4
MSCI EUROPE H/C EQ/SVS 28,8 25,9 22,7 26,3 17,1 11,2 14,0 11,8 0,4 1,2 -0,6 -0,6 -0,4 -0,2 -0,4 -0,4 5,1 6,9 6,3 0,1 0,7 1,1
MSCI EUROPE PHARM/BIOTEC 18,6 17,0 15,4 17,3 6,6 8,9 10,3 8,5 0,8 2,6 0,5 1,9 0,4 2,5 0,5 2,0 7,6 5,6 5,3 0,5 2,0 2,7
MSCI EUROPE FINANCIALS 10,7 10,7 9,8 10,5 42,9 2,4 9,0 7,6 2,5 7,8 1,0 2,9 0,6 1,9 1,3 3,7 -3,0 3,2 3,4 0,4 2,2 3,4
MSCI EUROPE BANKS 9,3 9,5 8,7 9,5 83,5 -2,4 10,1 6,0 3,4 13,9 1,6 5,6 1,4 4,2 1,9 6,9 2,6 2,0 3,1 0,3 1,4 3,4
MSCI EUROPE DIV FIN 13,7 14,0 12,8 13,0 6,6 5,5 9,7 7,3 4,6 11,4 1,6 2,7 1,2 1,6 2,2 4,1 -25,4 2,3 12,3 1,2 0,4 1,7
MSCI EUROPE INSURANCE 11,6 10,6 9,9 10,8 17,7 9,4 6,8 10,6 -0,2 -3,5 -0,4 -1,2 -1,0 -1,5 -0,4 -1,6 -0,2 4,1 1,8 0,4 3,0 4,5
MSCI EUROPE REAL ESTATE 21,5 19,3 18,4 19,7 0,1 11,6 5,1 9,8 0,2 1,2 0,0 0,9 0,2 1,1 0,0 1,0 1,1 1,9 3,1 2,9 5,6 2,7
MSCI EUROPE IT 33,7 30,0 26,6 30,5 26,0 12,5 12,7 13,7 2,7 4,1 1,3 3,4 1,2 3,6 1,5 3,6 11,3 8,9 6,5 -0,1 0,4 0,8
MSCI EUROPE S/W & SVS 32,1 30,5 26,5 30,8 15,8 5,3 15,1 7,0 4,4 4,3 0,1 0,1 0,3 0,6 0,8 0,7 10,1 9,3 7,5 0,0 0,3 1,1
MSCI EUROPE TCH H/W/EQ 21,1 19,0 17,4 19,4 5,2 10,9 9,3 8,0 1,9 6,8 1,1 4,9 0,9 3,1 1,2 5,2 1,8 4,4 3,5 -0,5 0,2 0,9
MSCI EUROPE COMM. SERVICES 17,3 14,9 13,3 15,4 -4,5 15,7 12,1 12,4 -4,3 -8,1 -0,1 -4,0 -0,1 -6,0 -0,9 -4,7 -0,5 1,4 1,9 0,0 -1,2 4,3
MSCI EUROPE TELECOM 15,6 13,6 12,1 14,0 -7,0 14,9 12,1 10,9 -5,4 -7,3 -0,5 -2,3 0,1 -4,8 -1,4 -3,2 1,0 0,5 1,3 0,0 0,3 4,7
MSCI EUROPE MEDIA & ENTER. 23,2 19,6 17,5 20,2 6,6 18,7 11,9 18,0 0,0 -11,1 1,3 -10,0 -0,6 -10,4 1,1 -10,2 -7,6 5,8 4,3 0,1 -8,5 2,6
MSCI EUROPE UTILITIES 16,4 15,6 14,9 15,8 15,5 5,1 4,9 6,1 0,3 3,5 0,7 1,5 0,9 2,3 0,5 1,7 9,9 2,6 1,1 0,0 0,4 4,2
Sales growth - %1m / 3m % ∆
in SalesDivid
end
yield
(%)2021 2022 2023 12m fwd 2021
1m / 3m % ∆ in EPS
08-11-21
PE EPS Growth - %
08-11-21 2021 2022 202312m
fwd2021 2022 2023
12m
fwd2021 2022 2023
MSCI USA 23,3 21,7 19,8 21,8 48,8 7,4 10,0 11,6 1,9 3,8 0,7 1,972 0,46 1,741 0,897 2,19 15,4 6,8 5,6 0,4 1,2 1,8
MSCI USA ENERGY 16,4 12,5 13,0 13,0 31,2 -3,8 53,6 10,3 18,3 13,8 20,4 9,7 15,2 13,3 20,1 53,6 5,1 -2,4 2,1 5,4 3,8
MSCI USA MATERIALS 15,9 16,0 16,5 15,9 89,2 -0,5 -3,2 8,0 1,9 6,2 2,9 7,4 1,1 2,5 2,7 7,2 25,1 2,2 -0,3 0,9 2,5 1,8
MSCI USA INDUSTRIALS 25,2 21,2 18,7 21,8 47,4 18,7 13,7 21,6 -0,3 0,9 -0,7 0,1 -0,3 0,7 -0,7 0,2 12,0 8,3 5,3 -0,5 -0,2 1,5
MSCI USA CAP GDS 24,3 20,1 17,7 20,6 43,1 20,6 13,8 22,7 -1,0 -0,6 -1,5 -0,2 -0,5 0,9 -1,4 -0,3 10,0 8,9 5,2 -1,2 -0,9 1,7
MSCI USA COML SVS/SUP 34,0 30,3 27,0 30,8 17,2 12,3 12,3 12,6 0,2 0,6 0,0 0,6 -0,4 0,4 0,1 0,6 12,6 7,6 6,0 0,5 0,6 1,0
MSCI USA TRANSPT 24,0 20,9 18,3 21,5 83,7 15,8 13,7 22,2 1,2 5,5 1,5 1,0 0,1 0,2 1,5 1,6 17,7 6,7 5,2 1,3 1,8 1,4
MSCI USA CONS DISCR 40,1 31,4 26,0 32,6 74,2 27,7 21,0 33,1 1,1 -0,8 0,2 -1,4 1,1 0,9 0,3 -1,4 17,9 13,7 10,2 -0,2 -1,2 1,5
MSCI USA AUTO & COMPO 45,6 39,3 33,7 40,3 99,5 15,9 16,6 23,5 7,5 1,7 1,9 1,8 5,7 9,1 2,7 1,7 14,6 18,9 10,5 -1,4 -3,8 1,7
MSCI USA CONS DUR/APP 21,0 18,4 16,0 19,2 40,4 13,9 15,3 14,5 -0,1 -3,2 0,2 -2,6 0,7 -0,6 0,3 -3,6 18,8 12,5 8,3 -0,6 -2,0 1,2
MSCI USA CONS SVS 154,9 32,7 23,8 36,5 373,7 37,1 704,8 -21,1 -45,8 -0,5 -2,8 1,1 0,8 -0,7 -3,2 27,2 34,9 12,9 -0,5 -0,4 1,9
MSCI USA RETAILING 36,3 32,3 27,1 33,0 34,1 12,3 19,5 16,5 0,1 0,6 -0,1 -1,5 0,0 -0,9 -0,1 -1,1 17,5 9,4 10,0 0,3 -0,3 1,5
MSCI USA CONS STAPLES 21,6 20,3 18,8 20,3 9,9 6,4 7,9 6,5 -0,3 1,2 -0,3 0,5 -0,2 0,5 -0,4 0,5 7,1 3,7 3,9 0,5 2,1 2,6
MSCI USA FD/STAPLES RTL 25,5 23,4 21,7 23,3 10,0 9,1 7,9 8,9 0,0 6,0 0,0 4,2 -0,1 3,5 -0,1 4,2 3,7 4,6 4,4 0,0 2,2 1,4
MSCI USA FD/BEV/TOB 18,6 17,6 16,3 17,8 10,8 5,9 7,6 6,0 -0,1 0,8 -0,1 0,1 0,0 -0,1 -0,2 0,0 13,0 1,9 2,8 1,1 2,2 3,4
MSCI USA H/H PERS PRD 26,2 24,9 23,0 24,5 7,3 5,2 8,6 5,7 -3,7 -4,5 -1,3 -1,9 -1,0 -0,8 -1,3 -1,6 7,0 5,1 4,3 -0,1 -0,1 2,3
MSCI USA HEALTH CARE 18,4 17,5 16,8 17,7 25,0 5,2 4,4 7,9 1,4 3,2 0,3 2,0 -0,5 0,5 0,5 2,1 13,3 5,6 4,6 0,5 1,4 1,9
MSCI USA H/C EQ/SVS 22,9 21,6 19,4 21,9 22,4 5,9 11,5 8,2 1,9 2,5 0,3 0,1 0,3 0,2 0,6 0,4 10,4 6,3 5,9 0,6 1,2 1,2
MSCI USA PHARM/BIOTEC 15,5 14,8 14,9 14,9 26,8 4,8 -0,2 7,7 1,1 3,6 0,3 3,2 -1,0 0,7 0,4 3,3 24,4 3,2 -0,3 0,5 2,2 2,5
MSCI USA FINANCIALS 13,6 14,8 13,4 14,6 64,4 -8,3 10,8 -0,4 3,9 5,0 1,4 2,1 0,9 2,3 1,9 2,6 6,8 2,4 5,5 0,8 2,7 2,0
MSCI USA BANKS 11,4 13,6 12,1 13,2 89,4 -16,2 12,3 -6,1 5,5 5,5 1,2 1,3 -0,1 1,1 2,0 2,0 2,4 1,7 5,2 0,9 1,0 2,3
MSCI USA DIV FIN 15,9 16,9 15,4 16,7 61,6 -5,9 9,7 1,4 4,6 6,2 2,3 3,0 1,8 3,3 2,7 3,5 10,8 1,6 5,8 1,3 5,2 1,7
MSCI USA INSURANCE 14,1 13,2 12,0 13,4 27,1 6,4 10,1 9,2 -1,6 1,2 0,3 2,0 1,0 2,7 0,0 1,9 5,8 3,9 5,4 0,3 1,1 1,8
MSCI USA REAL ESTATE 47,6 47,7 42,7 47,8 27,2 -0,5 11,7 3,3 0,3 10,7 1,3 5,8 1,1 5,7 1,1 6,6 12,3 7,6 6,8 0,3 2,4 2,5
MSCI USA IT 30,9 28,3 25,5 28,1 37,0 9,2 10,8 9,8 1,2 3,9 -0,1 1,2 -0,2 1,6 0,1 1,5 19,0 8,6 7,9 0,0 1,1 1,0
MSCI USA S/W & SVS 42,3 36,8 31,9 36,6 24,4 14,8 15,5 14,7 -0,2 2,3 0,9 2,4 0,7 2,4 0,9 2,5 15,6 13,2 12,0 -0,2 0,3 1,0
MSCI USA TCH H/W/EQ 23,9 22,8 21,5 22,7 52,1 4,8 6,2 4,9 -0,3 4,5 0,3 2,1 0,5 2,0 0,3 2,1 20,4 4,1 4,4 0,0 1,7 0,9
MSCI USA COMM SERVICES 23,6 21,8 18,9 21,9 62,0 8,4 15,2 14,4 1,0 3,5 -1,1 0,0 -0,5 0,4 -0,8 0,5 15,2 8,8 8,7 -0,2 -0,1 4,0
MSCI USA TELECOM 9,9 10,1 9,6 10,1 11,5 -2,3 6,2 -0,2 -0,4 0,7 0,2 -0,7 1,6 0,1 0,1 -0,5 1,8 -3,8 1,7 -0,7 -2,1 6,5
MSCI USA MEDIA & ENTER. 28,5 25,4 21,5 25,7 93,9 12,2 18,1 20,1 1,6 4,6 -1,6 0,3 -1,1 0,5 -1,1 0,9 23,0 14,9 11,4 0,1 1,0 1,7
MSCI USA UTILITIES 20,7 18,8 17,6 19,1 -2,4 10,2 6,5 8,0 -0,3 0,5 0,1 0,2 0,3 0,9 0,0 0,3 8,6 3,0 2,4 0,0 0,4 3,1
1m / 3m % ∆
in Sales
Divid
end
yield
(%)2021 2022 2023 12m fwd 2021
Sales growth - %PE EPS Growth - % 1m / 3m % ∆ in EPS

CONNECT WITH US
wealthmanagement.bnpparibas
DISCLAIMER