Aerospace & Defense Analyst Briefing: 2008 Outlook and Investment Themes
29
Aerospace & Defense 2008 Outlook and Investment Themes July 8, 2008 Ken Herbert Vice President/Partner
-
Upload
frost-sullivan -
Category
Business
-
view
3.709 -
download
2
Transcript of Aerospace & Defense Analyst Briefing: 2008 Outlook and Investment Themes
Aerospace & Defense
2008 Outlook and Investment Themes
July 8, 2008
Ken Herbert
Vice President/Partner
2www.frost.com
Agenda
• Industry Fundamentals
• Market Outlook
• Investment Themes and Proprietary Research
3www.frost.com
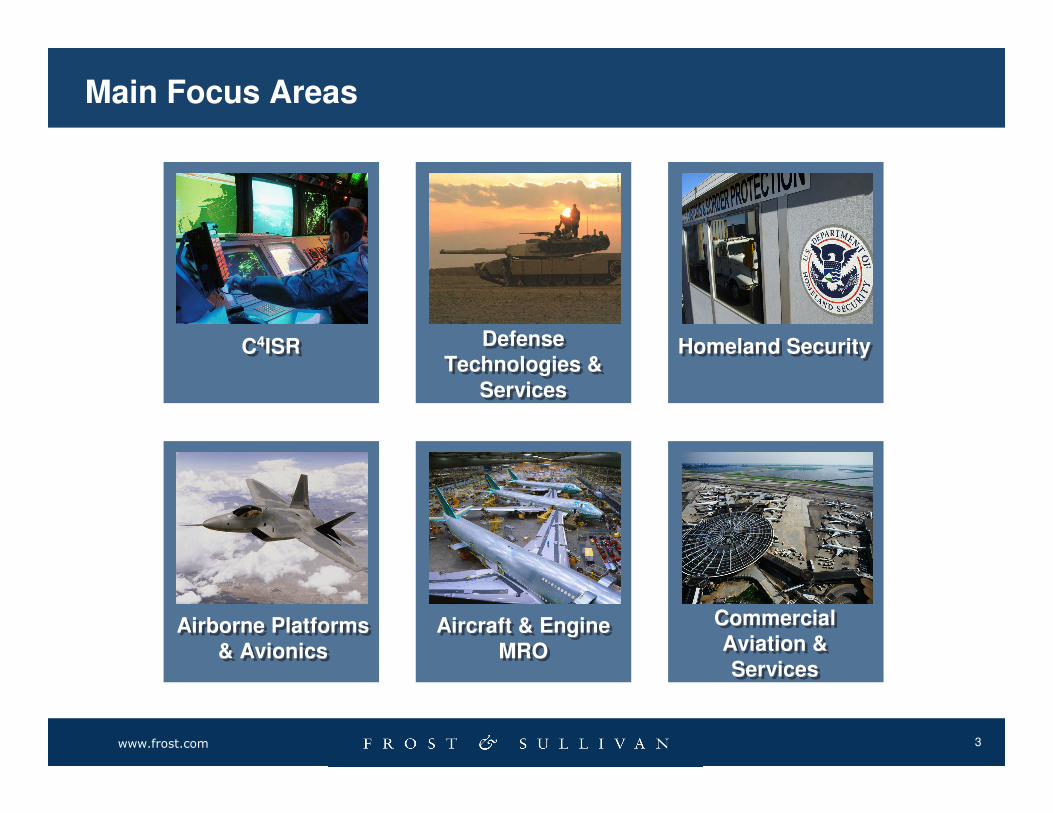
Main Focus Areas
Commercial Aviation & Services
Commercial Aviation & Services
Defense Technologies &
Services
Defense Technologies &
Services
Airborne Platforms & Avionics
Airborne Platforms & Avionics
Aircraft & Engine MRO
Aircraft & Engine MRO
Homeland SecurityHomeland SecurityC4ISRC4ISR
4www.frost.com
Agenda
• Industry Fundamentals
5www.frost.com
Key Issues Impacting Industry Today
1. Top line growth facing headwinds, Commercial aerospace and Defense
cycles peaking?
2. Changing administration and political uncertainty
3. Shifting defense procurement priorities
4. Aircraft OEMs shifting business model, pushing more risk onto suppliers,
geographic expansion
5. Secular Asian growth drives need for exposure across entire industry
6. PMA and MRO models evolving
7. Increasing industry consolidation, European firms building presence in US
defense market, Asian firms expanding globally
8. Maintaining earnings growth as cycles slow, managing costs and margins
9. Effective position in homeland security market to maximize opportunities
10. Business jet offset, how much more can it provide?
6www.frost.com
Industry Fundamentals: Commercial Aerospace
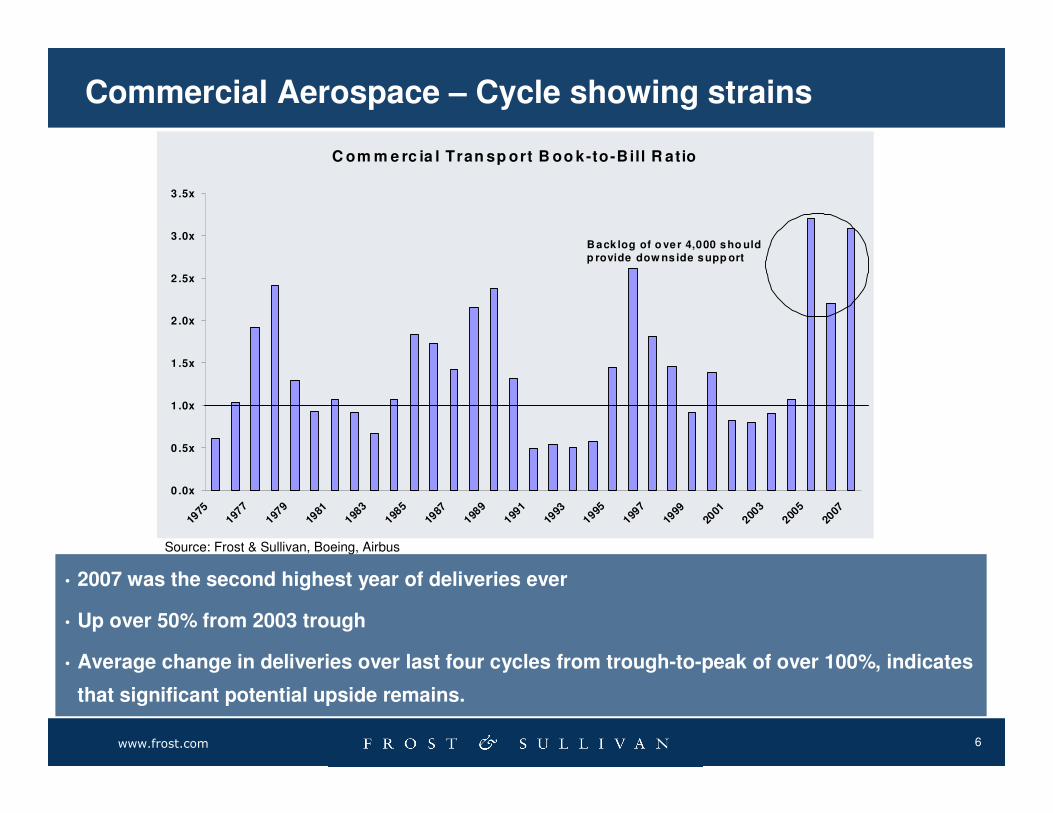
• 2007 was the second highest year of deliveries ever
• Up over 50% from 2003 trough
• Average change in deliveries over last four cycles from trough-to-peak of over 100%, indicates
that significant potential upside remains.
C om m e rc ia l Tran sp ort B oo k-to-Bill R atio
0 .0x
0 .5x
1 .0x
1 .5x
2 .0x
2 .5x
3 .0x
3 .5x
1975
1977
1979
1981
1983
1985
1987
1989
1991
1993
1995
1997
1999
2001
2003
2005
2007
B ack log of o ver 4,000 sho uld p rovide dow ns ide supp ort
Commercial Aerospace – Cycle showing strains
Source: Frost & Sullivan, Boeing, Airbus
7www.frost.com
Industry Fundamentals: Commercial Aerospace
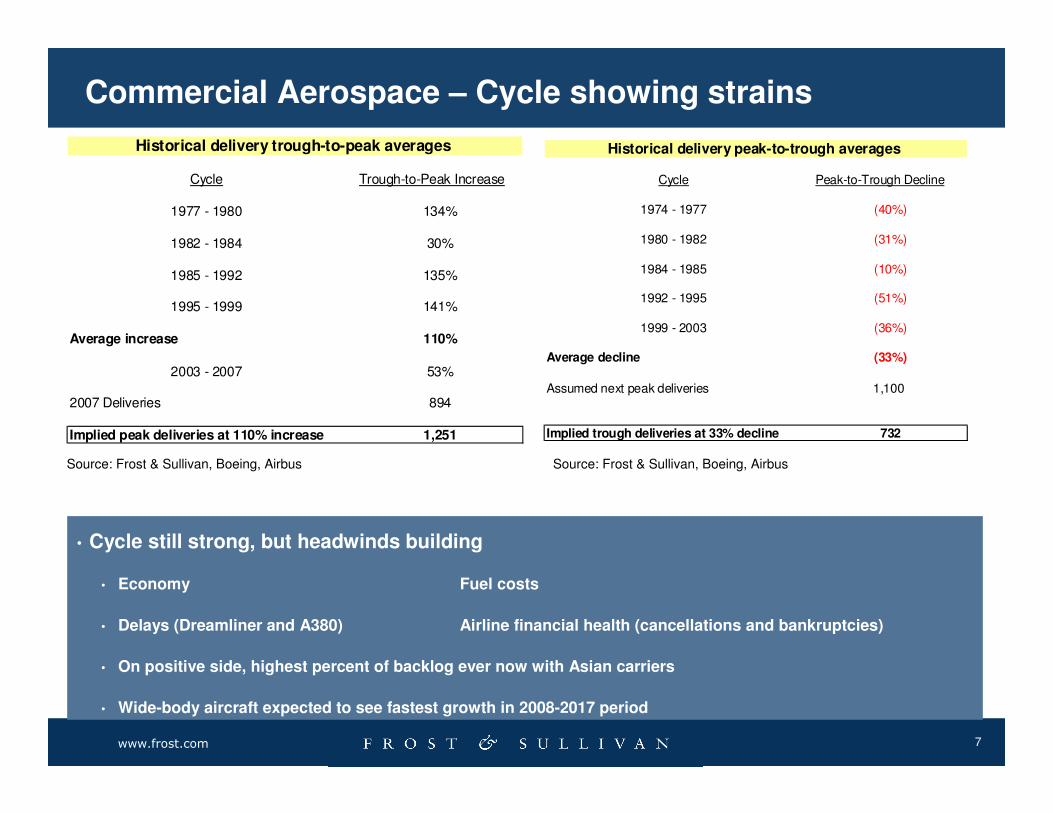
• Cycle still strong, but headwinds building
• Economy Fuel costs
• Delays (Dreamliner and A380) Airline financial health (cancellations and bankruptcies)
• On positive side, highest percent of backlog ever now with Asian carriers
• Wide-body aircraft expected to see fastest growth in 2008-2017 period
Commercial Aerospace – Cycle showing strains
Cycle Trough-to-Peak Increase
1977 - 1980 134%
1982 - 1984 30%
1985 - 1992 135%
1995 - 1999 141%
Average increase 110%
2003 - 2007 53%
2007 Deliveries 894
Implied peak deliveries at 110% increase 1,251
Historical delivery trough-to-peak averages
Cycle Peak-to-Trough Decline
1974 - 1977 (40%)
1980 - 1982 (31%)
1984 - 1985 (10%)
1992 - 1995 (51%)
1999 - 2003 (36%)
Average decline (33%)
Assumed next peak deliveries 1,100
Implied trough deliveries at 33% decline 732
Historical delivery peak-to-trough averages
Source: Frost & Sullivan, Boeing, Airbus Source: Frost & Sullivan, Boeing, Airbus
8www.frost.com
Business Jets providing offset
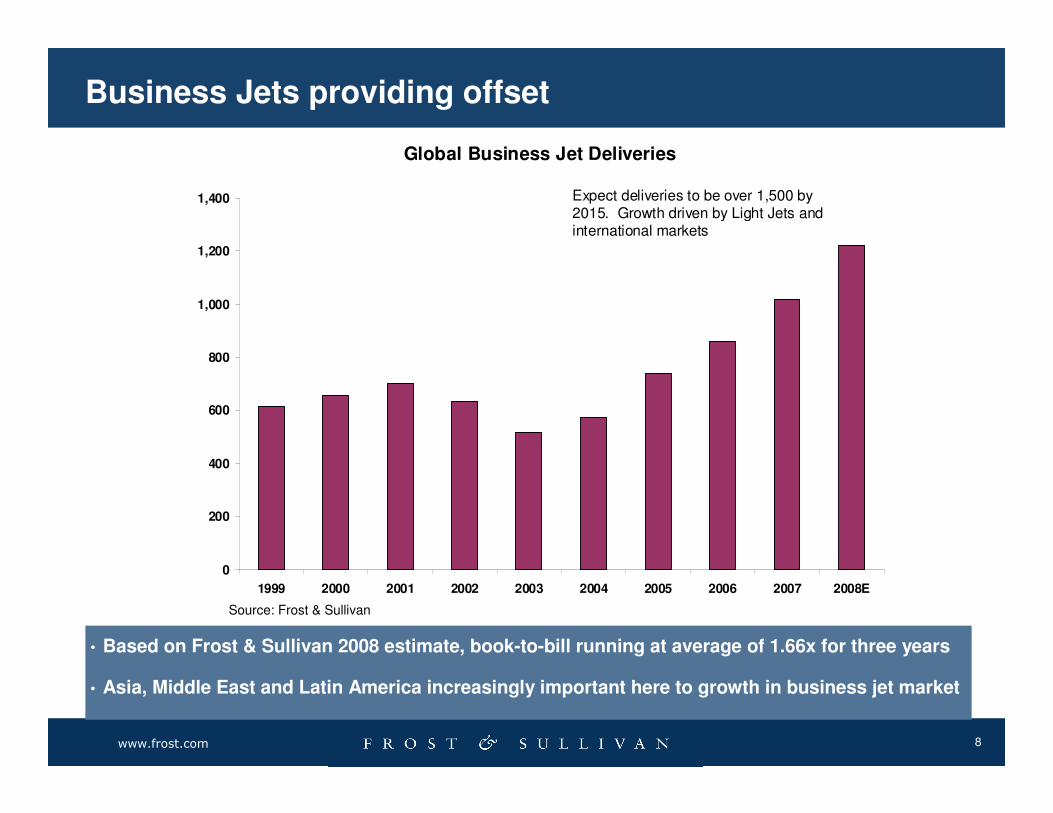
• Based on Frost & Sullivan 2008 estimate, book-to-bill running at average of 1.66x for three years
• Asia, Middle East and Latin America increasingly important here to growth in business jet market
Global Business Jet Deliveries
0
200
400
600
800
1,000
1,200
1,400
1999 2000 2001 2002 2003 2004 2005 2006 2007 2008E
Expect deliveries to be over 1,500 by 2015. Growth driven by Light Jets and international markets
Source: Frost & Sullivan
9www.frost.com
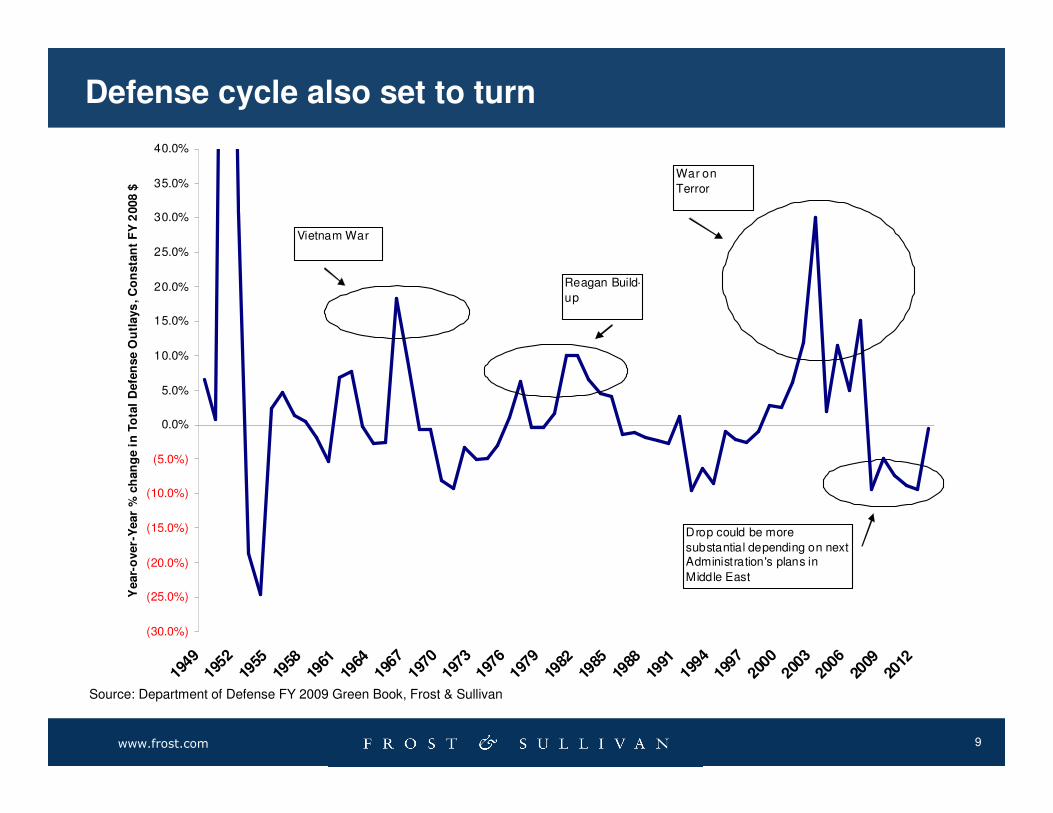
Defense cycle also set to turn
(30.0%)
(25.0%)
(20.0%)
(15.0%)
(10.0%)
(5.0%)
0.0%
5.0%
10.0%
15.0%
20.0%
25.0%
30.0%
35.0%
40.0%
1949
1952
1955
1958
1961
1964
1967
1970
1973
1976
1979
1982
1985
1988
1991
1994
1997
2000
2003
2006
2009
2012
Year-
over-
Year
% c
han
ge i
n T
ota
l D
efe
nse O
utl
ays
, C
on
sta
nt
FY
2008 $
Drop could be more
substantial depending on next Administration's plans in
Middle East
Vietnam War
Reagan Build-
up
War on
Terror
Source: Department of Defense FY 2009 Green Book, Frost & Sullivan
10www.frost.com
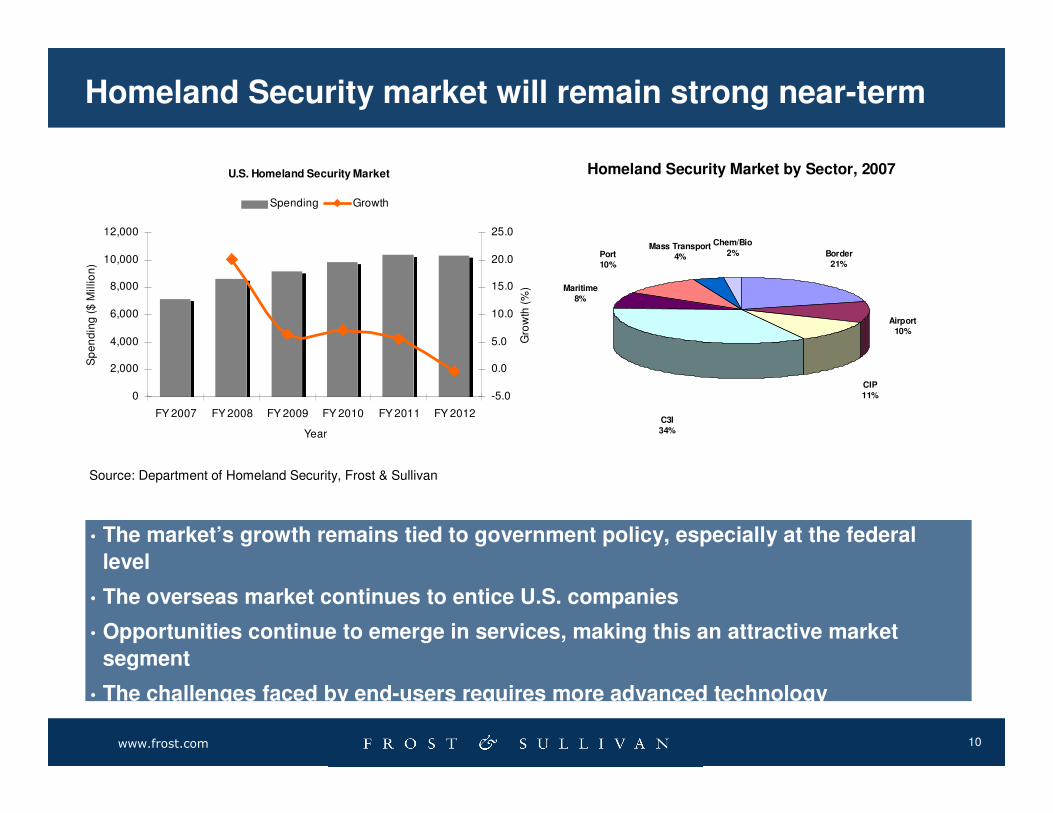
Homeland Security market will remain strong near-term
• The market’s growth remains tied to government policy, especially at the federal
level
• The overseas market continues to entice U.S. companies
• Opportunities continue to emerge in services, making this an attractive market
segment
• The challenges faced by end-users requires more advanced technology
U.S. Homeland Security Market
0
2,000
4,000
6,000
8,000
10,000
12,000
FY 2007 FY 2008 FY 2009 FY 2010 FY 2011 FY 2012
Year
Sp
en
din
g (
$ M
illio
n)
-5.0
0.0
5.0
10.0
15.0
20.0
25.0
Gro
wth
(%
)
Spending Growth
Homeland Security Market by Sector, 2007
Mass Transport4%
Chem/Bio2%Port
10%
Maritime8%
C3I34%
CIP11%
Airport10%
Border21%
Source: Department of Homeland Security, Frost & Sullivan

11www.frost.com
Agenda
• Market Outlook
12www.frost.com
Frost & Sullivan Market Outlook
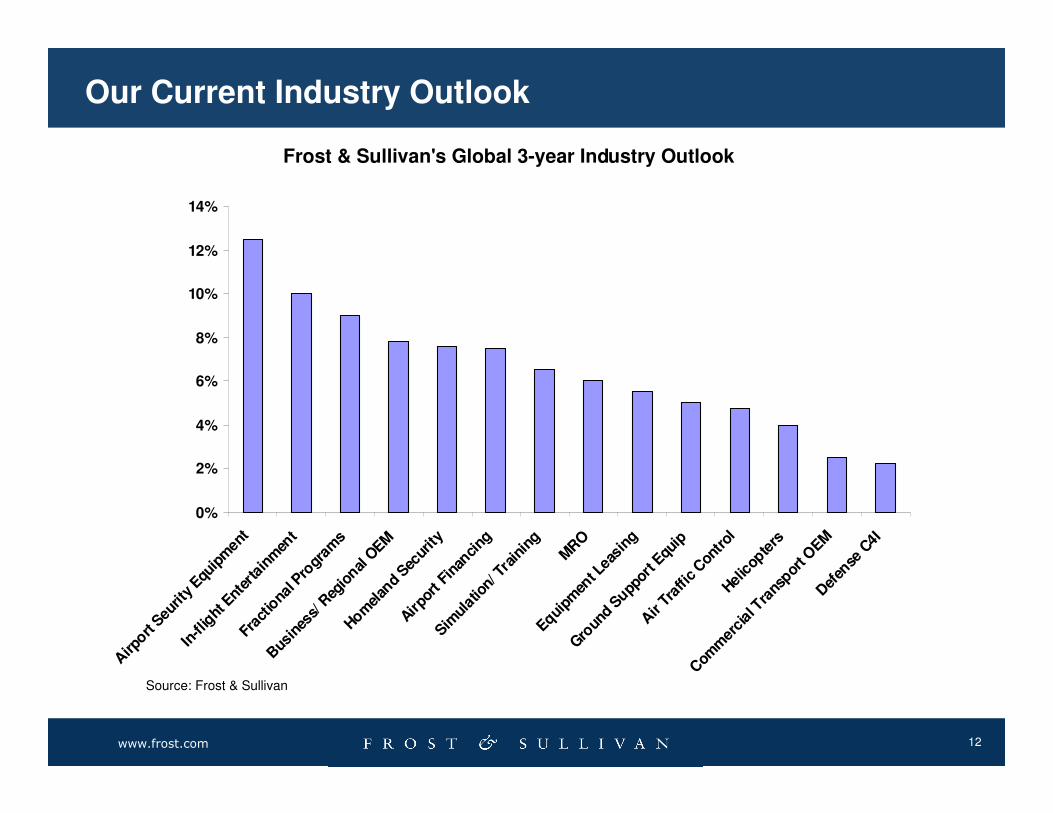
Our Current Industry Outlook
Frost & Sullivan's Global 3-year Industry Outlook
0%
2%
4%
6%
8%
10%
12%
14%
Airp
ort Seu
rity
Equip
men
t
In-fl
ight
Ent
erta
inm
ent
Frac
tiona
l Pro
gram
s
Bus
ines
s/ R
egio
nal O
EM
Homel
and
Secur
ity
Airpo
rt F
inan
cing
Simul
atio
n/ T
rain
ing
MR
O
Equipm
ent L
easi
ng
Gro
und
Suppor
t Equ
ip
Air
Traf
fic C
ontr
olHel
icop
ters
Com
mer
cial
Tra
nspor
t OEM
Def
ense
C4I
Source: Frost & Sullivan

13www.frost.com
Agenda
• Investment Themes
14www.frost.com
Agenda
• Secular Asian growth story will continue – opportunities across the
value chain
• Business jet risk to the upside
• Shifting DoD procurement trends creating opportunities
• Cost rationalization and cost structure shifting
• Evolving MRO and PMA business models
15www.frost.com
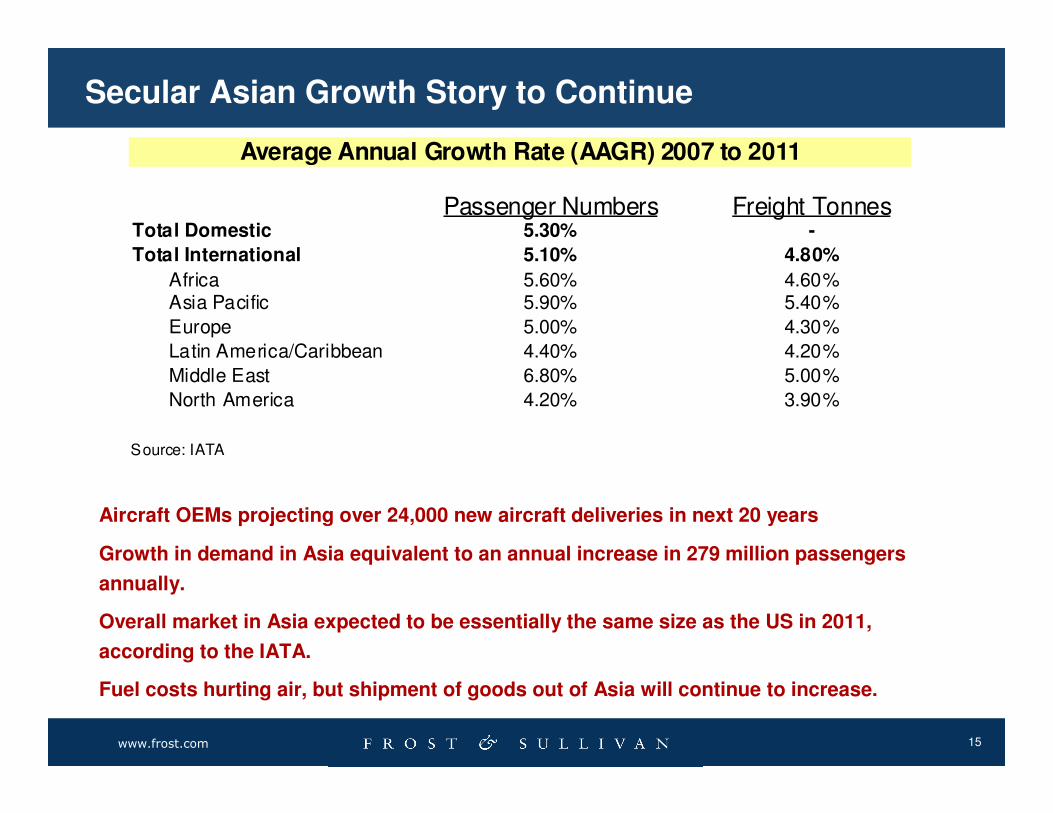
Industry Outlook : Commercial Aerospace
Passenger Numbers Freight TonnesTotal Domestic 5.30% -
Total International 5.10% 4.80%
Africa 5.60% 4.60%Asia Pacific 5.90% 5.40%
Europe 5.00% 4.30%
Latin America/Caribbean 4.40% 4.20%
Middle East 6.80% 5.00%
North America 4.20% 3.90%
Source: IATA
Average Annual Growth Rate (AAGR) 2007 to 2011
Aircraft OEMs projecting over 24,000 new aircraft deliveries in next 20 years
Growth in demand in Asia equivalent to an annual increase in 279 million passengers
annually.
Overall market in Asia expected to be essentially the same size as the US in 2011,
according to the IATA.
Fuel costs hurting air, but shipment of goods out of Asia will continue to increase.
Secular Asian Growth Story to Continue
16www.frost.com
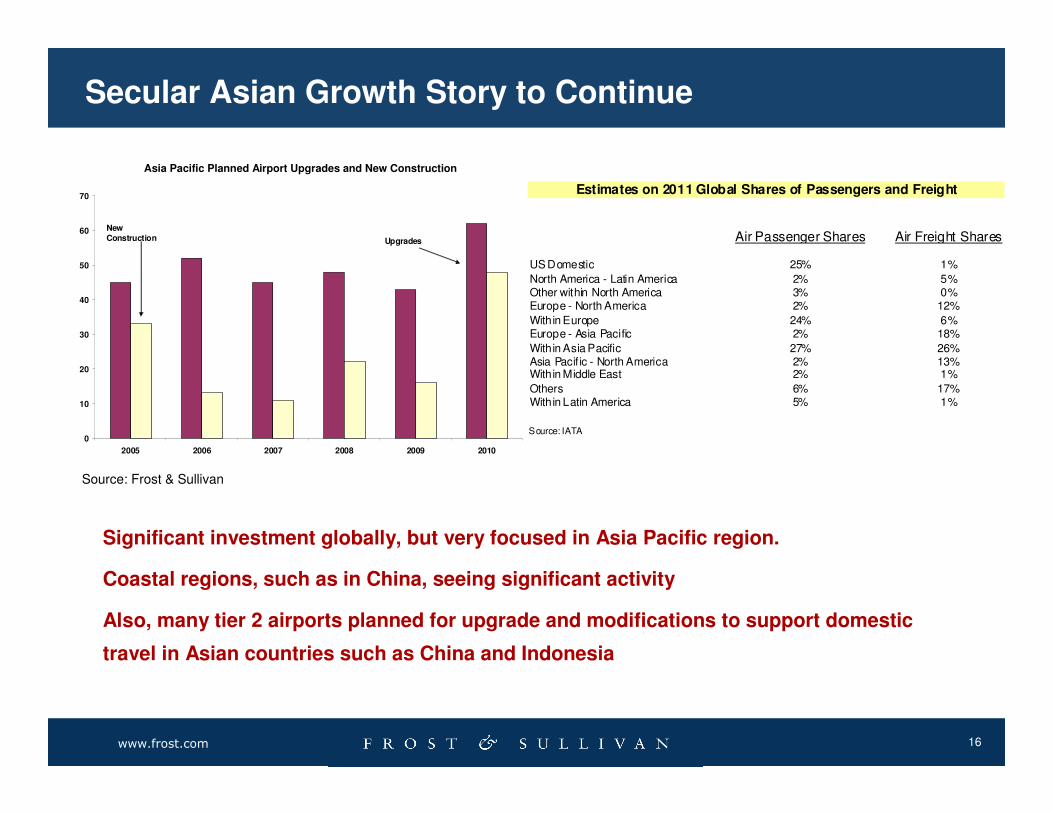
Industry Fundamentals : Commercial Aerospace
Significant investment globally, but very focused in Asia Pacific region.
Coastal regions, such as in China, seeing significant activity
Also, many tier 2 airports planned for upgrade and modifications to support domestic
travel in Asian countries such as China and Indonesia
Asia Pacific Planned Airport Upgrades and New Construction
0
10
20
30
40
50
60
70
2005 2006 2007 2008 2009 2010
Upgrades
New Construction
Secular Asian Growth Story to Continue
Air Passenger Shares Air Freight Shares
US Domestic 25% 1%
North America - Latin America 2% 5%Other within North America 3% 0%Europe - North America 2% 12%
Within Europe 24% 6%Europe - Asia Pacific 2% 18%
Within Asia Pacific 27% 26%Asia Pacif ic - North America 2% 13%Within Middle East 2% 1%
Others 6% 17%Within Latin America 5% 1%
Source: IATA
Estimates on 2011 Global Shares of Passengers and Freight
Source: Frost & Sullivan
17www.frost.com
Asia Pacific Aerospace service sector will provide significant opportunities
across spectrum of offerings
Gaps in availability of pilots, maintenance professionals, and cabin crew well understood.
Industry estimates are that at least 17,000 pilots annually need to be trained to keep pace
with optimistic delivery forecasts. These estimates exceed current capacity significantly.
China alone estimates it needs at least 18,000 pilots over the next 20 years.
While obvious opportunities can be played--simulation and training equipment and
hardware, certification programs, language and translation—seeing significant interest
from clients in other ways to benefit.
Secular Asian Growth Story to Continue
18www.frost.com
Business and Regional Jet Risk to the Upside
� Historically, the global business jet market was driven by corporate purchasing in the United
States. That market is currently pressured, resulting in some lowered expectations.
� Our current conservative estimates are that this market will grow by between 8% and 10%
through 2010.
� However, in 2007 over 50% of new business jet purchases are made outside of the US. This
has been driven by wealth creation and explosion of fractional jet model in Asia and Europe.
� Moreover, current expectations are that over 1,600 jets over 30 years of age will retire in the
next three to five years. This accounts for almost 20% of the future expected demand.
� However, there are an additional 1,800 jets that are over 25 years of age in service. We
believe that an acceleration of the replacement rate for these jets is likely. Newer jets are
much more fuel efficient. Moreover, the price of new jets is falling.
� If an additional 25% of the jets that are currently over 25 years old get retired early, the
industry growth can get closer to 15%.
Business Jet Market – Risks to the Upside
19www.frost.com
Business and Regional Jet Risk to the Upside
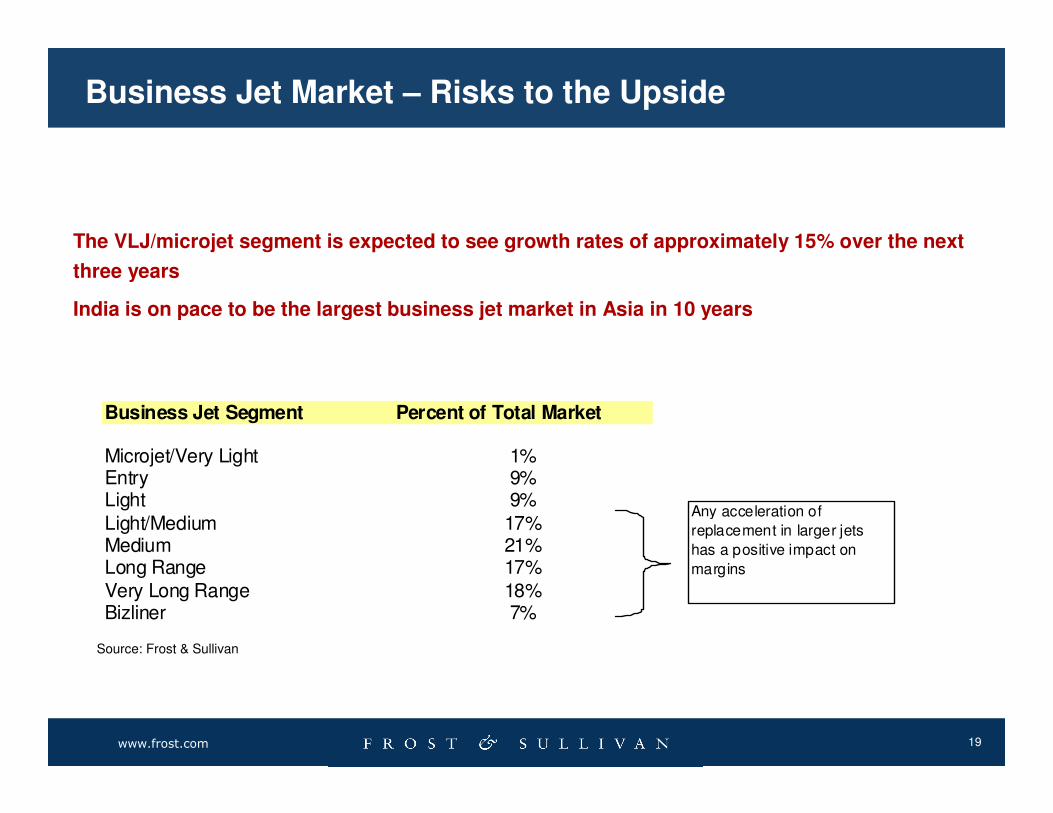
The VLJ/microjet segment is expected to see growth rates of approximately 15% over the next
three years
India is on pace to be the largest business jet market in Asia in 10 years
Business Jet Segment Percent of Total Market
Microjet/Very Light 1%Entry 9%Light 9%Light/Medium 17%Medium 21%Long Range 17%Very Long Range 18%Bizliner 7%
Any acceleration of
replacement in larger jets
has a positive impact on
margins
Business Jet Market – Risks to the Upside
Source: Frost & Sullivan
20www.frost.com
Shifting DoD Procurement Policies Creating Opportunities
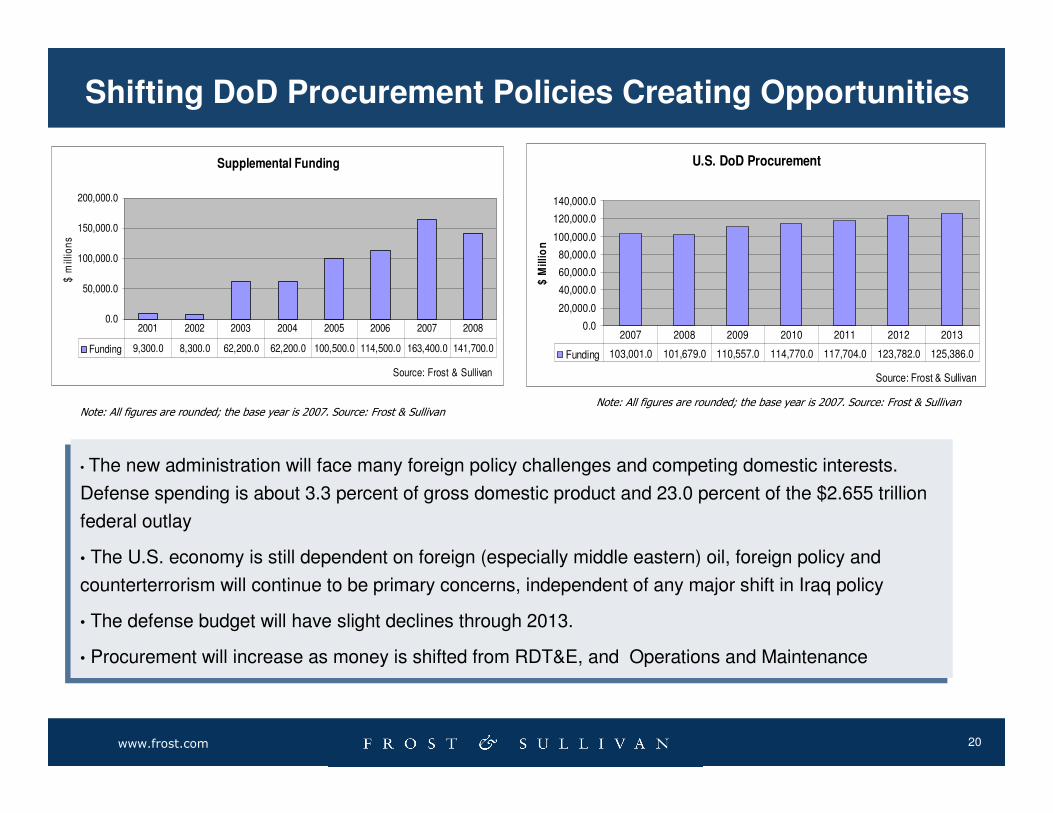
• The new administration will face many foreign policy challenges and competing domestic interests.
Defense spending is about 3.3 percent of gross domestic product and 23.0 percent of the $2.655 trillion
federal outlay
• The U.S. economy is still dependent on foreign (especially middle eastern) oil, foreign policy and
counterterrorism will continue to be primary concerns, independent of any major shift in Iraq policy
• The defense budget will have slight declines through 2013.
• Procurement will increase as money is shifted from RDT&E, and Operations and Maintenance
Note: All figures are rounded; the base year is 2007. Source: Frost & SullivanNote: All figures are rounded; the base year is 2007. Source: Frost & Sullivan
U.S. DoD Procurement
0.0
20,000.0
40,000.0
60,000.0
80,000.0
100,000.0
120,000.0
140,000.0
Source: Frost & Sullivan
$ M
illi
on
Funding 103,001.0 101,679.0 110,557.0 114,770.0 117,704.0 123,782.0 125,386.0
2007 2008 2009 2010 2011 2012 2013
Supplemental Funding
0.0
50,000.0
100,000.0
150,000.0
200,000.0
Source: Frost & Sullivan
$ m
illio
ns
Funding 9,300.0 8,300.0 62,200.0 62,200.0 100,500.0 114,500.0 163,400.0 141,700.0
2001 2002 2003 2004 2005 2006 2007 2008
21www.frost.com
C4ISR – Funding and Programs
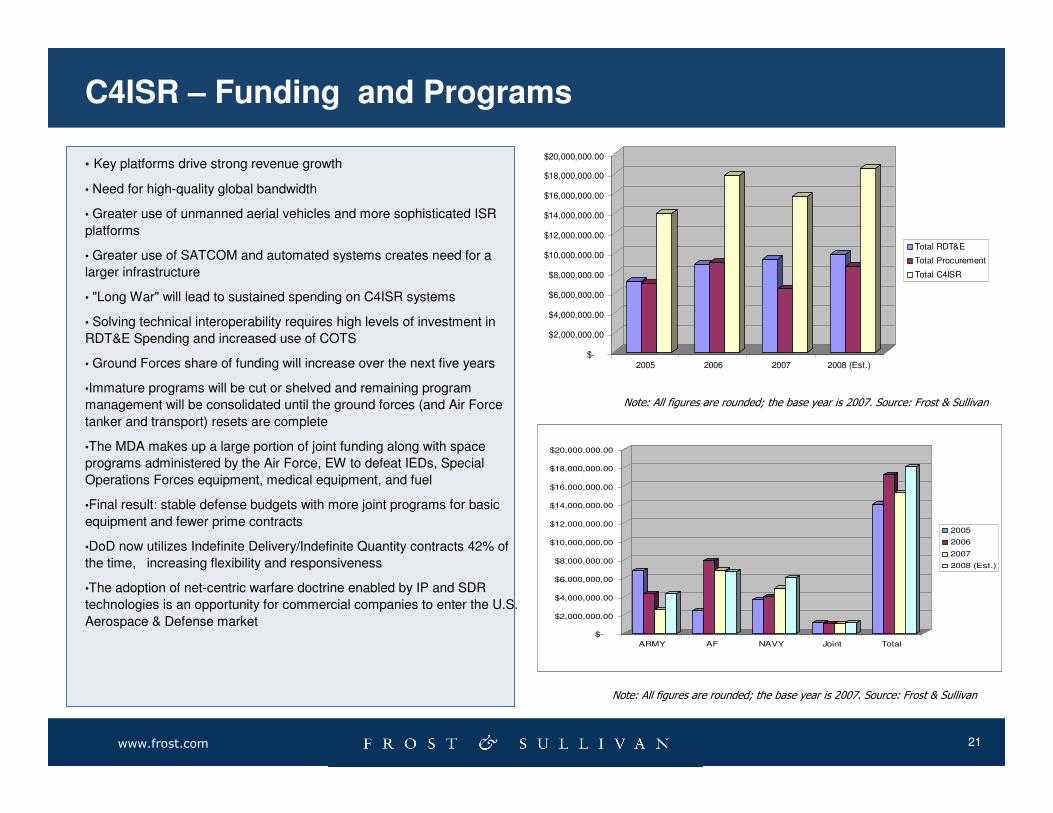
• Key platforms drive strong revenue growth
• Need for high-quality global bandwidth
• Greater use of unmanned aerial vehicles and more sophisticated ISR
platforms
• Greater use of SATCOM and automated systems creates need for a
larger infrastructure
• "Long War" will lead to sustained spending on C4ISR systems
• Solving technical interoperability requires high levels of investment in
RDT&E Spending and increased use of COTS
• Ground Forces share of funding will increase over the next five years
•Immature programs will be cut or shelved and remaining program
management will be consolidated until the ground forces (and Air Force
tanker and transport) resets are complete
•The MDA makes up a large portion of joint funding along with space
programs administered by the Air Force, EW to defeat IEDs, Special
Operations Forces equipment, medical equipment, and fuel
•Final result: stable defense budgets with more joint programs for basic
equipment and fewer prime contracts
•DoD now utilizes Indefinite Delivery/Indefinite Quantity contracts 42% of
the time, increasing flexibility and responsiveness
•The adoption of net-centric warfare doctrine enabled by IP and SDR
technologies is an opportunity for commercial companies to enter the U.S.
Aerospace & Defense market
Note: All figures are rounded; the base year is 2007. Source: Frost & Sullivan
Note: All figures are rounded; the base year is 2007. Source: Frost & Sullivan
$-
$2,000,000.00
$4,000,000.00
$6,000,000.00
$8,000,000.00
$10,000,000.00
$12,000,000.00
$14,000,000.00
$16,000,000.00
$18,000,000.00
$20,000,000.00
2005 2006 2007 2008 (Est.)
Total RDT&E
Total Procurement
Total C4ISR
$-
$2,000,000.00
$4,000,000.00
$6,000,000.00
$8,000,000.00
$10,000,000.00
$12,000,000.00
$14,000,000.00
$16,000,000.00
$18,000,000.00
$20,000,000.00
ARMY AF NAVY Joint Total
2005
2006
2007
2008 (Est.)
22www.frost.com
LCT & REGIONAL BUSINESS
0
500
1000
1500
2000
2500
3000
3500
4000
A320
Fam
ily
B737
B787
ERJ
B777
DH
C-8
A350
CR
J
A330
ATR
A380
Superje
t
B747
AR
J
A340
No
. o
f d
eli
veri
es (
2008-2
017)
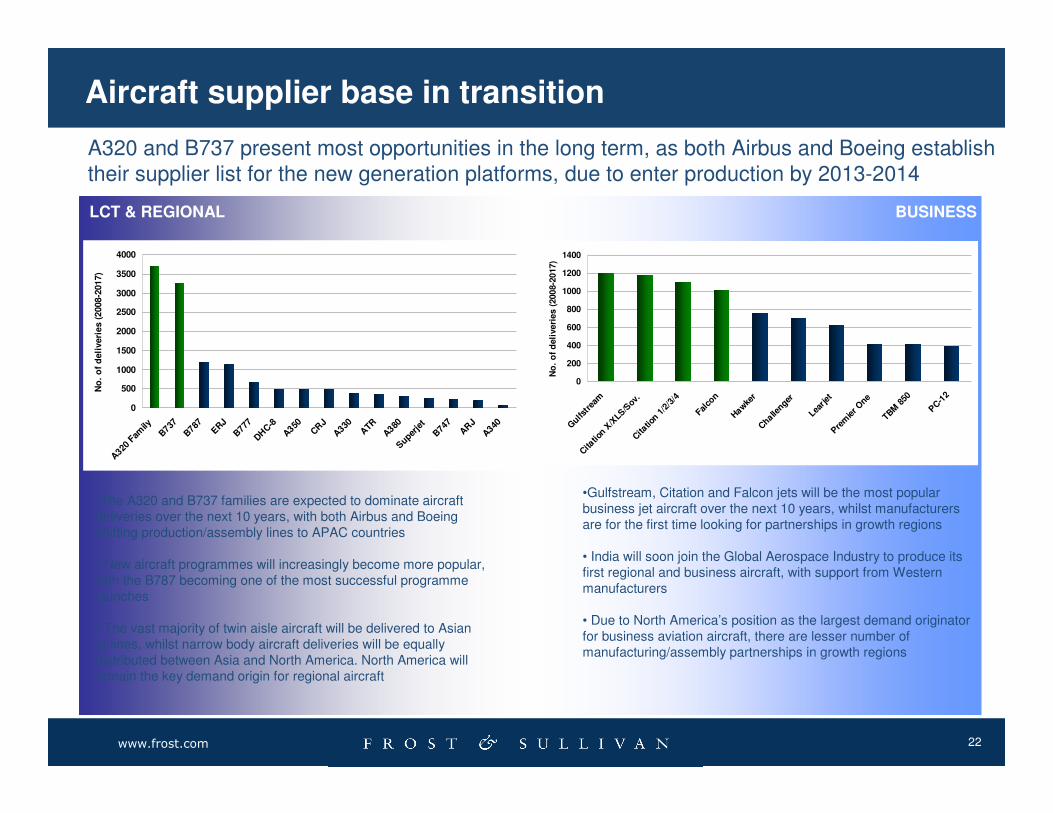
•The A320 and B737 families are expected to dominate aircraft deliveries over the next 10 years, with both Airbus and Boeing shifting production/assembly lines to APAC countries
• New aircraft programmes will increasingly become more popular, with the B787 becoming one of the most successful programme launches
• The vast majority of twin aisle aircraft will be delivered to Asian airlines, whilst narrow body aircraft deliveries will be equallydistributed between Asia and North America. North America will remain the key demand origin for regional aircraft
0
200
400
600
800
1000
1200
1400
Gulfs
trea
m
Cita
tion X
/XLS
/Sov.
Cita
tion 1
/2/3
/4
Falco
n
Hawke
rC
hallenger
Learj
etP
rem
ier O
ne
TBM 8
50
PC
-12
No
. o
f d
eli
veri
es (
2008-2
017)
•Gulfstream, Citation and Falcon jets will be the most popular business jet aircraft over the next 10 years, whilst manufacturers are for the first time looking for partnerships in growth regions
• India will soon join the Global Aerospace Industry to produce its first regional and business aircraft, with support from Western manufacturers
• Due to North America’s position as the largest demand originator for business aviation aircraft, there are lesser number of manufacturing/assembly partnerships in growth regions
A320 and B737 present most opportunities in the long term, as both Airbus and Boeing establish their supplier list for the new generation platforms, due to enter production by 2013-2014
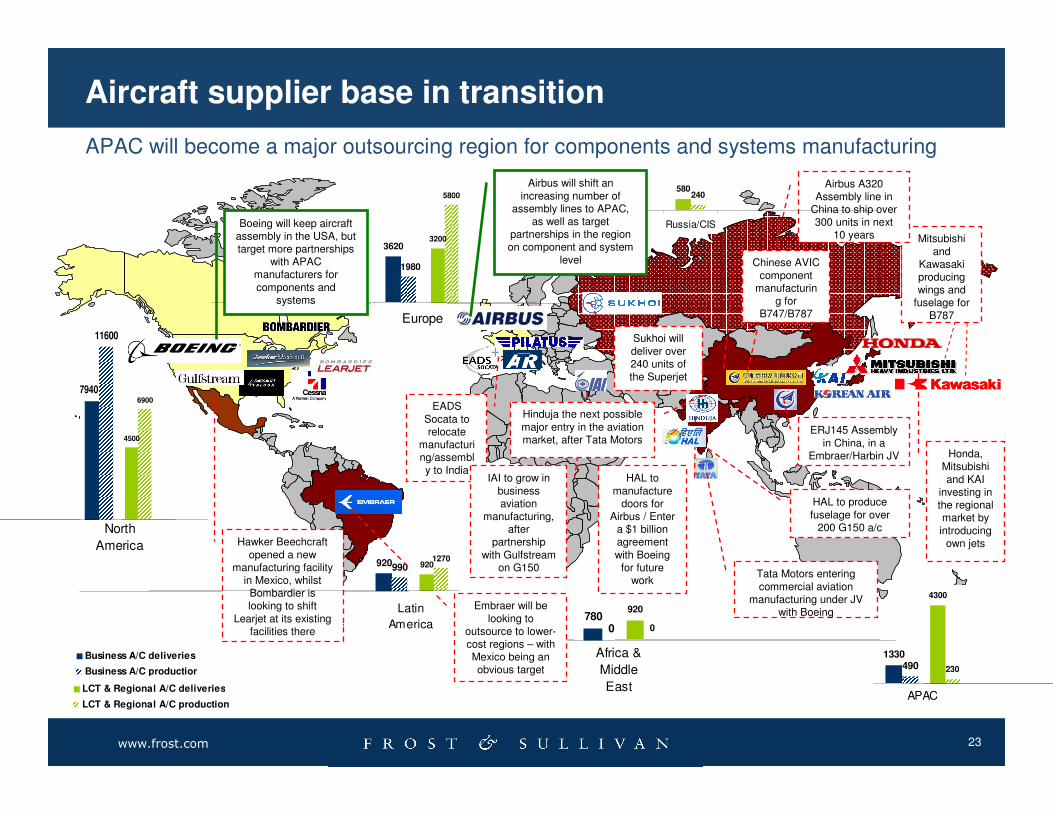
Aircraft supplier base in transition
23www.frost.com
EADS Socata to relocate
manufacturing/assembly to India
HAL to produce fuselage for over
200 G150 a/c
HAL to manufacture
doors for Airbus / Enter
a $1 billion agreement with Boeing
for future work
Tata Motors entering commercial aviation
manufacturing under JV with Boeing
ERJ145 Assembly in China, in a
Embraer/Harbin JV
Mitsubishi and
Kawasaki producing wings and
fuselage for B787
Airbus A320 Assembly line in
China to ship over 300 units in next
10 years
Chinese AVIC component
manufacturing for
B747/B787
APAC will become a major outsourcing region for components and systems manufacturing
4300
230
920
0
580240
Russia/CIS
3200
5800
4500
6900
1330490
0780
Africa &
Middle
EastAPAC
3620
1980
Europe
7940
11600
North
America
920990
Latin
America
LCT & Regional A/C deliveries
LCT & Regional A/C production
Business A/C deliveries
Business A/C production
Boeing will keep aircraft assembly in the USA, but target more partnerships
with APAC manufacturers for components and
systems
Airbus will shift an increasing number of
assembly lines to APAC, as well as target
partnerships in the region on component and system
level
Honda, Mitsubishi and KAI
investing in the regional market by introducing
own jets
Sukhoi will deliver over 240 units of the Superjet
Hawker Beechcraft opened a new
manufacturing facility in Mexico, whilst Bombardier is looking to shift
Learjet at its existing facilities there
Embraer will be looking to
outsource to lower-cost regions – with Mexico being an obvious target
IAI to grow in business aviation
manufacturing, after
partnership with Gulfstream
on G150
Hinduja the next possible major entry in the aviation market, after Tata Motors
1270920
Aircraft supplier base in transition
24www.frost.com
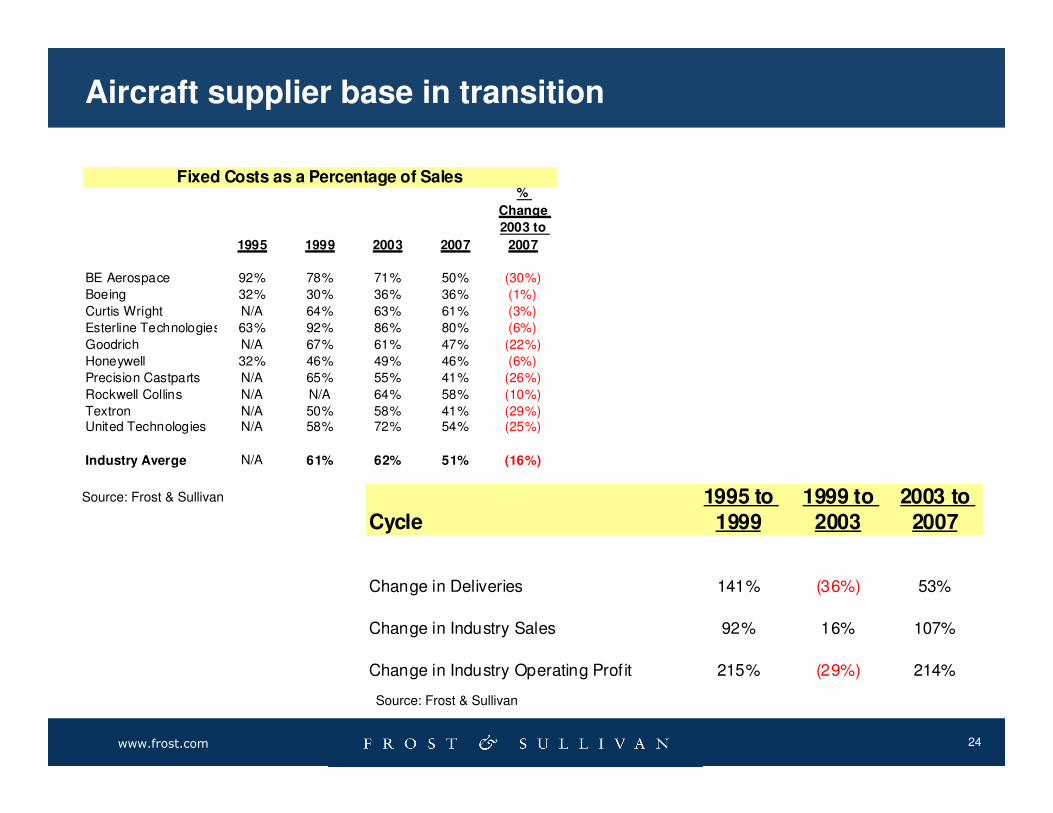
Aircraft supplier base in transition
1995 1999 2003 2007
%
Change
2003 to
2007
BE Aerospace 92% 78% 71% 50% (30%)
Boeing 32% 30% 36% 36% (1%)
Curtis Wright N/A 64% 63% 61% (3%)
Esterline Technologies 63% 92% 86% 80% (6%)
Goodrich N/A 67% 61% 47% (22%)
Honeywell 32% 46% 49% 46% (6%)
Precision Castparts N/A 65% 55% 41% (26%)
Rockwell Collins N/A N/A 64% 58% (10%)
Textron N/A 50% 58% 41% (29%)United Technologies N/A 58% 72% 54% (25%)
Industry Averge N/A 61% 62% 51% (16%)
Fixed Costs as a Percentage of Sales
Cycle1995 to
19991999 to
20032003 to
2007
Change in Deliveries 141% (36%) 53%
Change in Industry Sales 92% 16% 107%
Change in Industry Operating Profit 215% (29%) 214%
Source: Frost & Sullivan
Source: Frost & Sullivan
25www.frost.com
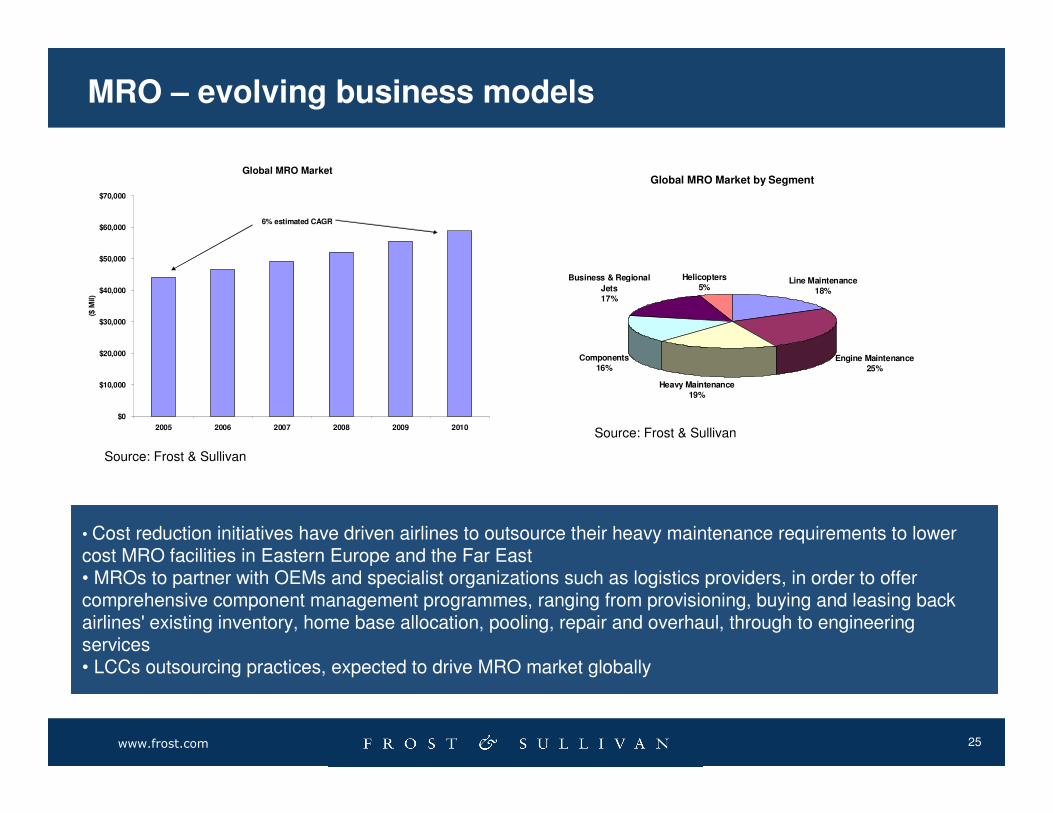
• Cost reduction initiatives have driven airlines to outsource their heavy maintenance requirements to lower cost MRO facilities in Eastern Europe and the Far East• MROs to partner with OEMs and specialist organizations such as logistics providers, in order to offer comprehensive component management programmes, ranging from provisioning, buying and leasing back airlines' existing inventory, home base allocation, pooling, repair and overhaul, through to engineering services• LCCs outsourcing practices, expected to drive MRO market globally
Global MRO Market
$0
$10,000
$20,000
$30,000
$40,000
$50,000
$60,000
$70,000
2005 2006 2007 2008 2009 2010
($ M
il)
6% estimated CAGR
Global MRO Market by Segment
Line Maintenance18%
Engine Maintenance25%
Heavy Maintenance19%
Components16%
Business & Regional
Jets17%
Helicopters5%
MRO – evolving business models
Source: Frost & Sullivan
Source: Frost & Sullivan
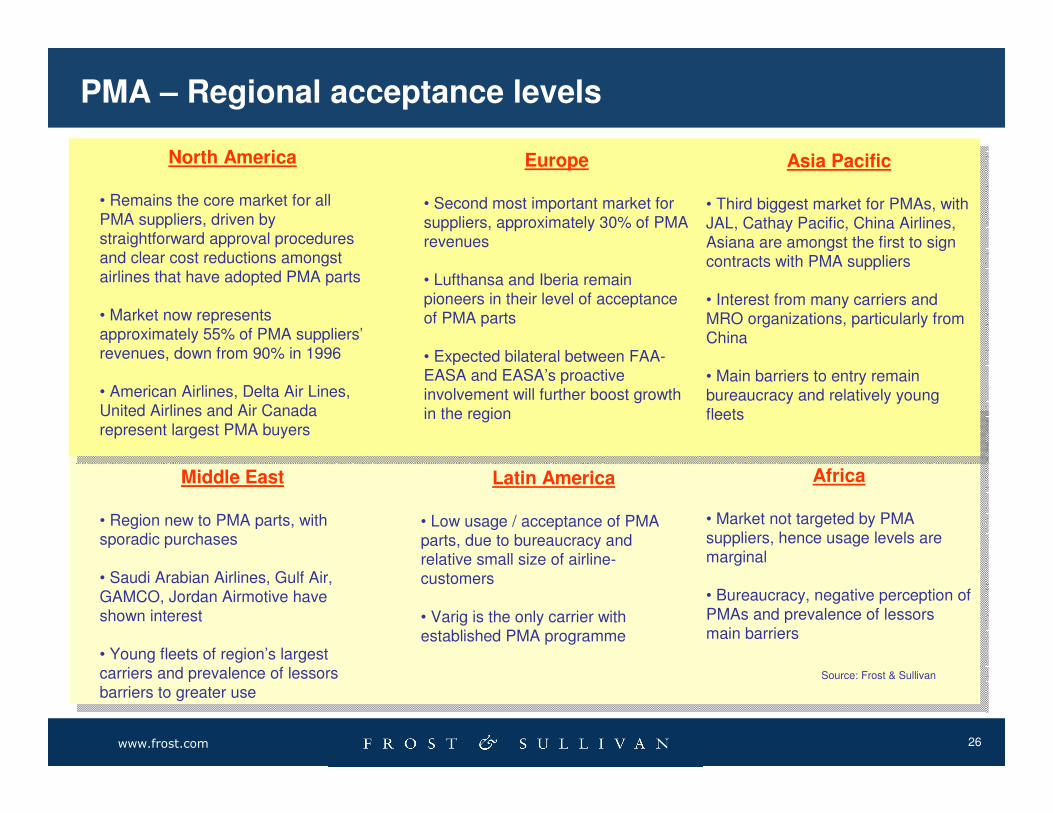
26www.frost.com
North America
• Remains the core market for all PMA suppliers, driven by straightforward approval procedures and clear cost reductions amongst airlines that have adopted PMA parts
• Market now represents approximately 55% of PMA suppliers’revenues, down from 90% in 1996
• American Airlines, Delta Air Lines, United Airlines and Air Canada represent largest PMA buyers
Africa
• Market not targeted by PMA suppliers, hence usage levels are marginal
• Bureaucracy, negative perception of PMAs and prevalence of lessors main barriers
Europe
• Second most important market for suppliers, approximately 30% of PMA revenues
• Lufthansa and Iberia remain pioneers in their level of acceptance of PMA parts
• Expected bilateral between FAA-EASA and EASA’s proactive involvement will further boost growth in the region
Asia Pacific
• Third biggest market for PMAs, with JAL, Cathay Pacific, China Airlines, Asiana are amongst the first to sign contracts with PMA suppliers
• Interest from many carriers and MRO organizations, particularly from China
• Main barriers to entry remain bureaucracy and relatively young fleets
Latin America
• Low usage / acceptance of PMA parts, due to bureaucracy and relative small size of airline-customers
• Varig is the only carrier with established PMA programme
Middle East
• Region new to PMA parts, with sporadic purchases
• Saudi Arabian Airlines, Gulf Air, GAMCO, Jordan Airmotive have shown interest
• Young fleets of region’s largest carriers and prevalence of lessors barriers to greater use
Source: Frost & Sullivan
PMA – Regional acceptance levels
27www.frost.com
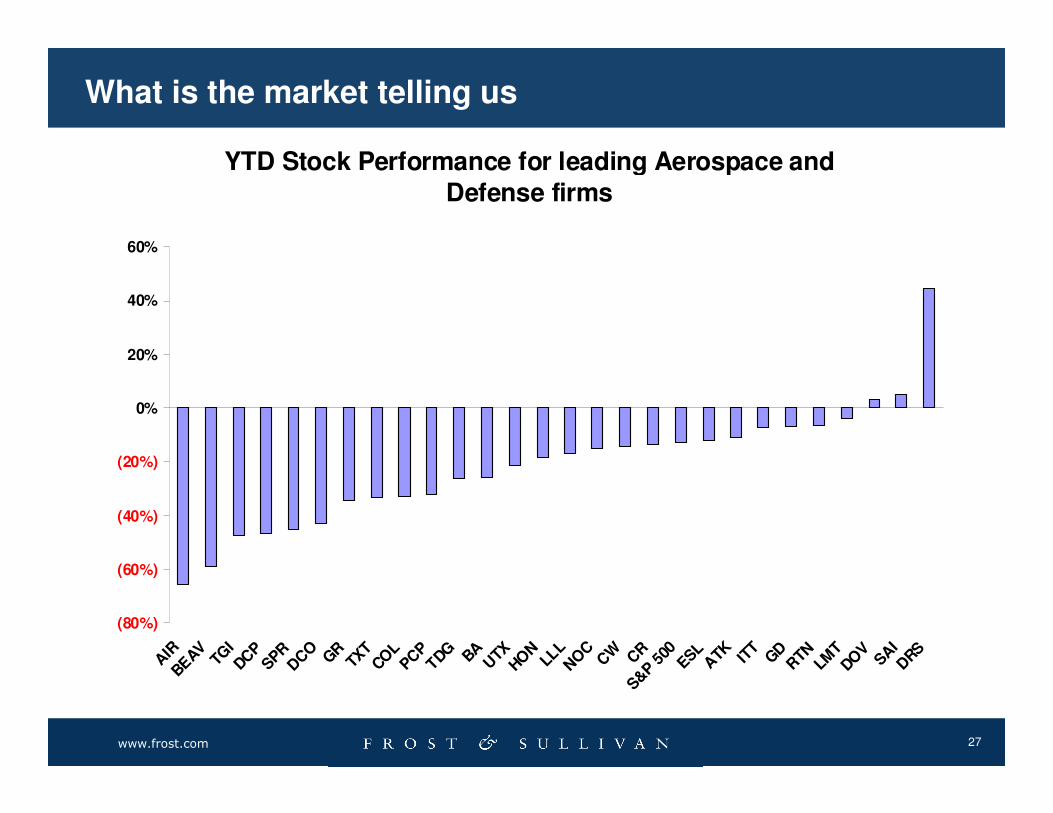
What is the market telling us
YTD Stock Performance for leading Aerospace and Defense firms
(80%)
(60%)
(40%)
(20%)
0%
20%
40%
60%
AIR
BEAVTG
IDC
PSPRD
CO
GR
TXT
COL
PCP
TDG BAU
TXHO
NLL
LN
OC
CW CR
S&P 5
00ESLA
TK ITT
GD
RTNLM
TDO
VSA
ID
RS

28www.frost.com
Your Feedback is Important to Us
Growth Forecasts?
Competitive Structure?
Emerging Trends?
Strategic Recommendations?
Other?Please inform us by taking our survey.
What would you like to see from Frost & Sullivan?
29www.frost.com
For Additional Information
For additional information or to receive the audio file that
accompanies this analyst briefing please contact:
Stephanie Ochoa
Corporate Communications
North American
Analyst Briefing Coordinator
(210) 247-2421