
2020 SALARY AND COMPENSATION SURVEY RESULTS
48
2020 SALARY AND COMPENSATION SURVEY RESULTS JULY 2020 ENGINEERS GEOSCIENTISTS MANITOBA
Transcript of 2020 SALARY AND COMPENSATION SURVEY RESULTS

2020 SALARY AND COMPENSATION SURVEY RESULTSJULY 2020
ENGINEERS GEOSCIENTISTS MANITOBA

TABLE OF CONTENTS
Key FindingsMethodology
37
Profile of Respondents 9Employee Overview 16Education Levels 21Current and Future Salary Ranges 24Employee Compensation and Benefits 28Current and Projected Employment Needs 36Use of Salary and Compensation Surveys 46

3
The following table summarizes salary and other information regarding the four levels of engineers /geoscientists employed in Manitoba as of 2020:
SUMMARY OF LEVELS OF ENGINEERS/GEOSCIENTISTS
Entry Junior Inter-mediate Senior
% employed in MB companies 78% 50% 67% 70%
EMPLOYMENT STATUS:Full-timePart-timeIndependent
89%6%5%
98%2%0%
96%4%0%
98%1%1%
EDUCATION LEVEL:BachelorMastersDoctorate
86%13%1%
81%14%5%
74%20%6%
84%10%6%
SALARY RANGE (2020):MinimumMaximum
$56,047$69,087
$70,205$88,627
$91,200$112,143
$118,677$148,831
VACATION:# of weeks (average) 3 3 4 4
OTHER COMPENSATION:OvertimeBonusesProfit SharingCommission
58%44%26%2%
66%59%31%0%
51%51%37%7%
31%51%40%4%
SHORTAGES:(# of engineers/geoscientists) -2 -1 -1 -1
INTENTIONS TO HIRE:(# of engineers/geoscientists +3 +2 +2 +3
KEY FINDINGS

3
Single Practitioners:
Nearly half of companies participating in this research are single practitioners.These engineers/geoscientists are mostly employed in the construction, manufacturing and consulting industries.
Nearly one-half have been operating for less than five years and almost all are employed on a full-time basis (35+ hours per week).
Virtually all single practitioners hold the P.Eng designation. Three-quarters have a Bachelor’s degree; 21% a Masters and 2% a doctorate.
Their average salary is $112,214 (up from a reported average of $92,823 in 2018).
This cohort is somewhat less likely to have extended health benefits, financial benefits (like a pension plan) or other work/life balance benefits, compared to those working in larger companies. However, they are much more likely to have a car allowance/mileage compared to others.
Two-thirds of single practitioners expect their business will increase in the coming years and, like larger companies, they expect they may have difficultyfilling positions due to the lack of applicants and specific skill requirements.
KEY FINDINGS(cont’d)

3
Highest Salary Paid:Companies report the highest compensation amount paid to an employee including salary and all benefits is $214,594 (average). Four-in-ten companies report this top salary is paid to an engineer or geoscientist employed in their company.
Potential Increases to Salaries:One-half of those speaking on behalf of larger companies intend to give asalary increase to their engineers/geoscientists, with an average of 7% increasein the next two years.
Other Benefits:Most employers include basic supplemental health benefits such as dental,drug, extended health and life insurance, with long term and short term disability benefits offered less often.
Just over one-half of companies participating in this survey provide their engineers/geoscientists a pension plan and RRSP matching, while fewer offer stock options.
Mobile phones and parking is covered by more than one-half of employers while travel allowances are offered less often.
Most work/Life balance offerings include flexible hours, bereavement leave, sick time to care for sick dependents and employee assistance plans. Less than half offer other work/life balance programs. Compared to 2018, fewer firms are now offering their employees a leave of absence, but more are allowing staff to work from home.
Professional Development:Most companies are continuing to pay for engineers/geoscientists professional dues and job specific training, but fewer are paying for continuing education or business association dues.
KEY FINDINGS(cont’d)

3
Future Employment Needs:
Four-in-ten companies intend to increase the number of engineers/geoscientists in the next five years while 48% intend to retain the same number they currently have.
Employers expect some difficulty in finding the specific skills required or indeed enough applicants to fill their demands.
There have been slight increases in the number of companies who areprioritizing hiring under-represented segments – most especially women (+6% as a priority from 2018) and visible minority job candidates (+5%).
Inputs Used to Determine Salaries:
One-quarter always consider additional degrees or qualifications to set salaries, while 45% report these may or may not factor into compensation deliberations
As was the case in 2018, nearly half of companies participating in this research use this data to guide compensation levels for the engineers/geoscientists working in their company.
Three-in-ten use data from other sources including other HR or companyinformation, APEGS, APEGA and PEO results.
KEY FINDINGS(cont’d)

METHODOLOGY
➢ Probe Research Inc. was retained by Engineers Geoscientists Manitoba to conduct an online survey among Manitoba companies that employ engineers and geoscientists.
➢ Specifically, the survey collected information regarding financial compensation for various levels of professional engineers and geoscientists in the province, as well as exploring retention and recruitment issues.
➢ Probe Research surveyed 120 employers using a 10-minute (average) online survey. The survey was open for completion between June 17 and July 17, 2020.
➢ The total sample of 850 companies with contact information was provided by Engineers Geoscientists Manitoba and included approximately 791 companies with email addresses and 59 with phone numbers only.
➢ Engineers Geoscientists Manitoba was responsible for sending a unique, secure survey link (provided by Probe Research) to those companies with email addresses.
➢ In an effort to encourage participation, a generic email reminder was sent by Engineers Geoscientists Manitoba part way through the data collection window, and Probe Research followed up with live operator telephone calls to companies who had not yet responded to the survey.
➢ A random and representative sample of 120 companies would have a margin of error of ± 8.30 percentage points, 19 times out of 20, finite population corrected.
7

Below are the definitions used to describe the four levels of engineers/geoscientists covered in this survey, which differs from the 2018 survey:
Entry level: These include engineering/geoscience interns (EIT/GIT) who have not yet received their professional designation and/or who have 1-4 years experience after graduation.
Junior level: These include engineers/geoscientists with a professional designation (P.Eng./P.Geo.) and who have 5-9 years of experience after graduation.
Intermediate level: These include engineers/geoscientists with a professional designation (P.Eng./P.Geo.) and with 10-19 years experience after graduation.
Senior level: These include engineers/geoscientists with a professional designation (P.Eng./P.Geo.) and 20+ years experience after graduation.
RESEARCH RESULTSNOTE
8

PROFILE OF RESPONDENTS
9

Bases
Total(n=120)
(%)
Single practitioners
(n=56)(%)
Companies employing more than 1
engineer/geoscientist(n=64)
(%)AREAS OF OPERATION*:
Winnipeg 74 75 73
Southern Manitoba 48 52 44
Western Manitoba 36 29 42
Northern Manitoba 23 21 25
HEAD OFFICE:
Winnipeg 65 66 64
Southern Manitoba 11 18 5
Western Manitoba 9 4 14
Elsewhere in Canada 9 7 11
Outside Canada 6 5 6
PRIMARY EMPLOYMENT SECTOR:
Private 85 88 83
Non Profit 5 5 5
Federal gov’t 2 2 2
Municipal gov’t 4 4 5
Provincial gov’t 2 - 5
Crown Corporation 1 - 2
Educational 1 2 -
PROFILE OF RESPONDENTS
10

MOST RESPONDENTS ARE OWNERS OR SENIOR MANAGERS WITHIN THEIR COMPANY
QS1. “Which one category best describes your current position in the company?”
Base: All respondents (N=120)
56%
13% 12%
6%3% 2% 2%
Owner/CEO/Sr. Manager
Director Manager/Supervisor
Engineer HRManager
Designer Other
11

MOST EMPLOYED IN PRIVATE SECTOR
QA3. “Which of the following categories best describes your primary employment sector?”
85%
5%
4%
2%
2%
1%
1%
Private enterprise
Non-profit
Municipal gov't
Provincial gov't
Federal gov't
Educational institution
Crown corp
12
Base: All respondents (N=120)
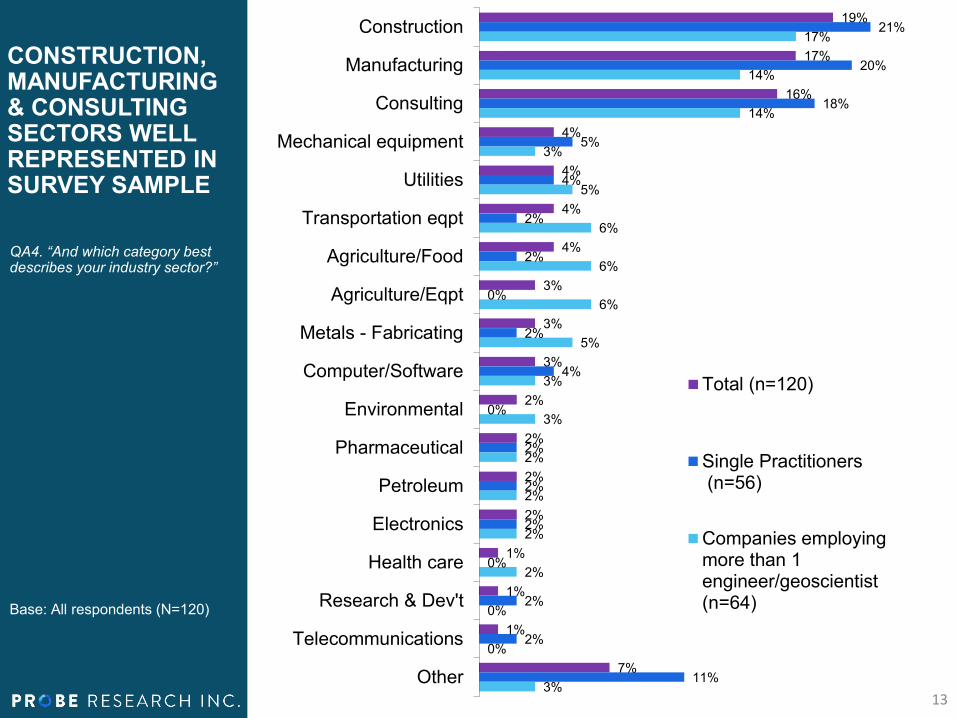
CONSTRUCTION, MANUFACTURING & CONSULTING SECTORS WELL REPRESENTED IN SURVEY SAMPLE
QA4. “And which category best describes your industry sector?”
19%
17%
16%
4%
4%
4%
4%
3%
3%
3%
2%
2%
2%
2%
1%
1%
1%
7%
21%
20%
18%
5%
4%
2%
2%
0%
2%
4%
0%
2%
2%
2%
0%
2%
2%
11%
17%
14%
14%
3%
5%
6%
6%
6%
5%
3%
3%
2%
2%
2%
2%
0%
0%
3%
Construction
Manufacturing
Consulting
Mechanical equipment
Utilities
Transportation eqpt
Agriculture/Food
Agriculture/Eqpt
Metals - Fabricating
Computer/Software
Environmental
Pharmaceutical
Petroleum
Electronics
Health care
Research & Dev't
Telecommunications
Other
Total (n=120)
Single Practitioners (n=56)
Companies employingmore than 1engineer/geoscientist(n=64)
13
Base: All respondents (N=120)

SINGLE PRACTITIONERS MAKE UP AROUND ONE-HALF OF MANITOBA COMPANIES EMPLOYING ENGINEERS/ GEOSCIENTISTS
QA5. “How many engineers and/or geoscientists does your company have working in Manitoba? This includes full and part-time?”
47%
15%
8%
19%
11%
One Two Three Four to Nine Ten or more
MEAN = 9 engineers/geoscientistsMEDIAN = 2 engineers/geoscientists
14
Base: All respondents (N=120)

NEARLY ONE-HALF OF SINGLE PRACTITIONERS HAVE BEEN OPERATING FOR LESS THAN 5YEARS
QF3. “How long have you been operating as a single practitioner?”
Base: All single practitioners
11%
32%
18%
12%
27%
11%
27%
16%
14%
32%
11%
42%
21%
11%
16%
One year orless
2-5 years
6-10 years
11-19 years
20+ years
Total (n=56)
Head office inWinnipeg (n=37)
Head office outsideof Winnipeg (n=19)
15

EMPLOYEEOVERVIEW
16

AVERAGE NUMBER OF TYPES OF ENGINEERS AND GEOSCIENTISTS EMPLOYED BY MANITOBA COMPANIES
QB1. “How many of the following types of employees does your company employ in Manitoba?”
9
8
4
1
3
22
1
3
1
2 2
Overall(120
companies )
P.Eng.(108
companies)
P.Geo.(4
companies)
P.Eng/P.Geo(1
company)
EITs(49
companies)
GITs(3
companies)
Mean Median
17
Base: All respondents (N=120)

VIRTUALLY ALLSINGLE PRACTITIONERS ARE P.ENGS
QF1. “Which of the following categories best describes your designation?”
Base: All single practitioners(n=56)
84%
2% 2%
11%
2%
P.Eng P.Geo P.Eng/P.Geo EIT Other
18

JUNIOR LEVEL ENGINEERS/ GEOSCIENTISTS LEAST LIKELY TO BE EMPLOYED BY MANITOBA COMPANIES
Q1. “Do you have any…employed by your company?”
Base: All companies employing more than one engineer/geoscientist (n=64)
78%
50%
67%
70%
Entry Level
Junior Level
Intermediate Level
Senior Level
19

89%98% 96% 98%
91%
6%
2% 4% 1%9%5%
1%
Entry(n=50)
Junior(n=32)
Intermediate(n=43)
Senior(n=45)
SinglePractitioners
(n=56)
IndependentContractor
Part-time (less than35 hours per week)
Full-time (35 hours ormore per week)
Base: All respondents
“Unsure” removed from calculations
VIRTUALLY ALL PROFESSIONALS ARE EMPLOYED ON A FULL-TIME BASIS
Q3. “How many of these ….level engineers / geoscientists are full-time, part-time or independent contractors?”
QF4. “Would you say you are employed on average..?”
ENTRY JUNIOR INTERMEDIATE SENIOR
Mean: 4 Mean: 8 Mean: 8 Mean: 5
Median: 2 Median: 2 Median: 1 Median:1
MEAN/MEDIAN NUMBER OF ENGINEERS/GEOSCIENTISTS EMPLOYED FULL-TIME
20

EDUCATIONLEVELS
21

MASTER’S AND DOCTORATE LEAST ATTAINED DEGREES AMONG ALL LEVELS
Base: All respondents
86%81%
74%
84%
75%
13% 14%20%
10%
21%
1%5% 6% 6%
2%
Entry(n=46)
Junior(n=31)
Intermediate(n=43)
Senior(n=44)
SinglePractitioners
(n=50)
Bachelor's Degree Master's Degree Doctorate
Q4. “Approximately how many of these … level engineers / geoscientists have…?”
QF2. “What is the highest level of education you have obtained?”
22

ADDITIONAL DEGREES SOMETIMES IMPACT SALARY COMPENSATION
QE1. “Does your organization recognize additional degrees or qualifications when setting salary levels for engineers/ geoscientists?”
Yes, 27%
No, 17%
Sometimes/Depends, 45%
Unsure, 11%
Base: All companies employing more than one engineer/geoscientist (n=64)
23

CURRENT AND FUTURE SALARY
RANGES
24

AVERAGE SALARY RANGES - 2020
Q4. “Although there are sometimes exceptions, what is the gross general salary range for this… level position in your organization?”
QF5. “Approximately what is your gross salary per year, on average?” (n=56)
Base: All companies employing more than one engineer/geoscientist (n=64)
$56,047
$69,087$70,205
$88,627$91,200
$112,143$118,677
$148,831
$40,000
$60,000
$80,000
$100,000
$120,000
$140,000
$160,000
Minimum Annual Gross Salary Maximum Annual Gross Salary
Entry (n=44) Junior (n=30) Intermediate (n=41) Senior (n=39)
Average Annual Gross Salary for Single Practitioners: $112,21425

HIGHEST COMPENSATION PAID TO A STAFF MEMBER NOT NECESSARILY AN ENGINEER OR GEOSCIENTIST
QH1. “Now thinking about the salary and compensation paid to all members of your staff, what was the highest gross annual income your company paid a staff member in 2019? “
H2. “And was this highest earning staff member a professional engineer or professional geoscientist?”
Base: All companies employing more than one engineer/geoscientist (n=64)
17%
23%
23%
36%
<$125,000
$125K-$199K
$200K+
Unsure
MEAN: $214,594
Yes, 42%
No, 48%
Unsure, 9%
Was it a professional engineer or geoscientist?
26

HALF OF COMPANIES INTEND TO INCREASE THESE PROFESSIONALS’ SALARIES BY AN AVERAGE OF 7% IN THE NEAR FUTURE
QE2. “Do you anticipate the salary and compensation levels for engineers and geoscientists employed in your firm will increase or stay the same in the next two years?”
QE2a) “Overall, what percentage increase do you anticipate engineers / geoscientists in your organization will receive in two years’ time?”
Base: All companies employing more than one engineer/geoscientist (n=64)
Intend to increase salaries by an average of 7% overall
• 6% among those with head offices in Winnipeg• 9% among those with head offices outside of Winnipeg
55%
37%
8%
50%
42%
8%
Increase Stay the same Unsure
2018 2020
27

EMPLOYEE COMPENSATION AND BENEFITS
28

AVERAGE NUMBER OF VACATION WEEKS PER YEAR
Q6. “How many weeks of vacation do these …. level engineers / geoscientists typically receive per year?”
Base: All companies employing more than one engineer/geoscientist
“Unsure” removed from calculations
3 3
4 4
3 3
4 4
Entry(n=46)
Junior(n=30)
Intermediate(n=40)
Senior(n=41)
Mean Median
29

OVERTIME AND BONUSES PAID OUT MOST FREQUENTLY
Q6. “Generally, do these… level engineers / geoscientists receive…?”
Base: All companies employing more than one engineer/geoscientist (n=64)
58%
44%
26%
2%
66%
59%
31%
0%
51%
51%
37%
7%
31%
51%
40%
4%
Overtime pay
Bonuses
Profit-Sharing
Commissions
Entry Level
Junior Level
Intermediate Level
Senior Level
30

MAIN HEALTH BENEFITS EXTEND TO A MAJORITY, ALTHOUGH SOMEWHAT LESS SO AMONG SINGLE PRACTITIONERS
QC1. “Which of the following benefits, if any, does your organization provide to the professional engineers / geoscientists employed by your company?”
QF6. “Which, if any of the following do you have through a business benefits plan?”
94%
89%
88%
84%
78%
73%
64%
57%
57%
61%
55%
41%
Dental plan
Drug plan
Extended health plan
Life insurance
Long-term disability
Short-term disability
Companies employingmore than 1engineer/geoscientist(n=64)
Single Practitioners(n=56)
Base: All respondents
All mentions accepted therefore total may exceed 100%
31

PENSION PLAN AND RRSPMATCHING MOST POPULAR FINANCIAL BENEFIT OFFERED
QC1. “Which of the following benefits, if any, does your organization provide to the professional engineers / geoscientists employed by your company?”
QF6. “Which, if any, of the following do you have through a business benefits plan?”
59%
52%
14%
25%
27%
2%
Pension plan
RRSP matching
Stock purchases
Companies employingmore than 1engineer/geoscientist(n=64)
Single Practitioners(n=56)
Base: All respondents
All mentions accepted therefore total may exceed 100%
32

PROVISION OF MOBILE PHONES AND PARKING EXTENDED TO MORE THAN ONE-HALF OF ENGINEERS/ GEOSCIENTISTS
QC1. “Which of the following benefits, if any, does your organization provide to the professional engineers / geoscientists employed by your company?”
QF6. “Which, if any, of the following do you have through a business benefits plan?”
64%
53%
38%
5%
66%
n/a
52%
n/a
Mobile phone
Parking
Car allowance/Gas mileage
Public transportation
Companies employingmore than 1engineer/geoscientist(n=64)Single Practitioners(n=56)
Base: All respondents
All mentions accepted therefore total may exceed 100%
33

DECLINE IN LEAVE OF ABSENCES ALLOWED WHILE ABILITY TO WORK FROM HOME HAS INCREASED IN THE PAST 2 YEARS
QC2. Some organizations offer different types of “work-life balance” programs to their employees. Which, if any, of the following does your organization offer in full or in part to your professional engineers/geoscientists?”
73%
70%
67%
53%
40%
38%
33%
30%
17%
17%
17%
15%
5%
3%
7%
2%
69%
69%
55%
53%
23%
38%
20%
48%
9%
17%
9%
9%
3%
5%
5%
6%
Flexible hours
Bereavement leave
Sick time to care for sickdependents
Employee Assistance Programs
Leave of absence/sabbatical
Health/fitness club memberships ordiscounts
Maternity/paternity/parental leavebeyond required
Work from home
Compressed work weeks
Time off for volunteer work
Parental leave salary top up
Compassionate care leave
Childcare benefits (subsidy, onsite,etc.)
Job sharing
Other
None of the above
2018
2020
Base: All companies employing more than one engineer/geoscientist (n=64)
All mentions accepted therefore total may exceed 100%
Mentioned by 4% of Single Practitioners in 2020*
*The only work/life balance benefit asked of Single Practitioners
34

FEWER FIRMS OFFERING TO PAY FOR CONTINUING EDUCATION
QC3. Which, if any, of the following types of professional development activities does your organization pay in full or in part for your professional engineers/geoscientists?”
83%
82%
72%
53%
7%
86%
83%
58%
45%
3%
Professional/Technical dues
Job-specific training
Continuing education
Business association dues
None of the above2018
2020
Base: All companies employing more than one engineer/geoscientist (n=64)
All mentions accepted therefore total may exceed 100%
35

CURRENT AND PROJECTED
EMPLOYMENT NEEDS
36

DEMAND FOR ENTRY LEVEL ENGINEERS/ GEOSCIENTISTS MOST PRONOUNCED
Base: All companies employing more than one engineer/geoscientist (n=64)
11%
6%
3%
3%
0%
2%
2%
2%
2%
0%
0%
0%
88%
92%
95%
95%
Entry Level(8 companies with openings)
Junior Level(5 companies with openings)
Intermediate Level(3 companies with openings)
Senior Level(3 companies with openings)
Oneemployee
Twoemployees
Three+employees
No add'lemployeesrequired
MEAN: 2 MEDIAN: 1
QD1. “Do you currently have any openings for the following engineers/geoscientists positions? If yes, please indicate the number of positions you require.”
MEAN: 1 MEDIAN: 1
MEAN: 1 MEDIAN: 1
MEAN: 1 MEDIAN: 1
37

MOST ANTICIPATE RETAINING A STABLE LEVEL OF ENGINEERS/ GEOSCIENTISTS IN THE FUTURE, BUTNEARLY AS MANY EXPECT TO INCREASE THEIR NUMBERS
47%50%
2% 2%
44%48%
3%5%
Increase Stay the same Decrease Unsure
2018 2020
QD2. “Overall, do you expect the number of professional engineers/geoscientists employed in your organization to increase, decrease or stay the same in the next five years?”
Base: All companies employing more than one engineer/geoscientist (n=64)
38

SINGLE PRACTITIONERS INTEND TO EXPAND IN THE FUTURE
66%
24%
4% 6%
64%
23%
5% 7%
Increase Stay the same Decrease Unsure
2018 2020
QF7. “Do you anticipate your business will increase, decrease or stay the same in the next five years?”
Base: Single practitioners (n=56)
39

EMPLOYERS CONTINUE TO EXPECT SOMEDIFFICULTY FILLING FUTURE POSITIONS
7%
39%
32%
18%
4%4%
39%
25%
21%
11%
Great deal Some A little No difficulty Unsure
2018 2020
QD3. “What degree of difficulty, if at all, do you anticipate you will have filling any of these positions in the next five years?"
Base: All companies employing more than 1 engineer/geoscientist expecting to increase these types of employees (n=28)
40

SINGLE PRACTITIONERS ALSO CHALLENGED TO FILL FUTURE POSITIONS
0%
36%
18%
36%
11%13%
42%
13%
26%
6%
Great deal Some A little No difficulty Unsure
2018 2020
QF9. “What degree of difficulty, if at all, do you anticipate you will have filling any of these positions in the next five years?"
Base: Single practitionersexpecting to increase these types of employees (n=31)
41

COMPANIES EXPECT DIFFICULTY FILLING FUTURE POSITIONS DUE TOLACK OF SKILLS/ EXPERIENCE AND APPLICANTS
QD3a. “Why do you think you may have some difficulty filling these engineering/ geoscientist positions?”
Base: All companies employing more than one expecting to experience difficulties hiring these types of employees (n=19)
45%
32%
23%
18%
53%
16%
21%
5%
Requires specificskills/experience
Not enough applicants
Workplacelocation/environment/pay
Need specific type
2018
2020
42

SINGLE PRACTITIONERS EXPECT FUTURE APPLICANTS WILL NOT HAVE THE SKILLS OR EXPERIENCE REQUIRED, AND FEEL THERE WILL BE A SHORTAGE OF APPLICANTS
QF9a. “Why do you think you may have some difficulty filling these engineering/ geoscientist positions?”
Base: Single practitionersexpecting to experience difficulties hiring these types of employees (n=20)
53%
13%
13%
20%
29%
29%
24%
19%
Requires specificskills/experience
Not enough applicants
Workplacelocation/environment/pay
Other
2018
2020
43

ENTRY AND SENIOR POSITIONS MOST ANTICIPATED LEVEL NEEDED IN THE FUTURE
QD4. “How many positions, if any, in each of these categories do you anticipate you will need to fill in the next five years?”
Base: All companies employing more than one engineer/ geoscientist who say they anticipate an increase in these positions (n=64)
3
2 2
3
1 1 1 1
Entry Level(17 companiesanticipating an
increase)
Junior Level(18 companiesanticipating an
increase)
Intermediate Level(15 companiesanticipating an
increase)
Senior Level(6 companiesanticipating an
increase)
Mean Median
44

ALL COMPANIES SHOW AN INCREASE IN PRIORITIZING HIRING UNDER-REPRESENTED SEGMENTS OVER THE LAST 2 YEARS
QE3. “Please indicate how much of a priority, if any, your company gives to ensuring the engineers and geoscientists you hire are…”
Base: All companies employing more than one engineer/geoscientist (n=64)
INDIGENOUS PEOPLES
(+4%)
VISIBLE MINORITIES
(+5%)
WOMEN (+6%)
PERSONS WITH
DISABILITIES (+2%)
5%
11%
7%
12%
7%
11%
10%
12%
42%
34%
42%
39%
43%
38%
40%
41%
53%
55%
52%
48%
50%
52%
50%
47%
2018
2020
2018
2020
2018
2020
2018
2020
Priority (6,7) Neutral (3-5) Not a priority (1,2)
45

USE OF SALARY AND COMPENSATION
SURVEYS
46

COMPANIES CONTINUE TO USETHE ENGINEERS/ GEOSCIENTISTS MANITOBA SALARY AND COMPENSATION SURVEY DATA
QE4. “Does your organization use the results of this Engineers Geoscientists Manitoba salary survey when setting compensation levels for your engineers/ geoscientists?”
Base: All companies employing more than one engineer/geoscientist (n=64)
47% 47%
53% 53%
2018 2020
No
Yes
47

THREE-IN-TEN COMPANIES USE OTHER SALARY SURVEYS TO SET COMPENSATION LEVELS
QE5. “Do you use the results of any other salary survey for your engineers/geoscientists when setting compensation?
QE5a) Which others?”
Yes, 30%
No, 70%
Base: All companies employing more than one engineer/geoscientist (n=64)
10%
10%
10%
10%
10%
5%
20%
10%
0%
5%
11%
11%
11%
11%
16%
16%
26%
26%
Ranstad
Internal
Mercer
Other industry
Other provincial
PEO
APEGA
APEGS
Other HR/company info
2020 (n=19)2018 (n=20)
48


