20190212 CTRB RHIP 6.30.2018 Funding and Plan Accounting … · The information contained in this...
45
CONNECTICUT STATE TEACHERS’ RETIREMENT SYSTEM RETIREE HEALTH INSURANCE PLAN FUNDING AND PLAN ACCOUNTING REPORT PREPARED AS OF JUNE 30, 2018
Transcript of 20190212 CTRB RHIP 6.30.2018 Funding and Plan Accounting … · The information contained in this...

CONNECTICUT STATE TEACHERS’ RETIREMENT SYSTEM
RETIREE HEALTH INSURANCE PLAN
FUNDING AND PLAN ACCOUNTING REPORT
PREPARED AS OF JUNE 30, 2018

Off
Cavanaugh Macdonald CC OO NN SS UU LL TT II NN GG,, LL LL CC
The experience and dedication you deserve
3550 Busbee Pkwy, Suite 250, Kennesaw, GA 30144 Phone (678) 388-1700 • Fax (678) 388-1730
www.CavMacConsulting.com Offices in Kennesaw, GA • Bellevue, NE
February 12, 2019 Board of Directors Connecticut State Teachers’ Retirement System 765 Asylum Avenue Hartford, CT 06105 Re: June 30, 2018 Funding and Plan Accounting Report for the
Retiree Health Insurance Plan of the Connecticut State Teachers’ Retirement System Members of the Board: This report presents the results of the actuarial valuation of the Retiree Health Insurance Plan (the Plan) of the Connecticut State Teachers’ Retirement System (the System). This report has been prepared by the System’s actuary, Cavanaugh Macdonald Consulting (CMC) as of June 30, 2018 (Valuation Date or Measurement Date). The primary purpose of the valuation report is to provide the State’s actuarially determined contribution (ADC) rate for the System for the fiscal years ending on June 30, 2019 and June 30, 2020, to describe the current financial condition of the Plan, to analyze changes in such condition, and to summarize the census data, financial information, assumptions, methods, and plan provisions used to prepare these results. In addition, the report contains information that will be used by the System in its Comprehensive Annual Financial Report (CAFR), and provides the actuarial information for the Plan required under Governmental Accounting Standards Board (GASB) Statement No. 74 (GASB 74) for the fiscal year ending on June 30, 2018 based on a valuation date of June 30, 2018. Additional Information and Disclosures The information contained in this report is intended to be used by the System for Plan funding purposes for the fiscal years ending on June 30, 2019 and June 30, 2020, and for Plan accounting purposes for the fiscal year ending on June 30, 2018, and its use for other purposes may not be appropriate. Calculations for purposes other than funding the System benefits described in this report, or reporting the Plan accounting information required under GASB 74, may produce significantly different results. The results contained in this report were prepared by qualified actuaries according to generally accepted actuarial principles and practices, and in compliance with Actuarial Standards of Practice issued by the Actuarial Standards Board. Our understanding is that the System has made no changes to the Plan’s funding policy since the prior valuation. Thus, ADC rates as of the valuation date were developed based on the contribution allocation procedure described in GASB Statement Nos. 43 and 45, as approved by the System during prior periods. The Plan accounting information provided in this report reflects our current understanding of GASB 74, including any applicable guidance provided by the System, or its audit partners as of the date of this report.

Board of Directors February 12, 2019 Page 2
These results supersede all June 30, 2018 actuarial valuation results for the System, including draft versions of this document, issued prior to the date of this report. The System should rely only on the June 30, 2018 actuarial valuation results and actuarially determined State contribution rates for the fiscal years ending on June 30, 2019 and June 30, 2020 provided herein. The census data for active and retired members as of the Valuation Date, changes in plan provisions since the prior Valuation Date, the net benefits and administrative expenses paid during the fiscal year beginning on July 1, 2017 and ending on June 30, 2018, and pertinent financial information was provided by the System for actuarial valuation and Plan accounting purposes. We did not audit the supplied information, but it was reviewed for reasonableness and consistency. In certain situations, the supplied information was adjusted to account for normal differences in collection dates and/or methods. As a result, we have no reason to doubt the substantial accuracy or completeness of the information and believe that it is reliable for the purposes stated herein. The results and conclusions contained in this report depend on the integrity of this information, and if any of the supplied information or analyses change, our results and conclusions may be different and this report may need to be revised. Likewise, this information may need to be revised to reflect any significant event that affects the Plan subsequent to the Valuation Date. Valuation results as of June 30, 2018 are based on the assumptions and methods adopted by the System and prescribed for use in the Plan’s June 30, 2018 biennial actuarial valuation, which are summarized in various sections of this report. All GASB 74 assumptions—including, but not limited to, discount rates, expected rates of return on assets, long-term health care cost trend rates, and expected active employee health care coverage election assumptions—have been selected by the System for the measurement of the Plan’s benefit obligations as of June 30, 2018 based on the June 30, 2018 valuation date, and should reflect best estimates of anticipated Plan experience. Other than the discount rate required under GASB 74, we believe that those assumptions selected by the System for Plan funding and financial accounting purposes as of June 30, 2018 are reasonable for the purposes of preparing the measurements described above. The actuarial cost method and the asset valuation method used for funding purposes were selected by the System during prior periods and prescribed for use in the Plan’s June 30, 2018 biennial actuarial valuation. We believe that these methods are appropriate for funding purposes. Additionally, the actuarial cost method, the asset valuation method, and the amortization methods are prescribed under GASB rules for financial accounting purposes as of the June 30, 2018 measurement date. Actuarial methods such as the actuarial cost methods, asset valuation methods, and amortization methods used in the contribution allocation procedure (for funding purposes) and cost allocation procedure (for financial accounting purposes) are designed to recognize changes in an orderly fashion over a period of years. In certain situations, the actuarial methods used in an allocation procedure may have the effect of deferring changes in contributions or costs into later years. Likewise, the use of these methods could produce deferred gains or losses if any material underlying assumption is not met over a long period of time. Future actuarial measurements may differ significantly from the current measurements presented in this report due to such factors as the following: retiree group benefits program experience differing from that anticipated by the assumptions; changes in assumptions; increases or decreases expected as part of the natural operation of the methodology used for these measurements (such as the end of an amortization period or additional cost or contribution requirements based on the plan’s funded status); and changes in retiree group benefits program provisions or applicable law. Retiree group benefits models necessarily rely on the use of approximations and estimates, and are sensitive to changes in these approximations and estimates. Small variations in these approximations and estimates may lead to significant changes in actuarial measurements. Since the potential impact of such factors is outside the scope of a normal annual actuarial valuation, we have not performed an analysis of the potential range of such future differences

Board of Directors February 12, 2019 Page 3
other than the sensitivity to changes in the discount rate and healthcare cost trend rates required by GASB 74. This report does not consider all possible scenarios. The funded status measurements included in this report are based on the assumptions and methods used to determine the Plan’s obligations and asset values as of the valuation and/or measurement date. Funded status measurements for financial accounting purposes may not appropriate for assessing the sufficiency of Plan assets to cover the estimated cost of settling the Plan’s benefit obligations. Likewise, funded status measurements for financial accounting purposes may not be appropriate for assessing the need for or the amount of future actuarially determined contributions. CMC does not provide legal, investment, or accounting advice. Thus, the information in this report is not intended to supersede or supplant the advice and interpretations of the System or its affiliated legal, investing, or accounting partners. The undersigned are familiar with the near-term and/or long-term aspects of other postemployment benefit plan valuations and collectively meet the Qualification Standards of the American Academy of Actuaries necessary to render the actuarial opinions contained in this report. All sections of this report, including any appendices and attachments, are considered an integral part of the actuarial opinions. To the best of our knowledge, no executive or employee of CMC providing services to the System has any direct financial interest or indirect material interest in the System. As a result, we believe that there is no relationship existing that might affect our capacity to prepare and certify these results for the System’s Plan as of June 30, 2018. Please call us at 678-388-1700 if you have any questions. Respectfully submitted,
Jeffrey Gann, FSA, MAAA, FCA, EA Alisa Bennett, FSA, EA, FCA, MAAA Senior Actuary Principal and Consulting Actuary JG/AB:nh

Connecticut State Teachers’ Retirement System
Cavanaugh Macdonald Consulting, LLC
Table of Contents
Section I — Board Summary......................................................................................................................... 1
Section II — Plan Membership Data ............................................................................................................. 4
Section III — Actuarial Value of Assets ........................................................................................................ 5
Section IV — Plan Funding Liabilities ........................................................................................................... 6
Section V — Actuarially Determined State Contribution Rate ...................................................................... 8
Section VI — Plan Accounting Information Under GASB 74 ...................................................................... 10
Section VII — Plan Financial Statement Note Disclosures ......................................................................... 12
Schedule A — Details Concerning Membership Census Data ................................................................... 20
Schedule B — Summary of Actuarial Assumptions and Methods for Funding Purposes .......................... 22
Schedule C — Summary of Actuarial Assumptions and Methods for Plan Accounting Purposes ............. 33
Schedule D — Summary of Actuarial Cost and Amortization Methods ...................................................... 36
Schedule E — Summary of Main Plan Provisions for Valuation Purposes ................................................ 38

Connecticut State Teachers’ Retirement System
Cavanaugh Macdonald Consulting, LLC Page 1
Section I — Board Summary
FUNDING CONTRIBUTION RATES FOR THE SYSTEM’S RETIREE HEALTH INSURANCE PLAN Table I‒1: Comparative Summary of Principal Funding Results ($ in Thousands)
Funding Valuation Results as of June 30, 2018 June 30, 2016 Membership
Active Members 50,594 50,877 Annual Payroll $4,075,939 $3,949,926
Retirees and Beneficiaries 49,123 40,160 —Number of Enrolled Retirees, Disableds, and Survivors 28,530 27,557 —Number of Enrolled Spouses and Other Dependents1 12,103 12,603 —Number of Nonparticipating Retirees 8,490 N/A
Inactive Members 2,194 2,085
Assets and Actuarial Liabilities
Discount Rate 3.00% 4.25% Actuarial Accrued Liability (AAL) $3,093,846 $2,997,535 Actuarial Value of Assets (AVA) $39,736 $0 Unfunded Actuarial Accrued Liability (UAAL = AAL ‒ AVA) $3,054,110 $2,997,535 Funded Ratio 1.28% 0.00% Amortization Period 30 years 30 years
Actuarially Determined Contribution (ADC) Rates Normal Cost Rate 2.948% 2.40% Unfunded Actuarial Accrued Liability Rate 2.488% 2.93% Total ADC Rate 5.436% 5.33%
Member2 1.249% 1.24% State 4.187% 4.09%
State Contribution Amount for Fiscal Year Ending
June 30, 2017 $166,802 June 30, 2018 $172,223 June 30, 2019 $167,819 June 30, 2020 $173,273
1 As of June 30, 2018, this number includes 30 active employees, and 6 inactive members, who are also currently enrolled as
covered dependents of participating retirees. These participants are also included in the counts of active and inactive members, respectively.
2 Effective July 1, 2004, the Plan receives member contributions equal to 1.25% of annual salaries in excess of $500,000. The member contribution rate shown above has been adjusted to reflect the $500,000 health benefit plan contribution offset.
Connecticut State Teachers’ Retirement System
Cavanaugh Macdonald Consulting, LLC Page 2
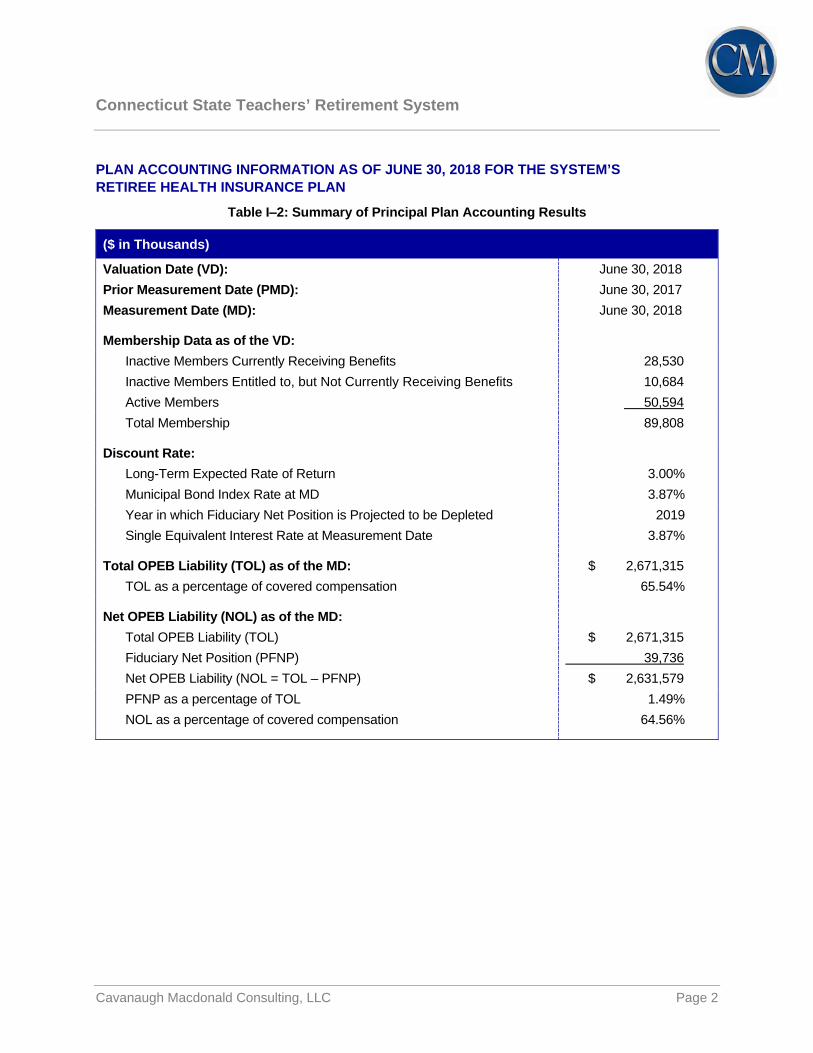
PLAN ACCOUNTING INFORMATION AS OF JUNE 30, 2018 FOR THE SYSTEM’S RETIREE HEALTH INSURANCE PLAN
Table I‒2: Summary of Principal Plan Accounting Results
($ in Thousands)
Valuation Date (VD): June 30, 2018 Prior Measurement Date (PMD): June 30, 2017 Measurement Date (MD): June 30, 2018
Membership Data as of the VD: Inactive Members Currently Receiving Benefits 28,530 Inactive Members Entitled to, but Not Currently Receiving Benefits 10,684 Active Members 50,594 Total Membership 89,808
Discount Rate: Long-Term Expected Rate of Return 3.00% Municipal Bond Index Rate at MD 3.87% Year in which Fiduciary Net Position is Projected to be Depleted 2019 Single Equivalent Interest Rate at Measurement Date 3.87%
Total OPEB Liability (TOL) as of the MD: $ 2,671,315 TOL as a percentage of covered compensation 65.54%
Net OPEB Liability (NOL) as of the MD: Total OPEB Liability (TOL) $ 2,671,315 Fiduciary Net Position (PFNP) 39,736 Net OPEB Liability (NOL = TOL – PFNP) $ 2,631,579 PFNP as a percentage of TOL 1.49% NOL as a percentage of covered compensation 64.56%

Connecticut State Teachers’ Retirement System
Cavanaugh Macdonald Consulting, LLC Page 3
SUMMARY OF KEY FINDINGS This report presents the results of the actuarial valuation of the Retiree Health Insurance ( the Plan) sponsored by the Connecticut State Teachers’ Retirement System (the System), prepared as of June 30, 2018. The purpose of the valuation is to measure the Plan’s obligations as of June 30, 2018, to determine the actuarially determined State contribution (ADC) rate for the fiscal years ending in 2019 and 2020 based on the System’s funding policy, which is centered on the guidance provided in GASB Statements No. 43 and 45, and to provide the Plan accounting information required under GASB Statement No. 74 (GASB 74) for other postemployment benefit plans. The unfunded actuarial accrued liability (UAAL) increased from $2.998 billion as of June 30, 2016 to $3.054 billion as of June 30, 2018; whereas, the Total OPEB Liability (TOL) under GASB 74 decreased from $3.539 billion to $2,671 billion during the fiscal year ending on the valuation date. The actuarially determined State normal cost contribution rate increased from 1.160% to 1.699% over the two-year period. The unfunded actuarial accrued liability rate decreased from 2.930% to 2.488% during the same period. We note the following key findings: The number of retired members, spouses of retired members, and surviving spouses of retired
members who are currently covered under a System-sponsored Health Care Plan has increased by 12% since the prior valuation.
The Plan was amended by the Board, effective July 1, 2018, to add the Anthem Medicare Advantage
Plan to the available options under the Plan, and change the “base plan” to the Medicare Advantage Plan for the purposes of determining retiree health care plan subsidies and/or cost sharing amount(s).
Before the July 1, 2018 plan change, the assumed annual per capita cost of basic benefits under the
System-sponsored Medicare Supplement Plan increased approximately 1.50% since the prior valuation. However, the assumed cost after reflecting the plan change is nearly 23% higher than the pre-plan change expectation. The assumed per-capita cost of basic benefits under the Medicare Advantage Plan that was added on July 1, 2018 is about 30% lower than the expected Medicare Supplement Plan claim cost before the plan change.
Based on an updated analysis of the Plan’s financial assets, the expected long-term rate of return on
plan assets and the discount rate for funding purposes have been changed from 4.25% to 3.00%. Likewise, the discount rate for Plan accounting purposes has been changed from 3.56% as of June 30, 2017 to 3.87% as of June 30, 2018.
Assumed participation rates have been updated to include expected enrollments in the Medicare
Supplement and Medicare Advantage Plans to reflect the plan change that became effective on July 1, 2018. Additionally, participation rates have been updated for those retirees who are receiving pension benefits but not currently receiving benefits under the Plan.
Additional information and details can be found in the Sections and Schedules that follow the Board Summary. Section II of the report provides a high-level summary of the membership data used in the valuation. Section III and Section IV review and reconcile the Plan’s actuarial value of assets and the Plan’s liabilities, respectively. The actuarially determined State contribution rate is developed in Section V. Sections VI and VII provide the actuarial information that may be needed for Plan accounting purposes under GASB 74. The appendices (Schedules) contain additional details and in-depth information. As a final reminder, please keep in mind that any information that may be included in this report for periods prior to June 30, 2010 was produced by the prior actuarial consulting firm.

Connecticut State Teachers’ Retirement System
Cavanaugh Macdonald Consulting, LLC Page 4
Section II — Plan Membership Data Data regarding the membership of the Plan for use in the valuation were furnished by the System. The following table summarizes the membership data as of June 30, 2018 and is compared with that reported for the prior valuation.
Table II‒1: Comparative Summary of Plan Membership Data ($ in Thousands)
Membership Data as of June 30, 2018 June 30, 2016 Active Members
Total Number of Active Members 50,594 50,877 Total Annual Compensation $4,075,939 $3,949,926
Retirees and Beneficiaries Number of Retirees Receiving Health Insurance Benefits 28,530 27,557 Number of Spouses Receiving Health Insurance Benefits1 12,103 12,603 Number of Nonparticipating Retirees 8,490 N/A Total Retirees and Beneficiaries 49,123 40,160
Inactive Members
Number of Eligible Vested Members 2,194 2,085
1 As of June 30, 2018, this number includes 30 active employees, and 6 inactive members, who are also currently enrolled as
covered dependents of participating retirees. These participants are also included in the counts of active and inactive members, respectively.

Connecticut State Teachers’ Retirement System
Cavanaugh Macdonald Consulting, LLC Page 5
Section III — Actuarial Value of Assets Information about the Plan’s assets was provided by the System for valuation purposes. The market value of assets held in trust solely to provide benefits to retirees and their beneficiaries in accordance with the terms of the Plan is $39,736,000 as of June 30, 2018. The Actuarial Value of Assets for the Plan is equal to $39,736,000 as of the valuation date based on the “market value” asset valuation method selected by the System. A detailed reconciliation of the Plan’s Actuarial Value of Assets from June 30, 2017 to June 30, 2018 is provided in Table III below.
Table III: Reconciliation of the Actuarial Value of Plan Assets
($ in Thousands) Actuarial Value of Assets as of June 30, 2017 $ 63,428 Additions
Active Member Contributions $ 51,484
Retired Member Contributions 42,623
State Contributions 19,199
Receivable—State Senate Bill 543, Section 22 16,100
Net Investment Income 669
Total Additions $ 130,075 Deductions
Administrative Expense $ 7,654
Benefit Payments and Refunds 146,061
Other 52
Total Deductions $ 153,767 Net Change $ (23,692) Actuarial Value of Assets as of June 30, 2018 $ 39,736

Connecticut State Teachers’ Retirement System
Cavanaugh Macdonald Consulting, LLC Page 6
Section IV — Plan Funding Liabilities The present value of benefits (PVB) is the value, as of the valuation date, of all future benefits expected to be paid to current members of the Plan. An actuarial cost method allocates each individual’s present value of benefits to past and future years of service. The actuarial accrued liability includes the portion of the active member present value of benefits allocated to past service as well as the entire present value of benefits for retirees, beneficiaries and inactive members. The unfunded actuarial accrued liability (UAAL) is the difference between the actuarial accrued liability and the actuarial value of assets. Table IV-1 shows the components of the present value of future benefits by decrement for future normal cost contributions and actuarial accrued liabilities and the determination of the UAAL as of the valuation date.
Table IV‒1: Summary and Allocation of the Present Value of Future Plan Benefits Based on a 3.00% Discount Rate as of June 30, 2018
($ in Thousands)
Entry Age Normal (Level Percentage of Pay) Actuarial Cost Method
(1)
Present Value of
Future Benefits
(2) Portion
Covered By Future Normal
Cost Contributions
(3) Actuarial Accrued
Liabilities [(1) ‒ (2)]
Active Members
Service Retirement $ 2,809,506 $ 1,392,188 $ 1,417,318 Disability Retirement 37,843 34,317 3,526 Survivors' Benefits 28,978 20,520 8,458 Termination Benefits 371,161 340,098 31,063 Total for Active Members $ 3,247,488 $ 1,787,123 $ 1,460,365
Inactive Members $ 116,157 N/A $ 116,157 Retirees and Beneficiaries $ 1,517,324 N/A $ 1,517,324 Total $ 4,880,969 $ 1,787,123 $ 3,093,846 Actuarial Value of Assets $ 39,736 Unfunded Actuarial Accrued Liability (UAAL) $ 3,054,110 Funded Ratio 1.28%
The valuation shows the Plan has an actuarial accrued liability of $1,460,365,000 for benefits expected to be paid on account of the present active membership, based on service to the valuation date. The liability for retiree health insurance benefits payable to inactive members with vested pension benefits is $116,157,000. The liability on account of benefits payable to retirees amounts to $1,517,324,000. The total actuarial accrued liability of the Plan amounts to $3,093,846,000. Against these liabilities, the Plan has present assets for valuation purposes of $39,736,000. Therefore, the UAAL is equal to $3,054,110,000.

Connecticut State Teachers’ Retirement System
Cavanaugh Macdonald Consulting, LLC Page 7
The determination of the Plan’s actuarial liabilities require the use of assumptions concerning the future experience of the System and its members. In each valuation, the most recent year of actual experience is compared to the expectations produced by the prior valuation. The differences are actuarial (gains) or losses which (decrease) or increase the AAL / UAAL. Table IV provides for the reconciliation of the UAAL and shows the primary sources of this year’s gains and losses due to actuarial experience.
Table IV‒2: Reconciliation of the AAL / UAAL from June 30, 2016 to June 30, 2018
($ in Thousands) 1. AAL as of June 30, 2016 $ 2,977,535 2. Normal Cost 94,903 3. Expected Benefit Payments (76,146) 4. Expected Interest at 4.25% 129,827 5. Expected AAL as of June 30, 2017 [1 + 2 + 3 + 4] $ 3,146,119 6. Actuarial Experience (Gain) / Loss a. Benefit Payments (Higher) / Lower Than Expected1 (8,092) b. Aging of the Population 10,636 c. Assumption Changes 115,011 d. Total Actuarial (Gain) / Loss $ 117,555 7. Projected AAL as of June 30, 2017 [5 + 6d] $ 3,263,674 8. Plan Assets as of June 30, 2017 63,428 9. Projected UAAL as of June 30, 2017 [7 ‒ 8] $ 3,200,246 10. Normal Cost 105,186 11. Expected State Contributions (172,223) 12. Expected Member Contributions (51,484) 13. Expected Interest at 4.25% 135,776 14. Expected UAAL as of June 30, 2018 [9 + 10 + 11 + 12 + 13] $ 3,217,501 15. Actuarial Experience (Gain) / Loss a. Contributions (Higher) / Lower Than Expected1 140,142 b. Administrative Expenses Higher / (Lower) Than Expected1 269 c. Asset Return (Higher) / Lower Than Expected 1,440 d. Aging of the Population 45,175 e. Demographic Experience 145,342 f. Assumption Changes 735,239 g. Plan Change Effective July 1, 2018 (1,230,998) h. Total Actuarial (Gain) / Loss $ (163,391) 16. UAAL as of June 30, 2018 [14 + 15h] $ 3,054,110
Please keep in mind that the estimates provided in the table above were prepared using streamlined calculation techniques, and they are intended to provide an “order of magnitude” indication of the actuarial experience associated with each event. Experience allocations based on more refined calculations may yield findings and conclusions different than those suggested using this streamlined methodology.
1 Includes an adjustment for the expected investment return from the assumed payment date(s) to the end of the year.

Connecticut State Teachers’ Retirement System
Cavanaugh Macdonald Consulting, LLC Page 8
Section V — Actuarially Determined State Contribution Rate The Plan’s actuarially determined contribution (ADC) is equal to the sum of the normal cost—or, the portion of the Plan’s total present value of benefits (PVB) that will accrue as a result of service earned during the year—including expected administrative expenses and the supplemental cost for the year. The supplemental cost is equal to the amount that will amortize the UAAL based on the amortization method and period selected for Plan funding purposes as of the valuation date. The determination of the ADC for the fiscal year ending on June 30, 2019 is shown in Table V. Table V also develops the actuarially determined State contribution amount and rate for the same period.
Table V: Development of the State’s Actuarially Determined Contribution (ADC) Rate for the Fiscal Year Ending on June 30, 2019
($ in Thousands) Fiscal Year Ending June 30, 2019
(a)
ADC Amount
(b) ADC Rate as a Percentage of
Covered Payroll [(a) ÷ (1)(a)]
1. Adjusted Covered Payroll to Mid-Year $ 4,008,122
2. Discount Rate 3.00% 3. Long-term Payroll Growth Rate 3.25% 4. Amortization Period—All Sources Open 30 years 5.
Amortization Factor—Level Percentage of Pay [Based on (2), adjusted for (3), over periods in (4)]
31.0801
6. Unfunded Actuarial Accrued Liability (UAAL) $ 3,054,110 7. Normal Cost
i. Service Retirement $ 91,111 2.273% ii. Disability Retirement 2,622 0.065% iii. Survivors' Benefits 1,436 0.036% iv. Termination Benefits 21,018 0.524% v. Expected Administrative Expenses 264 0.007% vi. Interest to Mid-Year 1,734 0.043% vii. Total [(7i) + (7ii) + (7iii) + (7iv) + (7v) + (7vi)] $ 118,185 2.948%
8. Supplemental Cost i. Amortization of the UAAL [(6) ÷ (5)] $ 98,266 2.452% ii. Interest to Mid-Year 1,463 0.036% iii. Total [(8i) + (8ii)] $ 99,729 2.488%
9.
Actuarially Determined Contribution (ADC) [(7vii) + (8iii)] $ 217,914 5.436%
10.
Expected Member Contributions at Mid-Year [1.25% × {(1)(a) ‒ $500}]]
$ 50,095
1.249%
11. State Normal Cost [(7vii) ‒ (10), not less than 0] $ 68,090 1.699% 12. State Supplemental Cost [(8iii) ‒ {(10) ‒ (7vii), not < 0}] 99,729 2.488% 13. Actuarially Determined State Contribution [(11) + (12)] $ 167,819 4.187%
Please note that, in certain cases, the ADC rates in Table V (b) have been adjusted for calculation and/or presentation purposes.
Connecticut State Teachers’ Retirement System
Cavanaugh Macdonald Consulting, LLC Page 9
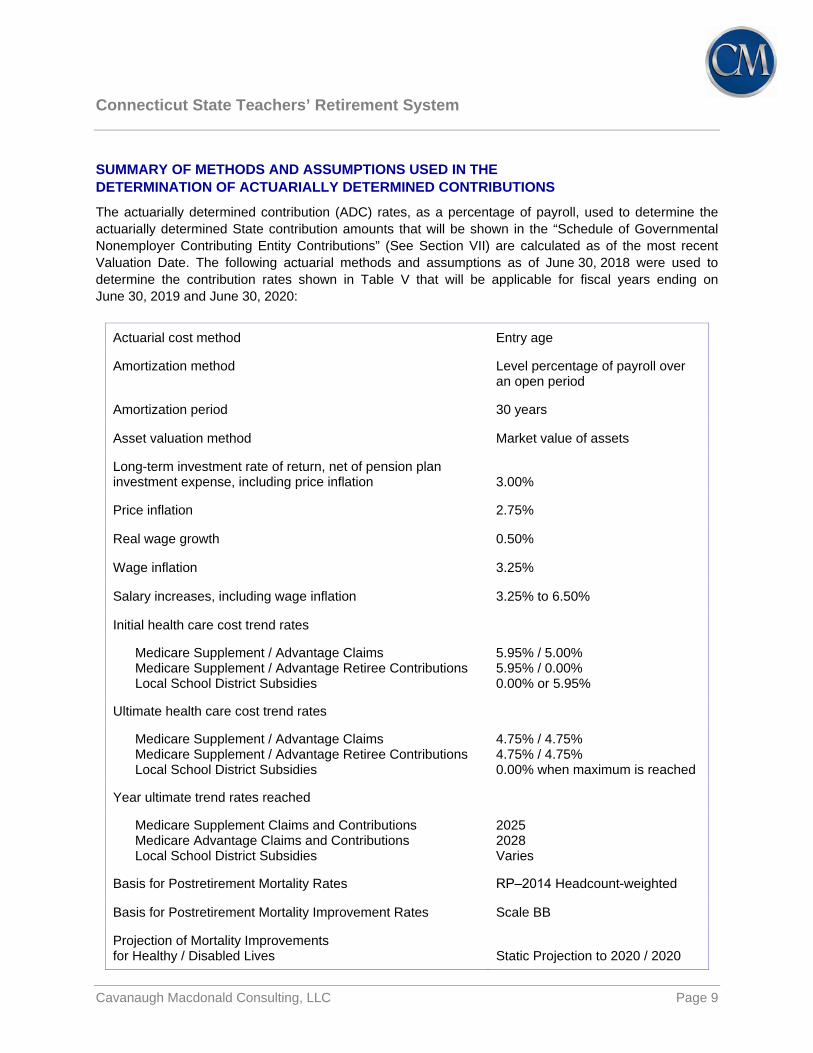
SUMMARY OF METHODS AND ASSUMPTIONS USED IN THE DETERMINATION OF ACTUARIALLY DETERMINED CONTRIBUTIONS The actuarially determined contribution (ADC) rates, as a percentage of payroll, used to determine the actuarially determined State contribution amounts that will be shown in the “Schedule of Governmental Nonemployer Contributing Entity Contributions” (See Section VII) are calculated as of the most recent Valuation Date. The following actuarial methods and assumptions as of June 30, 2018 were used to determine the contribution rates shown in Table V that will be applicable for fiscal years ending on June 30, 2019 and June 30, 2020:
Actuarial cost method Entry age
Amortization method
Level percentage of payroll over an open period
Amortization period 30 years
Asset valuation method Market value of assets
Long-term investment rate of return, net of pension plan investment expense, including price inflation
3.00%
Price inflation 2.75%
Real wage growth 0.50%
Wage inflation 3.25%
Salary increases, including wage inflation 3.25% to 6.50%
Initial health care cost trend rates
Medicare Supplement / Advantage Claims Medicare Supplement / Advantage Retiree Contributions Local School District Subsidies
5.95% / 5.00% 5.95% / 0.00% 0.00% or 5.95%
Ultimate health care cost trend rates
Medicare Supplement / Advantage Claims Medicare Supplement / Advantage Retiree Contributions Local School District Subsidies
4.75% / 4.75% 4.75% / 4.75% 0.00% when maximum is reached
Year ultimate trend rates reached
Medicare Supplement Claims and Contributions Medicare Advantage Claims and Contributions Local School District Subsidies
2025 2028 Varies
Basis for Postretirement Mortality Rates RP‒2014 Headcount-weighted
Basis for Postretirement Mortality Improvement Rates Scale BB
Projection of Mortality Improvements for Healthy / Disabled Lives
Static Projection to 2020 / 2020

Connecticut State Teachers’ Retirement System
Cavanaugh Macdonald Consulting, LLC Page 10
Section VI — Plan Accounting Information Under GASB 74 The table below provides the change in the Net OPEB Liability (NOL) during the current measurement period that must be disclosed under GASB accounting rules, as well as the most recent five years of the 10-year schedule of changes in the Net OPEB Liability and related ratios that must be included in Required Supplementary Information (RSI). We have assumed that the System will not restate results for any period prior to the adoption of GASB 74 or 75, so only results for the years since adoption are shown. Additional periods within the five year window will be added in the future.
Table VI‒1: Reconciliation of Changes in the Plan’s Total OPEB Liability (TOL)
($ in Thousands)
Fiscal Years Ending on June 30 2018 2017 2016 2015 2014 Total OPEB Liability (TOL)
Service Cost $ 132,392 $ 148,220
Interest on the TOL 133,597 111,129
Changes of benefit terms (1,044,628) 0
Difference between expected and actual experience 217,853 0
Changes of assumptions or other inputs (196,049) (370,549)
Net benefit payments (110,622) (84,071)
Net change in TOL $ (867,457) $ (195,271)
TOL—beginning of period $ 3,538,772 $ 3,734,043
TOL—end of period $ 2,671,315 $ 3,538,772

Connecticut State Teachers’ Retirement System
Cavanaugh Macdonald Consulting, LLC Page 11
Table VI‒2: Reconciliation of Changes in the Plan’s Fiduciary Net Position (PFNP) and Net OPEB Liability / (Asset) (NOL)
($ in Thousands)
Fiscal Years Ending on June 30 2018 2017 2016 2015 2014 TOL—end of period (a) $ 2,671,315 $ 3,538,772 Plan Fiduciary Net Position (PFNP)
Contributions – State of Connecticut $ 35,299 $ 19,922
Contributions – active member 51,484 50,436
Net investment income 411 369
Net benefit payments (110,622) (84,071)
Administrative expenses (264) (150)
Other 0 42
Net change in PFNP $ (23,692) $ (13,452)
PFNP—beginning of period $ 63,428 $ 76,880
PFNP—end of period (b) $ 39,736 $ 63,428
PFNP as a percentage of the TOL [(b) / (a)] 1.49% 1.79% Net OPEB Liability / (Asset) (NOL)—end of period [(a) – (b)]
$ 2,631,579
$ 3,475,344
Covered Payroll1 $ 4,075,939 $ 4,279,755
NOL as a percentage of Covered Payroll 64.56% 81.20%
1 Covered Payroll provided by the System for active employees who would be eligible for benefits at retirement.

Connecticut State Teachers’ Retirement System
Cavanaugh Macdonald Consulting, LLC Page 12
Section VII — Plan Financial Statement Note Disclosures This section contains accounting information that may be used to satisfy the reporting requirements under Governmental Accounting Standards Board (GASB) Statement No. 74 for the fiscal year ending on June 30, 2018, based on a June 30, 2018 valuation date. The Plan is assumed to be cost-sharing, other than insured, defined benefit OPEB plan with a special funding situation where assets are accumulated in a trust that meets the criteria in paragraph 3 of GASB 74. Additionally, we have assumed that the System will not restate results for any period prior to the adoption of GASB 74 based on the guidance in paragraph 61 of that Standard. This report does not include any non-actuarial items that may need to be reported or disclosed. Plan Membership Information The Plan’s membership data was furnished by the System for valuation purposes as of June 30, 2018. The following table summarizes the membership of the Plan as of the June 30, 2018 valuation date.
Membership Group Number
Inactive plan members currently receiving benefits 28,530
Inactive plan members entitled to, but not currently receiving benefits 10,684 Active participants 50,594
Total membership 89,808
Net OPEB Liability / (Asset) (NOL) The NOL is equal to the Total OPEB Liability (TOL) minus the Plan Fiduciary Net Position (PFNP). The development of the NOL, and the Plan’s funded ratio, as of the June 30, 2018 Measurement Date is presented in the table below.
As of June 30, 2018 ($ in Thousands)
TOL $ 2,671,315
PFNP 39,736
NOL [TOL ‒ PFNP] $ 2,631,579 Ratio of PFNP to TOL 1.49%

Connecticut State Teachers’ Retirement System
Cavanaugh Macdonald Consulting, LLC Page 13
Summary of Key Actuarial Assumptions, Methods, and Other Inputs The TOL was determined by an actuarial valuation as of June 30, 2018, using the key actuarial assumptions, methods, and other inputs listed below. Please note that the complete set of actuarial assumptions, methods, and other inputs that were used to develop the TOL are provided in Schedule C.
Inflation 2.75%
Real wage growth 0.50%
Wage inflation 3.25%
Salary increases, including wage inflation 3.25% - 6.50%
Long-term Investment Rate of Return, net of OPEB plan investment expense, including inflation 3.00%
Municipal Bond Index Rate 3.87%
Year PFNP is projected to be depleted 2019
Single Equivalent Interest Rate, net of OPEB plan investment expense, including price inflation 3.87%
Health Care Cost Trend Rates Medicare Supplement Plan Options
Claims / Member Contributions 5.95% for 2018, decreasing to an ultimate rate of 4.75% by 2025
Medicare Advantage Plan Options Claims
5.00% for 2018, decreasing to an ultimate rate of 4.75% by 2028
Member Contributions 0.00% for 2018 and 2019, increasing to 5.00% for 2020, and decreasing to an ultimate rate of 4.75% by 2028
Local School District Subsidies 0.00% for members / dependents who are receiving the maximum subsidy; Otherwise, 5.95% for 2018, decreasing to an ultimate rate of 0.00% when the maximum subsidy is reached
Health care cost trend rates are set on an annual basis based on published annual health care inflation surveys in conjunction with actual plan experience (if credible), building block models and heuristics developed by health plan actuaries and administrators, and the views of experts who are familiar with the System’s Plan and/or similar plan offerings. Effective June 30, 2018, the health care cost trend rates for the Medicare Supplement and Medicare Advantage medical and prescription drug options were revised to reflect current expectations of future increases in health care claim costs for those options. Mortality rates were based on the RPH-2014 White Collar table with employee and annuitant rates blended from ages 50 to 80, projected to the year 2020 using the BB improvement scale, and further adjusted to grade in increases (5% for females and 8% for males) to rates over age 80 for the period after service

Connecticut State Teachers’ Retirement System
Cavanaugh Macdonald Consulting, LLC Page 14
retirement and for dependent beneficiaries as well as for active members. The RPH-2014 Disabled Mortality Table projected to 2020 with Scale BB is used for the period after disability retirement. The demographic actuarial assumptions for retirement, disability incidence, and withdrawal used in the June 30, 2018 valuation were based on the results of an actuarial experience study for the period July 1, 2010 – June 30, 2015. The remaining actuarial assumptions (e.g., initial per capita costs, rates of plan participation, rates of plan election, etc.) used in the June 30, 2018 valuation are based on a review of recent plan experience that was performed concurrently with the June 30, 2018 valuation and/or based on anticipated changes in participant behavior following the change of benefit terms, effective July 1, 2018, that was adopted by the System on January 11, 2018, and communicated to members prior to June 30, 2018. The long-term expected return on plan assets is reviewed as part of the GASB 74 valuation process. Several factors are considered in evaluating the long-term rate of return assumption, including the Plan’s current asset allocations and a log-normal distribution analysis using the best-estimate ranges of expected future real rates of return (expected return, net of investment expense and inflation) for each major asset class compiled by Horizon Actuarial Services, LLC in its “Survey of Capital Market Assumptions, 2018 Edition”. The long-term expected rate of return was determined by weighting the expected future real rates of return by the target asset allocation percentage and then adding expected inflation. The assumption is not expected to change absent a significant change in the asset allocation, a change in the inflation assumption, or a fundamental change in the market that alters expected returns in future years. The target asset allocation and best estimates of geometric real rates of return for each major asset class are summarized in the following table:
Asset Class Target
Allocation
Expected 10-Year Geometric Real Rate of Return
Standard Deviation
U.S. Treasuries (Cash Equivalents) 100.00%* 0.27% 2.74%
Price Inflation 2.75%
Expected Rate of Return 1.0027 x 1.0275 – 1 = 3.03%
Expected Rate of Return (Rounded Nearest 0.25%) 3.00%
*All of the Plan’s assets are assumed to be invested in cash equivalents given the need for liquidity. DEVELOPMENT OF THE DISCOUNT RATE (SEIR) The projection of cash flows used to determine the discount rate was performed in accordance with GASB 74. The basis for this projection was the actuarial valuation performed as of June 30, 2018. In addition to the actuarial methods and assumptions of the June 30, 2018 actuarial valuation, the following actuarial methods and assumptions were used in the projection of cash flows:
Total payroll for the initial projection year consists of the payroll of the active membership present on the Valuation Date. In subsequent projection years, total payroll was assumed to increase annually at a rate of 3.25%.

Connecticut State Teachers’ Retirement System
Cavanaugh Macdonald Consulting, LLC Page 15
Employee contributions were assumed to be made at the current member contribution rate, and were first applied to reduce applicable service costs for these members.
No future State contributions were assumed to be made. Based on these assumptions, the Plan’s PFNP was projected to be depleted in 2019 and, as a result, the Municipal Bond Index Rate was used in the determination of the SEIR. In this analysis, the long-term expected rate of return on Plan investments equal to 3.00% was applied to periods through 2019 and the Municipal Bond Index Rate as of the Measurement Date (3.87%) was applied to periods on or after 2019, resulting in an SEIR equal to 3.87% as of the Measurement Date. The System selected the 3.87% discount rate used to measure the TOL as of the Measurement Date. Please note that the PFNP projections are based upon the Plan’s financial status on the Valuation Date, the indicated set of methods and assumptions, and the requirements of GASB 74. As such, the PFNP projections are not reflective of the cash flows and asset accumulations that would occur on an ongoing plan basis, reflecting the impact of future members. Therefore, the results of this test do not necessarily indicate whether or not the fund will actually run out of money, the financial condition of the Plan, or the Plan’s ability to make benefit payments in future years. Sensitivity of the Net OPEB Liability to Health Care Cost Trend Rates The sensitivity of the NOL to changes in health care cost trend rates must be disclosed under GASB accounting rules. The table below provides the NOL of the Plan determined using current health care cost trend rates, as well as what the Plan’s NOL would be if health care cost trend rates were 1-percentage-point lower or 1-percentage-point higher than current health care cost trend rates.
Sensitivity of the Net OPEB Liability to Health Care Cost Trend Rates
1% Lower
Trend Rates Current
Trend Rates 1% Higher
Trend Rates Initial Health Care Trend Rates 4.95% / 4.00% 5.95% / 5.00% 6.95% / 6.00%
Ultimate Health Care Trend Rate 3.75% 4.75% 5.75%
Net OPEB Liability / (Asset) $ 2,205,344 $ 2,631,579 $ 3,197,374
Please keep in mind that the estimates provided in the table above were prepared using streamlined calculation techniques, and they are intended to provide an “order of magnitude” indication of the NOL’s sensitivity to changes in these assumptions. Results based on more refined calculations may yield findings and conclusions different than those suggested by the methodology required under GASB accounting rules, as shown above.
Connecticut State Teachers’ Retirement System
Cavanaugh Macdonald Consulting, LLC Page 16
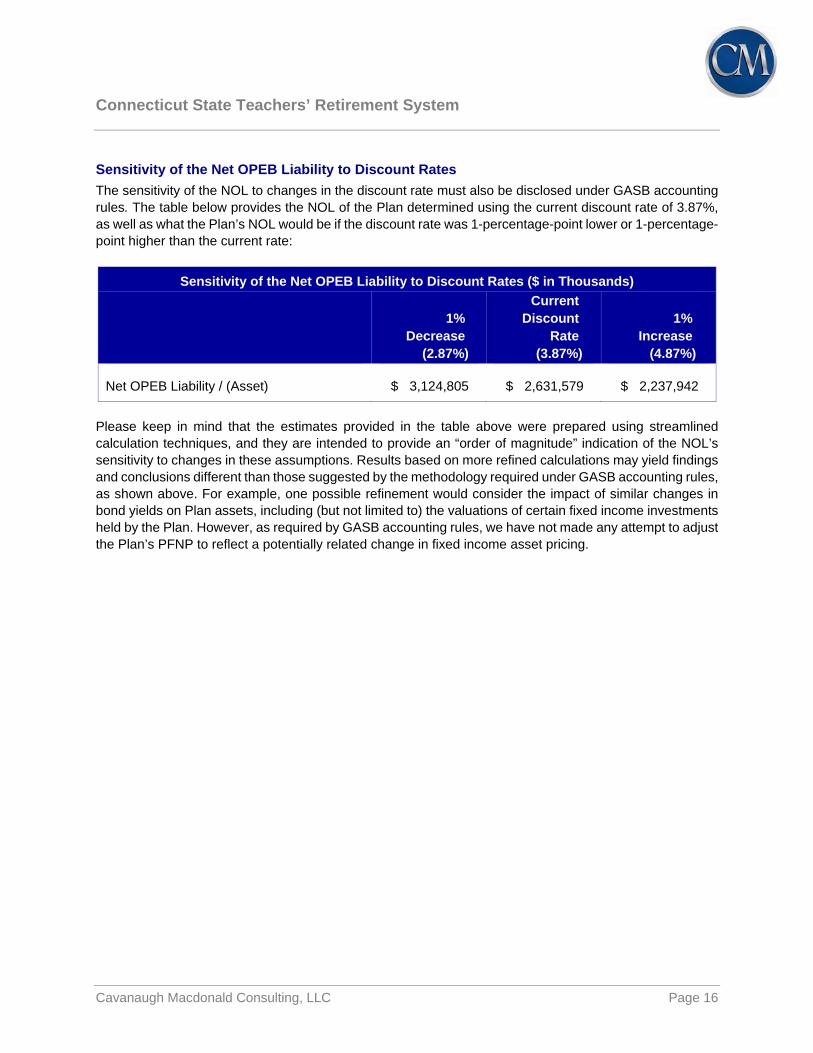
Sensitivity of the Net OPEB Liability to Discount Rates The sensitivity of the NOL to changes in the discount rate must also be disclosed under GASB accounting rules. The table below provides the NOL of the Plan determined using the current discount rate of 3.87%, as well as what the Plan’s NOL would be if the discount rate was 1-percentage-point lower or 1-percentage-point higher than the current rate:
Sensitivity of the Net OPEB Liability to Discount Rates ($ in Thousands)
1% Decrease
(2.87%)
Current Discount
Rate (3.87%)
1% Increase
(4.87%) Net OPEB Liability / (Asset) $ 3,124,805 $ 2,631,579 $ 2,237,942
Please keep in mind that the estimates provided in the table above were prepared using streamlined calculation techniques, and they are intended to provide an “order of magnitude” indication of the NOL’s sensitivity to changes in these assumptions. Results based on more refined calculations may yield findings and conclusions different than those suggested by the methodology required under GASB accounting rules, as shown above. For example, one possible refinement would consider the impact of similar changes in bond yields on Plan assets, including (but not limited to) the valuations of certain fixed income investments held by the Plan. However, as required by GASB accounting rules, we have not made any attempt to adjust the Plan’s PFNP to reflect a potentially related change in fixed income asset pricing.

Connecticut State Teachers’ Retirement System
Cavanaugh Macdonald Consulting, LLC Page 17
REQUIRED SUPPLEMENTARY INFORMATION Under GASB 74, information regarding changes to benefit terms and changes to assumptions or other inputs should be noted regarding the Required Supplementary Information (RSI). The information should be listed by the date for which the indicated change was first reflected in reported amounts. Changes to benefit terms June 30, 2018 (Valuation Date: June 30, 2018) The Plan was amended by the Board, effective July 1, 2018, during the January 11, 2018 meeting. The
Board action added the Anthem Medicare Advantage Plan to the available options under the Plan, changed the “base plan” to the Medicare Advantage Plan for the purposes of determining retiree subsidies and/or cost sharing amount(s), and introduced a two year waiting period for re-enrollment in a System-sponsored health care plan for those who cancel their coverage or choose not to enroll in a health care coverage option on or after the effective date. These changes were communicated to retired members during the months leading up to a special open enrollment period that preceded the July 1, 2018 implementation date.
Changes to assumptions or other inputs June 30, 2018 (Valuation Date: June 30, 2018) The expected rate of return on assets was changed from 2.75% to 3.00% to better reflect the anticipated
returns on cash and other high quality short-term fixed income investments;
Based on the procedure described in GASB 74, the discount rate used to measure Plan obligations for financial accounting purposes as of June 30, 2018 was updated to equal the Municipal Bond Index Rate as of June 30, 2018. The System selected the 3.87% discount rate used to measure the TOL as of the June 30, 2018 measurement date;
Expected annual per capita claims costs were updated to better reflect anticipated medical and prescription drug claim experience both before and after the plan change that became effective on July 1, 2018;
The assumed age related annual percentage increases in expected annual per capita health care claim costs were updated to better reflect the expected differences between the Medicare Supplement and Medicare Advantage Plan amounts as part of the plan change that became effective on July 1, 2018;
Long-term health care cost trend rates were updated to better reflect the anticipated impact of changes in medical inflation, utilization, leverage in the plan design, improvements in technology, and fees and charges on expected claims and retiree contributions in future periods;
The percentage of retired members who are not currently participating in the Plan, but are expected to elect coverage for themselves and their spouses under a System-sponsored health care plan option in the future, was updated to better reflect anticipated plan experience;
The percentages of participating retirees who are expected to enroll in the Medicare Supplement Plan and the Medicare Advantage Plan options, as well as the portion who are expected to migrate to the Medicare Advantage Plan over the next several years, were updated to better reflect anticipated plan experience after the plan change that became effective on July 1, 2018;

Connecticut State Teachers’ Retirement System
Cavanaugh Macdonald Consulting, LLC Page 18
The post-disablement mortality table was updated to extend the period of projected mortality improvements from 2017 to 2020. This change was made to better reflect anticipated post-disablement plan experience; and,
The percentages of deferred vested members who will become ineligible for future health care benefits because they are expected to withdraw their contributions from the System was updated to better reflect anticipated plan experience.

Connecticut State Teachers’ Retirement System
Cavanaugh Macdonald Consulting, LLC Page 19
REQUIRED SUPPLEMENTARY INFORMATION— SCHEDULE OF GOVERNMENTAL NONEMPLOYER CONTRIBUTING ENTITY CONTRIBUTIONS
($ in Thousands) Fiscal Year Ending on June 30 2018 2017 2016 2015 2014 2013 2012 2011 2010 2009 Actuarially Determined State Contribution $ 172,223 $ 166,802 $ 130,331 $ 125,620 $ 187,227 $ 180,460 $ 184,145 $ 177,063 $ 121,334 $ 116,667
Contributions in relation to the Actuarially Determined Contribution 35,299 19,922 19,960 25,145 25,955 27,040 49,486 5,312 12,108 22,433
Annual Contribution Deficiency (Excess) $ 136,924 $ 146,880 $ 110,371 $ 100,475 $ 161,272 $ 153,420 $ 134,659 $ 171,751 $ 109,226 $ 94,234
Covered Payroll $4,075,939 $4,279,755 $4,125,066 $4,078,367 $3,930,957 $4,101,750 $3,943,990 $3,823,754 $3,676,686 $3,529,470
Actual Contributions as a Percentage of Covered Payroll 0.87% 0.47% 0.48% 0.62% 0.66% 0.66% 1.25% 0.14% 0.33% 0.64%

Connecticut State Teachers’ Retirement System
Cavanaugh Macdonald Consulting, LLC Page 20
Schedule A — Details Concerning Membership Census Data
Table A‒1: Distribution of Active Members by Attained Age and Service as of June 30, 2018
Years of Service
Age Under 1 1 to 4 5 to 9 10 to 14 15 to 19 20 to 24 25 to 29 30 to 34 35 to 39 40 & Up Total Under 25 99 663 1
763
* * *
$48,350
25 to 29 178 3,417 945 2
4,542
* * $58,975 *
$54,064
30 to 34 93 1,930 3,464 1,031
6,518
* * $63,377 $73,523
$62,963
35 to 39 67 1,059 1,605 3,856 917 1
7,505
* * $67,847 $79,591 $90,006 *
$75,690
40 to 44 60 606 900 1,894 3,152 510
7,122
* * $71,363 $83,564 $93,321 $102,896
$85,835
45 to 49 46 584 731 1,281 2,202 2,339 312
7,495
* * $72,317 $83,576 $92,935 $100,326 $103,681
$89,566
50 to 54 12 341 558 986 1,224 1,317 979 381
5,798
* * $70,753 $82,372 $92,265 $97,708 $101,517 $101,911
$90,210
55 to 59 9 200 332 737 1,060 868 643 1,124 209 5,182
* * $72,475 $82,327 $91,541 $96,809 $99,782 $98,975 $97,336 $91,662
60 to 64 6 104 160 461 795 702 498 555 444 115 3,840
* * $75,609 $81,758 $91,207 $95,120 $99,074 $100,141 $101,095 $102,326 $93,311
65 to 69 1 29 59 119 304 299 212 226 115 148 1,512
* * $82,301 $84,506 $93,169 $95,538 $100,803 $97,723 $104,441 $103,526 $95,895
70 & Up 1 6 2 17 40 55 57 43 36 60 317
* * * $85,008 $93,516 $97,315 $105,845 $98,164 $95,550 $104,547 $98,089
Total 572 8,939 8,757 10,384 9,694 6,091 2,701 2,329 804 323 50,594
$53,456 $56,929 $66,459 $80,833 $92,414 $98,608 $100,939 $99,597 $100,348 $103,289 $80,562
* Average reported compensation is not shown for members with fewer than 5 years of service or age/service groups with fewer than 20 individuals.

Connecticut State Teachers’ Retirement System
Cavanaugh Macdonald Consulting, LLC Page 21
Table A‒2: Comparative Summary of Key Active Member Statistics
June 30, 2018 June 30, 2016 Average Age 44.7 years 44.6 years Average Service 14.0 years 13.7 years Average Pay $80,652 $77,637
Table A‒3: Distributions of Members and Spouses Who Are Receiving Retiree Health Insurance Benefits by Age and Gender as of June 30, 2018
Retirees Spouses1
Total Male Female Male Female Subsidized Local School District Coverage
Ages Under 65 450 1,857 637 439 3,383 Ages 65 and Over 1,923 4,343 1,225 825 8,316 Subsidy Total 2,373 6,200 1,862 1,264 11,699
System-Sponsored Health Care Plans Medical with Prescriptions
Under Age 65 0 1 0 2 3 Ages 65 ‒ 69 20 59 31 19 129 Ages 70 ‒ 74 126 242 131 70 569 Ages 75 ‒ 79 105 233 94 65 497 Ages 80 ‒ 84 165 300 119 119 703 Ages Over 84 311 642 200 178 1,331 Total 727 1,477 575 453 3,232
Medical with Prescriptions, Vision & Hearing Under Age 65 4 12 19 22 57 Ages 65 ‒ 69 1,332 4,145 1,645 734 7,856 Ages 70 ‒ 74 1,844 3,920 1,792 841 8,397 Ages 75 ‒ 79 1,231 2,046 1,037 619 4,933 Ages 80 ‒ 84 665 1,123 488 276 2,552 Ages Over 84 463 968 314 162 1,907 Total 5,539 12,214 5,295 2,654 25,702
Health Care Total 6,266 13,691 5,870 3,107 28,934
Total 8,639 19,891 7,732 4,371 40,633
1 As of June 30, 2018, this number includes 30 active employees, and 6 inactive members, who are also currently enrolled as
covered dependents of participating retirees. These participants are also included in the counts of active and inactive members, respectively.
Connecticut State Teachers’ Retirement System
Cavanaugh Macdonald Consulting, LLC Page 22
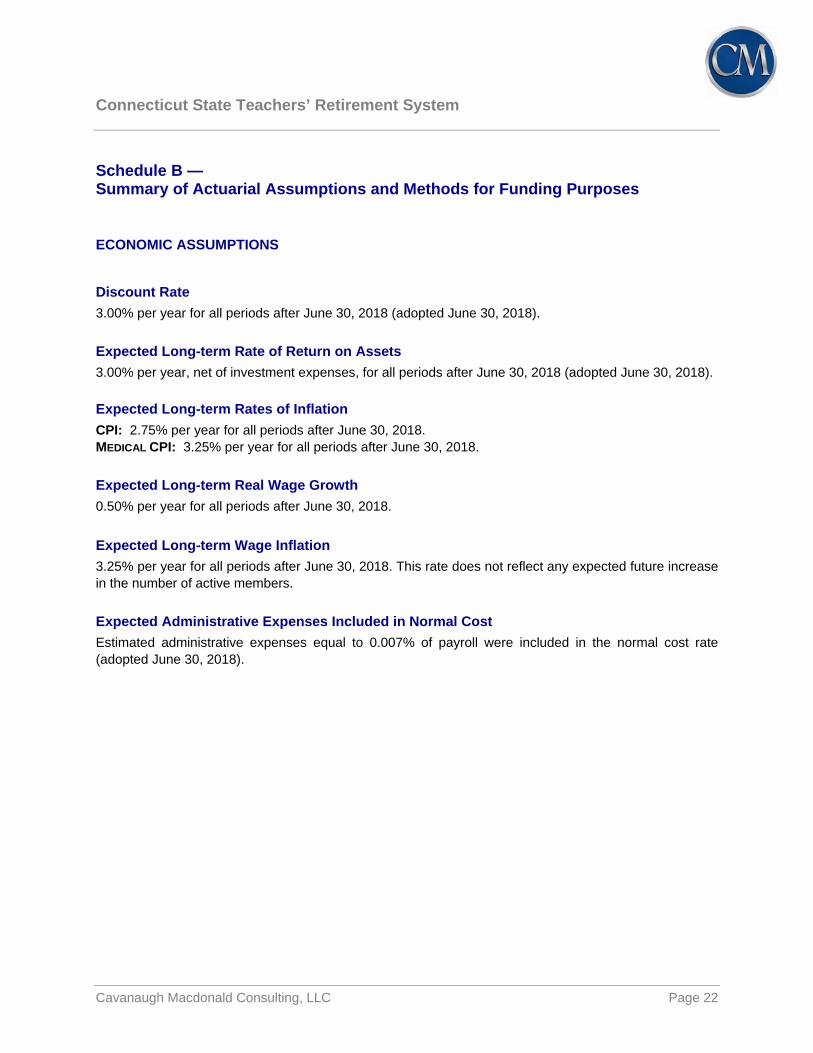
Schedule B — Summary of Actuarial Assumptions and Methods for Funding Purposes
ECONOMIC ASSUMPTIONS
Discount Rate 3.00% per year for all periods after June 30, 2018 (adopted June 30, 2018). Expected Long-term Rate of Return on Assets 3.00% per year, net of investment expenses, for all periods after June 30, 2018 (adopted June 30, 2018). Expected Long-term Rates of Inflation CPI: 2.75% per year for all periods after June 30, 2018. MEDICAL CPI: 3.25% per year for all periods after June 30, 2018. Expected Long-term Real Wage Growth 0.50% per year for all periods after June 30, 2018. Expected Long-term Wage Inflation 3.25% per year for all periods after June 30, 2018. This rate does not reflect any expected future increase in the number of active members. Expected Administrative Expenses Included in Normal Cost Estimated administrative expenses equal to 0.007% of payroll were included in the normal cost rate (adopted June 30, 2018).

Connecticut State Teachers’ Retirement System
Cavanaugh Macdonald Consulting, LLC Page 23
Long-term Health Care Cost Trend Rates Annual per capita health care claims costs are expected to increase in future years as a result of medical inflation, utilization, leverage in the plan design, and improvements in technology adjusted for any implicit and/or explicit cost containment features. Initial health care cost trend rates were selected based on an analysis of national average health trend surveys specific to similarly structured plans for Medicare-eligible participants. The assumed annual assumed rates of increases in retiree expected health care claims costs and contributions1 during each period subsequent to the measurement date are shown in the table below (adopted June 30, 2018).
Fiscal Year Beginning
July 1,
Medicare Supplement Plan
Claims / Contributions
Medicare Advantage Plan
Claims
Medicare Advantage Plan Contributions
2018 5.95% 5.00% 0.00% 2019 5.90% 5.00% 0.00% 2020 5.80% 5.00% 5.00% 2021 5.70% 5.00% 5.00% 2022 5.60% 5.00% 5.00% 2023 5.35% 5.00% 5.00% 2024 5.10% 5.00% 5.00% 2025 4.75% 5.00% 5.00% 2026 4.75% 4.95% 4.95% 2027 4.75% 4.85% 4.85%
2028+ 4.75% 4.75% 4.75%
1 A 7.00% trend rate for the fiscal year ending on the valuation date, and a 7.25% trend rate for all periods prior to July 1, 2017,
were used to project health care claim costs and contributions backward from the valuation year to entry year in measurements of benefit obligations based on the Entry Age Normal (Level Percentage of Pay) actuarial cost method.

Connecticut State Teachers’ Retirement System
Cavanaugh Macdonald Consulting, LLC Page 24
DEMOGRAPHIC ASSUMPTIONS
The demographic actuarial assumptions for retirement, disability incidence, and withdrawal were developed based on the results of an actuarial experience study for the five-year period from July 1, 2010 to June 30, 2015, adopted by the Board, and prescribed for use in the Plan’s June 30, 2018 actuarial valuation. Expected Annual Subsidies for Local School District Coverage FUTURE RETIREES AND DEPENDENTS The lesser of $1,320 per year ($110 per month) and the Maximum Annual Subsidy for all future retired members and dependents who are expected to be covered under local school district OPEB plans in future periods. CURRENT RETIREES AND DEPENDENTS The lesser of the annualized actual monthly subsidy amounts provided by the System for retired members and dependents who are covered under local school district OPEB plans as of June 30, 2018 and the applicable Maximum Annual Subsidy. Reported subsidies are expected to increase each year based on the assumed long-term health care cost trend rates for Medicare Supplement Plans until the Maximum Annual Subsidy is reached. The following table provides Maximum Annual Subsidy amounts for Medicare-ineligible and Medicare-eligible members and dependents who are receiving health care coverage under a local school district OPEB plan:
Medicare Status Maximum Annual Subsidy Ineligible $1,320 per year ($110 per month) Eligible
$2,640 per year ($220 per month) for those without “premium free” Medicare Part A, and
contribute at least $220 per month for coverage under a local school district plan;
$1,320 per year ($110 per month), otherwise.
The Maximum Annual Subsidies provided in the table above have not increased since July of 1996. Our understanding is that these types of benefit improvements would not be considered “substantially automatic” (as that term is defined in GASB 74 and 75) based on the Plan’s history of such changes. As a result, the Maximum Annual Subsidy Amounts shown above are not expected to increase in any future period.
Connecticut State Teachers’ Retirement System
Cavanaugh Macdonald Consulting, LLC Page 25
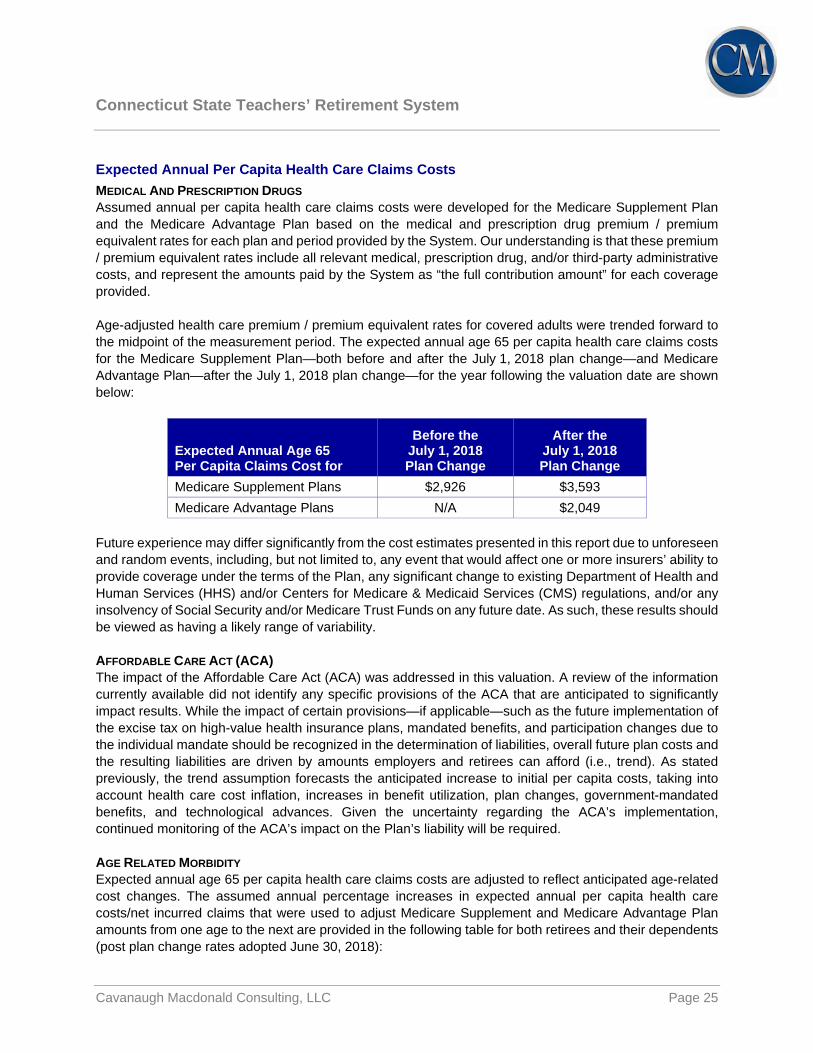
Expected Annual Per Capita Health Care Claims Costs MEDICAL AND PRESCRIPTION DRUGS Assumed annual per capita health care claims costs were developed for the Medicare Supplement Plan and the Medicare Advantage Plan based on the medical and prescription drug premium / premium equivalent rates for each plan and period provided by the System. Our understanding is that these premium / premium equivalent rates include all relevant medical, prescription drug, and/or third-party administrative costs, and represent the amounts paid by the System as “the full contribution amount” for each coverage provided. Age-adjusted health care premium / premium equivalent rates for covered adults were trended forward to the midpoint of the measurement period. The expected annual age 65 per capita health care claims costs for the Medicare Supplement Plan—both before and after the July 1, 2018 plan change—and Medicare Advantage Plan—after the July 1, 2018 plan change—for the year following the valuation date are shown below:
Expected Annual Age 65 Per Capita Claims Cost for
Before the July 1, 2018 Plan Change
After the July 1, 2018 Plan Change
Medicare Supplement Plans $2,926 $3,593 Medicare Advantage Plans N/A $2,049
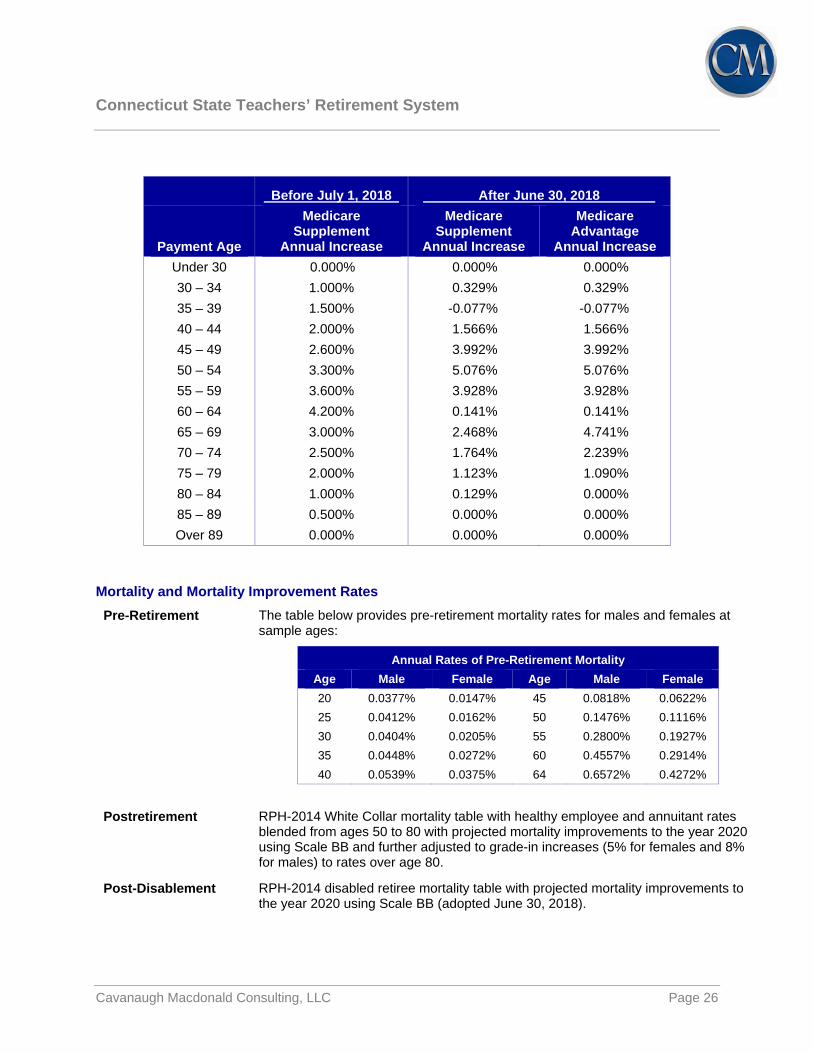
Future experience may differ significantly from the cost estimates presented in this report due to unforeseen and random events, including, but not limited to, any event that would affect one or more insurers’ ability to provide coverage under the terms of the Plan, any significant change to existing Department of Health and Human Services (HHS) and/or Centers for Medicare & Medicaid Services (CMS) regulations, and/or any insolvency of Social Security and/or Medicare Trust Funds on any future date. As such, these results should be viewed as having a likely range of variability. AFFORDABLE CARE ACT (ACA) The impact of the Affordable Care Act (ACA) was addressed in this valuation. A review of the information currently available did not identify any specific provisions of the ACA that are anticipated to significantly impact results. While the impact of certain provisions—if applicable—such as the future implementation of the excise tax on high-value health insurance plans, mandated benefits, and participation changes due to the individual mandate should be recognized in the determination of liabilities, overall future plan costs and the resulting liabilities are driven by amounts employers and retirees can afford (i.e., trend). As stated previously, the trend assumption forecasts the anticipated increase to initial per capita costs, taking into account health care cost inflation, increases in benefit utilization, plan changes, government-mandated benefits, and technological advances. Given the uncertainty regarding the ACA’s implementation, continued monitoring of the ACA’s impact on the Plan’s liability will be required. AGE RELATED MORBIDITY Expected annual age 65 per capita health care claims costs are adjusted to reflect anticipated age-related cost changes. The assumed annual percentage increases in expected annual per capita health care costs/net incurred claims that were used to adjust Medicare Supplement and Medicare Advantage Plan amounts from one age to the next are provided in the following table for both retirees and their dependents (post plan change rates adopted June 30, 2018):
Connecticut State Teachers’ Retirement System
Cavanaugh Macdonald Consulting, LLC Page 26
Before July 1, 2018 After June 30, 2018
Payment Age
Medicare Supplement
Annual Increase
Medicare Supplement
Annual Increase
Medicare Advantage
Annual Increase Under 30 0.000% 0.000% 0.000% 30 – 34 1.000% 0.329% 0.329% 35 – 39 1.500% -0.077% -0.077% 40 – 44 2.000% 1.566% 1.566% 45 – 49 2.600% 3.992% 3.992% 50 – 54 3.300% 5.076% 5.076% 55 – 59 3.600% 3.928% 3.928% 60 – 64 4.200% 0.141% 0.141% 65 – 69 3.000% 2.468% 4.741% 70 – 74 2.500% 1.764% 2.239% 75 – 79 2.000% 1.123% 1.090% 80 – 84 1.000% 0.129% 0.000% 85 ‒ 89 0.500% 0.000% 0.000% Over 89 0.000% 0.000% 0.000%
Mortality and Mortality Improvement Rates
Pre-Retirement The table below provides pre-retirement mortality rates for males and females at sample ages:
Annual Rates of Pre-Retirement Mortality Age Male Female Age Male Female 20 0.0377% 0.0147% 45 0.0818% 0.0622% 25 0.0412% 0.0162% 50 0.1476% 0.1116% 30 0.0404% 0.0205% 55 0.2800% 0.1927% 35 0.0448% 0.0272% 60 0.4557% 0.2914% 40 0.0539% 0.0375% 64 0.6572% 0.4272%
Postretirement RPH-2014 White Collar mortality table with healthy employee and annuitant rates blended from ages 50 to 80 with projected mortality improvements to the year 2020 using Scale BB and further adjusted to grade-in increases (5% for females and 8% for males) to rates over age 80.
Post-Disablement RPH-2014 disabled retiree mortality table with projected mortality improvements to the year 2020 using Scale BB (adopted June 30, 2018).

Connecticut State Teachers’ Retirement System
Cavanaugh Macdonald Consulting, LLC Page 27
Retirement Rates The following table contains age and service based annual rates of retirement at sample ages:
Annual Rates of Retirement Unreduced Proratable Reduced
Age Male Female Male Female Male Female 50 27.5% 27.5% 1.00% 1.00% 55 38.5% 27.5% 4.00% 4.75% 60 22.0% 27.5% 6.0% 5.5% 65 36.3% 32.5% 13.0% 12.5% 70 100.0% 32.5% 30.0% 14.5% 75 100.0% 32.5% 30.0% 18.0% 80 100.0% 100.0% 100.0% 100.0%
Withdrawal Rates The following table contains service based annual rates of withdrawal (separation from service for causes other than death, disability, or retirement) for males and females:
Annual Rates of Withdrawal
Years of Service
10 or More Years of Service Male Female Age Male Female
0 14.00% 12.00% 25 1.50% 4.00% 1 11.00% 10.50% 30 1.50% 4.00% 2 8.00% 8.75% 35 1.50% 3.50% 3 6.50% 7.50% 40 1.50% 2.30% 4 4.50% 6.75% 45 1.59% 1.50% 5 3.50% 6.00% 50 2.04% 2.00% 6 3.00% 5.25% 55 3.44% 2.50% 7 2.75% 4.75% 59 4.00% 2.90% 8 2.50% 4.25% 9 2.50% 4.00%
Connecticut State Teachers’ Retirement System
Cavanaugh Macdonald Consulting, LLC Page 28
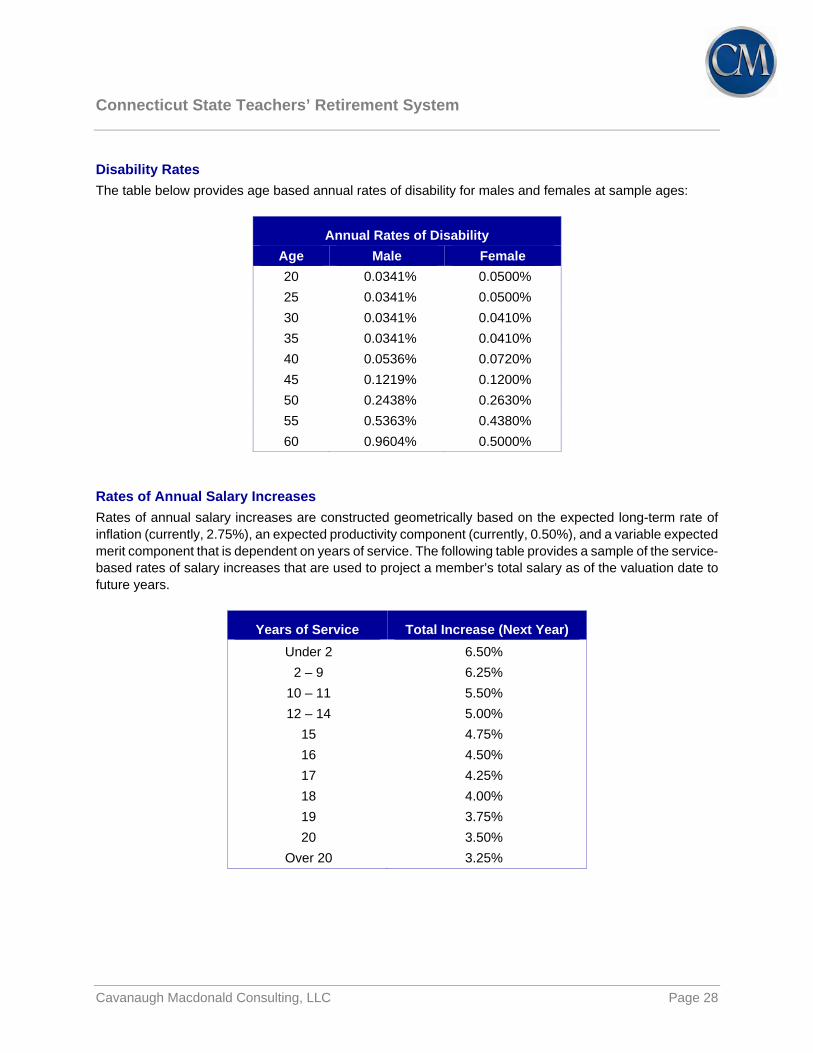
Disability Rates The table below provides age based annual rates of disability for males and females at sample ages:
Annual Rates of Disability Age Male Female 20 0.0341% 0.0500% 25 0.0341% 0.0500% 30 0.0341% 0.0410% 35 0.0341% 0.0410% 40 0.0536% 0.0720% 45 0.1219% 0.1200% 50 0.2438% 0.2630% 55 0.5363% 0.4380% 60 0.9604% 0.5000%
Rates of Annual Salary Increases Rates of annual salary increases are constructed geometrically based on the expected long-term rate of inflation (currently, 2.75%), an expected productivity component (currently, 0.50%), and a variable expected merit component that is dependent on years of service. The following table provides a sample of the service-based rates of salary increases that are used to project a member’s total salary as of the valuation date to future years.
Years of Service Total Increase (Next Year) Under 2 6.50%
2 – 9 6.25% 10 – 11 5.50% 12 – 14 5.00%
15 4.75% 16 4.50% 17 4.25% 18 4.00% 19 3.75% 20 3.50%
Over 20 3.25%
Connecticut State Teachers’ Retirement System
Cavanaugh Macdonald Consulting, LLC Page 29
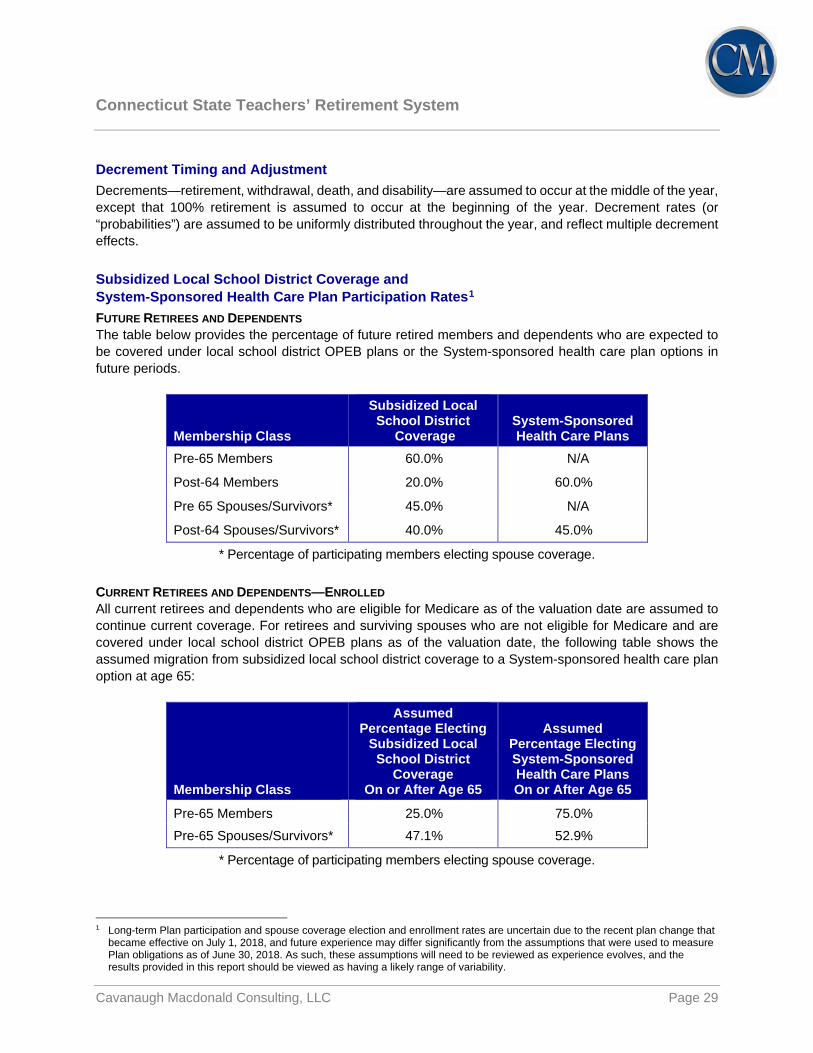
Decrement Timing and Adjustment Decrements—retirement, withdrawal, death, and disability—are assumed to occur at the middle of the year, except that 100% retirement is assumed to occur at the beginning of the year. Decrement rates (or “probabilities”) are assumed to be uniformly distributed throughout the year, and reflect multiple decrement effects. Subsidized Local School District Coverage and System-Sponsored Health Care Plan Participation Rates1 FUTURE RETIREES AND DEPENDENTS The table below provides the percentage of future retired members and dependents who are expected to be covered under local school district OPEB plans or the System-sponsored health care plan options in future periods.
Membership Class
Subsidized Local School District
Coverage System-Sponsored Health Care Plans
Pre-65 Members 60.0% N/A
Post-64 Members 20.0% 60.0%
Pre 65 Spouses/Survivors* 45.0% N/A
Post-64 Spouses/Survivors* 40.0% 45.0%
* Percentage of participating members electing spouse coverage. CURRENT RETIREES AND DEPENDENTS—ENROLLED All current retirees and dependents who are eligible for Medicare as of the valuation date are assumed to continue current coverage. For retirees and surviving spouses who are not eligible for Medicare and are covered under local school district OPEB plans as of the valuation date, the following table shows the assumed migration from subsidized local school district coverage to a System-sponsored health care plan option at age 65:
Membership Class
Assumed Percentage Electing
Subsidized Local School District
Coverage On or After Age 65
Assumed Percentage Electing System-Sponsored Health Care Plans On or After Age 65
Pre-65 Members 25.0% 75.0% Pre-65 Spouses/Survivors* 47.1% 52.9%
* Percentage of participating members electing spouse coverage.
1 Long-term Plan participation and spouse coverage election and enrollment rates are uncertain due to the recent plan change that
became effective on July 1, 2018, and future experience may differ significantly from the assumptions that were used to measure Plan obligations as of June 30, 2018. As such, these assumptions will need to be reviewed as experience evolves, and the results provided in this report should be viewed as having a likely range of variability.

Connecticut State Teachers’ Retirement System
Cavanaugh Macdonald Consulting, LLC Page 30
CURRENT RETIREES AND DEPENDENTS—NOT ENROLLED 50% of retired members who are not eligible for Medicare, are currently receiving a retirement or disability benefit, but are not participating in the Plan, are expected to be covered under a System-sponsored health care plan option at age 65. Of these participants, 50% are assumed to cover a spouse (adopted June 30, 2018). Of those participating, the percentage of current and future retirees and surviving spouses who are assumed to enroll in the coverage options available on July 1, 2018 are shown in the table below. In each future year that begins on or after July 1, 2019, 50% of the current and future retirees and surviving spouses are expected to choose the Medicare Advantage Plan in lieu of their existing Medicare Supplement Plan coverage (adopted June 30, 2018). The first five years of the aforementioned progression are illustrated in the table below.
Grandfathered Members All Other Members Initial Enrollment Percentages Beginning on
Medicare Supplement
Plan
Medicare Advantage
Plan
Medicare Supplement
Plan
Medicare Advantage
Plan July 1, 2018 25.00% 75.00% 15.00% 85.00% July 1, 2019 12.50% 87.50% 7.50% 92.50% July 1, 2020 6.25% 93.75% 3.75% 96.25% July 1, 2021 3.13% 96.87% 1.88% 98.12% July 1, 2022 1.56% 98.44% 0.94% 99.06% … … … … …
Assumed Eligibility for “Premium Free” Medicare Part A Benefits FUTURE RETIREES AND DEPENDENTS 100% of future Medicare-eligible retirees and dependents are expected to be eligible for “premium free” Medicare Part A benefits. CURRENT RETIREES AND DEPENDENTS 0% of retired members and dependents who are currently receiving a subsidy equal to $2,640 per year ($220 per month) as of June 30, 2018 are expected to be eligible for “premium free” Medicare Part A benefits. Otherwise, 100% of retired members and dependents are expected to be eligible for these benefits when they reach age 65 or, if they are older, their attained age on the valuation date.

Connecticut State Teachers’ Retirement System
Cavanaugh Macdonald Consulting, LLC Page 31
Assumed Commencement Age for Eligible Deferred Vested Members Eligible deferred vested members and their dependents are expected to begin receiving health care benefits when members reach age 60 or, if they are older, the member’s attained age on the valuation date. The following table contains the age based assumed percentages of deferred vested members who will become ineligible for future health care benefits because they are expected to withdraw their contributions from the System (adopted June 30, 2018):
Attained Ages on the Later of the Valuation Date or Date of Decrement Under Age 55 Age 56 Age 57 Age 58 Age 59 Over Age 59
30.00% 24.00% 18.00% 12.00% 6.00% 0.00% Marital and Spouse Assumptions FUTURE RETIREES 100% of future retired members are assumed to be married to a spouse of the opposite gender. Husbands are assumed to be three years older than their wives. CURRENT RETIREES Actual spouse age is used where available. If relevant spouse information is not available, husbands are assumed to be three years older than their wives. Funding Policy Our understanding is that the System has not adopted a formal funding policy for the Plan, and has not made any changes to the Plan’s funding policy since the prior valuation. Thus, ADC rates as of the valuation date were developed based on the contribution allocation procedure described in GASB Statement Nos. 43 and 45, as approved by the System during prior periods. Valuation Date June 30, 2018 Benefits Not Valued Dental, vision, and hearing benefits for retirees and their dependents are paid by the retiree on a full cost basis, and without an implicit subsidy. As a result, no dental, vision, or hearing benefit liabilities are included in the Plan’s valuation results as of June 30, 2018.

Connecticut State Teachers’ Retirement System
Cavanaugh Macdonald Consulting, LLC Page 32
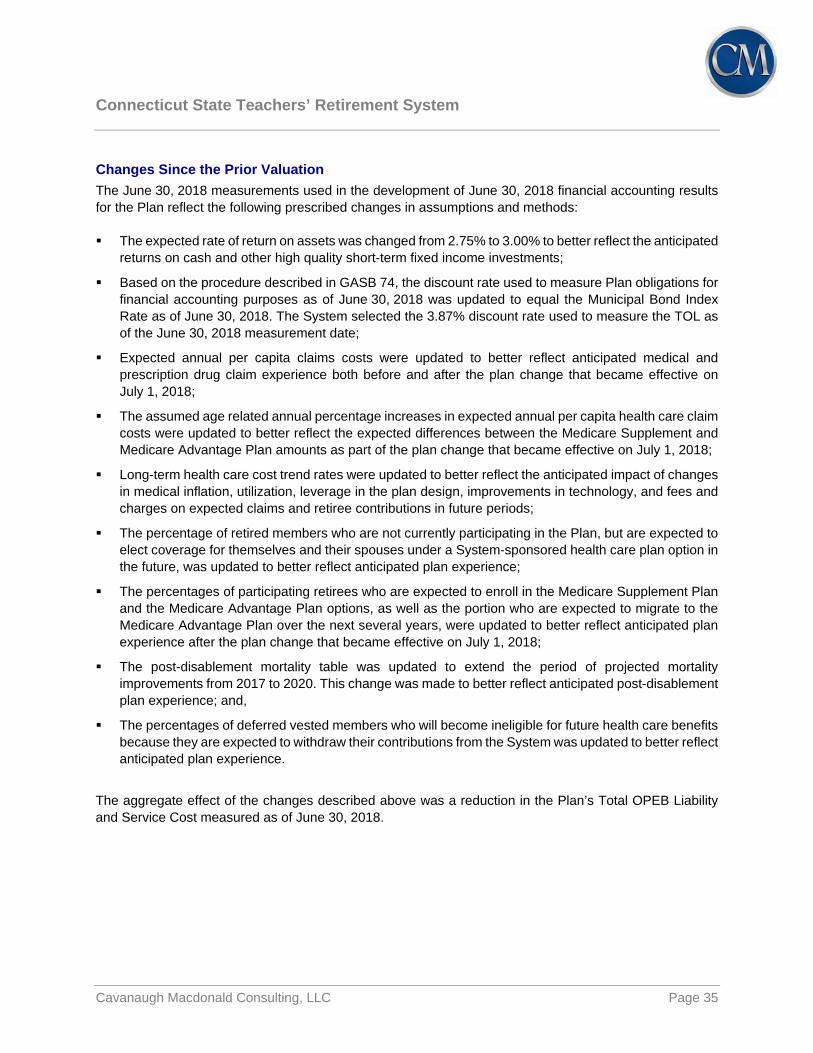
Changes Since the Prior Valuation The June 30, 2018 measurements used in the development of actuarially determined contribution rates reflect the following non-prescribed changes in assumptions and methods: The expected rate of return on assets was changed from 4.25% to 3.00% to better reflect the anticipated
returns on cash and other high quality short-term fixed income investments;
The discount rate used to measure Plan obligations and amortize supplemental costs was updated to match the expected rate of return on assets selected as of June 30, 2018;
Expected annual per capita claims costs were updated to better reflect anticipated medical and prescription drug claim experience both before and after the plan change that became effective on July 1, 2018;
The assumed age related annual percentage increases in expected annual per capita health care claim costs were updated to better reflect the expected differences between the Medicare Supplement and Medicare Advantage Plan amounts as part of the plan change that became effective on July 1, 2018;
Long-term health care cost trend rates were updated to better reflect the anticipated impact of changes in medical inflation, utilization, leverage in the plan design, improvements in technology, and fees and charges on expected claims and retiree contributions in future periods;
The percentage of retired members who are not currently participating in the Plan, but are expected to elect coverage for themselves and their spouses under a System-sponsored health care plan option in the future, was updated to better reflect anticipated plan experience;
The percentages of participating retirees who are expected to enroll in the Medicare Supplement Plan and the Medicare Advantage Plan options, as well as the portion who are expected to migrate to the Medicare Advantage Plan over the next several years, were updated to better reflect anticipated plan experience after the plan change that became effective on July 1, 2018;
The post-disablement mortality table was updated to extend the period of projected mortality improvements from 2017 to 2020. This change was made to better reflect anticipated post-disablement plan experience; and,
The percentages of deferred vested members who will become ineligible for future health care benefits because they are expected to withdraw their contributions from the System was updated to better reflect anticipated plan experience.
The aggregate effect of the changes described above was a reduction in the Plan’s actuarial present value of future benefits and the normal cost rate measured as of June 30, 2018.

Connecticut State Teachers’ Retirement System
Cavanaugh Macdonald Consulting, LLC Page 33
Schedule C — Summary of Actuarial Assumptions and Methods for Plan Accounting Purposes
ECONOMIC AND OTHER ASSUMPTIONS AND METHODS
Discount Rate 3.87% per year for all periods after June 30, 2018 (adopted June 30, 2018). Municipal Bond Index Rate Basis The System selected the 20-Bond average General Obligation 20-year Municipal Bond Rate published at the end of the last week during the month of June by The Bond Buyer (www.bondbuyer.com) and prescribed it for use as the 20-year tax-exempt municipal bond (rating AA/Aa or higher) rate required under GASB rules. Expected Long-term Rate of Return on Assets 3.00% per year, net of investment expenses, for all periods after June 30, 2018 (adopted June 30, 2018). Expected Administrative Expenses Included in Service Cost None. Measurement Date June 30, 2018 Measurement Period July 1, 2017 to June 30, 2018 Actuarial Cost Method The valuation is prepared on the projected benefit basis, under which the present value, at the interest rate assumed to be earned in the future (currently 3.00%), of each member’s expected benefits at retirement is determined, based upon age, service, and gender. The calculations take into account the probability of a member’s death or termination of employment prior to receiving benefits under the Plan. The present value of the expected benefits payable on account of active members is added to the present value of the expected future payments to retired members and beneficiaries to obtain the present value of all expected benefits payable by the Plan.

Connecticut State Teachers’ Retirement System
Cavanaugh Macdonald Consulting, LLC Page 34
The actuarial cost method is a procedure for allocating the actuarial present value of postemployment benefits and expenses to time periods. The method used for the valuation is known as the Entry Age Normal (Level Percentage of Pay) actuarial cost method, and has the following characteristics:
(i) The annual normal costs for each individual active participant are sufficient to accumulate the value of the participant’s postemployment benefits at time of retirement.
(ii) Each annual normal cost is a constant percentage of the participant’s year-by-year projected covered compensation.
The Entry Age Normal (Level Percentage of Pay) actuarial cost method allocates the actuarial present value of each participant’s projected benefits on a level basis over the participant’s assumed compensation rates between the entry age of the participant and the assumed ages at which the participant will leave active service. The portion of the actuarial present value allocated to the valuation year is called the service cost (SC). The portion of the actuarial present value of expected benefits not provided for by the actuarial present value of future service costs is called the Total OPEB Liability (TOL). The difference between the TOL and the Actuarial Asset Value is the Net OPEB Liability / (Asset) (NOL). The actuarial cost method is prescribed by GASB 74 and 75 for financial accounting purposes. Asset Valuation Method The Actuarial Asset Value for financial accounting purposes is equal to the market value of plan assets. The asset valuation method is prescribed by GASB 74 and 75 for financial accounting purposes. Benefits Not Valued Dental, vision, and hearing benefits for retirees and their dependents are paid by the retiree on a full cost basis, and without an implicit subsidy. As a result, no dental, vision, or hearing benefit liabilities are included in the Plan’s GASB 74 results as of June 30, 2018. Other Assumptions and Methods Unless otherwise stated above, all other actuarial assumptions and methods are the same as those used for the purpose of determining periodic funding contributions as of June 30, 2018. Please see the June 30, 2017 GASB 74 report for additional information about the data, assumptions, methods, and plan provisions used to prepare financial accounting results as of the June 30, 2017 measurement date.
Connecticut State Teachers’ Retirement System
Cavanaugh Macdonald Consulting, LLC Page 35
Changes Since the Prior Valuation The June 30, 2018 measurements used in the development of June 30, 2018 financial accounting results for the Plan reflect the following prescribed changes in assumptions and methods: The expected rate of return on assets was changed from 2.75% to 3.00% to better reflect the anticipated
returns on cash and other high quality short-term fixed income investments;
Based on the procedure described in GASB 74, the discount rate used to measure Plan obligations for financial accounting purposes as of June 30, 2018 was updated to equal the Municipal Bond Index Rate as of June 30, 2018. The System selected the 3.87% discount rate used to measure the TOL as of the June 30, 2018 measurement date;
Expected annual per capita claims costs were updated to better reflect anticipated medical and prescription drug claim experience both before and after the plan change that became effective on July 1, 2018;
The assumed age related annual percentage increases in expected annual per capita health care claim costs were updated to better reflect the expected differences between the Medicare Supplement and Medicare Advantage Plan amounts as part of the plan change that became effective on July 1, 2018;
Long-term health care cost trend rates were updated to better reflect the anticipated impact of changes in medical inflation, utilization, leverage in the plan design, improvements in technology, and fees and charges on expected claims and retiree contributions in future periods;
The percentage of retired members who are not currently participating in the Plan, but are expected to elect coverage for themselves and their spouses under a System-sponsored health care plan option in the future, was updated to better reflect anticipated plan experience;
The percentages of participating retirees who are expected to enroll in the Medicare Supplement Plan and the Medicare Advantage Plan options, as well as the portion who are expected to migrate to the Medicare Advantage Plan over the next several years, were updated to better reflect anticipated plan experience after the plan change that became effective on July 1, 2018;
The post-disablement mortality table was updated to extend the period of projected mortality improvements from 2017 to 2020. This change was made to better reflect anticipated post-disablement plan experience; and,
The percentages of deferred vested members who will become ineligible for future health care benefits because they are expected to withdraw their contributions from the System was updated to better reflect anticipated plan experience.
The aggregate effect of the changes described above was a reduction in the Plan’s Total OPEB Liability and Service Cost measured as of June 30, 2018.

Connecticut State Teachers’ Retirement System
Cavanaugh Macdonald Consulting, LLC Page 36
Schedule D — Summary of Actuarial Cost and Amortization Methods Actuarial Cost Method The valuation is prepared on the projected benefit basis, under which the present value, at the interest rate assumed to be earned in the future (currently 3.00%), of each member’s expected benefits at retirement is determined, based upon age, service, and gender. The calculations take into account the probability of a member’s death or termination of employment prior to receiving benefits under the Plan. The present value of the expected benefits payable on account of active members is added to the present value of the expected future payments to retired members and beneficiaries to obtain the present value of all expected benefits payable by the Plan. The actuarial cost method is a procedure for allocating the actuarial present value of postemployment benefits and expenses to time periods. The method used for the valuation is known as the Entry Age Normal (Level Percentage of Pay) actuarial cost method, and has the following characteristics:
(i) The annual normal costs for each individual active participant are sufficient to accumulate the value of the participant’s postemployment benefits at time of retirement.
(ii) Each annual normal cost is a constant percentage of the participant’s year-by-year projected covered compensation.
The Entry Age Normal (Level Percentage of Pay) actuarial cost method allocates the actuarial present value of each participant’s projected benefits on a level basis over the participant’s assumed compensation rates between the entry age of the participant and the assumed ages at which the participant will leave active service. The portion of the actuarial present value allocated to the valuation year is called the Normal Cost. The portion of the actuarial present value of expected benefits not provided for by the actuarial present value of future normal costs is called the Actuarial Accrued Liability (AAL). The excess of the AAL over the Actuarial Value of Assets is the Unfunded Actuarial Accrued Liability / (Surplus) (“UAAL”). Asset Valuation Method The Actuarial Value of Assets for this purpose is equal to the market value of plan assets. GASB 45 Amortization of the Unfunded Actuarial Accrued Liability The Plan’s actuarially determined contribution includes a “supplemental cost”. The supplemental cost is an amount that will amortize the UAAL based on the amortization method and period selected for valuation purposes as of the valuation date. The System selected the level percentage of payroll amortization method and maximum allowable 30 year amortization period for GASB 43 / 45 purposes during a previous fiscal year.

Connecticut State Teachers’ Retirement System
Cavanaugh Macdonald Consulting, LLC Page 37
Other Actuarial Cost and Amortization Methods Unless otherwise stated above, all other actuarial cost and amortization methods used for the purpose of determining periodic funding contributions are the same as those described in the June 30, 2016 actuarial valuation report for the Plan. Changes in Actuarial Cost and Amortization Methods Since the Previous Valuation There were no changes in actuarial cost or amortization methods since the previous valuation on June 30, 2016.

Connecticut State Teachers’ Retirement System
Cavanaugh Macdonald Consulting, LLC Page 38
Schedule E — Summary of Main Plan Provisions for Valuation Purposes This summary of main plan provisions is intended to describe only the principal features of the Retiree Health Insurance Plan (RHIP, or the Plan), cost-sharing, other than insured, defined benefit OPEB plan with a special funding situation sponsored by the Connecticut State Teachers' Retirement System (the System) as interpreted for valuation purposes. All actual eligibility requirements and benefit amounts will be determined in accordance with the Plan document and any System practices, processes, and procedures. Key Plan Terms COVERED EMPLOYEES Any teacher, principal, superintendent or supervisor engaged in service of public schools, plus professional employees at State schools of higher education if they choose to be covered. CREDITED SERVICE One month for each month of service as a teacher in Connecticut public schools, maximum 10 months for each school year. Ten months of credited service constitutes one year of Credited Service. Certain other types of teaching service, State employment, or wartime military service may be purchased prior to retirement, if the Member pays one-half the cost. NORMAL RETIREMENT Eligibility—Age 60 with 20 years of Credited Service in Connecticut, or 35 years of Credited Service including at least 25 years of service in Connecticut. EARLY RETIREMENT Eligibility—25 years of Credited Service including 20 years of Connecticut service, or age 55 with 20 years of Credited Service including 15 years of Connecticut service. PRORATABLE RETIREMENT Eligibility—Age 60 with 10 years of Credited Service. DISABILITY RETIREMENT Eligibility—5 years of Credited Service in Connecticut if not incurred in the performance of duty and no service requirement if incurred in the performance of duty. TERMINATION OF EMPLOYMENT Eligibility—10 or more years of Credited Service. Teachers’ Required Contribution 1.25% of annual salaries in excess of $500,000 is contributed for health insurance of retired teachers. State Contribution The State pays for one third of the costs through an annual appropriation in the General Fund. Administrative costs of the Plan are financed by the State. Based upon Chapter 167a, Subsection D of Section 10-183t of the Connecticut statutes, it is assumed the State will pay for any long-term shortfall arising from insufficient active member contributions.

Connecticut State Teachers’ Retirement System
Cavanaugh Macdonald Consulting, LLC Page 39
Retiree Health Care Coverage Any member who is currently receiving a retirement or disability benefit is eligible to participate in the Plan. There are two types of the health care benefits offered through the system. Subsidized Local School District Coverage provides a subsidy paid to members still receiving coverage through their former employer and the CTRB Sponsored Medical Plans provide coverage for those participating in Medicare, but not receiving Subsidized Local School District Coverage. Any member who is not currently participating in Medicare Parts A & B is eligible to continue health care coverage with their former employer. A subsidy of up to $110 per month for a retired member plus an additional $110 per month for a spouse enrolled in a local school district plan is provided to the school district to first offset the retiree’s share of the cost of coverage, any remaining portion is used to offset the district’s cost. The subsidy amount is set by statute, and has not increased since July of 1996. A subsidy amount of $220 per month may be paid for a retired member, spouse or the surviving spouse of a member who has attained the normal retirement age to participate in Medicare, is not eligible for Part A of Medicare without cost, and contributes at least $220 per month towards coverage under a local school district plan. Any member that is currently participating in Medicare Parts A & B is eligible to either continue health care coverage with their former employer, if offered, or enroll in the plan sponsored by the System. If they elect to remain in the plan with their former employer, the same subsidies as above will be paid to offset the cost of coverage. If a member participating in Medicare Parts A & B so elects, they may enroll in one of the CTRB Sponsored Medicare Supplement Plan(s). Effective July 1, 2018, the System added a Medicare Advantage Plan option. Active members, retirees, and the State pay equally toward the cost of the basic coverage (medical and prescription drug benefits) under the Medicare Advantage plan. Retired members who choose to enroll in the Medicare Supplement Plan are responsible for the full difference in the premium cost between the two plans. Additionally, effective July 1, 2018, retired members who cancel their health care coverage(s) or elect not enroll in a CTRB sponsored health care coverage option must wait two years to re-enroll. Survivor Health Care Coverage Survivors of former employees or retirees remain eligible to participate in the Plan and continue to be eligible to receive either the $110 monthly subsidy or participate in the CTRB Sponsored Medicare Supplement or Medicare Advantage Plan options, as long as they do not remarry. System Determined Monthly Retiree Contributions Since 2013 Eligible retirees who elect to enroll in a health care coverage option under the Plan contribute a monthly amount based on the coverages that they selected during the enrollment process. Effective January 1, 2015, new enrollees will only be able to elect the “all coverages” package (Medical with Prescription Drugs, Dental, Vision and Hearing). Existing retired members and dependents were grandfathered into the health care option elections that they had made prior to January 1, 2015.

Connecticut State Teachers’ Retirement System
Cavanaugh Macdonald Consulting, LLC Page 40
The following tables provide the monthly health care contributions for retiree and dependent coverage options during the periods beginning on January 1, 2013 and ending on July 1, 2018.
Monthly Funding Rates for the CTRB Sponsored Medicare Supplemental Plan Options
Coverage 2013 2014 2015 2016 2017 Jan. 1 2018
July 1 2018
Medical with Prescriptions $117 $97 $91 $95 $92 $101 $199
Medical with Prescriptions and Dental $160 $141 $136 $143 $136 $151 $254
Medical with Prescriptions, Dental, Vision & Hearing $165 $146 $140 $148 $141 $156 $259
Monthly Funding Rates for the CTRB Sponsored Medicare Advantage Plan Options
Coverage 2013 2014 2015 2016 2017 Jan. 1 2018
July 1 2018
Medical with Prescriptions N/A N/A N/A N/A N/A N/A $74
Medical with Prescriptions and Dental N/A N/A N/A N/A N/A N/A $129
Medical with Prescriptions, Dental, Vision & Hearing N/A N/A N/A N/A N/A N/A $134
Changes in Plan Provisions Since the Previous Valuation The Plan was amended by the Board, effective July 1, 2018, during the January 11, 2018 meeting. The Board action added the Anthem Medicare Advantage Plan to the available options under the Plan, changed the “base plan” to the Medicare Advantage Plan for the purposes of determining retiree health care plan subsidies and/or cost sharing amount(s), and introduced a two year waiting period for re-enrollment in a System-sponsored health care plan for those who cancel their coverage or choose not to enroll in a health care coverage option on or after the effective date. These changes were communicated to retired members during the months leading up to a special open enrollment period that preceded the July 1, 2018 implementation date. We have reflected these changes in the Plan’s liabilities and the development of the actuarially determined contribution rate as of June 30, 2018, and in the measurement of the Plan’s benefit obligations for Plan accounting purposes as of June 30, 2018.