2018/19 TREASURY MANAGEMENT STRATEGY STATEMENT (TMSS...
22
EXE 15 01 18 2018/19 TREASURY MANAGEMENT STRATEGY STATEMENT (TMSS), MINIMUM REVENUE PROVISION POLICY STATEMENT AND ANNUAL INVESTMENT STRATEGY EXECUTIVE MEMBER: Mike Starkie, Elected Mayor LEAD OFFICER: Fiona Rooney, Director of Commercial & Corporate Resources (& Section 151 Officer) REPORT AUTHOR: Tony Furber, Strategic Accountant WHAT BENEFITS WILL THESE PROPOSALS BRING TO COPELAND RESIDENTS? The Council has a legislative duty to manage its resources effectively and deliver statutory services for the benefit of the Borough. Treasury Management is an important part of this function and is regulated by an approved Treasury Management Strategy Statement (this document) written in accordance with the Chartered Institute of Public Finanace Accounting (CIPFA) Code of Practice on Treasury Management and forms part of the budget and policy framework. WHY HAS THIS REPORT COME TO EXECUTIVE? T report forms part of the suite of reports that make up the Elected Mayor’s Draft proposals. The report is due to be reviewed by the Audit and Governance Committee on 24 January 2018. Any feedback and/or recommendations will be reported to Executive at its meeting on 30 January 2018. 1. INTRODUCTION 1.1 This report sets out the Council’s Draft Treasury Management Strategy Statement for 2018/19, in accordance with the CIPFA Code of Practice on Treasury Management. The Annual Investment Strategy and the Minimum Revenue Provision (MRP) Strategy for 2018/19 are also incorporated as part of the Statement. So too are the Prudential Indicators as required within the Prudential Code for Capital Finance in Local Authorities. 1.2 The Council will receive each year the following reports: Annual strategy and plan in advance of the year (this report), a mid-year review and an annual report after its close. It will also receive, as a minimum, a half year update. Adequate scrutiny is required of all the above reports prior to recommendation to Council. RECOMMENDATION: The Executive is recommend to agree the 2018/19 Draft Treasury Management Strategy Statement, Minimium Revenue Provision Policy Statement and Annual Investment Strategy,having due regard to the strengthened emphasis on investments for periods of greater than one year, which is set out in Section 4.1 of the Draft Treasury Management Strategy Statement (Appendix 1 refers).
Transcript of 2018/19 TREASURY MANAGEMENT STRATEGY STATEMENT (TMSS...

EXE 15 01 18
2018/19 TREASURY MANAGEMENT STRATEGY STATEMENT (TMSS), MINIMUM REVENUE PROVISION POLICY STATEMENT AND ANNUAL INVESTMENT STRATEGY
EXECUTIVE MEMBER: Mike Starkie, Elected MayorLEAD OFFICER: Fiona Rooney, Director of Commercial & Corporate Resources (&
Section 151 Officer)REPORT AUTHOR: Tony Furber, Strategic Accountant
WHAT BENEFITS WILL THESE PROPOSALS BRING TO COPELAND RESIDENTS?
The Council has a legislative duty to manage its resources effectively and deliver statutory services for the benefit of the Borough. Treasury Management is an important part of this function and is regulated by an approved Treasury Management Strategy Statement (this document) written in accordance with the Chartered Institute of Public Finanace Accounting (CIPFA) Code of Practice on Treasury Management and forms part of the budget and policy framework.
WHY HAS THIS REPORT COME TO EXECUTIVE?
T report forms part of the suite of reports that make up the Elected Mayor’s Draft proposals. The report is due to be reviewed by the Audit and Governance Committee on 24 January 2018. Any feedback and/or recommendations will be reported to Executive at its meeting on 30 January 2018.
1. INTRODUCTION
1.1 This report sets out the Council’s Draft Treasury Management Strategy Statement for 2018/19, in accordance with the CIPFA Code of Practice on Treasury Management. The Annual Investment Strategy and the Minimum Revenue Provision (MRP) Strategy for 2018/19 are also incorporated as part of the Statement. So too are the Prudential Indicators as required within the Prudential Code for Capital Finance in Local Authorities.
1.2 The Council will receive each year the following reports: Annual strategy and plan in advance of the year (this report), a mid-year review and an annual report after its close. It will also receive, as a minimum, a half year update. Adequate scrutiny is required of all the above reports prior to recommendation to Council.
RECOMMENDATION:
The Executive is recommend to agree the 2018/19 Draft Treasury Management Strategy Statement, Minimium Revenue Provision Policy Statement and Annual Investment Strategy,having due regard to the strengthened emphasis on investments for periods of greater than one year, which is set out in Section 4.1 of the Draft Treasury Management Strategy Statement (Appendix 1 refers).

2. TREASURY MANAGEMENT STRATEGY STATEMENT
2.1 As required under the Code, the Treasury Management Strategy Statement for 2018/19, which also incorporates both the Investment Strategy for that year and the Minimum Revenue Provision Policy Statement, is set out in Appendix 1. Within this Appendix are the Prudential Indicators that must be determined under the requirements of the CIPFA Prudential Code for Capital Finance in Local Authorities.
2.2 The Treasury Management Strategy Statement itself has the following Appendices:
Appendix 1A - Shows the approved Countries that the Council can place investments with (currently restricted to those only within the UK)
Appendix 1B – the scheme of delegation detailing which Committees are responsible for certain aspects of Treasury Management
Appendix 1C – The role of the S151 Officer.
3. CONCLUSIONS
3.1 The Treasury Management Strategy Statement for 2018/19, which incorporates the Annual Investment Strategy and the Minimum Revenue Provision Policy Statement will be scrutinised by Audit and Governance Committee on 24 January 2018 and presented at Executive on 8 February 2018 before being presented to Council on 20 February 2018 for approval.
4. STATUTORY OFFICER COMMENTS
4.1 The Monitoring Officer’s comments are: No legal issues arise from the report.
4.2 The Section 151 Officer’s comments are: The financial implications are included in the report and supporting Appendix.
4.3 EIA comments: None
4.4 Policy Framework: Within Policy Framework
4.5 Other Consultee Comments, if any:
5. HOW WILL THE PROPOSALS BE PROJECT MANAGED AND HOW ARE THE RISKS GOING TO BE MANAGED?
5.1 The Treasury Management function is monitoried quarterly in addition to the annual, mid-year and outturn reports required by the Chartered Institute of Public Finance Accounting (CIPFA) Code of Practice. These additonal reports are presented at Executive detailing the quarterly position on the Council’s investments to ensure they are in accordance with the limits detailed within this report.

6. WHAT MEASURABLE OUTCOMES OR OUTPUTS WILL ARISE FROM THIS REPORT?
6.1 To ensure the Council’s investments are in line with the appropriate policies including the Treasury Management Strategy Statement.
List of Appendices:
Appendix 1 – Treasury Management Strategy Statement, Minimum Revenue Provision Policy Statement and Annual Investment Strategy 2018/19
Contained within the TMSS at Appendix A are the following Appendices:Appendix A – Approved Countries for Investment Appendix B – Treasury Management Scheme of DelegationAppendix C – The Treasury Management Role of the s151 Officer

Appendix 1
COPELAND BOROUGH COUNCIL
TREASURY MANAGEMENT STRATEGY STATEMENT (TMSS),
MINIMUM REVENUE PROVISION POLICY STATEMENT AND
ANNUAL INVESTMENT STRATEGY 2018/19

1. INTRODUCTION
1.1 Background
The Council is required to operate a balanced budget, which broadly means that cash raised during the year will meet cash expenditure. Part of the treasury management operation is to ensure that this cash flow is adequately planned, with cash being available when it is needed. Surplus monies are invested in low risk counterparties or instruments commensurate with the Council’s low risk appetite, providing adequate liquidity initially before considering investment return.
The second main function of the treasury management service is the funding of the Council’s capital plans. These capital plans provide a guide to any borrowing need of the Council, essentially the longer term cash flow planning to ensure that the Council can meet its capital spending obligations. This management of longer term cash could involve arranging long or short term loans, or using longer term cash flow surpluses. On occasion any debt previously drawn may be restructured to meet Council risk or cost objectives.
1.2 Copeland’s Portfolio and Investment Strategy
Copeland Borough Council currently holds an average investment portfolio of approximately £35 million. The majority of this money is held in a combination of provisions and revenue and capital reserves and is earmarked for various purposes. However, the range of funds can be much higher at the start of the financial year depending on cash flow movements and the receipt of an advance payment of a full year business rates by the Council’s largest ratepayer (approximately £30 million). Most of this large cash balance at the start of the year does not belong to the Council. It is invested in a range of maturities to facilitate the requirement to pay over regular amounts of the advance funding to the Government and County Council in accordance with the agreed schedule of payments.
The main principle governing the Council’s investment criteria is the security and liquidity of its investments, with yield (or return) then being considered. The Council’s counterparty list is derived from the minimum credit ratings set in conjunction with our Treasury Management Advisors, Link Asset Services. This list limits the Council to use the counterparties for investment that are at or above the minimum criteria approved. Should the criteria be set too low then the Council would be open to risk; if set too high it could make it difficult to place funds. The TMSS sets out the overall policy parameters, with officers using their judgement within the parameters set as required.
Wherever possible, and within the security limits, the Council maximises interest by fixed term investments with the banks for up to a year and up to the maximum limits set out in the strategy. As noted above, at peak cash inflow times the Council has c. £55 million to invest. The Council aims for diversification through the use of other counterparties who meet our minimum criteria and through the use of pooled investment vehicles, Money Market Funds (see paragraph 4.1). These are highly secure, liquid institutions with the yield being generally lower because of the flexibility of instant access to funds. This, in turn reduces the average investment interest rate achieved compared to longer term fixed rate deposits. The objective continues to be that we achieve a rate above the 7 Day LIBID (London Interbank Bid Rate – the rate at which banks bid to borrow) as a benchmark.
Members should note that the limits that are presented throughout this report have been discussed with the Council’s treasury management advisors and are deemed acceptable for the current risk appetite.

1.3 Treasury Management
The Chartered Institute of Public Finance and Accountancy (CIPFA) produces the Code of Practice on Treasury Management activities and defines treasury management as:
The management of the organisation’s borrowing, investments and cash flows, its banking, money market and capital market transactions; the effective control of the risks associated with those activities; and the pursuit of optimum performance consistent with those risks.
1.4 Reporting requirements
The Council is required to receive and approve, as a minimum, three main reports each year, which incorporate a variety of policies, estimates and actuals.
Prudential and treasury indicators and treasury strategy (this report) - The first, and most important report covers:
the capital plans (including prudential indicators); a minimum revenue provision (MRP) policy (how residual capital expenditure is charged to
revenue over time); the treasury management strategy (how the investments and borrowings are to be organised)
including treasury indicators; and an investment strategy (the parameters within which investments are to be managed).
A mid year treasury management report – This annual report was presented to Executive on 12 December 2017 updating Members with the capital position, amending prudential indicators as necessary and considering whether any policies required revision. In addition, the Executive will receive quarterly update reports.
An annual treasury report – This report (also known as the Treasury Management Outturn Report) provides details of a selection of actual prudential and treasury indicators and actual treasury operations compared to the estimates within the strategy.
ScrutinyThe above reports are required to be adequately scrutinised before being recommended to the Council. This role is undertaken by the Audit and Governance Committee.
1.5 Treasury Management Strategy for 2018/19
The strategy for 2018/19 covers two main areas:
Capital issues the capital plans and the prudential indicators; the minimum revenue provision (MRP) policy.

Treasury management issues the current treasury position; treasury indicators which limit the treasury risk and activities of the Council; prospects for interest rates; the borrowing strategy; policy on borrowing in advance of need; debt rescheduling; the investment strategy; creditworthiness policy; and policy on use of external service providers.
These elements cover the requirements of the Local Government Act 2003, the CIPFA Prudential Code, DCLG MRP Guidance, the CIPFA Treasury Management Code and DCLG Investment Guidance.
1.6 Training
The CIPFA Code requires the responsible officer (the S151 Officer) to ensure that Members with responsibility for treasury management receive adequate training. This especially applies to Members responsibe for scrutiny. Treasury Management training was provided prior to the Audit and Governance Committee meeting on 26 January 2017 and further training is planned for the final quarter of 2017-18.
The training needs of treasury management officers are reviewed periodically.
1.7 Treasury management consultants
The Council uses its external treasury management advisors but recognises that responsibility for treasury management decisions remains with the organisation at all times and will ensure that undue reliance is not placed on the external service providers.
The Council also recognises that there is value in employing external providers of treasury management services in order to acquire access to specialist skills and resources. The Council will ensure that the terms of their appointment and the methods by which their value will be assessed are properly agreed and documented, and subjected to regular review.
2. THE CAPITAL PRUDENTIAL INDICATORS 2017/18 – 2019/20
The Council’s capital expenditure plans are the key driver of treasury management activity. The output of the capital expenditure plans are reflected in the prudential indicators, which are designed to assist member’s overview and confirm capital expenditure plans.
2.1 Capital expenditure
This prudential indicator is a summary of the Council’s draft capital expenditure plans, both those agreed previously, and those forming part of this budget cycle. Members are asked to approve the capital expenditure forecasts, the full details of which are elsewhere on the agenda for consideration. The following table summarises the above capital expenditure plans and how these plans are being financed by capital or revenue resources. Members should note that any net financing need requires the identification of additional resources including borrowing (as shown in 2018/19).

Table 1:Capital expenditure 2016/17 2017/18 2018/19 2019/20 2020/21£000’s Actual Estimate Estimate Estimate EstimateTotal 1,940 1,961 4,971 1,400 850Financed by:Capital receipts 0 749 2,381 800 250Capital grants 1,940 1,149 1,098 600 600Revenue 0 63 512 0 0Other 0 0 0 0 0Net financing need for the year 0 0 980 0 0
The above financing need excludes other long term liabilities, such as Public Finance Initiative (PFI) and leasing arrangements which already include borrowing instruments.
2.2 The Council’s borrowing need (the Capital Financing Requirement - CFR)
The second prudential indicator is the Council’s Capital Financing Requirement (CFR). The CFR is simply the total historic outstanding capital expenditure which has not yet been paid for from either revenue or capital resources. It is essentially a measure of the Council’s underlying borrowing need. Any capital expenditure which has not immediately been paid for will increase the CFR and the annual Minimum Revenue Provision (see 2.3 below) will reduce it. Over recent years, the Council has financed all its capital expenditure immediately through capital receipts, capital grants or revenue and, as a result, the CFR has been decreasing. There will be an increase in 2018/19, with £980k of expenditure planned to be met from internal borrowing. The pattern of steady decrease will resume from 2019/20 onwards.
In any event, the CFR does not increase indefinitely as it is required to be paid off over time from revenue. The charge is called the minimum revenue provision (MRP) and is a statutory annual revenue charge which reduces the borrowing need broadly in line with each asset’s life.
The CFR includes any other long term liabilities (e.g. PFI schemes, finance leases). The main element of the Council’s CFR is the PFI scheme. Whilst these increase the CFR, and therefore the Council’s borrowing requirement, these types of scheme include a borrowing facility and so the Council is not required to borrow separately.
The Council is asked to approve the following CFR projections:
Table 2:

2016/17 2017/18 2018/19 2019/20 2020/21Actual Estimate Estimate Estimate Estimate
Capital Financing RequirementTotal CFR 6,997 6,997 6,641 7,269 6,973Movement in CFR 0 (356) 628 (296) (317)
Movement in CFR represented byNet financing need for the year (above)
0 0 980 0 0
Less MRP and other financing movements
0 (356) (352) (296) (317)
Movement in CFR 0 (356) 628 (296) (317)
£000’s
2.3 Minimum Revenue Provision (MRP) policy statement
The Council is able to increase the rate it reduces its CFR by making a voluntary charge to revenue in addition to the Minimum Revenue Provision (MRP). This is not currently the Council’s policy.
The Council must approve a prudent MRP, although there are a variety of options as to how the amount is calculated. Government regulations require the Council to approve an MRP Statement, describing which option is to be followed, in advance of each year. The following MRP Statement is recommended:
For capital expenditure incurred before 1 April 2008 or which in the future will be Supported Capital Expenditure, the MRP policy will be:
Existing practice - MRP will follow the existing practice outlined in former Government regulations (option 1);
This option provides for an approximate 4% reduction in the borrowing need (CFR) each year.
From 1 April 2008 for all unsupported borrowing (including PFI and finance leases) the MRP policy will be:
Asset life method – MRP will be based on the estimated life of the assets, in accordance with the regulations (this option must be applied for any expenditure capitalised under a Capitalisation Direction) (option 3)
This option provides for a reduction in the borrowing need over the asset’s estimated life.
Repayments of PFI or Finance Leases are allowable to use as a proxy for the above methods. The reduction in the CFR in 2.2 above is as a result of the PFI and finance lease MRP.
2.4 Affordability prudential indicators
The previous paragraphs and Section 3 cover the overall capital and control of borrowing prudential indicators, but within the prudential framework the Council is also required assess the affordability of capital investment plans. This provides an indication of the impact of the capital investment plans on the Council’s overall finances. The Council is asked to approve the following indicators in respect of the actual and estimated ratio of financing costs to its net revenue stream.

2.5 Ratio of financing costs to net revenue stream
This indicator identifies the trend in the cost of capital (borrowing and other long term obligation costs net of investment income) against the net revenue stream.
Table 3:
2016/17 2017/18 2018/19 2019/20 2020/21Estimate Estimate Estimate Estimate Estimate
Ratio 7.14 6.97 5.63 5.63 5.32
%
The estimates of financing costs include current commitments and the proposals in the most current budget report.
2.6 Incremental impact of capital investment decisions on the Band D Council Tax
In the revised Prudential Code (December 2017), a formal indicator showing the incremental impact of capital investment decisions on the Band D Council Tax is no longer specified. However, there is still a requirement for the Council to ensure that the revenue implications of capital ependiture, including financing costs, are properly taken into account within option appraisal processes, the Capital Programme and the Medium Term Financial Strategy. This shall include consideration of the Council Tax implications of its Capital Programme and councils are recommended to produce local indicators which best reflect this, based on their own spending plans and financing profiles.
The revenue implications of the Council’s proposed Capital Programme for 2018-19 to 2020-21 are limited to the amount of interest foregone, when balances held in respect of capital receipts, reserves and monies applied in internal borrowing are no longer available. The effect of this on net revenue expenditure and what this is equal to in terms of an impact on Band D Council Tax is shown in the following indicator.
Table 4: Incremental impact of capital investment decisions on the band D council tax
2018/19 2019/20 2020/21Estimate Estimate Estimate
Council tax - band D 1.18 0.34 0.14
£
3. BORROWING
The capital expenditure plans set out in Section 2 provide details of the service activity of the Council. The treasury management function ensures that the Council’s cash is organised in accordance with the the relevant professional codes, so that sufficient cash is available to meet this service activity. This will involve both the organisation of the cash flow and, where capital plans require, the organisation of approporiate borrowing facilities. The strategy covers the relevant treasury / prudential indicators, the current and projected debt positions and the annual investment strategy.
3.1 Current portfolio position

The Council’s debt portfolio contains one remaining Market Loan of £5 million which will mature on 1st February 2042. The rate is fixed at 7.55% with interest payments of £377,500 a year. The status of this loan is continually assessed to determine whether better terms can be obtained. Currently, it is better to leave the loan in its present form, as the penalty for repaying early would be prohibitive. This was estimated at £4.8m (on top of the £5m debt repayment) at the end of March 2017. The costs of redemption therefore outweigh any benefit and this will remain the case for as long as base rates remain significantly below the rate payable on the loan.
In the event of a need to borrow further, the Section 151 Officer has delegated power, under Section D of Part 2 of the Scheme of Delegation, to undertake the most appropriate form of borrowing depending on prevailing interest rates. Such a decision would be reported to the appropriate decision making body at the soonest opportunity.
The Council’s treasury portfolio position at 31 March 2016 (detailed above) is summarised below with forward projections. The table shows the actual external debt (the treasury management operations), against the underlying capital borrowing need (the CFR), indicating an over-borrowed position.
Table 5:
2016/17 2017/18 2018/19 2019/20 2020/21Actual Estimate Estimate Estimate Estimate
Debt at 1 April 5,000 5,000 5,000 5,000 5,000Expected change in Debt 0 0 0 0 0Other long-term liabilities (OLTL) 5,424 5,068 4,716 4,420 4,103Expected change in OLTL 0 -356 -352 -296 -317Actual gross debt at 31 March 10,424 9,712 9,364 9,124 8,786The Capital Financing Requirement
6,997 6,641 7,269 6,973 6,656
(Under) /over borrowing 3,427 3,071 2,095 2,151 2,130
£000’s
External Debt
Within the prudential system there are a number of key indicators to ensure that the Council operates its activities within well-defined limits. One of these is that the Council needs to ensure that its gross debt does not, except in the short term, exceed the total of the CFR in the preceding year plus the estimates of any additional CFR for 2018/19 and the following two financial years. This allows some flexibility for limited early borrowing for future years, but ensures that borrowing is not undertaken for revenue purposes.
The Council’s current indebtedness covers both the PFI and external debt, which exceeds the CFR. Essentially, this results from the Council’s Large Scale Voluntary Transfer of the housing stock. As the Council cannot currently repay the £5 million loan economically, this is allowed, as an exception, by the prudential indicator above and will be corrected at the earliest practicable time.
3.2 Treasury Indicators: limits to borrowing activity
The operational boundary. This is the limit which external debt is not normally expected to exceed. In most cases, this would be a similar figure to the CFR (capital financing requirement), but may be lower or higher depending on the levels of actual debt. It is to be used solely as a guideline figure.
Table 6:

2016/17 2017/18 2018/19 2019/20 2020/21Actual Estimate Estimate Estimate Estimate
Debt 5,000 5,000 5,000 5,000 5,000Other long term liabilities 7,000 7,000 7,000 7,000 7,000Total 12,000 12,000 12,000 12,000 12,000
Operational boundary £000’s
The authorised limit for external debt. This represents a limit beyond which external debt is prohibited, and is set or revised by the Council. It reflects the level of external debt which, while not desirable, could be afforded in the short term but is not sustainable in the longer term. It is a statutory limit determined under section 3 (1) of the Local Government Act 2003. The Government retains an option to control either the total of all councils’ plans, or those of a specific council, although this power has not yet been exercised.
Members are asked to approve the following authorised limit (no change from current year):
Table 7:
2016/17 2017/18 2018/19 2019/20 2020/21Actual Estimate Estimate Estimate Estimate
Debt 9,000 9,000 9,000 9,000 9,000Other long term liabilities 8,000 8,000 8,000 8,000 8,000Total 17,000 17,000 17,000 17,000 17,000
Authorised limit £000’s
Treasury management limits on activity
There are three debt related treasury activity limits, the purpose of which is to restrain the activity of the treasury function within certain limits, thereby managing risk and reducing the impact of any adverse movement in interest rates. However, if the limits are too restrictive they will impair the opportunity to reduce costs and improve performance. The indicators are: Upper limits on variable and fixed interest rate exposure based on the debt position net of
investments. Upper limits on variable and fixed interest rates on investments. Maturity structure of borrowing - gross lower and upper limits to reduce the Council’s exposure to
large fixed rate sums falling due for refinancing
Members are asked to approve the following treasury indicators and limits:
Table 8:
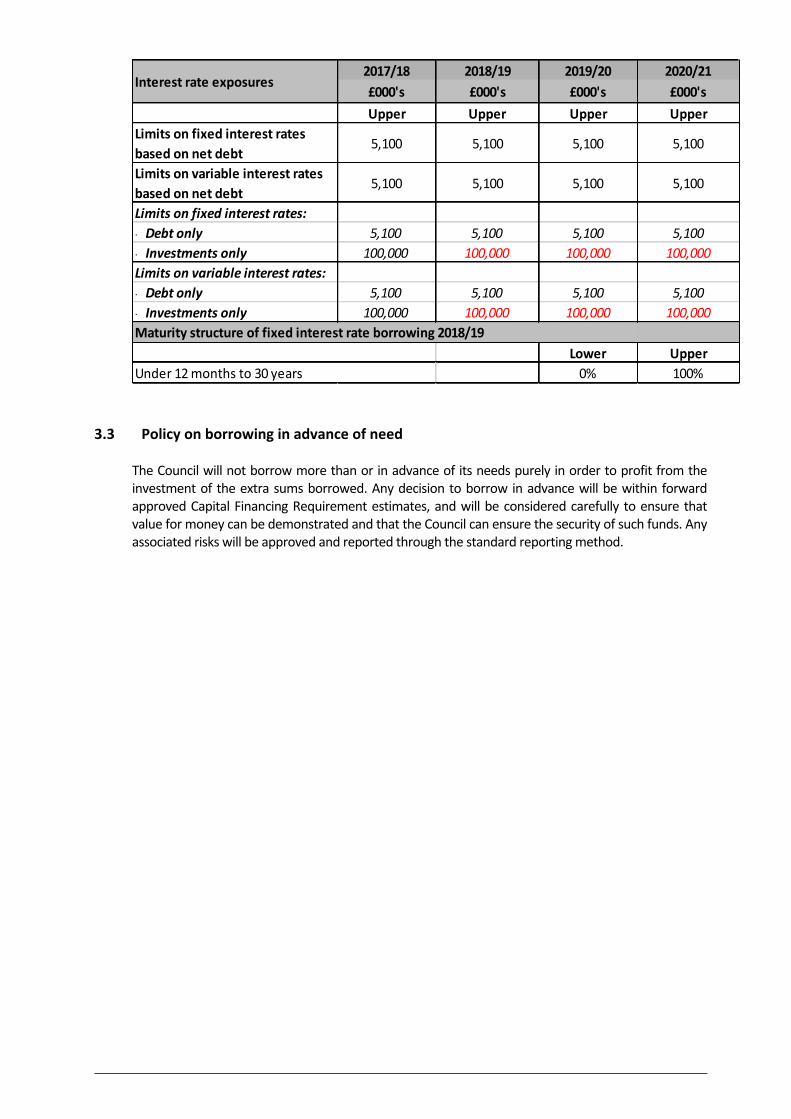
2017/18 2018/19 2019/20 2020/21£000's £000's £000's £000'sUpper Upper Upper Upper
Limits on fixed interest rates based on net debt
5,100 5,100 5,100 5,100
Limits on variable interest rates based on net debt
5,100 5,100 5,100 5,100
Limits on fixed interest rates:· Debt only 5,100 5,100 5,100 5,100· Investments only 100,000 100,000 100,000 100,000Limits on variable interest rates:· Debt only 5,100 5,100 5,100 5,100· Investments only 100,000 100,000 100,000 100,000
Lower Upper0% 100%
Interest rate exposures
Maturity structure of fixed interest rate borrowing 2018/19
Under 12 months to 30 years
3.3 Policy on borrowing in advance of need
The Council will not borrow more than or in advance of its needs purely in order to profit from the investment of the extra sums borrowed. Any decision to borrow in advance will be within forward approved Capital Financing Requirement estimates, and will be considered carefully to ensure that value for money can be demonstrated and that the Council can ensure the security of such funds. Any associated risks will be approved and reported through the standard reporting method.

3.4 Debt rescheduling
As short term borrowing rates will generally be considerably cheaper than longer term fixed interest rates, there may be potential opportunities to generate savings by switching from long term debt to short term debt. However, as stated earlier in 3.1, the current cost of repaying the £5 million debt is prohibitive.
The reasons for any rescheduling to take place would include: the generation of cash savings and / or discounted cash flow savings; helping to fulfil the treasury strategy; enhancing the balance of the portfolio (amend the maturity profile and/or the balance of
volatility).
The potential to make savings by running down investment balances to repay debt prematurely (as short term rates on investments are likely to be lower than rates paid on current debt) will also be considered.
Any rescheduling decision made by the Section 151 Officer will be reported to Members, at the earliest opportunity.
3.5 Prospects for Interest rates
Part of the service provided by the treasury advisor is to assist the Council to formulate a view on interest rates. The following table is a bank base rate forecast which drives investment returns and borrowing rate forecasts.
Table 9:
Link Asset Services Interest Rate ViewMar-18 Jun-18 Sep-18 Dec-18 Mar-19 Jun-19 Sep-19 Dec-19 Mar-20 Jun-20 Sep-20 Dec-20 Mar-21
Bank Rate 0.50% 0.50% 0.50% 0.75% 0.75% 0.75% 0.75% 1.00% 1.00% 1.00% 1.25% 1.25% 1.25%5yr PWLB rate 1.60% 1.60% 1.70% 1.80% 1.80% 1.90% 1.90% 2.00% 2.10% 2.10% 2.20% 2.30% 2.30%10yr PWLB rate 2.20% 2.30% 2.40% 2.40% 2.50% 2.60% 2.60% 2.70% 2.70% 2.80% 2.90% 2.90% 3.00%25yr PWLB rate 2.90% 3.00% 3.00% 3.10% 3.10% 3.20% 3.20% 3.30% 3.40% 3.50% 3.50% 3.60% 3.60%50yr PWLB rate 2.60% 2.70% 2.80% 2.90% 2.90% 3.00% 3.00% 3.10% 3.20% 3.30% 3.30% 3.40% 3.40%
THE UK ECONOMY
After the UK surprised on the upside with strong economic growth in 2016, growth in 2017 has been disappointingly weak; quarter 1 came in at only +0.3% (+1.8% y/y), quarter 2 was +0.3% (+1.5% y/y) and quarter 3 was +0.4% (+1.5% y/y). The main reason for this has been the sharp increase in inflation, caused by the devaluation of sterling after the EU referendum, feeding increases in the cost of imports into the economy. This has caused, in turn, a reduction in consumer disposable income and spending power and so the services sector of the economy, accounting for around 80% of GDP, has seen weak growth as consumers cut back on their expenditure. However, more recently there have been encouraging statistics from the manufacturing sector which is seeing strong growth, particularly as a result of increased demand for exports. It has helped that growth in the EU, our main trading partner, has improved significantly over the last year while robust world growth has also been supportive. However, this sector only accounts for around 10% of GDP so expansion in this sector will have a much more muted effect on the overall GDP growth figure for the UK economy as a whole.

At Its 2 November meeting, the MPC duly delivered a 0.25% increase in Bank Rate. It also gave forward guidance that they expected to increase Bank Rate only twice more in the next three years to reach 1.0% by 2020. However, some forecasters are flagging up that they expect growth to accelerate significantly towards the end of 2017 and then into 2018. This view is based primarily on the coming fall in inflation, (as the effect of the effective devaluation of sterling after the EU referendum drops out of the CPI statistics), which will bring to an end the negative impact on consumer spending power. In addition, a strong export performance will compensate for weak services sector growth. If this scenario was indeed to materialise, then the MPC would be likely to accelerate its pace of increases in Bank Rate during 2018 and onwards.
One key area of risk is that consumers may have become used to cheap rates since 2008 for borrowing, especially for mortgages. It is a major concern that some consumers may have over extended their borrowing and have become complacent about interest rates going up after Bank Rate had been unchanged at 0.50% since March 2009 until falling further to 0.25% in August 2016.
Moreover, while there is so much uncertainty around the Brexit negotiations, consumer confidence, and business confidence to spend on investing, it is far too early to be confident about how the next two to three years will actually pan out.
There is a key risk around Central Bank monetary policy measures adopted both within the UK and more widely. Looking back on nearly ten years since the financial crash of 2008 when liquidity suddenly dried up in financial markets, it can be assessed that central banks’ monetary policy measures to counter the sharp world recession were successful. The key monetary policy measures they used were a combination of lowering central interest rates and flooding financial markets with liquidity, particularly through unconventional means such as Quantitative Easing (QE), where central banks bought large amounts of central government debt and smaller sums of other debt.
The key issue now is that that period of stimulating economic recovery and warding off the threat of deflation is coming towards its close and a new period has already started in the US, and more recently, in the UK, on reversing those measures i.e. by raising central rates and (for the US) reducing central banks’ holdings of government and other debt. These measures are now required in order to stop the trend of an on-going reduction in spare capacity in the economy, and of unemployment falling to such low levels that the re-emergence of inflation is viewed as a major risk. It is, therefore, crucial that central banks get their timing right and do not cause shocks to market expectations that could destabilise financial markets. The potential for central banks to get this timing and strength of action wrong are now key risks.
There is also a potential key question over whether economic growth has become too dependent on strong central bank stimulus and whether it will maintain its momentum against a backdrop of rising interest rates and the reversal of QE. In the UK, a key vulnerability is the low level of productivity growth, which may be the main driver for increases in wages; and decreasing consumer disposable income, which is important in the context of consumer expenditure primarily underpinning UK GDP growth.
A further question that has come to the fore is whether an inflation target for central banks of 2%, is now realistic given the shift down in inflation pressures from internally generated inflation, (i.e. wage inflation feeding through into the national economy).

4 ANNUAL INVESTMENT STRATEGY
4.1 Investment policy
The Council’s investment policy has regard to the Department of Community and Local Government’s (DCLG) Guidance on Local Government Investments (“the Guidance”) and the revised Chartered Institute of Public Financing Accounting (CIPFA) Treasury Management in Public Services Code of Practice and Cross Sectoral Guidance Notes (“the CIPFA TM Code”). The Council’s investment priorities will be security first, liquidity second and then return.
In accordance with the above guidance from the DCLG and CIPFA, and in order to minimise the risk to investments, the Council has below clearly stipulated the minimum acceptable credit criteria in order to generate a list of highly creditworthy counterparties which also enables diversification and thus avoidance of concentration risk. The key ratings used to monitor counterparties are the short term and long term ratings.
Further, the Council’s officers recognise that ratings should not be the sole determinant of the quality of an institution and that it is important continually to assess and monitor the financial sector on both a micro and macro basis and in relation to the economic and political environments in which institutions operate. The assessment will also take account of information that reflects the opinion of the markets. To this end the Council will engage with its advisors to maintain a monitor on market pricing such as “credit default swaps” and overlay that information on top of the credit ratings.
Other information sources used will include the financial press, share price and other such information pertaining to the banking sector in order to establish the most robust scrutiny process on the suitability of potential investment counterparties.
In respect of the return that it derives on its investments, he Council continues to face the twin pressures of:
market rates which, although somewhat increased following the recent base rate rise, remain at what are historically very low levels, and
the need to maximise income from all sources, in order to support the Council’s budget against a continuing background of severe financial constraint, remaining as acute as ever.
Against this background, it is proposed that: The policy originally adopted in the 2017/18 Strategy whereby, where appropriate,
consideration will be given to investment opportunities which, although fully consistent with the Council’s strict creditworthiness requirements (see 4.2 below), may not be with the most highly rated institutions available under those requirements, will be continued in 2018/19.
Use will be made of opportunities to place investments for periods of more than one year, where this is consistent with forecast cash flow requirements and within the limits stated elsewhere in this document, ie such investments in total will be for a maximum of either 50% of the overall portfolio (see 4.2 below) or £20m (see Table 11), whichever is the lesser.
Any such lendings would be made under the powers delegated to the Section 151 Officer, under Section D of Part 2 of the Scheme of Delegation, to invest available funds on appropriate terms and in accordance with the Council’s investment strategy. Again security remains, and will remain, the primary principle in the consideration of investment opportunities.

Investment instruments identified for use in the financial year are either ‘Specified’ Investments (i.e. investments with maturities of up to a maximum of one year meeting the high quality criteria) or ‘Non-Specified’ investment categories (i.e. all other investments that do not meet the Specified criteria). Counterparty limits will be as set through the Council’s treasury management practices schedules.
4.2 Creditworthiness policy
The primary principle governing the Council’s investment criteria is the security of its investments, although the yield or return on the investment is also a key consideration. After this main principle, the Council will ensure that:
It maintains a policy covering both the categories of investment types it will invest in, criteria for choosing investment counterparties with adequate security, and monitoring their security. This is set out in the specified and non-specified investment sections below; and
It has sufficient liquidity in its investments. For this purpose it will set out procedures for determining the maximum periods for which funds may prudently be committed. These procedures also apply to the Council’s prudential indicators covering the maximum principal sums invested.
The Section 151 Officer will maintain a counterparty list in compliance with the following criteria and will revise the criteria and submit them to Council for approval as necessary. These criteria are separate to that which determines which types of investment instrument are either specified or non-specified as it provides an overall pool of counterparties considered high quality which the Council may use, rather than defining what types of investment instruments are to be used.
Credit rating information is supplied by our treasury advisors, on all active counterparties that comply with the criteria below. Any counterparty failing to meet the criteria would be omitted from the counterparty (dealing) list. Any rating changes, rating Watches (notification of a likely change), rating Outlooks (notification of a possible longer term change) are provided to officers almost immediately after they occur and this information is considered before dealing. For instance, a negative rating Watch applying to a counterparty at the minimum Council criteria will be suspended from use, with all others being reviewed in light of market conditions.
The criteria for providing a pool of high quality investment counterparties (both specified and non-specified investments) is:
Banks 1 - good credit quality – the Council will only use banks which:i. are UK banks; or
ii. are non-UK and domiciled in a country which has a minimum sovereign long term rating of AAA
and have, as a minimum, the following Fitch, Moody’s and Standard and Poor’s credit ratings (where rated):
i. Short term – F1ii. Long term – A-
Banks 2 – Part nationalised UK bank – Royal Bank of Scotland. This bank can be included provided it continues to be part nationalised or they meet the ratings in Banks 1 above.
Banks 3 – The Council’s own banker for transactional purposes if the bank falls below the above criteria, although in this case balances will be minimised in both monetary size and time.

Bank subsidiary and treasury operation - The Council will use these where the parent bank has provided an appropriate guarantee or has the necessary ratings outlined above.
Money market funds – AAA
Enhanced money market funds (EMMFs)*
UK Government (including gilts and the DMADF)
Local authorities, parish councils etc.
Supranational institutions
Property Funds**
* Enhanced MMF’s are similar to the current MMF’s and should allow marginally higher returns. These funds invest slightly longer than the current liquid MMF’s and access to monies is usually over a 1 or 2 day notice period, rather than immediately. Officers will consult with our advisers over their introduction.
**Property Funds are longer term investments and although are not currently used by the Council the option may be used in future financial years. Officers will consult with our advisers over their introduction and are subject to an additional report.
A limit of 50% of the whole portfolio will be applied to the use of non-specified investments.
Use of additional information other than credit ratings. Additional requirements under the Code require the Council to supplement credit rating information. Whilst the above criteria relies primarily on the application of credit ratings to provide a pool of appropriate counterparties for officers to use, additional operational market information will be applied before making any specific investment decision from the agreed pool of counterparties. This additional market information (for example Credit Default Swaps, negative rating Watches/Outlooks) will be applied to compare the relative security of differing investment counterparties.
Country and sector considerations - Due care will be taken to consider the country, group and sector exposure of the Council’s investments.
The Council currently limits its investments to UK countries, but should that change the Council has determined that it will only use approved counterparties from countries (excluding the UK) with a minimum sovereign credit rating of AAA from Fitch. This list will be added to, or deducted from, by officers should ratings change in accordance with this policy.
In addition: no more than 50% of the whole portfolio will be placed with any non-UK country at any time; limits in place above will apply to a group of companies; sector limits will be monitored regularly for appropriateness.
Time and monetary limits applying to investments. The time and monetary limits for institutions on the Council’s counterparty list are as follows (these will cover both specified and non-specified investments):
Table 10: Institution Limits Fitch Long term
Rating(or equivalent)/
Fund Rating
Money Limit
£
Time Limit
Banks 1 higher quality AA- £5m 3yrs
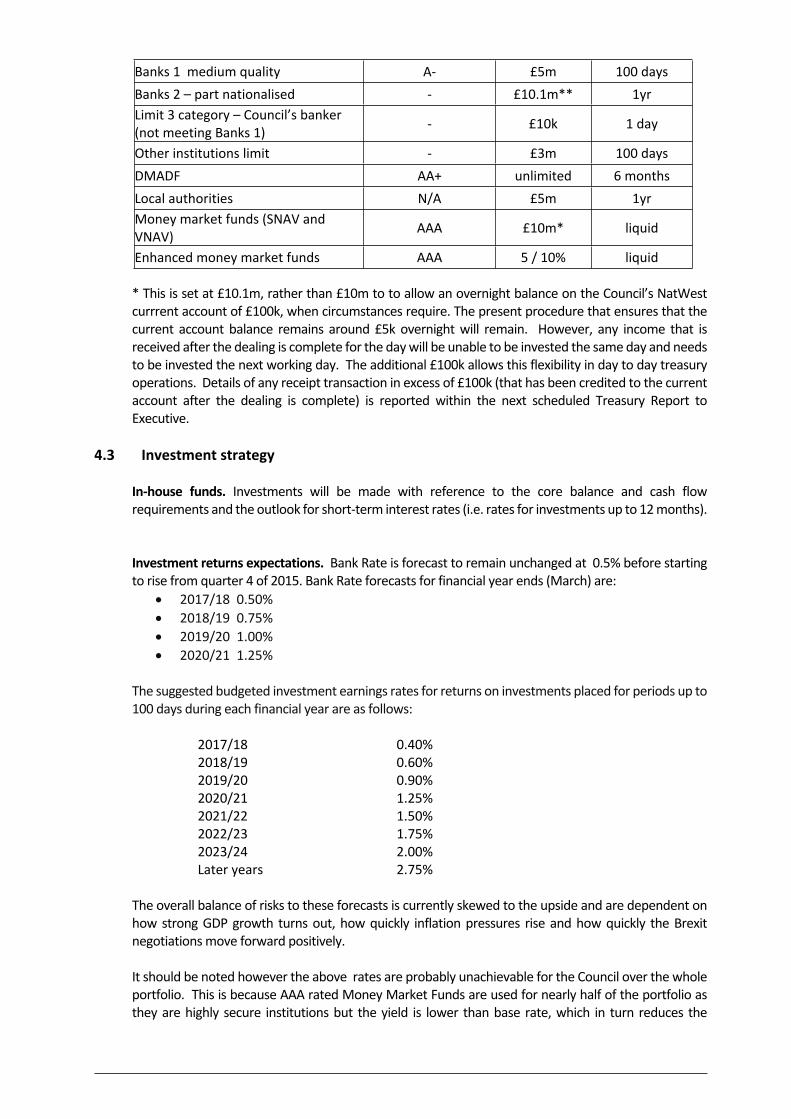
Banks 1 medium quality A- £5m 100 daysBanks 2 – part nationalised - £10.1m** 1yrLimit 3 category – Council’s banker (not meeting Banks 1) - £10k 1 day
Other institutions limit - £3m 100 daysDMADF AA+ unlimited 6 monthsLocal authorities N/A £5m 1yrMoney market funds (SNAV and VNAV) AAA £10m* liquid
Enhanced money market funds AAA 5 / 10% liquid
* This is set at £10.1m, rather than £10m to to allow an overnight balance on the Council’s NatWest currrent account of £100k, when circumstances require. The present procedure that ensures that the current account balance remains around £5k overnight will remain. However, any income that is received after the dealing is complete for the day will be unable to be invested the same day and needs to be invested the next working day. The additional £100k allows this flexibility in day to day treasury operations. Details of any receipt transaction in excess of £100k (that has been credited to the current account after the dealing is complete) is reported within the next scheduled Treasury Report to Executive.
4.3 Investment strategy
In-house funds. Investments will be made with reference to the core balance and cash flow requirements and the outlook for short-term interest rates (i.e. rates for investments up to 12 months).
Investment returns expectations. Bank Rate is forecast to remain unchanged at 0.5% before starting to rise from quarter 4 of 2015. Bank Rate forecasts for financial year ends (March) are:
2017/18 0.50% 2018/19 0.75% 2019/20 1.00% 2020/21 1.25%
The suggested budgeted investment earnings rates for returns on investments placed for periods up to 100 days during each financial year are as follows:
2017/18 0.40% 2018/19 0.60% 2019/20 0.90% 2020/21 1.25% 2021/22 1.50% 2022/23 1.75% 2023/24 2.00% Later years 2.75%
The overall balance of risks to these forecasts is currently skewed to the upside and are dependent on how strong GDP growth turns out, how quickly inflation pressures rise and how quickly the Brexit negotiations move forward positively.
It should be noted however the above rates are probably unachievable for the Council over the whole portfolio. This is because AAA rated Money Market Funds are used for nearly half of the portfolio as they are highly secure institutions but the yield is lower than base rate, which in turn reduces the
average interest rate achieved. The Council does continue to be above the 7 Day London Iterbank Bid rate (LIBID the rate at which a bank is willing to borrow from other banks) as a benchmark.
For its cash flow generated balances, the Council will seek to utilise its instant access and notice accounts, money market funds and short-dated deposits in order to benefit from the compounding of interest.
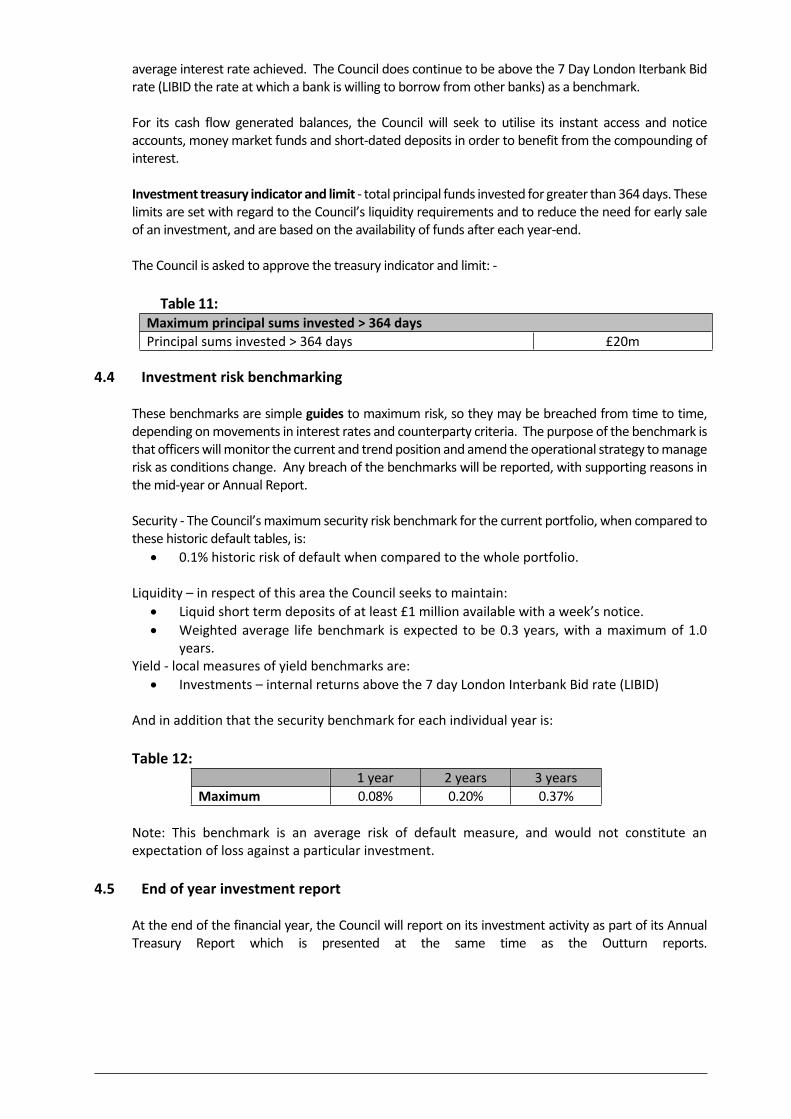
Investment treasury indicator and limit - total principal funds invested for greater than 364 days. These limits are set with regard to the Council’s liquidity requirements and to reduce the need for early sale of an investment, and are based on the availability of funds after each year-end.
The Council is asked to approve the treasury indicator and limit: -
Table 11:Maximum principal sums invested > 364 daysPrincipal sums invested > 364 days £20m
4.4 Investment risk benchmarking
These benchmarks are simple guides to maximum risk, so they may be breached from time to time, depending on movements in interest rates and counterparty criteria. The purpose of the benchmark is that officers will monitor the current and trend position and amend the operational strategy to manage risk as conditions change. Any breach of the benchmarks will be reported, with supporting reasons in the mid-year or Annual Report.
Security - The Council’s maximum security risk benchmark for the current portfolio, when compared to these historic default tables, is:
0.1% historic risk of default when compared to the whole portfolio.
Liquidity – in respect of this area the Council seeks to maintain: Liquid short term deposits of at least £1 million available with a week’s notice. Weighted average life benchmark is expected to be 0.3 years, with a maximum of 1.0
years.Yield - local measures of yield benchmarks are:
Investments – internal returns above the 7 day London Interbank Bid rate (LIBID)
And in addition that the security benchmark for each individual year is:
Table 12:1 year 2 years 3 years
Maximum 0.08% 0.20% 0.37%
Note: This benchmark is an average risk of default measure, and would not constitute an expectation of loss against a particular investment.
4.5 End of year investment report
At the end of the financial year, the Council will report on its investment activity as part of its Annual Treasury Report which is presented at the same time as the Outturn reports.

APPENDIX 1A: Approved countries for investments
AAA Australia Canada Denmark Germany Luxembourg Netherlands Norway Singapore Sweden Switzerland
AA+ Finland Hong Kong U.S.A.
AA Abu Dhabi (UAE) France U.K.
AA- Belgium Qatar
APPENDIX 1B: Treasury management scheme of delegation
(i) Full Council receiving and reviewing reports on treasury management policies, practices and
activities; approval of annual strategy.
(ii) Boards/committees/council/responsible body approval of/amendments to the organisation’s adopted clauses, treasury management
policy statement and treasury management practices; budget consideration and approval; approval of the division of responsibilities; receiving and reviewing regular monitoring reports and acting on recommendations; approving the selection of external service providers and agreeing terms of appointment.
(iii) Body/person(s) with responsibility for scrutiny reviewing the treasury management policy and procedures and making
recommendations to the responsible body.

APPENDIX 1C: The treasury management role of the section 151 officer
The S151 (responsible) officer recommending clauses, treasury management policy/practices for approval, reviewing
the same regularly, and monitoring compliance; submitting regular treasury management policy reports; submitting budgets and budget variations; receiving and reviewing management information reports; reviewing the performance of the treasury management function; ensuring the adequacy of treasury management resources and skills, and the effective
division of responsibilities within the treasury management function; ensuring the adequacy of internal audit, and liaising with external audit; recommending the appointment of external service providers.
22