TMSS, Investment Strategy & MRP policy 2016-2017
38
TMSS, Investment Strategy & MRP policy 2016-2017 Page 1 Treasury Management Strategy Statement & Investment Strategy Minimum Revenue Provision Policy 2016/2017 “Allerdale – a great place to live, work and visit”
Transcript of TMSS, Investment Strategy & MRP policy 2016-2017
TMSS, Investment Strategy & MRP policy 2016-2017
Page 1
Treasury Management Strategy Statement & Investment Strategy
Minimum Revenue Provision Policy
2016/2017
“Allerdale – a great place to live, work and visit”

TMSS, Investment Strategy & MRP policy 2016-2017
Page 2
THIS PAGE IS INTENTIONALLY LEFT BLANK
TMSS, Investment Strategy & MRP policy 2016-2017
Page 3
Contents
1. Introduction ........................................................................................................ 4
1.1 Background .................................................................................................. 4
1.2 Reporting requirements ................................................................................ 4
2. Treasury Management Strategy Statement (TMSS) ........................................ 6
2.1 Current treasury position .............................................................................. 6
2.2 Treasury Indicators: limits on borrowing & investing activity ........................ 6
2.3 Economic Background ................................................................................. 7
2.4 Prospects for interest rates ........................................................................ 12
2.5 Borrowing strategy ..................................................................................... 14
2.6 Policy on borrowing in advance of need ..................................................... 15
2.7 Debt rescheduling ...................................................................................... 15
2.8 Policy on the use of derivatives ................................................................. 16
2.9 Training ...................................................................................................... 17
2.10 Treasury management consultants ............................................................ 17
3. Annual Investment Strategy ............................................................................ 18
3.1 Investment policy - objectives ..................................................................... 18
3.2 Creditworthiness policy (credit risk management) ....................................... 18
3.3 Approved investment counterparties .......................................................... 18
3.4 Approved instruments ................................................................................. 20
3.5 Limits on principal sums invested................................................................ 21
3.6 Limits on investment maturities ................................................................... 21
3.7 Changes to credit rating methodology ......................................................... 22
3.8 Reporting arrangements ........................................................................... 23
4. Minimum revenue provision (MRP) policy statement ................................... 24
5. Prudential & treasury Indicators 2016/17 - 2018/19 ....................................... 27
5.1 Indicators required by the Prudential Code ................................................ 27
5.2 Indicators required by the Treasury Management Code ............................. 33
6. Appendices ....................................................................................................... 36
A. Interest Rate Forecasts 2016 - 2019 ............................................................ 37
B. Short & Long term credit ratings .................................................................. 38
TMSS, Investment Strategy & MRP policy 2016-2017
Page 4
1. Introduction
1.1 Background
1.1.1 For public sector organisations, the Chartered Institute of Public Finance and Accountancy (CIPFA) defines treasury management as “the management of the organisations investments and cash flows, its banking, money market and capital market transactions; the effective control of the risks associated with those activities; and the pursuit of optimum performance consistent with those risks”.
1.1.2 This definition expects a „best value‟ approach in which authorities should seek to minimise the cost of borrowing (or maximise the returns from investment), subject to the over-riding management of risks, with risk limitation being more important than return (yield).
1.1.3 The statutory framework for treasury management within local authorities is laid out in a series of legislations, statutory guidance and codes of practice, the key elements of which are:
The Local Government Act 2003 - („the 2003 Act‟)
The Local Authorities (Capital Finance and Accounting)(England) Regulations 2003 (as amended) - („the 2003 Regulations‟)
Department for Communities and Local Government (CLG) Guidance on Local Government Investments - second edition (March 2010)
CLG guidance on Minimum Revenue Provision - third edition (February 2012)
The Prudential Code for Capital Finance in Local Authorities - 2011 Edition - („the Prudential Code‟)
CIPFA‟s Treasury Management in the Public Services: Code of Practice and Cross-Sectoral Guidance Notes 2011 Edition - („the Treasury Management Code‟)
1.2 Reporting requirements
1.2.1 Provisions contained in the Local Government Act 2003, statutory guidance and regulations issued by the Department for Communities and Local Government and Codes of Practice issued by CIPFA in relation to treasury management and capital finance, require local authorities to prepare and approve, before the start of each financial year:
a Treasury Management Strategy Statement (TMSS) and Investment Strategy setting out its proposed treasury management activities for the year - based on budget proposals, interests rate forecasts and economic outlook - and policies for the prudent management of its investments
a statement of its policy on making Minimum Revenue Provision (MRP) indicating how, in the forthcoming financial year, the duty to make prudent MRP will be discharged
TMSS, Investment Strategy & MRP policy 2016-2017
Page 5
a set of prescribed prudential and treasury indicators for the forthcoming and following years - including the Council‟s Authorised Borrowing Limit - demonstrating that its capital expenditure plans are affordable and that external borrowing is within prudent and sustainable levels.
1.2.2 The Treasury Management Code also requires authorities to ensure that the Full Council receives:
a mid-year review providing:
- an update on the economic environment and interest rate forecasts
- a Treasury Management Strategy Statement and Investment Strategy update, including details of variations (if any) from agreed policies/practices
- a review of investing and borrowing activities
- confirmation of compliance with treasury and prudential indicators.
after the year-end, an annual report on the performance of the treasury management function, on the effects of the decisions taken and the transactions executed in the past year, and on any circumstances of non-compliance with the Council‟s treasury management policy statement.
1.2.3 This document - prepared in accordance with the statutory framework and codes of practice referred to above - sets out the Council‟s:
Treasury Management Strategy Statement (TMSS) and Investment Strategy for 2016/17
Minimum revenue provision (MRP) policy statement for 2016/17
Prudential and treasury indicators for the three year period 2016/17 to 2018/19
1.2.4 The TMSS and Investment Strategy, MRP policy and the prudential and treasury indicators are required to be approved by Full Council prior to the commencement of the financial year to which they relate.
1.2.5 To enable the Audit Committee to fulfil its responsibilities for ensuring effective scrutiny of treasury management strategy and policies the Council‟s Treasury Management Practices (TMPs) require treasury management reports - including this report - to be submitted to the Audit Committee prior to their consideration by Full Council.
TMSS, Investment Strategy & MRP policy 2016-2017
Page 6
2. Treasury Management Strategy Statement
2.1 Current treasury position
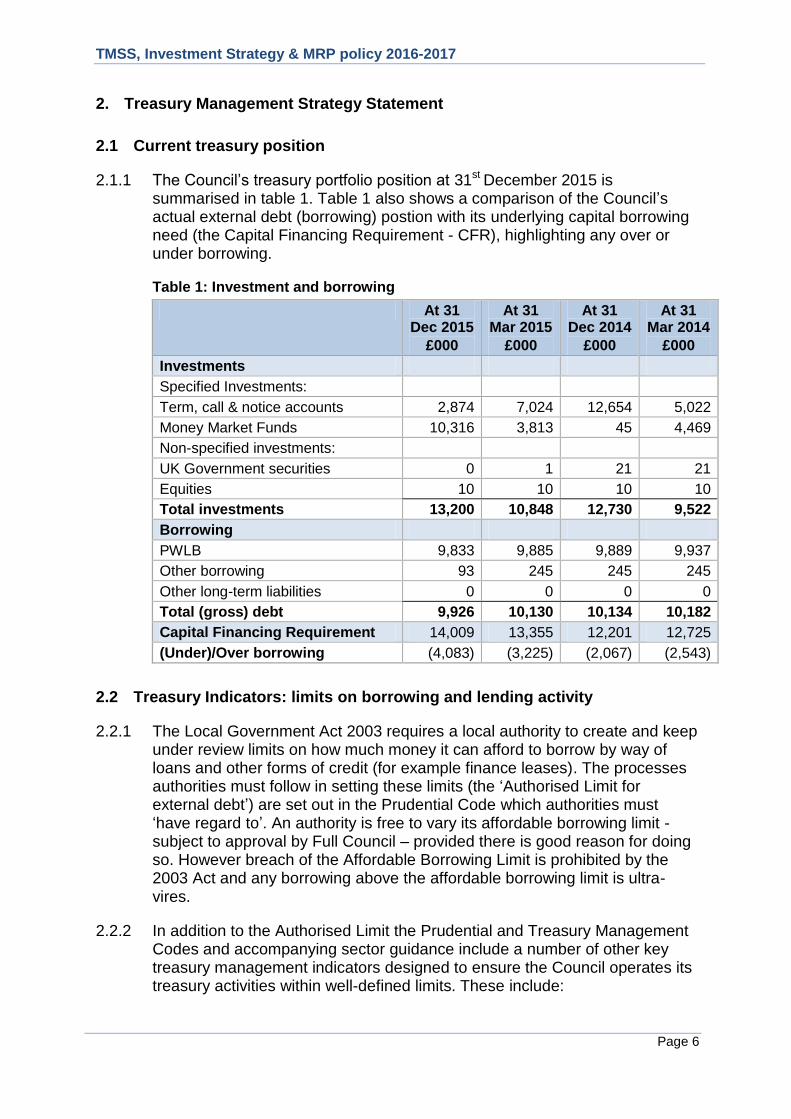
2.1.1 The Council‟s treasury portfolio position at 31st December 2015 is summarised in table 1. Table 1 also shows a comparison of the Council‟s actual external debt (borrowing) postion with its underlying capital borrowing need (the Capital Financing Requirement - CFR), highlighting any over or under borrowing.
Table 1: Investment and borrowing
At 31 Dec 2015
£000
At 31 Mar 2015
£000
At 31 Dec 2014
£000
At 31 Mar 2014
£000
Investments
Specified Investments:
Term, call & notice accounts 2,874 7,024 12,654 5,022
Money Market Funds 10,316 3,813 45 4,469
Non-specified investments:
UK Government securities 0 1 21 21
Equities 10 10 10 10
Total investments 13,200 10,848 12,730 9,522
Borrowing
PWLB 9,833 9,885 9,889 9,937
Other borrowing 93 245 245 245
Other long-term liabilities 0 0 0 0
Total (gross) debt 9,926 10,130 10,134 10,182
Capital Financing Requirement 14,009 13,355 12,201 12,725
(Under)/Over borrowing (4,083) (3,225) (2,067) (2,543)
2.2 Treasury Indicators: limits on borrowing and lending activity
2.2.1 The Local Government Act 2003 requires a local authority to create and keep under review limits on how much money it can afford to borrow by way of loans and other forms of credit (for example finance leases). The processes authorities must follow in setting these limits (the „Authorised Limit for external debt‟) are set out in the Prudential Code which authorities must „have regard to‟. An authority is free to vary its affordable borrowing limit - subject to approval by Full Council – provided there is good reason for doing so. However breach of the Affordable Borrowing Limit is prohibited by the 2003 Act and any borrowing above the affordable borrowing limit is ultra-vires.
2.2.2 In addition to the Authorised Limit the Prudential and Treasury Management Codes and accompanying sector guidance include a number of other key treasury management indicators designed to ensure the Council operates its treasury activities within well-defined limits. These include:
TMSS, Investment Strategy & MRP policy 2016-2017
Page 7
setting an operational boundary for external debt based on the expectations of the most likely maximum external debt for the year and reflecting the authority‟s plans for capital expenditure, estimated capital financing requirement (CFR) and cash flow requirements for the year for all purposes
ensuring that gross debt does not, except in the short term, exceed the total of the CFR in the preceding year plus the estimates of any additional CFR for current and the following two financial years.
placing upper limits on:
- fixed interest and variable interest rate exposures
- the total of principal sums invested longer than 364 days
placing upper and lower limits on the maturity structure of its fixed rate borrowing.
2.2.3 Details of the Council‟s prudential and treasury indicators are set out in section 5 of this report.
2.3 Economic Background
UK Economy
2.3.1 UK GDP growth rates of 2.2% in 2013 and 2.9% in 2014 were the strongest growth rates of any G7 country. The 2014 growth rate was also the strongest UK rate since 2006. Although the 2015 growth rate is likely to be a leading rate in the G7 again, it looks likely to disappoint previous forecasts and come in at about +2.2%. Growth in quarter 1 of 2015 was weak at +0.4% (+2.9 y/y). Although there was a slight increase in quarter 2 to +0.5% (+2.3% y/y), growth fell back +0.4% in quarter 3 (+2.1%y/y).
2.3.2 GDP growth in Q3 was underpinned by increased output in three of the four main industrial groupings within the economy. However the UK economy is still reliant on the service sector. Output in the service sector expanded by 0.6% during the quarter with production and agriculture each increasing by a more modest 0.2%. Within the production grouping manufacturing, the largest component, fell by 0.4%. Output in the construction sector decreased by 1.9%.
2.3.3 Despite the headwinds faced by the UK economy the Bank of England‟s November Inflation Report included a forecast for growth to remain around 2.5% - 2.7% over the next three years (2015-2017). This growth is expected to be driven mainly by strong consumer demand as the squeeze on the disposable incomes of consumers has been reversed by a recovery in wage inflation at the same time that CPI inflation has fallen to, or near to, zero since February 2015. Investment expenditure is also expected to support growth. However, since the August Inflation report was issued, most worldwide economic statistics have been weak and financial markets have been particularly volatile. The November Inflation Report flagged up particular concerns for the potential impact of these on the UK.
TMSS, Investment Strategy & MRP policy 2016-2017
Page 8
2.3.4 There also remain concerns that for the UK‟s recovery to become more balanced and sustainable in the longer term, it still needs to move away from dependence on consumer expenditure and the housing market to manufacturing and investment expenditure.
2.3.5 The strong growth since 2012 has resulted in unemployment falling quickly over the last few years to a current level (September to November) of 5.1%, down from 5.8% a year earlier. The employment rate (age 16-64 years) is also now at a record 74%, up from 73% a year ago.
2.3.6 The Bank of England‟s Monetary Policy Committee (MPC) has been particularly concerned that the squeeze on the disposable incomes of consumers should be reversed by wage inflation rising back above the level of CPI inflation in order to underpin a sustainable recovery. It has, therefore, been encouraging in 2015 to see wage inflation rising significantly above CPI inflation which has been around zero since February. However, despite current levels of growth in average earnings (1.9% at the beginning of Q4 2015), it is unlikely that the MPC would start raising rates until wage inflation was expected to consistently stay over 3%, as a labour productivity growth rate of around 2% would mean that net labour unit costs would still only be rising by about 1% y/y.
2.3.7 Key to MPC decision making is inflation. However the Bank of England‟s November Inflation Report was notably subdued in its forecasts for inflation. CPI inflation was expected to struggle to get back up to the 2% target within the 2-3 year time horizon. The falls in oil, gas and food prices over late 2014 and the first half 2015 will fall out of the 12 month calculation of CPI, during late 2015 and early 2016. However a second, subsequent round of falls in fuel prices is now expected to delay a significant tick up in inflation from the current near zero rate.
2.3.8 CPI inflation in December 2015 was 0.2% (up from 0.1% in November) and is currently expected to get back to around 1% by the end of 2016. Thereafter the Bank of England expects CPI inflation to get back to near the 2% target in the second half of 2017 and above it in 2018. The increase in the forecast for inflation at the three year horizon is the biggest in a decade and at the two year horizon the biggest since February 2013. However the uncertainties which surround these projections means there is a downside skew to CPI inflation projections over course of the next two years. This could lead to inflation undershooting current forecasts.
2.3.9 In particular further falls in the price of oil and commodities imported from emerging countries in early 2016 (several of which have seen their currencies already fall by 20-30%, (or more), over the last year) could further delay the pick-up in inflation. These developments could in turn lead the Bank of England to lower the pace of increases in inflation in its February 2016 Inflation Report. On the other hand, the start of the national living wage in April 2016 (and further staged increases until 2020), will raise wage inflation; however, it could also result in a decrease in employment so the overall inflationary impact may be muted.
TMSS, Investment Strategy & MRP policy 2016-2017
Page 9
2.3.10 There is, therefore, considerable uncertainty around how quickly pay and CPI inflation will rise in the next few years. This makes it difficult to forecast when the MPC will decide to make a start on increasing the Bank Rate. There are also concerns around the fact that the central banks of the UK and US currently have few monetary policy options left to them given that central rates are near to zero and huge QE is already in place. There is therefore a case for suggesting they need to raise rates sooner, rather than later, so as to have some options available for use if there was another major financial crisis in the near future. But it is unlikely that either would raise rates until they are sure that growth was securely embedded and „noflation‟ was not a significant threat.
2.3.11 The forecast for the first increase in Bank Rate has, therefore, been pushed back progressively over the last year from Q4 2015 to Q4 2016. Increases thereafter are expected to be at a much slower pace and to much lower final levels than prevailed before 2008, as increases in Bank Rate will have a much bigger effect on heavily indebted consumers and householders than they did before 2008. There has also been an increase in momentum towards holding a referendum on membership of the EU in 2016, rather than in 2017, with Q3 2016 being the current front runner in terms of timing; this could impact on MPC considerations to hold off from a first increase until the uncertainty caused by it has passed.
USA
2.3.12 GDP growth in 2014 of 2.4% was followed by first quarter 2015 growth, depressed by exceptionally bad winter weather, of only +0.6% (annualised). However, growth rebounded very strongly in Q2 to +3.9% (annualised) before falling back to 2.0% in Q3.
2.3.13 Until the turmoil in financial markets in August caused by fears about the slowdown in Chinese growth, it had been strongly expected that the Federal Reserve (the Fed) would increase rates in September. However, the Fed pulled back from that first increase in response to:
global risks which might depress US growth and put downward pressure on inflation, and
a 20% appreciation of the dollar which caused the Fed to lower its growth forecasts.
2.3.14 Although the non-farm payrolls figures for growth in employment in August and September were disappointingly weak, the October figure was extremely strong. Figures for November were also reasonably strong. This opened up the way for the Federal Reserve to embark on its first increase in rates of 0.25% at its December meeting. However, the accompanying message with this first increase was that further increases will be at a much slower rate and to a much lower ultimate ceiling, than in previous business cycles, mirroring comments by the Bank of England‟s MPC.
TMSS, Investment Strategy & MRP policy 2016-2017
Page 10
Eurozone
2.3.15 The Eurozone (EZ) continues to face the threats of weak or negative growth and from deflation. In response to these threats the European Central Bank (ECB) unleashed a massive €1.1 trillion programme of quantitative easing during 2015 to buy up high credit quality government debt of selected EZ countries. This programme of €60bn of monthly purchases started in March 2015 and was intended to run initially to September 2016. At the ECB‟s December meeting, the current QE programme was subsequently extended to March 2017 although it was not increased in terms of the amount of monthly purchases. The ECB also cut its deposit facility rate by 10bps from -0.2% to -0.3%.
2.3.16 This programme of monetary easing appears to have had a limited positive effect in helping a recovery in consumer and business confidence and a start to an improvement in economic growth. GDP growth rose to +0.5% in Q1 2015 (1.3% y/y) but then eased to +0.4% (+1.6% y/y) in Q2 and +0.3% (+1.6% y/y) in Q3. Financial markets were disappointed by the ECB‟s lack of more decisive action in December and it is likely that it will need to boost its QE programme if it is to succeed in significantly improving growth in the EZ and getting inflation up from the current level of around zero to its target of 2%.
2.3.17 During July, Greece finally capitulated to EU demands to implement a major programme of austerity and is now cooperating fully with EU demands. A €86bn third bailout package has since been agreed, though it did nothing to address the unsupportable size of total debt compared to GDP. However, huge damage has been done to the Greek banking system and economy by the resistance of the Syriza Government, elected in January, to EU demands.
2.3.18 The surprise general election in September gave the Syriza government a mandate to stay in power to implement austerity measures. However, there are major doubts as to whether the size of cuts and degree of reforms required can be fully implemented and so Greek exit from the euro may only have been delayed by this latest bailout.
2.3.19 In Portugal and Spain the general elections in September and December respectively have opened up new areas of political risk where the previous right wing reform-focused pro-austerity mainstream political parties have lost power. A left wing / communist coalition has taken power in Portugal. The general election in Spain produced a complex result where no combination of two main parties is able to form a coalition with a majority of seats. It is currently unresolved as to what administrations will result from both these situations. This has created nervousness in bond and equity markets for these countries which has the potential to spill over and impact on the whole Eurozone project.
China and Japan
2.3.20 Japan is causing considerable concern as the increase in sales tax in April 2014 suppressed consumer expenditure and growth. In Q2 2015 quarterly
TMSS, Investment Strategy & MRP policy 2016-2017
Page 11
growth shrank by -0.2% after a short burst of strong growth of 1.1% during Q1 but then came back to +0.3% in Q3 after the first estimate had indicated that Japan had fallen back into recession. Japan has been hit hard by the downturn in China during 2015 and there are continuing concerns as to how effective efforts by the Abe government to stimulate growth and increase the rate of inflation from near zero, are likely to prove when it has already fired the first two of its „arrows‟ of reform (quantitative easing by the Bank of Japan and fiscal stimulus) but has dithered about firing the third - deregulation of protected and inefficient areas of the economy.
2.3.21 In China, the Government has been very active during 2015 in implementing several stimulus measures to try to ensure the economy hits the growth target of about 7% for 2015. It has also sought to bring some stability after the major fall in the onshore Chinese stock market during the summer and then a second bout in January 2016. Many commentators are concerned that recent growth figures around that figure could have been massaged to hide a downturn to a lower growth figure.
2.3.22 There are also major concerns as to the creditworthiness of much of bank lending to corporates and local government during the post 2008 credit expansion period. Overall, China is still expected to achieve a growth figure that the EU would be envious of. Nevertheless, there are growing concerns about whether the Chinese economy could be heading for a hard landing and weak progress in rebalancing the economy from an over dependency on manufacturing and investment to consumer demand led services. There are also concerns over the volatility of the Chinese stock market, which was the precursor to falls in world financial markets in August and September and again in January 2016, which could lead to a flight to quality to bond markets. In addition, the international value of the Chinese currency has been on a steady trend of weakening and this will put further downward pressure on the currencies of emerging countries dependent for earnings on exports of their commodities.
Emerging countries
2.3.23 Considerable concerns exist about the vulnerability of some emerging countries and their corporates, who are getting caught in a perfect storm. Having borrowed massively in dollar and other western currency denominated debt since the financial crisis (as investors searched for yield by channelling investment cash away from western economies with dismal growth, depressed bond yields and near zero interest rates into emerging countries) there is now a strong flow back to those western economies with strong growth and a path of rising interest rates and bond yields.
2.3.24 This change in investors‟ strategy and the massive reverse cash flow, has depressed the currencies of emerging countries. Expectations over central interest rate increases in the US have also contributed to a significant appreciation of the dollar against these currencies. In turn, this has made it much more costly for emerging countries to service their dollar denominated debt at a time when their earnings from commodities are depressed by a simultaneous downturn in demand for their exports and deterioration in the
TMSS, Investment Strategy & MRP policy 2016-2017
Page 12
value of their currencies. There are also likely to be major issues when previously borrowed debt comes to maturity and requires refinancing at much more expensive rates.
2.3.25 Corporates (worldwide) heavily involved in mineral extraction and / or the commodities market may also be at risk and this could also cause volatility in equities and safe haven flows to bonds. Financial markets may also be buffeted by the sovereign wealth funds of those countries that are highly exposed to falls in commodity prices and which, therefore, may have to liquidate investments in order to cover national budget deficits.
2.4 Prospects for interest rates
2.4.1 The Council has appointed Capita Asset Services as its treasury advisor. Part of their service is to assist the Council to formulate a view on interest rates. Capita Asset Services undertook its latest review of interest rate forecasts in January 2016. It updates the forecast issued shortly after publication of the Bank of England‟s quarterly Inflation Report in November 2015 to reflect the downbeat UK and global economic news of recent weeks and the extreme volatility in financial markets. This latest forecast also follows comments made by the Governor of the Bank of England in January 2016 that rule out an increase in the bank rate in the very near future.
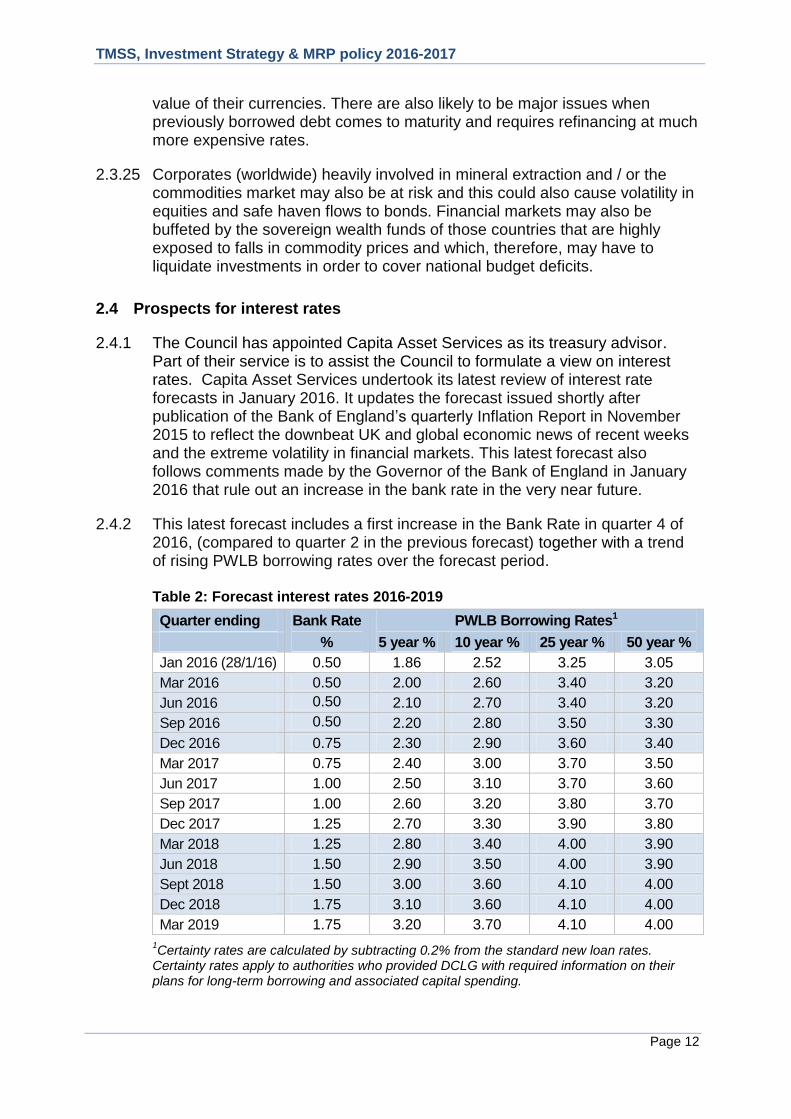
2.4.2 This latest forecast includes a first increase in the Bank Rate in quarter 4 of 2016, (compared to quarter 2 in the previous forecast) together with a trend of rising PWLB borrowing rates over the forecast period.
Table 2: Forecast interest rates 2016-2019
Quarter ending Bank Rate PWLB Borrowing Rates1
% 5 year % 10 year % 25 year % 50 year %
Jan 2016 (28/1/16) 0.50 1.86 2.52 3.25 3.05
Mar 2016 0.50 2.00 2.60 3.40 3.20
Jun 2016 0.50 2.10 2.70 3.40 3.20
Sep 2016 0.50 2.20 2.80 3.50 3.30
Dec 2016 0.75 2.30 2.90 3.60 3.40
Mar 2017 0.75 2.40 3.00 3.70 3.50
Jun 2017 1.00 2.50 3.10 3.70 3.60
Sep 2017 1.00 2.60 3.20 3.80 3.70
Dec 2017 1.25 2.70 3.30 3.90 3.80
Mar 2018 1.25 2.80 3.40 4.00 3.90
Jun 2018 1.50 2.90 3.50 4.00 3.90
Sept 2018 1.50 3.00 3.60 4.10 4.00
Dec 2018 1.75 3.10 3.60 4.10 4.00
Mar 2019 1.75 3.20 3.70 4.10 4.00
1Certainty rates are calculated by subtracting 0.2% from the standard new loan rates.
Certainty rates apply to authorities who provided DCLG with required information on their plans for long-term borrowing and associated capital spending.
TMSS, Investment Strategy & MRP policy 2016-2017
Page 13
2.4.3 Economic forecasting remains difficult with so many external influences weighing on the UK. As a consequence the Bank Rate forecasts, (and also MPC decisions), will be liable to further amendment depending on how economic data evolves over time. The overall balance of risks to economic recovery in the UK is currently to the downside and only time will tell just how long the current period of reasonably strong economic growth will continue. The UK economy also remains exposed to vulnerabilities in a number of key areas.
2.4.4 The overall balance of risks to the current Bank Rate forecast is probably to the downside, i.e. the first increase, and subsequent increases, may be delayed further if recovery in GDP growth, and forecasts for inflation increases, are lower than currently expected. Market expectations in January 2016, (based on short sterling), for the first Bank Rate increase, are currently around quarter 1 2017.
2.4.5 Whilst there are no magic thresholds the governor of the Bank of England has previously set out three criteria that need to be met in order to warrant an increase in the bank rate. These criteria are patently not being met at the current time:
i) Quarter-on-quarter GDP growth is above 0.6%. i.e. growth momentum is consistent with eliminating spare capacity in the economy. This condition was met in Q2 2015, but Q3 came up short and Q4 looks likely to also fall short.
ii) Core inflation (stripping out volatile components) registers a concerted increase towards the MPC‟s 2% target. This measure was on a steadily decreasing trend since mid-2014 until November 2015 (1.2%). December 2015 saw a slight increase to 1.4%.
iii) Unit wage costs are on a significant increasing trend. This would imply that spare capacity for increases in employment and productivity gains are being exhausted and that further economic growth will fuel inflationary pressures.
2.4.6 In line with the base rate forecasts investment returns are likely to remain
relatively low during 2016/17 and beyond. There will also remain a cost of
carry to any new borrowing which causes an increase in investments as this will incur a revenue loss as a consequence of the differential between borrowing costs and investment returns.
2.4.7 Gilt yields have remained at historically low levels during 2015. However there remains much volatility in rates and bond yields as alternating bouts of good and bad news have promoted optimism and then pessimism in financial markets. This volatility in bond yields - strongly correlated to emerging market, geopolitical and sovereign debt crisis developments - is likely to endure throughout 2016/17 as investor fears and confidence ebbs and flows between favouring more risky assets i.e. equities, or the safe haven of bonds.
2.4.8 The overall trend in the longer term will be for gilt yields and PWLB rates to rise when economic recovery is firmly established accompanied by rising inflation and consequent increases in Bank Rate and the eventual unwinding
TMSS, Investment Strategy & MRP policy 2016-2017
Page 14
of QE. At some point increasing investor confidence in eventual world economic recovery is also likely to compound this effect as recovery will encourage investors to switch from bonds to equities.
2.4.9 The PWLB rate forecasts included in table 2 are based around a balance of risks. However, there are a number potential upside and downside risks to UK gilt yields and PWLB rates, especially for longer term PWLB rates.
2.4.10 Downside risks to current forecasts for UK gilt yields and PWLB rates currently include:
geopolitical risks in Eastern Europe, the Middle East and Asia, increasing safe haven flows
UK economic growth and increases in inflation turning weaker than currently anticipated
weak growth or recession in the UK‟s main trading partners - the EU and US
a resurgence of the Eurozone sovereign debt crisis
recapitalisation of European banks requiring more government financial support
emerging country economies, currencies and corporates destabilised by falling commodity prices and / or Federal Reserve Funds Rate increases causing a flight to safe havens (bonds)
monetary policy action failing to stimulate sustainable growth and combat the threat of deflation in western economies, especially the Eurozone and Japan.
2.4.11 The potential for upside risks to current forecasts for UK gilt yields and PWLB rates, especially for longer term PWLB rates, include: -
uncertainty around the risk of a UK exit from the EU
the pace and timing of increases in the US Federal Funds Rate causing a fundamental reassessment by investors of the relative risks of holding bonds as opposed to equities and leading to a major flight from bonds to equities
UK inflation returning to significantly higher levels than in the wider EU and US, causing an increase in the inflation premium inherent to gilt yields.
2.5 Borrowing strategy
2.5.1 The Council is currently maintaining an under-borrowed position (see table 1). This means that the capital borrowing need (the Capital Financing Requirement - CFR), has not been fully funded with loan debt. By utilising cash from reserves, revenue balances and favourable cashflow the Council has been able to avoid the need to borrow up to the level of the CFR. This has allowed the Council to minimise borrowing costs and reduce treasury risk by reducing its external investment balances. This strategy is prudent as investment returns are low and counterparty risk is relatively high. The
TMSS, Investment Strategy & MRP policy 2016-2017
Page 15
Council will continue with this policy during 2016/17 to the extent permitted by its forecast liquidity requirements and the management of its interest rate exposures.
2.5.2 Against this background and the risks within the economic forecast, caution will be adopted with the 2016/17 treasury operations. Treasury staff will monitor interest rates in financial markets and adopt a pragmatic approach to changing circumstances:
if it was felt that there was a significant risk of a sharp fall in long and short-term rates (e.g. due to a marked increase of risks around relapse into recession or of risks of deflation), then long-term borrowings will be postponed, and potential rescheduling from fixed rate funding into short term borrowing will be considered.
if it was felt that there was a significant risk of a much sharper rise in long and short-term rates than that currently forecast, (e.g. due to a greater than expected increase in world economic activity or a sudden increase in inflation risks), then the portfolio position will be re-appraised with the likely action that fixed rate funding will be drawn whilst interest rates are still lower than they will be in the next few years.
2.5.3 Any decisions taken in this regard will be reported to members at the next available opportunity.
2.6 Policy on borrowing in advance of need
2.6.1 The Local Government Act 2003 allows local authorities to borrow or invest for „„any purpose relevant to its functions, under any enactment‟‟, or “for the purpose of the prudent management of its financial affairs. This allows the temporary investment of funds borrowed for the purposes of expenditure in the near future. However, the speculative procedure of borrowing purely or explicitly for the purpose of re-investment remains unlawful.
2.6.2 The Council will not borrow more than, or in advance of, its needs purely in order to profit from the investment of the extra sums borrowed. Any decision to borrow in advance will be within forward approved Capital Financing Requirement estimates and will be considered carefully to ensure that value for money can be demonstrated and that the Council can ensure the security of such funds.
2.6.3 Risks associated with any borrowing in advance activity will be subject to prior appraisal and subsequent reporting through the mid-year or annual reporting mechanism.
2.7 Debt rescheduling
2.7.1 Debt rescheduling includes the premature repayment of loans and the replacement of existing loans with new loans on different terms (repayment method, loan period, interest rate). The reasons for rescheduling include:
TMSS, Investment Strategy & MRP policy 2016-2017
Page 16
aligning long-term cash flow projections and debt levels in order redistribute the burden of debt financing costs between years of account
generating savings in risk adjusted interest costs
rebalancing the interest rate structure of the debt portfolio to reduce exposures to interest rate risk
changing the size and/or maturity profile of the debt portfolio to reduce refinancing risk exposures and/or align the debt maturity profile with the underlying need to borrow for capital purposes (the capital financing requirement).
2.7.2 As short-term borrowing rates will be considerably cheaper than longer term fixed interest rates, there may be potential opportunities to generate savings by switching from long-term debt to short-term debt. However, these savings will need to be considered in the light of the current treasury position and the size of the cost of debt repayment (premiums incurred).
2.7.3 Consideration will also be given to identifying if there is any residual potential for making savings by running down investment balances to repay debt prematurely as short-term rates on investments are likely to be lower than rates paid on current debt.
2.7.4 The economic environment and consequent structure of interest rates has limited the Council‟s rescheduling opportunities during recent years. The Council will however continue to monitor interest rate structures for opportunities to reschedule debt in order to generate savings and/or rebalance risks within the loan portfolio. All rescheduling will be reported to the Audit Committee and Full Council at the earliest meeting following its action.
2.8 Policy on the use of derivatives
2.8.1 The Council will only use derivatives for the management of risk and for the prudent management of its financial affairs. Transactions involving standalone derivative products such as forward rate agreements, interest rate swaps and options (interest rate caps, floors and collars) require authorisation by the Head of Financial Services and will only be entered into:
after seeking proper advice to ensure the product is fully understood including how underlying risks are affected and the additional risks that may result from its use (for example credit exposure to derivative counterparties)
after seeking confirmation that the Council has legal power to enter into the transaction
where use of the product can be shown to reduce the overall level of financial risks the Council is exposed to (after taking into consideration additional risks that may result from use of the derivative instrument)
after ensuring treasury staff have received training to ensure competent use of the product.
TMSS, Investment Strategy & MRP policy 2016-2017
Page 17
2.8.2 Financial derivative transactions may be arranged with any organisation that meets the approved investment criteria outlined in section 3 below. The current value of any amount due from a derivative counterparty will count against the counterparty limits set out in paragraph 3.5.1.
2.9 Training
2.9.1 CIPFA‟s Treasury Management Code of Practice and Cross-Sectoral Guidance Notes require the responsible officer (the Head of Financial Services) to ensure that:
all staff involved in the treasury management function are fully equipped to undertake the duties and responsibilities allocated to them
members tasked with treasury management responsibilities, including those responsible for scrutiny, have access to training relevant to their needs and those responsibilities.
2.9.2 In complying with these requirements the Council regularly reviews the training needs of officers and members and training will be arranged as required to ensure that officers and members have the requisite skills and knowledge.
2.10 Treasury management consultants
2.10.1 The Council currently uses Capita Asset Services, Treasury Solutions (Capita) as its external treasury management advisors. They provide a range of services to the Council including:
technical support on treasury matters and capital finance issues
economic and interest rate analysis
debt services including advice on the timing of borrowing
debt rescheduling advice
generic investment advice on interest rates, timing and investment instruments
credit ratings and creditworthiness information.
2.10.2 The Council recognises that responsibility for treasury management decisions remains with the organisation at all times and will ensure that undue reliance is not placed upon our external service providers. It also recognises that there is value in employing external providers of treasury management services in order to acquire access to specialist skills and resources. The Council will ensure that the terms of their appointment and the methods by which their value will be assessed are properly agreed and documented, and subjected to regular review.
2.10.3 Capita Asset Services were appointed in 2013 for the three year period 2013-2016. An exercise for the procurement treasury advisory services for the three year period 2016-2019 will be completed during 2016. Any changes to the arrangements and methodologies described in this document following
TMSS, Investment Strategy & MRP policy 2016-2017
Page 18
completion of this exercise will be reported to members at the earliest available opportunity thereafter.
3. Annual Investment Strategy
3.1 Investment policy - objectives
3.1.1 The Council‟s investment policy has regard to the CLG‟s Guidance on Local Government Investments („CLG Investment Guidance‟) and CIPFA‟s Treasury Management in the Public Services: Code of Practice and Cross-Sectoral Guidance Notes 2011Edition („the Treasury Management Code‟).
3.1.2 Accordingly, the Council‟s primary policy objective in relation to its investment activity is to ensure the security of principal sums invested in priority to liquidity (second) and yield (third). The Council will aim to achieve the optimum return on its investments commensurate with the proper levels of security and liquidity. However, yield will only determine investment decisions when deciding between two or more investments satisfying security and liquidity objectives.
3.2 Creditworthiness policy (credit risk management)
3.2.1 Ensuring the security of principal sums invested is achieved through active management of the Council‟s credit risk exposures. This includes placing restrictions and limits on:
the counterparties with whom investments may be placed based on the creditworthiness of the counterparty (section 3.3)
the types of investment instruments that may be used (section 3.4)
the amount invested with any single institution or group of institutions on the Council‟s list of approved counterparties (section 3.5)
the duration of individual investment instruments depending on the financial standing (creditworthiness) of the counterparty (section 3.6).
3.3 Approved investment counterparties
3.3.1 Counterparties with whom investments may be placed are restricted to financial institutions and other bodies of high credit quality. High credit quality financial institutions and other bodies are defined by the Council as those with a minimum long-term rating across all three of the main credit ratings agencies (Fitch, Moody‟s and Standard & Poor‟s) of A- or equivalent (AA+ or equivalent for non-UK sovereigns).
3.3.2 The minimum rating criteria applied by the Council uses the lowest common denominator method of selecting counterparties and applying limits. This means the Council‟s minimum criteria will apply to the lowest available rating for any institution. For example, if an institution is rated by two agencies, one rating meets the Council‟s criteria, the other does not, the institution will fall
TMSS, Investment Strategy & MRP policy 2016-2017
Page 19
outside the lending criteria and will be excluded from the list of approved counterparties.
3.3.3 Whilst credit ratings remain a key source of information they are not the sole determinant of the Council‟s assessment of the credit quality of potential counterparties. Before making investment decisions reference will also be made to:
ratings outlooks (indicating the likely direction of an issuer's rating over the medium term)
credit watches and watchlists (indicating that downgrading or upgrading of the credit rating could be imminent)
sovereign ratings and support mechanisms
credit default swap (CDS) spreads (indicating perceived market sentiment regarding the credit risk associated with a particular institution and an early warning of potential creditworthiness problems which may only belatedly lead to actual changes in credit ratings).
3.3.4 This information is fully integrated into the creditworthiness methodology used by Capita Asset Services to produce its colour coded ratings assessment to indicate the relative creditworthiness of potential counterparties. This rating information is used by the Council to determine the maximum duration of individual investment instruments (see section 3.6).
3.3.5 Other information sources used to assess the suitability of potential investment counterparties include the financial press, share price and other information pertaining to the banking sector and the economic and political environments in which these institutions operate. Regardless of the credit rating assigned to an institution if this additional information casts doubt over its financial standing then that institution will be removed immediately from the Council‟s counterparty lending list.
3.3.6 Credit ratings and creditworthiness information is supplied to the Council by Capita Asset Services and monitored weekly. The Council is also alerted by e-mail when there is an amendment by any of the agencies to the credit rating of an institution. If as a result of downgrade a counterparty no longer meets the Council‟s minimum credit ratings criteria it will be removed immediately from the Council‟s counterparty (dealing) list. Notification of rating changes, rating watches and rating outlooks is provided to officers almost immediately after they occur and this information is considered before dealing. For instance, a negative rating watch applying to a counterparty, currently at the minimum Council criteria, will result in the counterparty being suspended from use, with all others being reviewed in light of market conditions. Capita Asset Services also provide the Council with information relating to movements in credit default swap spreads against the iTraxx benchmark and other market data on a weekly basis. Extreme market movements may result in downgrade of an institution or removal from the Council‟s lending list.
TMSS, Investment Strategy & MRP policy 2016-2017
Page 20
3.4 Approved instruments
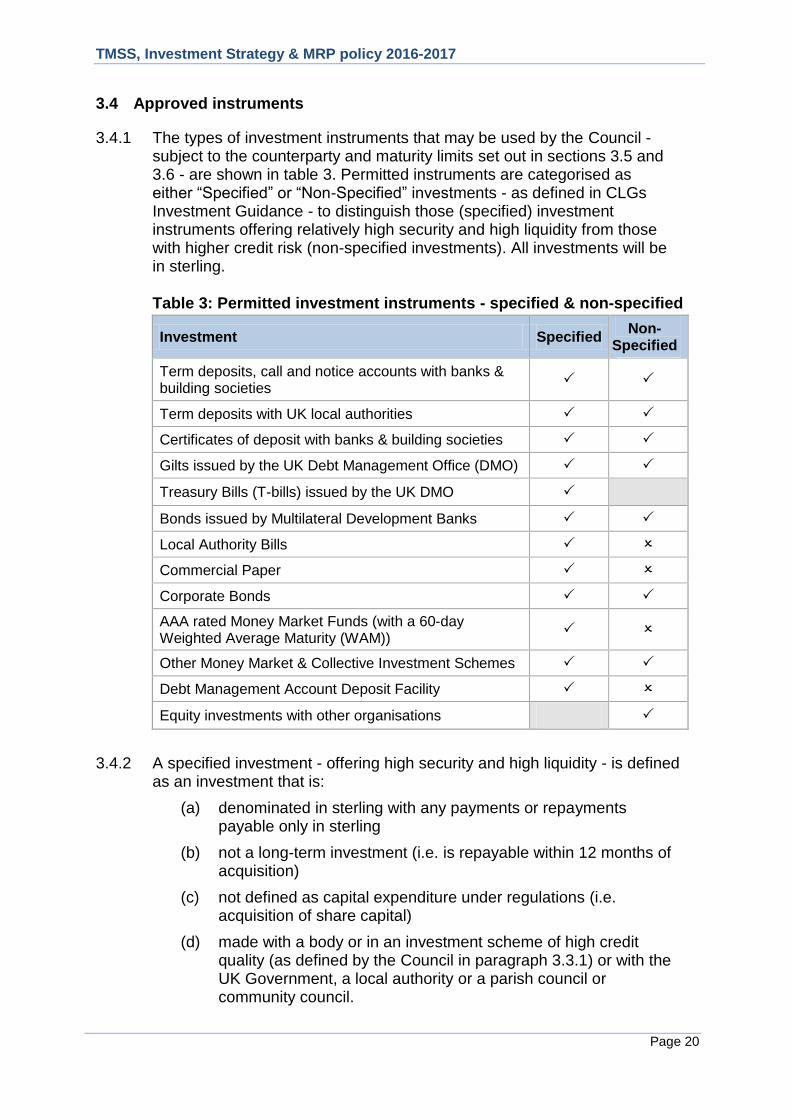
3.4.1 The types of investment instruments that may be used by the Council - subject to the counterparty and maturity limits set out in sections 3.5 and 3.6 - are shown in table 3. Permitted instruments are categorised as either “Specified” or “Non-Specified” investments - as defined in CLGs Investment Guidance - to distinguish those (specified) investment instruments offering relatively high security and high liquidity from those with higher credit risk (non-specified investments). All investments will be in sterling.
Table 3: Permitted investment instruments - specified & non-specified
Investment Specified Non-
Specified
Term deposits, call and notice accounts with banks & building societies
Term deposits with UK local authorities
Certificates of deposit with banks & building societies
Gilts issued by the UK Debt Management Office (DMO)
Treasury Bills (T-bills) issued by the UK DMO
Bonds issued by Multilateral Development Banks
Local Authority Bills
Commercial Paper
Corporate Bonds
AAA rated Money Market Funds (with a 60-day Weighted Average Maturity (WAM))
Other Money Market & Collective Investment Schemes
Debt Management Account Deposit Facility
Equity investments with other organisations
3.4.2 A specified investment - offering high security and high liquidity - is defined as an investment that is:
(a) denominated in sterling with any payments or repayments payable only in sterling
(b) not a long-term investment (i.e. is repayable within 12 months of acquisition)
(c) not defined as capital expenditure under regulations (i.e. acquisition of share capital)
(d) made with a body or in an investment scheme of high credit quality (as defined by the Council in paragraph 3.3.1) or with the UK Government, a local authority or a parish council or community council.
TMSS, Investment Strategy & MRP policy 2016-2017
Page 21
3.4.3 Non-specified investments refer to any investments not meeting the definition of „specified investments‟. The Council currently holds a limited quantity of non-specified investments (unquoted equity shares). These account for less than 1% of the Council‟s investment portfolio. No additional non-specified investments are planned during 2016/17 and all new investments made in 2016/17 will be subject to a maximum maturity of 364 days.
3.4.4 Non-specified investment will only be made with prior approval by the Head of Financial Services and will only be undertaken:
following external credit assessment and due diligence to assess the financial strength and creditworthiness of the counterparty, and
after taking such professional advice as is considered necessary to inform the decision to invest.
3.4.5 In the event that the credit rating of the Council‟s banker fails below the minimum credit criteria referred to above, the Council will continue to use the bank for transactional purposes but will seek to minimise balances as far as is possible.
3.5 Limits on principal sums invested
3.5.1 With the exception of funds placed with HM Treasury‟s Debt Management Office (DMO) the maximum amount that may be placed with any institution or group of institutions that are part of the same banking group is £4 million. For funds placed with the DMO‟s Account Deposit Facility the limit is £12m (subject to maximum maturity of 3 weeks for all sums in excess of £4m).
3.6 Limits on investment maturities
3.6.1 To ensure that access to cash to meet forecast liquidity is not impaired, decisions regarding the maturity of investments instruments must be taken having regard to cash flow requirements. The maturity of investment instruments is also subject to the maximum maturity periods set out below (table 4). These are established to ensure that access to cash is not unduly restricted and to reduce the risk of being locked into an investment whilst the creditworthiness of the counterparty is deteriorating.
3.6.2 The maximum period for which funds may prudently be committed by the Council is determined using the Creditworthiness service provided by Capita Asset Services. This combines credit ratings information provided by the three main credit rating agencies - Fitch, Moody‟s and Standard & Poor‟s - with ratings outlooks, credit watches and sovereign ratings in a weighted scoring system. This is combined with an overlay of credit default swap (CDS) spreads to produce a colour rating to indicate the relative creditworthiness of the counterparty. These colour codes are used to determine the maximum duration for investments made with individual counterparties.
TMSS, Investment Strategy & MRP policy 2016-2017
Page 22
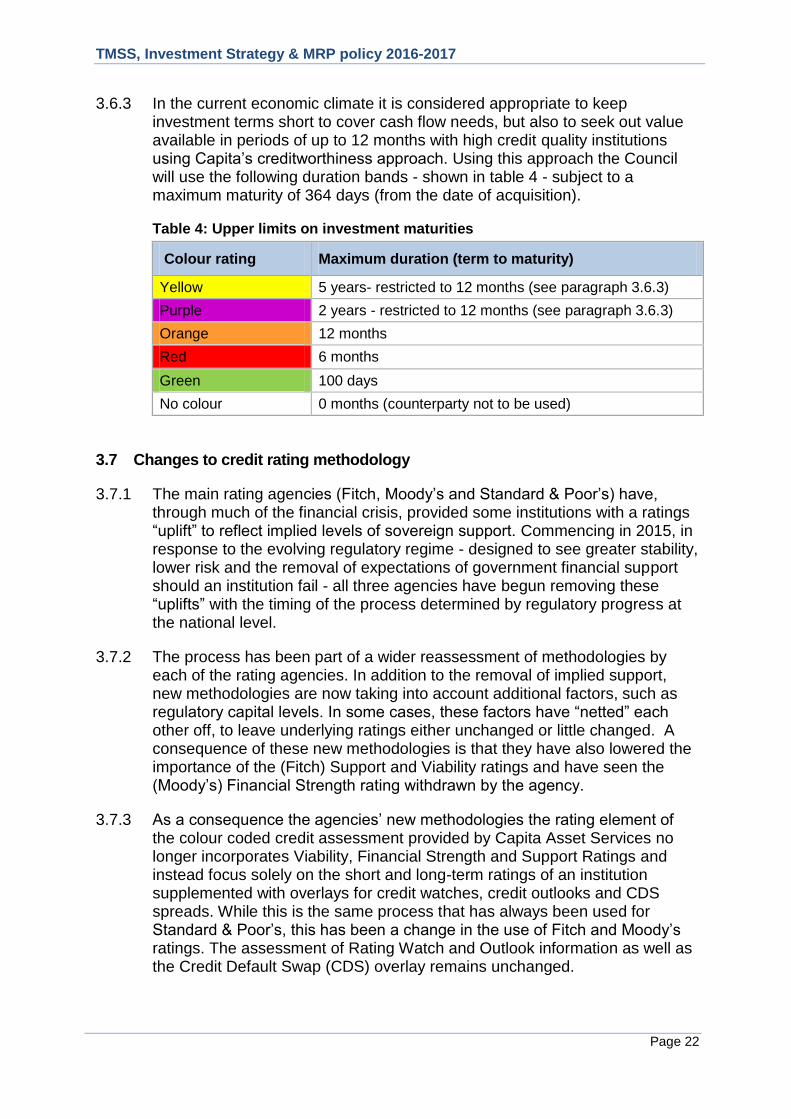
3.6.3 In the current economic climate it is considered appropriate to keep investment terms short to cover cash flow needs, but also to seek out value available in periods of up to 12 months with high credit quality institutions using Capita‟s creditworthiness approach. Using this approach the Council will use the following duration bands - shown in table 4 - subject to a maximum maturity of 364 days (from the date of acquisition).
Table 4: Upper limits on investment maturities
Colour rating Maximum duration (term to maturity)
Yellow 5 years- restricted to 12 months (see paragraph 3.6.3)
Purple 2 years - restricted to 12 months (see paragraph 3.6.3)
Orange 12 months
Red 6 months
Green 100 days
No colour 0 months (counterparty not to be used)
3.7 Changes to credit rating methodology
3.7.1 The main rating agencies (Fitch, Moody‟s and Standard & Poor‟s) have, through much of the financial crisis, provided some institutions with a ratings “uplift” to reflect implied levels of sovereign support. Commencing in 2015, in response to the evolving regulatory regime - designed to see greater stability, lower risk and the removal of expectations of government financial support should an institution fail - all three agencies have begun removing these “uplifts” with the timing of the process determined by regulatory progress at the national level.
3.7.2 The process has been part of a wider reassessment of methodologies by each of the rating agencies. In addition to the removal of implied support, new methodologies are now taking into account additional factors, such as regulatory capital levels. In some cases, these factors have “netted” each other off, to leave underlying ratings either unchanged or little changed. A consequence of these new methodologies is that they have also lowered the importance of the (Fitch) Support and Viability ratings and have seen the (Moody‟s) Financial Strength rating withdrawn by the agency.
3.7.3 As a consequence the agencies‟ new methodologies the rating element of the colour coded credit assessment provided by Capita Asset Services no longer incorporates Viability, Financial Strength and Support Ratings and instead focus solely on the short and long-term ratings of an institution supplemented with overlays for credit watches, credit outlooks and CDS spreads. While this is the same process that has always been used for Standard & Poor‟s, this has been a change in the use of Fitch and Moody‟s ratings. The assessment of Rating Watch and Outlook information as well as the Credit Default Swap (CDS) overlay remains unchanged.
TMSS, Investment Strategy & MRP policy 2016-2017
Page 23
3.7.4 These rating agency changes do not reflect any changes in the underlying status or credit quality of the institution. They are merely reflective of a reassessment of rating agency methodologies in light of enacted and future expected changes to the regulatory environment in which financial institutions operate.
3.7.5 While some banks have received lower credit ratings as a result of these changes, this does not mean that they are suddenly less creditworthy than they were formerly. Rather, in the majority of cases, this mainly reflects the fact that implied sovereign government support has effectively been withdrawn from banks. They are now expected to have sufficiently strong balance sheets to be able to withstand foreseeable adverse financial circumstances without government support. In fact, in many cases, the balance sheets of banks are now much more robust than they were before the 2008 financial crisis when they had higher ratings than now. However, this is not universally applicable, leaving some entities with modestly lower ratings than they had through much of the “support” phase of the financial crisis.
3.8 Reporting arrangements
3.8.1 The Treasury Management and Prudential Codes require the Council to report regularly on its treasury management activities including its performance against all forward-looking prudential and treasury management indicators set out in section 5 below. In meeting the recommended reporting requirements of the Treasury Management Code (outlined in section 1.2 above) the Head of Financial Services will, in addition to this report, submit to the Audit Committee and Full Council:
a mid-year review of the Council‟s treasury management activities covering the six months to 30th September 2016, and
an annual treasury report after the year-end.
The annual report will be submitted as soon as reasonably practicable after the end of the financial year, but in any case no later than 30th September 2017.
3.8.2 A summary of treasury management activities will also be included in the quarterly finance reports submitted to the Council‟s Executive.
TMSS, Investment Strategy & MRP policy 2016-2017
Page 24
4. Minimum revenue provision (MRP) policy statement
4.1 Regulation 27 of the Local Authorities (Capital Finance and Accounting) (England) Regulations 2003 („the 2003 Regulations‟) requires local authorities to „charge to a revenue account a minimum revenue provision (MRP) for that year‟. The minimum revenue provision is an annual amount required to be set aside from the General Fund to meet the capital cost of expenditure funded by borrowing or credit arrangements, that is, capital expenditure not financed from grants, revenue contributions or capital receipts.
4.2 Regulation 27 also allows authorities to charge to a revenue account any amount, in addition to the MRP, in respect of the financing of capital expenditure incurred in the current financial year or any financial year before the current year (voluntary revenue provision - VRP).
4.3 The calculation of MRP is covered in regulation 28 of the 2003 Regulations. From 31 March 2008, Regulation 28, as amended by Regulation 4(1) of the Local Authorities (Capital Finance and Accounting) (England) (Amendment) Regulations 2008 („the 2008 Regulations‟), requires each authority to:
'determine for the current financial year an amount of minimum revenue provision which it considers to be prudent.‟
4.4 The 2003 Regulations (as amended) are accompanied by statutory guidance on minimum revenue provision, issued by CLG under section 21(1A) of the Local Government Act 2003 („the 2003 Act‟). In meeting the requirement to „make prudent provision‟, the 2003 Act requires local authorities to „have regard to‟ this guidance. This means that an authority must consider what the statutory guidance says. It does not mean that a local authority is obligated to follow the guidance. However, if an authority does decide to depart from the guidance, it must be able to show good reasons for doing so.
4.5 The current version of regulation 28 was implemented by the 2008 regulations. It came into force on 31 March 2008 and, along with the statutory guidance issued by CLG, is effective for 2007/08 and later years. Before this change regulation 28 set out detailed formula - based on an authority‟s capital financing requirement - which authorities were required to follow when calculating MRP.
4.6 Neither the 2003 Regulations nor the statutory guidance define the term “prudent provision”. The statutory guidance does however establish the broad aim of making prudent provision, which is to ensure that debt is repaid over a period:
commensurate with the period over which the capital expenditure provides benefits, or
for borrowing supported by central government funding (RSG), over the period implicit in the determination of that funding.
TMSS, Investment Strategy & MRP policy 2016-2017
Page 25
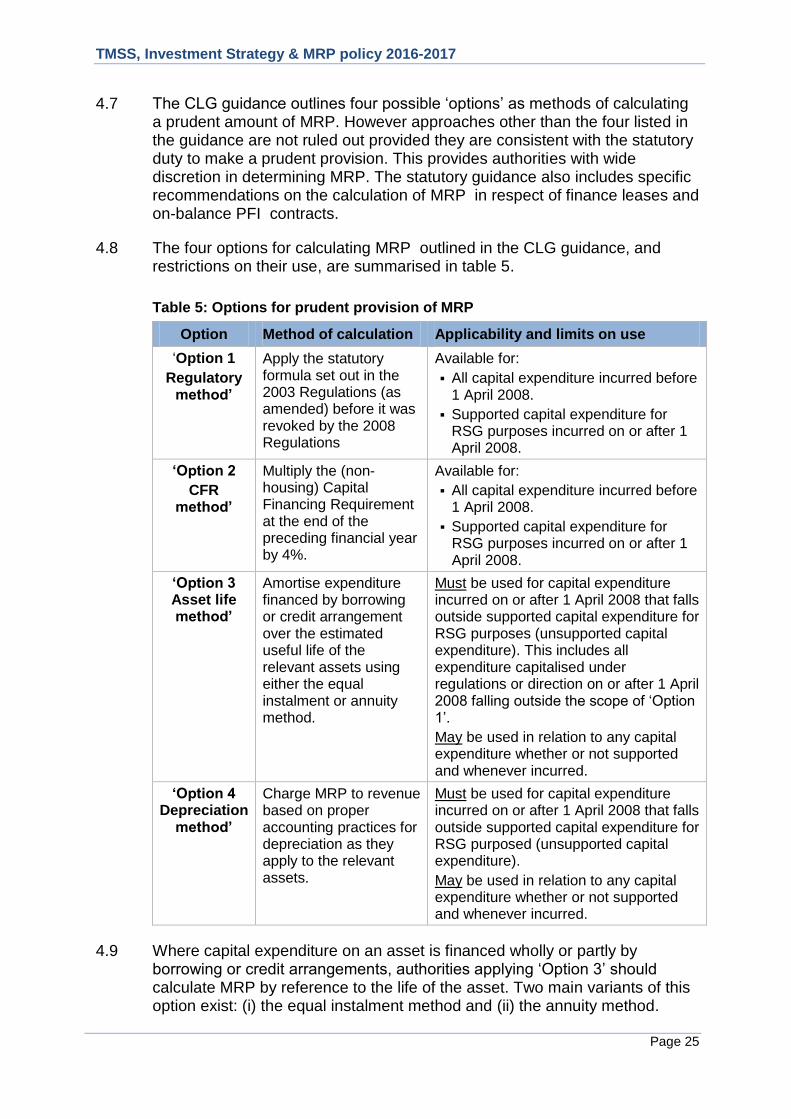
4.7 The CLG guidance outlines four possible „options‟ as methods of calculating a prudent amount of MRP. However approaches other than the four listed in the guidance are not ruled out provided they are consistent with the statutory duty to make a prudent provision. This provides authorities with wide discretion in determining MRP. The statutory guidance also includes specific recommendations on the calculation of MRP in respect of finance leases and on-balance PFI contracts.
4.8 The four options for calculating MRP outlined in the CLG guidance, and restrictions on their use, are summarised in table 5.
Table 5: Options for prudent provision of MRP
Option Method of calculation Applicability and limits on use
„Option 1
Regulatory method’
Apply the statutory formula set out in the 2003 Regulations (as amended) before it was revoked by the 2008 Regulations
Available for:
All capital expenditure incurred before 1 April 2008.
Supported capital expenditure for RSG purposes incurred on or after 1 April 2008.
‘Option 2
CFR method’
Multiply the (non-housing) Capital Financing Requirement at the end of the preceding financial year by 4%.
Available for:
All capital expenditure incurred before 1 April 2008.
Supported capital expenditure for RSG purposes incurred on or after 1 April 2008.
‘Option 3 Asset life method’
Amortise expenditure financed by borrowing or credit arrangement over the estimated useful life of the relevant assets using either the equal instalment or annuity method.
Must be used for capital expenditure incurred on or after 1 April 2008 that falls outside supported capital expenditure for RSG purposes (unsupported capital expenditure). This includes all expenditure capitalised under regulations or direction on or after 1 April 2008 falling outside the scope of „Option 1‟.
May be used in relation to any capital expenditure whether or not supported and whenever incurred.
‘Option 4 Depreciation
method’
Charge MRP to revenue based on proper accounting practices for depreciation as they apply to the relevant assets.
Must be used for capital expenditure incurred on or after 1 April 2008 that falls outside supported capital expenditure for RSG purposed (unsupported capital expenditure).
May be used in relation to any capital expenditure whether or not supported and whenever incurred.
4.9 Where capital expenditure on an asset is financed wholly or partly by borrowing or credit arrangements, authorities applying „Option 3‟ should calculate MRP by reference to the life of the asset. Two main variants of this option exist: (i) the equal instalment method and (ii) the annuity method.
TMSS, Investment Strategy & MRP policy 2016-2017
Page 26
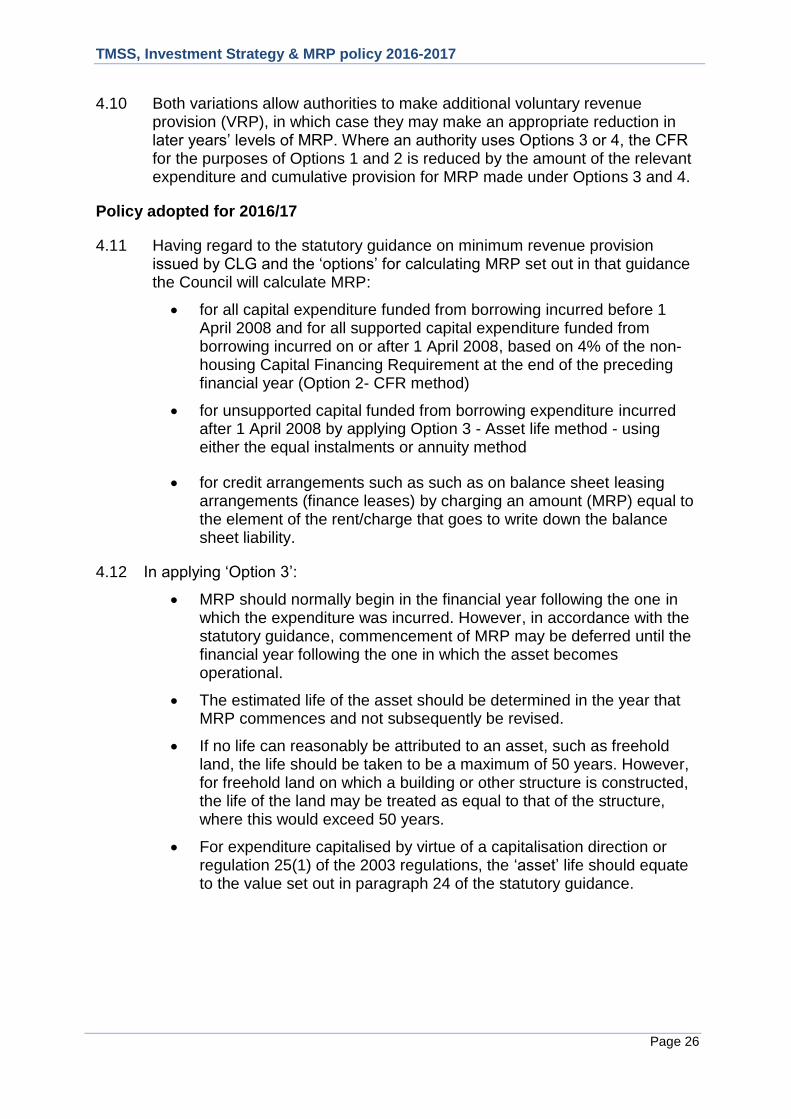
4.10 Both variations allow authorities to make additional voluntary revenue provision (VRP), in which case they may make an appropriate reduction in later years‟ levels of MRP. Where an authority uses Options 3 or 4, the CFR for the purposes of Options 1 and 2 is reduced by the amount of the relevant expenditure and cumulative provision for MRP made under Options 3 and 4.
Policy adopted for 2016/17
4.11 Having regard to the statutory guidance on minimum revenue provision issued by CLG and the „options‟ for calculating MRP set out in that guidance the Council will calculate MRP:
for all capital expenditure funded from borrowing incurred before 1 April 2008 and for all supported capital expenditure funded from borrowing incurred on or after 1 April 2008, based on 4% of the non-housing Capital Financing Requirement at the end of the preceding financial year (Option 2- CFR method)
for unsupported capital funded from borrowing expenditure incurred after 1 April 2008 by applying Option 3 - Asset life method - using either the equal instalments or annuity method
for credit arrangements such as such as on balance sheet leasing arrangements (finance leases) by charging an amount (MRP) equal to the element of the rent/charge that goes to write down the balance sheet liability.
4.12 In applying „Option 3‟:
MRP should normally begin in the financial year following the one in which the expenditure was incurred. However, in accordance with the statutory guidance, commencement of MRP may be deferred until the financial year following the one in which the asset becomes operational.
The estimated life of the asset should be determined in the year that MRP commences and not subsequently be revised.
If no life can reasonably be attributed to an asset, such as freehold land, the life should be taken to be a maximum of 50 years. However, for freehold land on which a building or other structure is constructed, the life of the land may be treated as equal to that of the structure, where this would exceed 50 years.
For expenditure capitalised by virtue of a capitalisation direction or regulation 25(1) of the 2003 regulations, the „asset‟ life should equate to the value set out in paragraph 24 of the statutory guidance.
TMSS, Investment Strategy & MRP policy 2016-2017
Page 27
5. Prudential and treasury indicators 2016/17 – 2018/19
5.1 Indicators required by the Prudential Code
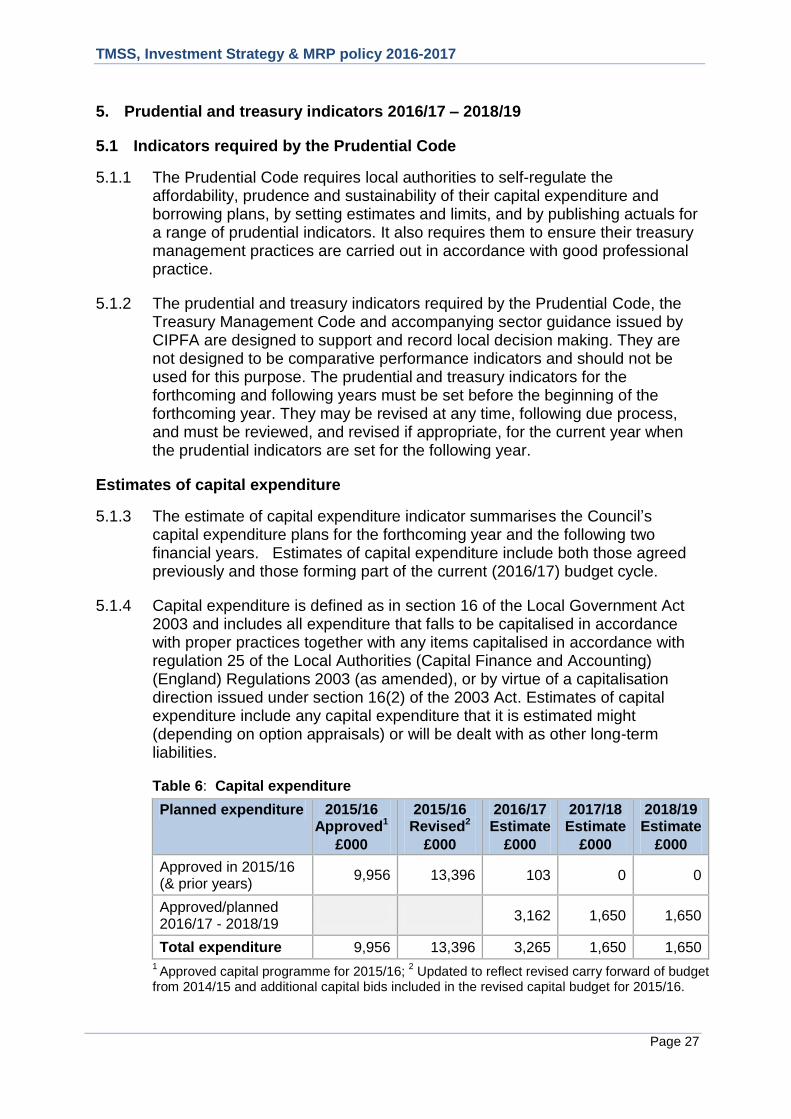
5.1.1 The Prudential Code requires local authorities to self-regulate the affordability, prudence and sustainability of their capital expenditure and borrowing plans, by setting estimates and limits, and by publishing actuals for a range of prudential indicators. It also requires them to ensure their treasury management practices are carried out in accordance with good professional practice.
5.1.2 The prudential and treasury indicators required by the Prudential Code, the Treasury Management Code and accompanying sector guidance issued by CIPFA are designed to support and record local decision making. They are not designed to be comparative performance indicators and should not be used for this purpose. The prudential and treasury indicators for the forthcoming and following years must be set before the beginning of the forthcoming year. They may be revised at any time, following due process, and must be reviewed, and revised if appropriate, for the current year when the prudential indicators are set for the following year.
Estimates of capital expenditure
5.1.3 The estimate of capital expenditure indicator summarises the Council‟s capital expenditure plans for the forthcoming year and the following two financial years. Estimates of capital expenditure include both those agreed previously and those forming part of the current (2016/17) budget cycle.
5.1.4 Capital expenditure is defined as in section 16 of the Local Government Act 2003 and includes all expenditure that falls to be capitalised in accordance with proper practices together with any items capitalised in accordance with regulation 25 of the Local Authorities (Capital Finance and Accounting) (England) Regulations 2003 (as amended), or by virtue of a capitalisation direction issued under section 16(2) of the 2003 Act. Estimates of capital expenditure include any capital expenditure that it is estimated might (depending on option appraisals) or will be dealt with as other long-term liabilities.
Table 6: Capital expenditure
Planned expenditure 2015/16 Approved1
£000
2015/16 Revised2
£000
2016/17 Estimate
£000
2017/18 Estimate
£000
2018/19 Estimate
£000
Approved in 2015/16 (& prior years)
9,956 13,396 103 0 0
Approved/planned 2016/17 - 2018/19
3,162 1,650 1,650
Total expenditure 9,956 13,396 3,265 1,650 1,650 1 Approved capital programme for 2015/16;
2 Updated to reflect revised carry forward of budget
from 2014/15 and additional capital bids included in the revised capital budget for 2015/16.
TMSS, Investment Strategy & MRP policy 2016-2017
Page 28
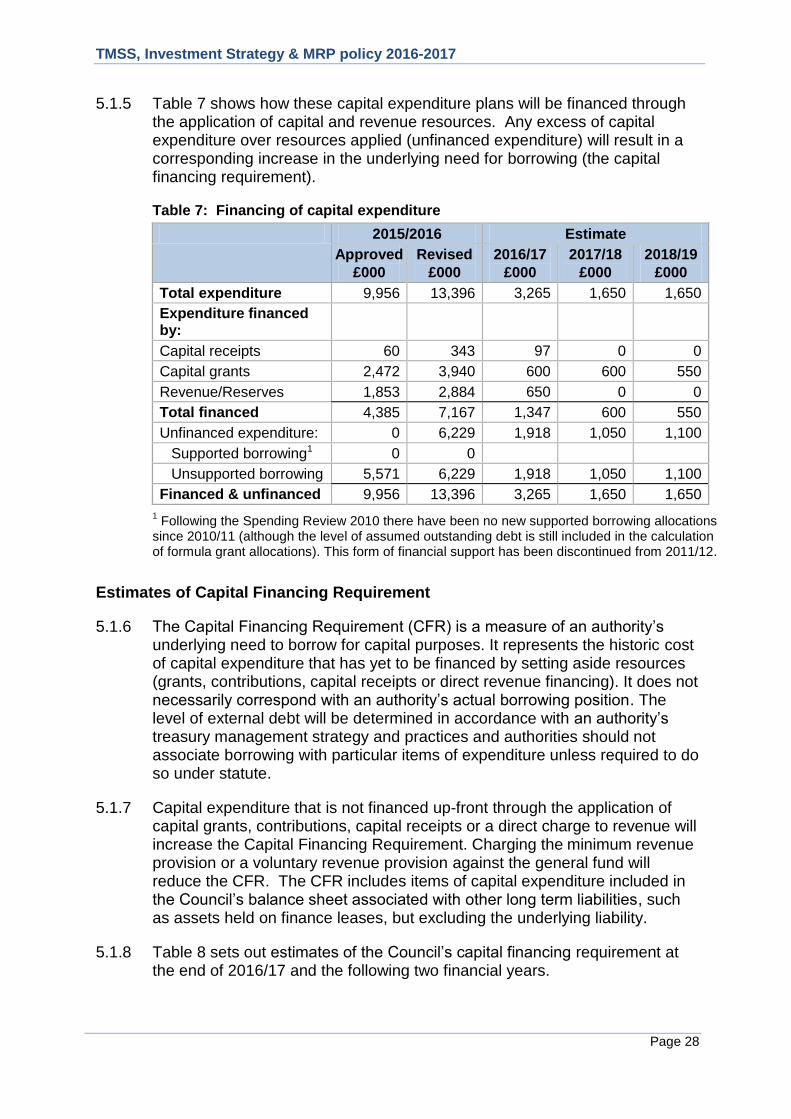
5.1.5 Table 7 shows how these capital expenditure plans will be financed through the application of capital and revenue resources. Any excess of capital expenditure over resources applied (unfinanced expenditure) will result in a corresponding increase in the underlying need for borrowing (the capital financing requirement).
Table 7: Financing of capital expenditure
2015/2016 Estimate
Approved
£000
Revised
£000
2016/17
£000
2017/18
£000
2018/19
£000
Total expenditure 9,956 13,396 3,265 1,650 1,650
Expenditure financed by:
Capital receipts 60 343 97 0 0
Capital grants 2,472 3,940 600 600 550
Revenue/Reserves 1,853 2,884 650 0 0
Total financed 4,385 7,167 1,347 600 550
Unfinanced expenditure: 0 6,229 1,918 1,050 1,100
Supported borrowing1 0 0
Unsupported borrowing 5,571 6,229 1,918 1,050 1,100
Financed & unfinanced 9,956 13,396 3,265 1,650 1,650
1 Following the Spending Review 2010 there have been no new supported borrowing allocations
since 2010/11 (although the level of assumed outstanding debt is still included in the calculation of formula grant allocations). This form of financial support has been discontinued from 2011/12.
Estimates of Capital Financing Requirement
5.1.6 The Capital Financing Requirement (CFR) is a measure of an authority‟s underlying need to borrow for capital purposes. It represents the historic cost of capital expenditure that has yet to be financed by setting aside resources (grants, contributions, capital receipts or direct revenue financing). It does not necessarily correspond with an authority‟s actual borrowing position. The level of external debt will be determined in accordance with an authority‟s treasury management strategy and practices and authorities should not associate borrowing with particular items of expenditure unless required to do so under statute.
5.1.7 Capital expenditure that is not financed up-front through the application of capital grants, contributions, capital receipts or a direct charge to revenue will increase the Capital Financing Requirement. Charging the minimum revenue provision or a voluntary revenue provision against the general fund will reduce the CFR. The CFR includes items of capital expenditure included in the Council‟s balance sheet associated with other long term liabilities, such as assets held on finance leases, but excluding the underlying liability.
5.1.8 Table 8 sets out estimates of the Council‟s capital financing requirement at the end of 2016/17 and the following two financial years.
TMSS, Investment Strategy & MRP policy 2016-2017
Page 29
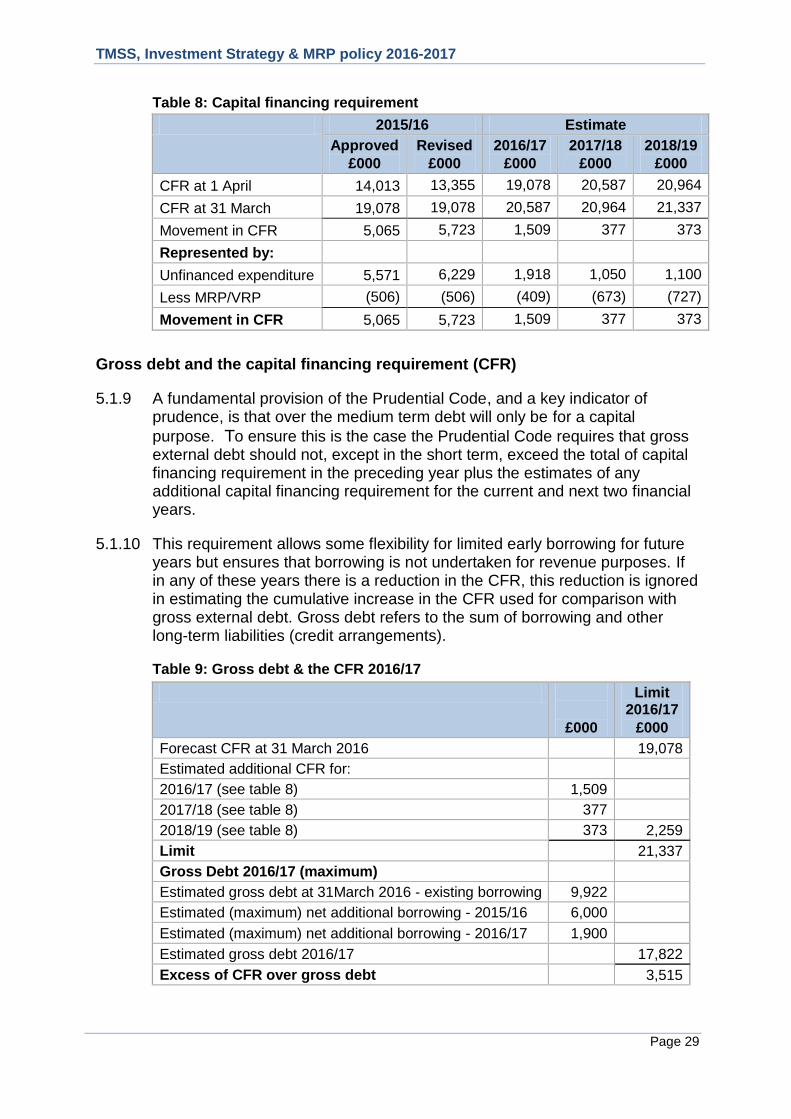
Table 8: Capital financing requirement
2015/16 Estimate
Approved
£000
Revised
£000
2016/17
£000
2017/18
£000
2018/19
£000
CFR at 1 April 14,013 13,355 19,078 20,587 20,964
CFR at 31 March 19,078 19,078 20,587 20,964 21,337
Movement in CFR 5,065 5,723 1,509 377 373
Represented by:
Unfinanced expenditure 5,571 6,229 1,918 1,050 1,100
Less MRP/VRP (506) (506) (409) (673) (727)
Movement in CFR 5,065 5,723 1,509 377 373
Gross debt and the capital financing requirement (CFR)
5.1.9 A fundamental provision of the Prudential Code, and a key indicator of prudence, is that over the medium term debt will only be for a capital
purpose. To ensure this is the case the Prudential Code requires that gross external debt should not, except in the short term, exceed the total of capital financing requirement in the preceding year plus the estimates of any additional capital financing requirement for the current and next two financial years.
5.1.10 This requirement allows some flexibility for limited early borrowing for future years but ensures that borrowing is not undertaken for revenue purposes. If in any of these years there is a reduction in the CFR, this reduction is ignored in estimating the cumulative increase in the CFR used for comparison with gross external debt. Gross debt refers to the sum of borrowing and other long-term liabilities (credit arrangements).
Table 9: Gross debt & the CFR 2016/17
£000
Limit 2016/17
£000
Forecast CFR at 31 March 2016 19,078
Estimated additional CFR for:
2016/17 (see table 8) 1,509
2017/18 (see table 8) 377
2018/19 (see table 8) 373 2,259
Limit 21,337
Gross Debt 2016/17 (maximum)
Estimated gross debt at 31March 2016 - existing borrowing 9,922
Estimated (maximum) net additional borrowing - 2015/16 6,000
Estimated (maximum) net additional borrowing - 2016/17 1,900
Estimated gross debt 2016/17 17,822
Excess of CFR over gross debt 3,515
TMSS, Investment Strategy & MRP policy 2016-2017
Page 30
5.1.11 At 31st December 2015 the Council was under-borrowed against its capital financing requirement by approximately £4.1m. The Council does not anticpate any difficulties in complying with this indicator during 2016/17 or the following two financial years.
Authorised limit for external debt
5.1.12 The Authorised Borrowing Limit represents the statutory limit on borrowing determined under section 3 of the Local Government Act 2003 (Affordable Limit). It imposes an upper limit on the Council‟s gross external debt (excluding investments), separately identifying borrowing (external loans) from other long-term liabilities (for example finance lease liabilities). Breach of the Affordable Borrowing Limit is prohibited by section 2(1)(a) of the Local Government Act 2003.
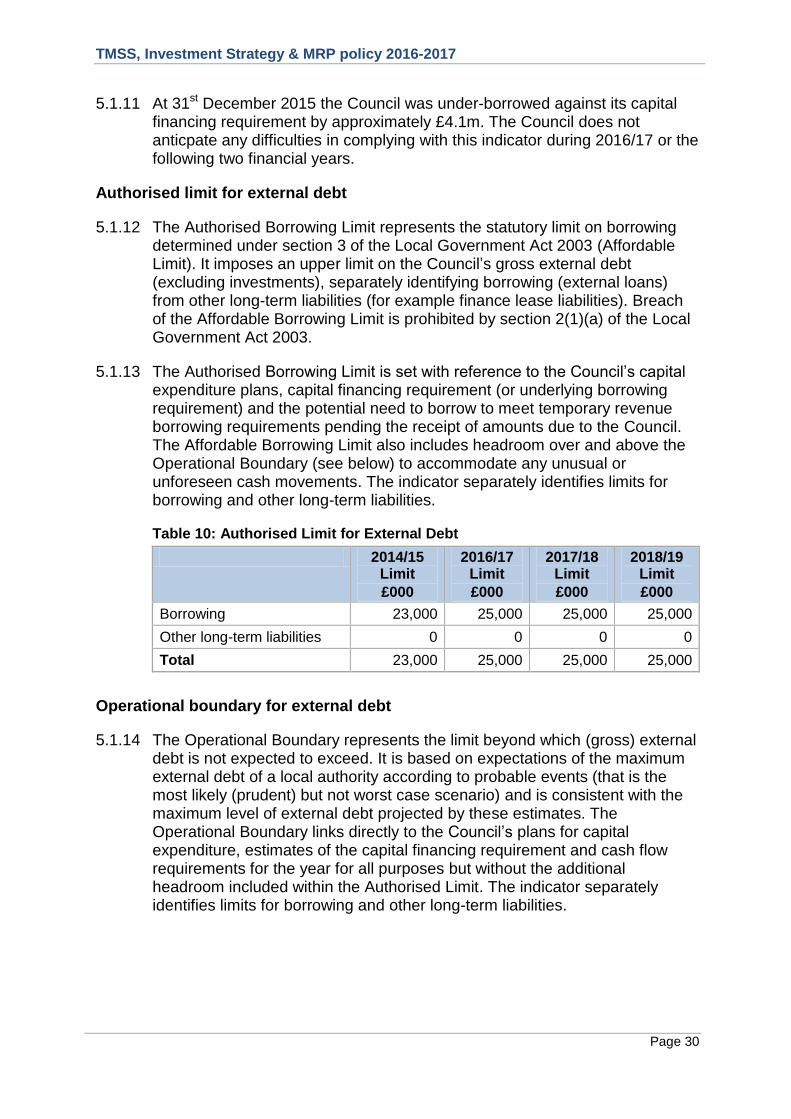
5.1.13 The Authorised Borrowing Limit is set with reference to the Council‟s capital expenditure plans, capital financing requirement (or underlying borrowing requirement) and the potential need to borrow to meet temporary revenue borrowing requirements pending the receipt of amounts due to the Council. The Affordable Borrowing Limit also includes headroom over and above the Operational Boundary (see below) to accommodate any unusual or unforeseen cash movements. The indicator separately identifies limits for borrowing and other long-term liabilities.
Table 10: Authorised Limit for External Debt
2014/15 Limit
£000
2016/17 Limit
£000
2017/18 Limit
£000
2018/19 Limit
£000
Borrowing 23,000 25,000 25,000 25,000
Other long-term liabilities 0 0 0 0
Total 23,000 25,000 25,000 25,000
Operational boundary for external debt
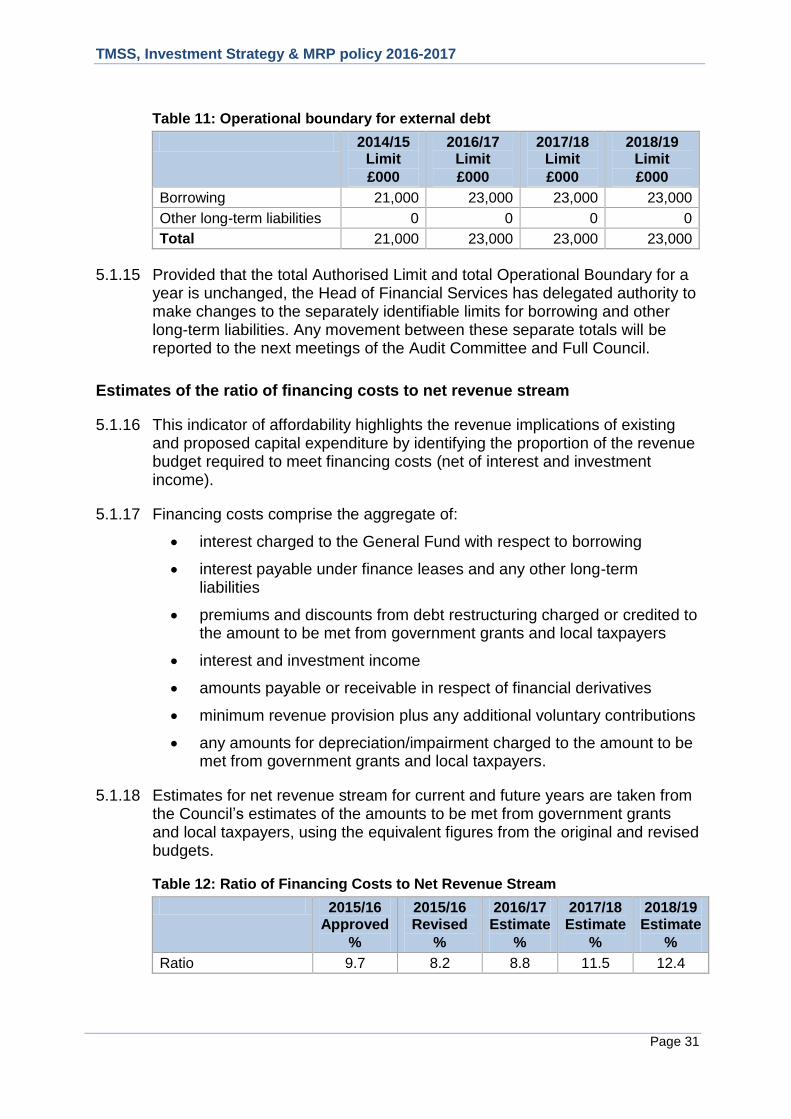
5.1.14 The Operational Boundary represents the limit beyond which (gross) external debt is not expected to exceed. It is based on expectations of the maximum external debt of a local authority according to probable events (that is the most likely (prudent) but not worst case scenario) and is consistent with the maximum level of external debt projected by these estimates. The Operational Boundary links directly to the Council‟s plans for capital expenditure, estimates of the capital financing requirement and cash flow requirements for the year for all purposes but without the additional headroom included within the Authorised Limit. The indicator separately identifies limits for borrowing and other long-term liabilities.
TMSS, Investment Strategy & MRP policy 2016-2017
Page 31
Table 11: Operational boundary for external debt
2014/15 Limit
£000
2016/17 Limit
£000
2017/18 Limit
£000
2018/19 Limit
£000
Borrowing 21,000 23,000 23,000 23,000
Other long-term liabilities 0 0 0 0
Total 21,000 23,000 23,000 23,000
5.1.15 Provided that the total Authorised Limit and total Operational Boundary for a year is unchanged, the Head of Financial Services has delegated authority to make changes to the separately identifiable limits for borrowing and other long-term liabilities. Any movement between these separate totals will be reported to the next meetings of the Audit Committee and Full Council.
Estimates of the ratio of financing costs to net revenue stream
5.1.16 This indicator of affordability highlights the revenue implications of existing and proposed capital expenditure by identifying the proportion of the revenue budget required to meet financing costs (net of interest and investment income).
5.1.17 Financing costs comprise the aggregate of:
interest charged to the General Fund with respect to borrowing
interest payable under finance leases and any other long-term liabilities
premiums and discounts from debt restructuring charged or credited to the amount to be met from government grants and local taxpayers
interest and investment income
amounts payable or receivable in respect of financial derivatives
minimum revenue provision plus any additional voluntary contributions
any amounts for depreciation/impairment charged to the amount to be met from government grants and local taxpayers.
5.1.18 Estimates for net revenue stream for current and future years are taken from the Council‟s estimates of the amounts to be met from government grants and local taxpayers, using the equivalent figures from the original and revised budgets.
Table 12: Ratio of Financing Costs to Net Revenue Stream
2015/16 Approved
%
2015/16 Revised
%
2016/17 Estimate
%
2017/18Estimate
%
2018/19 Estimate
%
Ratio 9.7 8.2 8.8 11.5 12.4
TMSS, Investment Strategy & MRP policy 2016-2017
Page 32
Estimates of the incremental impact of capital investment decisions on the council tax
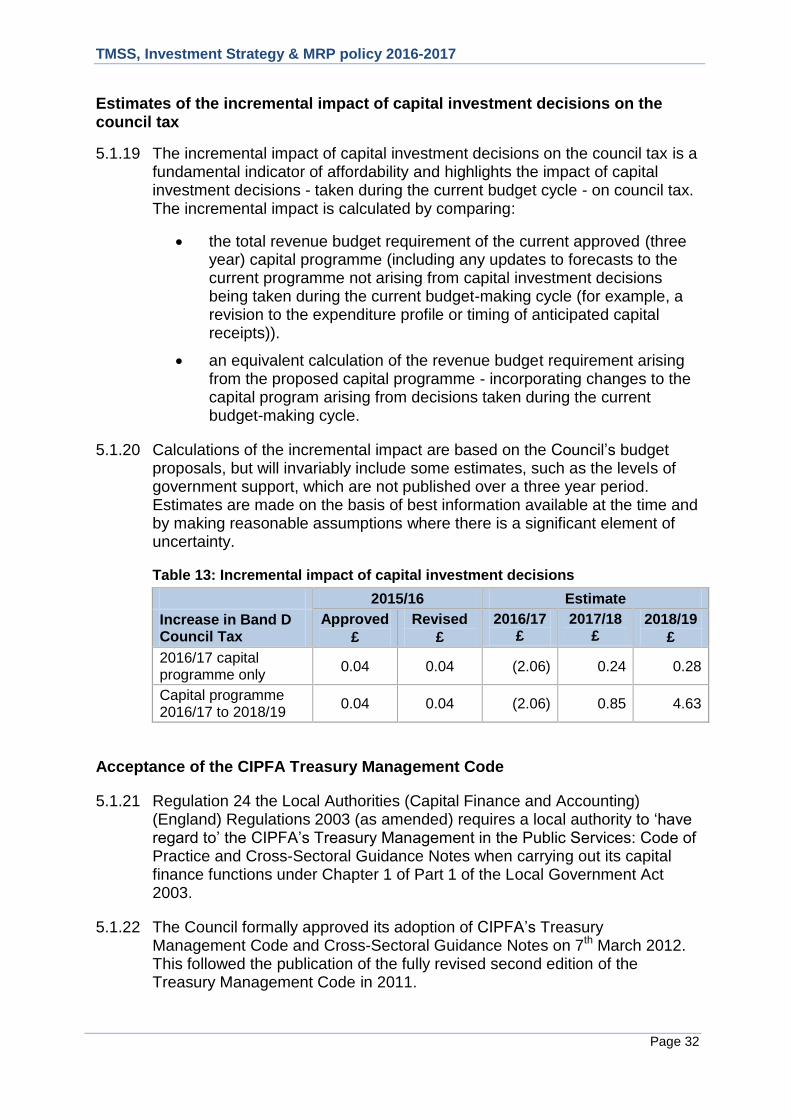
5.1.19 The incremental impact of capital investment decisions on the council tax is a fundamental indicator of affordability and highlights the impact of capital investment decisions - taken during the current budget cycle - on council tax. The incremental impact is calculated by comparing:
the total revenue budget requirement of the current approved (three year) capital programme (including any updates to forecasts to the current programme not arising from capital investment decisions being taken during the current budget-making cycle (for example, a revision to the expenditure profile or timing of anticipated capital receipts)).
an equivalent calculation of the revenue budget requirement arising from the proposed capital programme - incorporating changes to the capital program arising from decisions taken during the current budget-making cycle.
5.1.20 Calculations of the incremental impact are based on the Council‟s budget proposals, but will invariably include some estimates, such as the levels of government support, which are not published over a three year period. Estimates are made on the basis of best information available at the time and by making reasonable assumptions where there is a significant element of uncertainty.
Table 13: Incremental impact of capital investment decisions
2015/16 Estimate
Increase in Band D Council Tax
Approved
£
Revised
£
2016/17 £
2017/18 £
2018/19
£
2016/17 capital programme only
0.04 0.04 (2.06) 0.24 0.28
Capital programme 2016/17 to 2018/19
0.04 0.04 (2.06) 0.85 4.63
Acceptance of the CIPFA Treasury Management Code
5.1.21 Regulation 24 the Local Authorities (Capital Finance and Accounting) (England) Regulations 2003 (as amended) requires a local authority to „have regard to‟ the CIPFA‟s Treasury Management in the Public Services: Code of Practice and Cross-Sectoral Guidance Notes when carrying out its capital finance functions under Chapter 1 of Part 1 of the Local Government Act 2003.
5.1.22 The Council formally approved its adoption of CIPFA‟s Treasury Management Code and Cross-Sectoral Guidance Notes on 7th March 2012. This followed the publication of the fully revised second edition of the Treasury Management Code in 2011.
TMSS, Investment Strategy & MRP policy 2016-2017
Page 33
5.1.23 Adoption of the Treasury Management Code demonstrates the Council‟s treasury management practices are carried out in accordance with good practice. This includes having in place:
formally adopted, codified treasury objectives, policies and practices
a clear separation of responsibilities between treasury management policy formulation and treasury management execution
proper reporting arrangements
arrangements which give priority to identifying, monitoring and controlling risk.
5.2 Indicators required by the Treasury Management Code
5.2.1 In addition to the indicators required by the Prudential Code there are also a number of treasury indicators required by the Treasury Management Code and accompanying sector guidance. These are:
upper limits on fixed interest and variable interest exposures
upper and lower limits to the maturity structure of its borrowing
upper limits on the total of principal sums invested longer than 364 days.
5.2.2 These treasury management indicators specify ranges (rather than targets) designed to limit the Council‟s exposure to interest rate, liquidity and refinancing risks.
Upper limits on fixed interest and variable interest exposures
5.2.3 The upper limits provided by these indicators establish ranges within which the Council will manage its exposures to fixed and variable interest rates. The sector guidance which accompanies the Treasury Management Code allows these limits to be calculated on the basis of absolute amounts or as a percentage of the Council‟s net interest or net principal sum outstanding on its borrowing/investments. Table 14a shows the upper limits on net exposures to fixed and variable rate interest rates expressed as a percentage of the Council‟s projected net interest (payable). Tables 14b and 14c show the limits based on principal sums outstanding in respect of fixed and variable investments and borrowings expressed as percentages of total (gross) investments and borrowing respectively.
5.2.4 The upper limit for variable rate exposure has been set at a level to ensure
maximum flexibility of operation given the Council‟s interest rate exposure is significantly influenced by historic fixed rate debt from the PWLB. Investments will be short-term and at fixed or variable rates depending on the Council‟s requirements and prevailing interest rates. The limit allows for the use of variable rate debt to offset exposure to changes in short-term rates on investments.
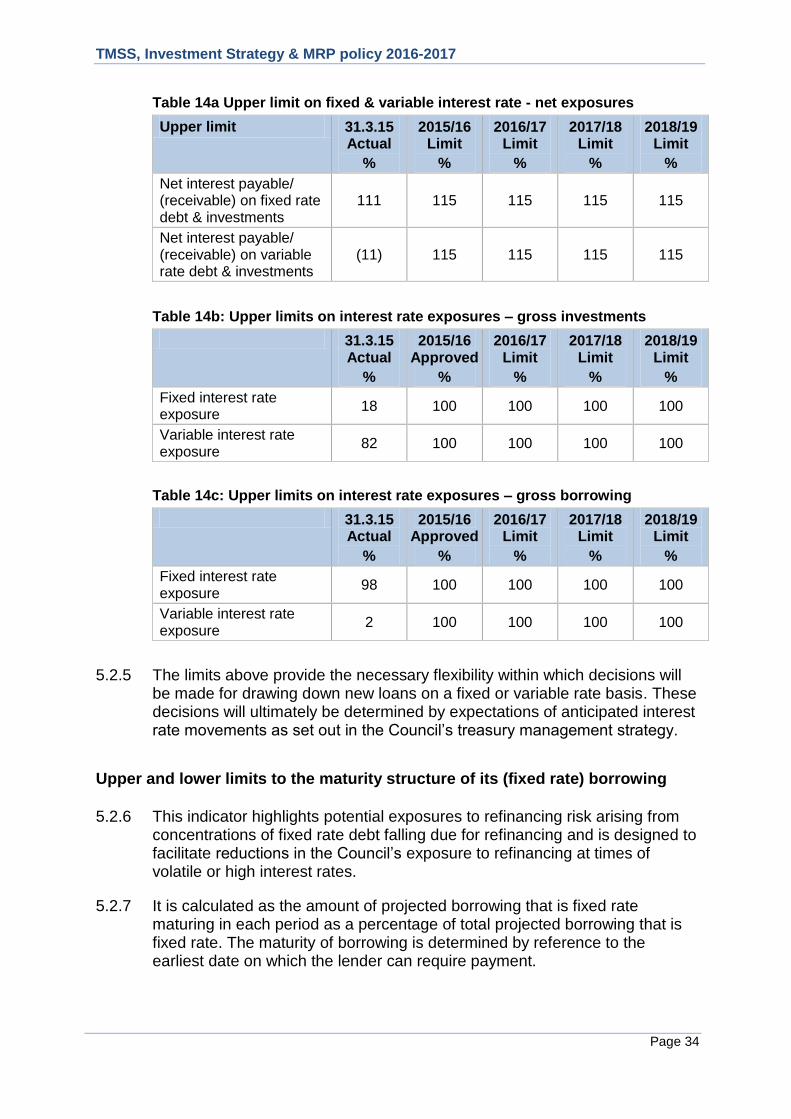
TMSS, Investment Strategy & MRP policy 2016-2017
Page 34
Table 14a Upper limit on fixed & variable interest rate - net exposures
Upper limit 31.3.15 Actual
%
2015/16 Limit
%
2016/17 Limit
%
2017/18 Limit
%
2018/19 Limit
%
Net interest payable/ (receivable) on fixed rate debt & investments
111 115 115 115 115
Net interest payable/ (receivable) on variable rate debt & investments
(11) 115 115 115 115
Table 14b: Upper limits on interest rate exposures – gross investments
31.3.15 Actual
%
2015/16 Approved
%
2016/17 Limit
%
2017/18 Limit
%
2018/19 Limit
%
Fixed interest rate exposure
18 100 100 100 100
Variable interest rate exposure
82 100 100 100 100
Table 14c: Upper limits on interest rate exposures – gross borrowing
31.3.15 Actual
%
2015/16 Approved
%
2016/17 Limit
%
2017/18 Limit
%
2018/19 Limit
%
Fixed interest rate exposure
98 100 100 100 100
Variable interest rate exposure
2 100 100 100 100
5.2.5 The limits above provide the necessary flexibility within which decisions will be made for drawing down new loans on a fixed or variable rate basis. These decisions will ultimately be determined by expectations of anticipated interest rate movements as set out in the Council‟s treasury management strategy.
Upper and lower limits to the maturity structure of its (fixed rate) borrowing
5.2.6 This indicator highlights potential exposures to refinancing risk arising from concentrations of fixed rate debt falling due for refinancing and is designed to facilitate reductions in the Council‟s exposure to refinancing at times of volatile or high interest rates.
5.2.7 It is calculated as the amount of projected borrowing that is fixed rate maturing in each period as a percentage of total projected borrowing that is fixed rate. The maturity of borrowing is determined by reference to the earliest date on which the lender can require payment.
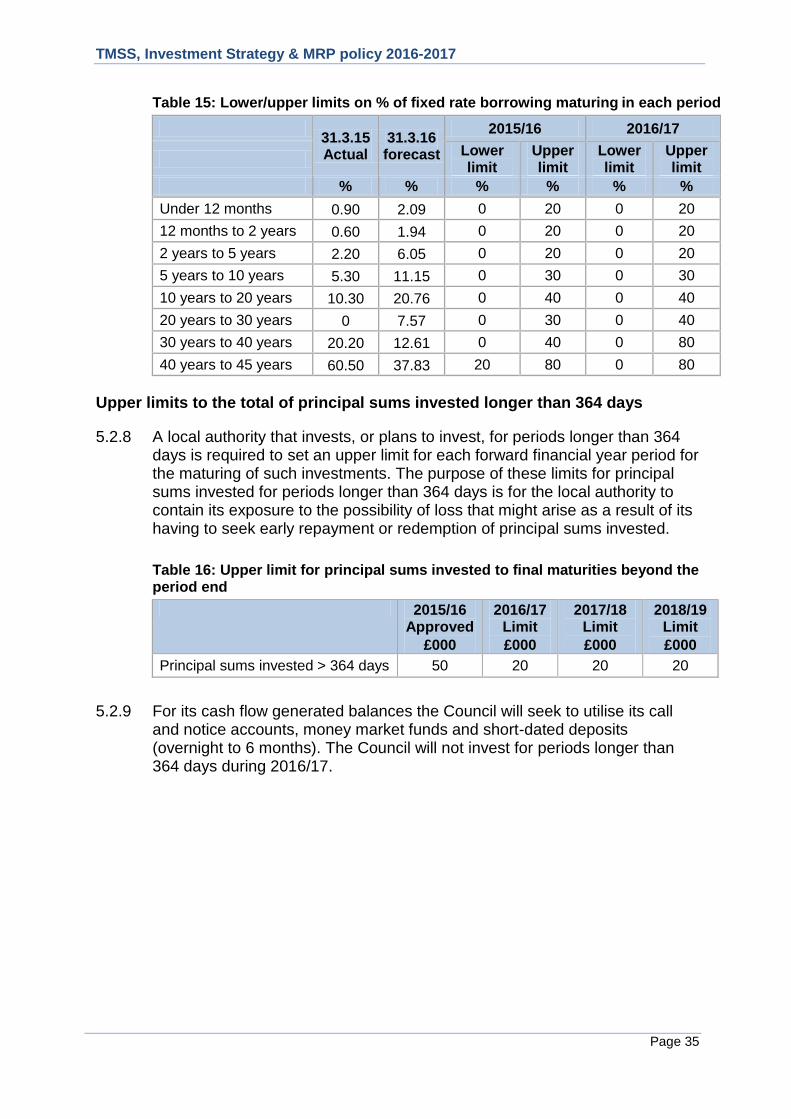
TMSS, Investment Strategy & MRP policy 2016-2017
Page 35
Table 15: Lower/upper limits on % of fixed rate borrowing maturing in each period
31.3.15 Actual
31.3.16 forecast
2015/16 2016/17
Lower limit
Upper limit
Lower limit
Upper limit
% % % % % %
Under 12 months 0.90 2.09 0 20 0 20
12 months to 2 years 0.60 1.94 0 20 0 20
2 years to 5 years 2.20 6.05 0 20 0 20
5 years to 10 years 5.30 11.15 0 30 0 30
10 years to 20 years 10.30 20.76 0 40 0 40
20 years to 30 years 0 7.57 0 30 0 40
30 years to 40 years 20.20 12.61 0 40 0 80
40 years to 45 years 60.50 37.83 20 80 0 80
Upper limits to the total of principal sums invested longer than 364 days
5.2.8 A local authority that invests, or plans to invest, for periods longer than 364 days is required to set an upper limit for each forward financial year period for the maturing of such investments. The purpose of these limits for principal sums invested for periods longer than 364 days is for the local authority to contain its exposure to the possibility of loss that might arise as a result of its having to seek early repayment or redemption of principal sums invested.
Table 16: Upper limit for principal sums invested to final maturities beyond the period end
2015/16 Approved
£000
2016/17 Limit
£000
2017/18 Limit
£000
2018/19 Limit
£000
Principal sums invested > 364 days 50 20 20 20
5.2.9 For its cash flow generated balances the Council will seek to utilise its call and notice accounts, money market funds and short-dated deposits (overnight to 6 months). The Council will not invest for periods longer than 364 days during 2016/17.

TMSS, Investment Strategy & MRP policy 2016-2017
Page 36
6. Appendices
A. Interest Rate Forecasts 2016 - 2019
B. Credit Ratings
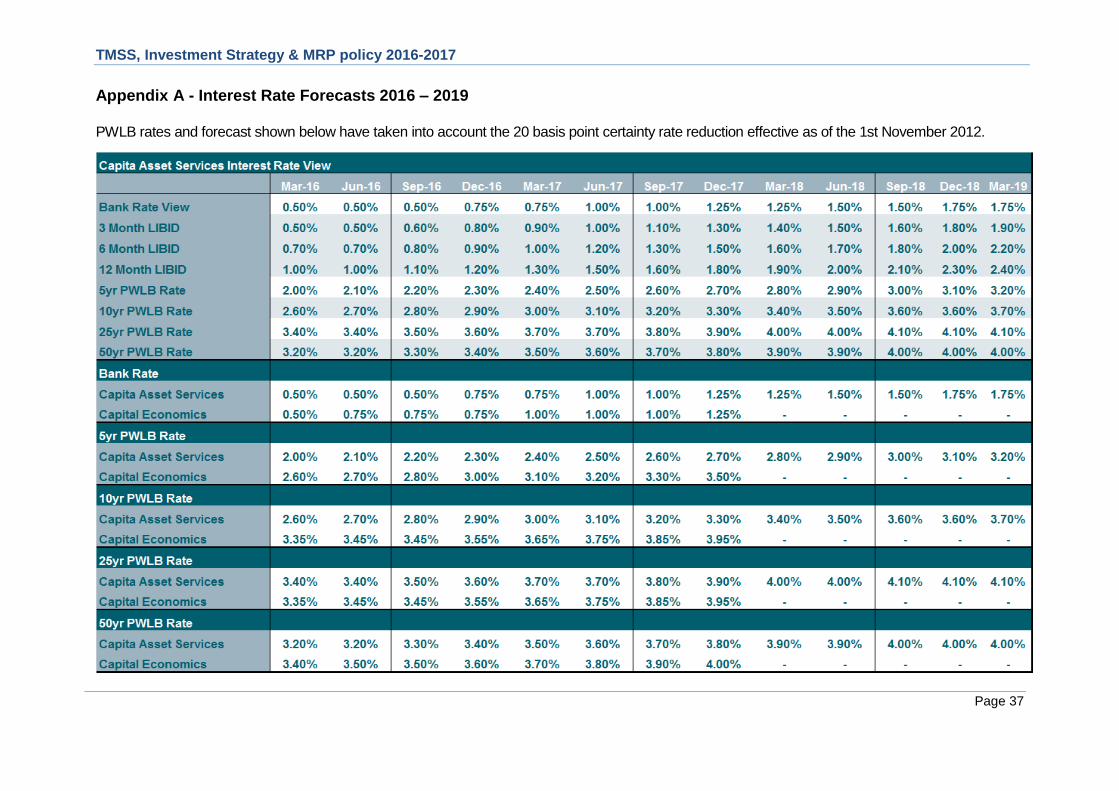
TMSS, Investment Strategy & MRP policy 2016-2017
Page 37
Appendix A - Interest Rate Forecasts 2016 – 2019
PWLB rates and forecast shown below have taken into account the 20 basis point certainty rate reduction effective as of the 1st November 2012.
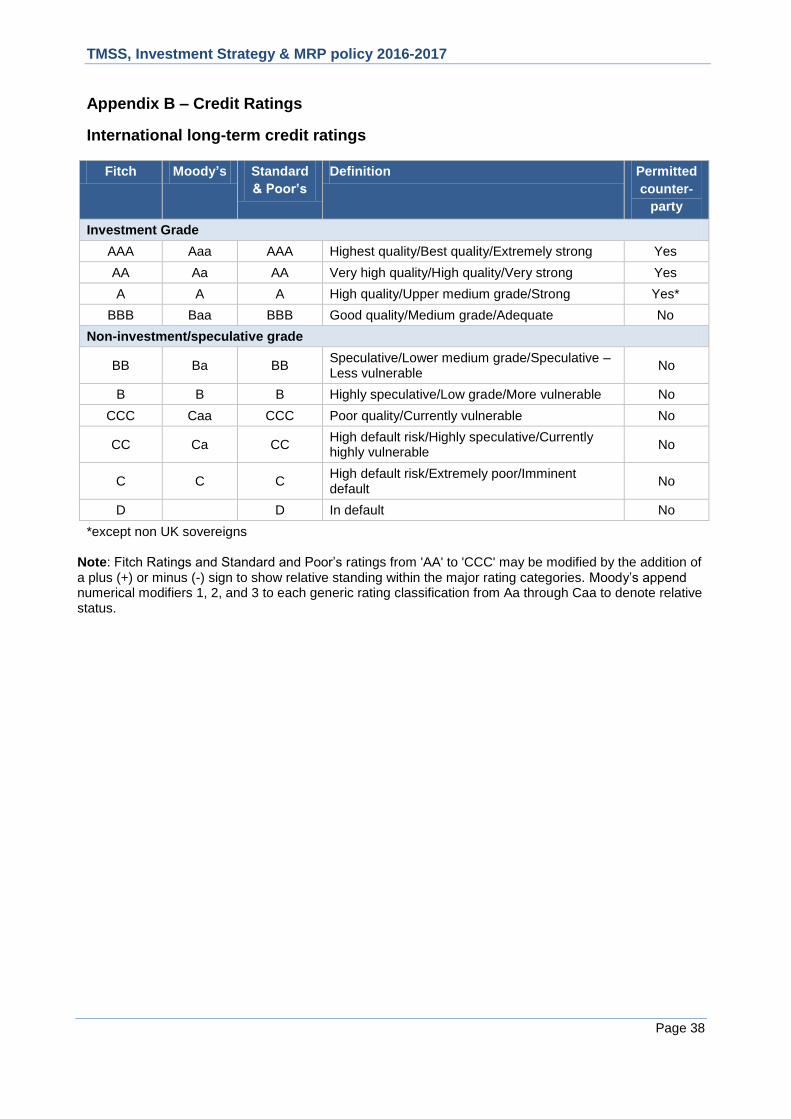
TMSS, Investment Strategy & MRP policy 2016-2017
Page 38
Appendix B – Credit Ratings
International long-term credit ratings
Fitch Moody’s Standard
& Poor’s
Definition Permitted
counter-
party
Investment Grade
AAA Aaa AAA Highest quality/Best quality/Extremely strong Yes
AA Aa AA Very high quality/High quality/Very strong Yes
A A A High quality/Upper medium grade/Strong Yes*
BBB Baa BBB Good quality/Medium grade/Adequate No
Non-investment/speculative grade
BB Ba BB Speculative/Lower medium grade/Speculative – Less vulnerable
No
B B B Highly speculative/Low grade/More vulnerable No
CCC Caa CCC Poor quality/Currently vulnerable No
CC Ca CC High default risk/Highly speculative/Currently highly vulnerable
No
C C C High default risk/Extremely poor/Imminent default
No
D D In default No
*except non UK sovereigns
Note: Fitch Ratings and Standard and Poor‟s ratings from 'AA' to 'CCC' may be modified by the addition of a plus (+) or minus (-) sign to show relative standing within the major rating categories. Moody‟s append numerical modifiers 1, 2, and 3 to each generic rating classification from Aa through Caa to denote relative status.