®. Customer Service Opportunity Model Customer Service Variance Customer Service Adjusted Workload.

1 2018 STATE OF GLOBAL CUSTOMER SERVICE REPORT
2018STATE OF GLOBAL
CUSTOMER SERVICE REPORT
2 2018 STATE OF GLOBAL CUSTOMER SERVICE REPORT
INTRODUCTIONCUSTOMER EXPECTATIONS CONTINUE THEIR STEADY CLIMB
As customer expectations continue to climb, it becomes more challenging for brands to set themselves apart from the competition. Markets are increasingly crowded, and both price and product are being steadily overtaken by customer experience as the number one brand differentiator.
Customer service organizations are often the face of a brand and play a critical role in shaping the overall customer experience. But to have a positive impact, service organizations first need a clear understanding of customer behavior, preferences and expectations. That knowledge, combined with the right technology and a willingness to reimagine the way they provide service, can empower them to offer the kinds of experiences that transform customers into brand ambassadors.
The Microsoft 2018 State of Global Customer Service survey polled 5,000 individuals across Brazil, Germany, Japan, the United Kingdom, and the United States. Our results confirm that customer service remains a cornerstone of customer experience and can serve as a brand differentiator. In fact, 95% of our survey respondents indicated that customer service is important to their choice of and loyalty to a brand.
We hope you find the insights from this year’s report beneficial as you continue to find new ways to provide value through exceptional customer service.
2 2018 STATE OF GLOBAL CUSTOMER SERVICE REPORT

3 2018 STATE OF GLOBAL CUSTOMER SERVICE REPORT
BUILD BRAND LOYALTY WITH EXCEPTIONAL CUSTOMER SERVICEIn our real-time, always on, digital world, customer expectations continue to rise. As technology evolves at breakneck speed and brands leverage data to create personalized, value-add experiences that are available anytime and anywhere, customers carry increasingly elevated expectations to every interaction—including customer service. In fact, nearly two thirds (59%) of our survey respondents have higher expectations for customer service than they did just a year ago.
An overwhelming 95% of respondents cite customer service as important in their choice of and loyalty to a brand. And 61% of our respondents have switched brands due to poor customer service, with nearly half having done so in the past 12 months. Customer service is about more than simply solving customer inquiries—it should be an integral part of your customer acquisition and retention strategy.
Great customer service builds loyalty through personalized, value-add experiences, and creates brand advocates by transforming negative experiences into positive outcomes. Our survey offers several insights—directly from customers—that will help you move beyond table stakes to redefine the customer service experience.
BRAND LOYALTY
3 2018 STATE OF GLOBAL CUSTOMER SERVICE REPORT
4 2018 STATE OF GLOBAL CUSTOMER SERVICE REPORT
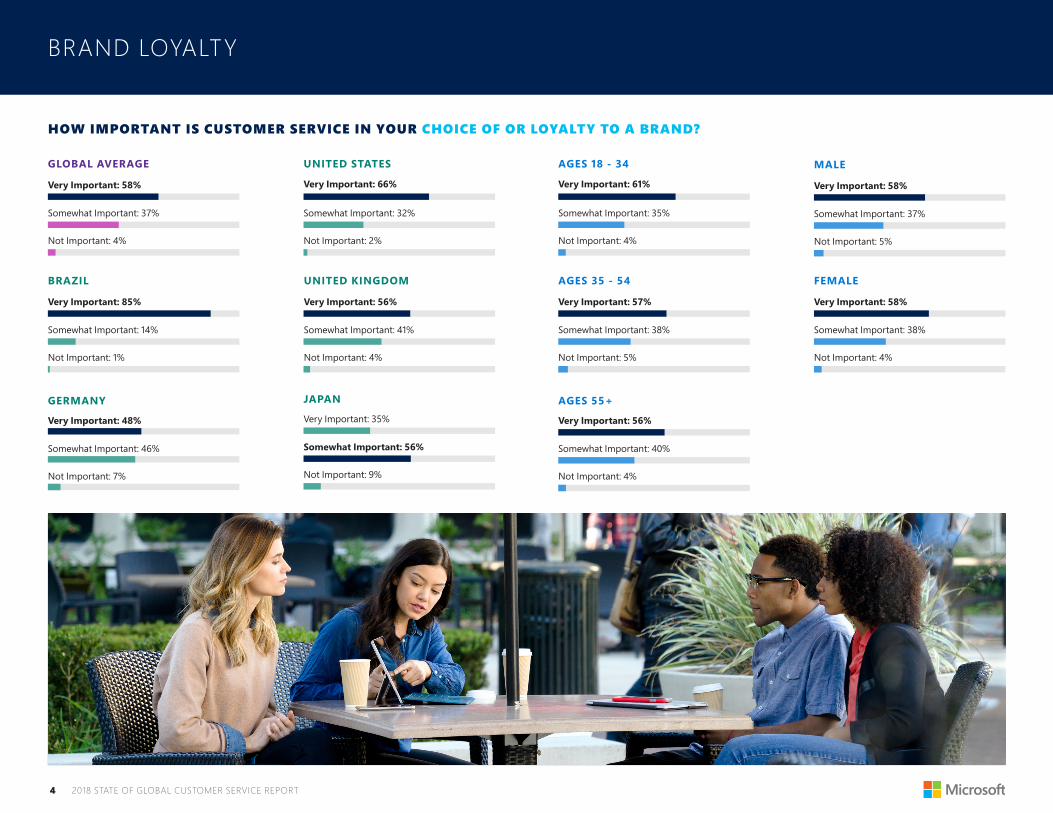
GLOBAL AVERAGE
Very Important: 58%
Not Important: 4%
Somewhat Important: 37%
HOW IMPORTANT IS CUSTOMER SERVICE IN YOUR CHOICE OF OR LOYALTY TO A BRAND?
AGES 35 - 54
Very Important: 57%
Not Important: 5%
Somewhat Important: 38%
UNITED STATES
Very Important: 66%
Not Important: 2%
Somewhat Important: 32%
AGES 18 - 34
Very Important: 61%
Not Important: 4%
Somewhat Important: 35%
BRAZIL
Very Important: 85%
Not Important: 1%
Somewhat Important: 14%
JAPAN
Very Important: 35%
Not Important: 9%
Somewhat Important: 56%
UNITED KINGDOM
Very Important: 56%
Not Important: 4%
Somewhat Important: 41%
GERMANY
Very Important: 48%
Not Important: 7%
Somewhat Important: 46%
AGES 55+
Very Important: 56%
Not Important: 4%
Somewhat Important: 40%
FEMALE
Very Important: 58%
Not Important: 4%
Somewhat Important: 38%
MALE
Very Important: 58%
Not Important: 5%
Somewhat Important: 37%
BRAND LOYALTY
5 2018 STATE OF GLOBAL CUSTOMER SERVICE REPORT
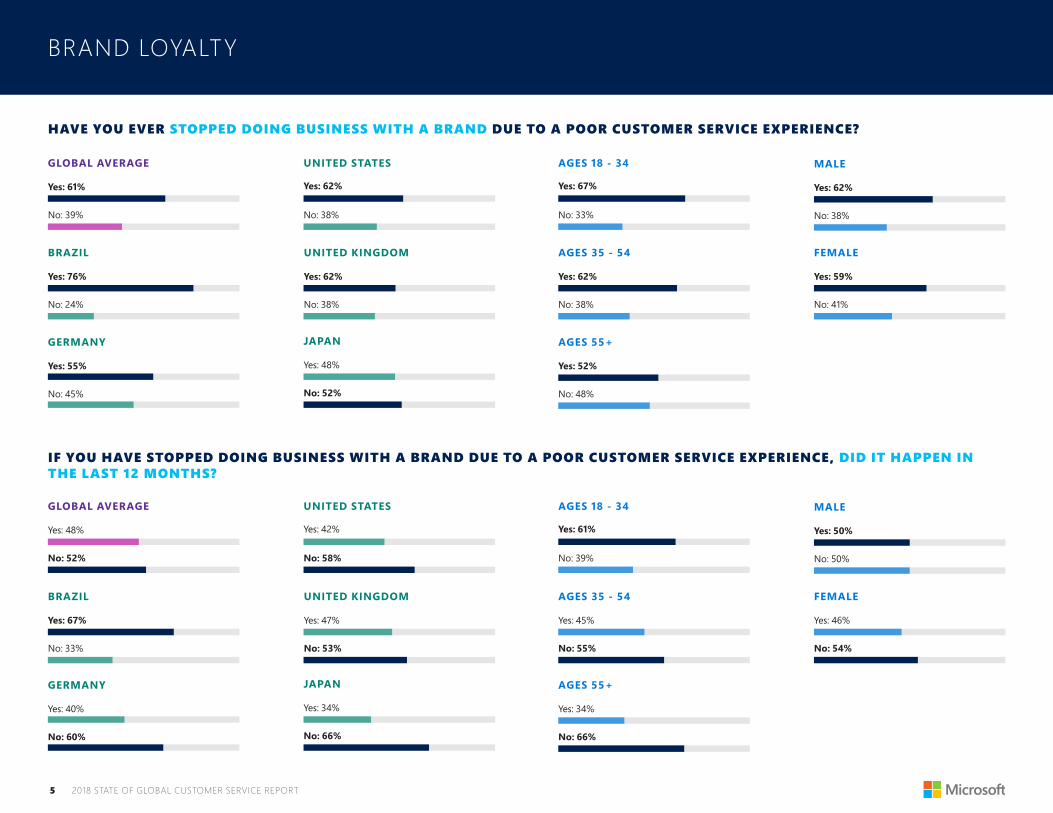
HAVE YOU EVER STOPPED DOING BUSINESS WITH A BRAND DUE TO A POOR CUSTOMER SERVICE EXPERIENCE?
IF YOU HAVE STOPPED DOING BUSINESS WITH A BRAND DUE TO A POOR CUSTOMER SERVICE EXPERIENCE, DID IT HAPPEN IN THE LAST 12 MONTHS?
GERMANY
Yes: 55%
No: 45%
GLOBAL AVERAGE
Yes: 61%
No: 39%
AGES 55+
Yes: 52%
No: 48%
JAPAN
Yes: 48%
No: 52%
AGES 35 - 54
Yes: 62%
No: 38%
BRAZIL
Yes: 76%
No: 24%
FEMALE
Yes: 59%
No: 41%
AGES 18 - 34
Yes: 67%
No: 33%
UNITED KINGDOM
Yes: 62%
No: 38%
MALE
Yes: 62%
No: 38%
GERMANY
Yes: 40%
No: 60%
GLOBAL AVERAGE
Yes: 48%
No: 52%
AGES 55+
Yes: 34%
No: 66%
JAPAN
Yes: 34%
No: 66%
AGES 35 - 54
Yes: 45%
No: 55%
BRAZIL
Yes: 67%
No: 33%
FEMALE
Yes: 46%
No: 54%
AGES 18 - 34
Yes: 61%
No: 39%
UNITED KINGDOM
Yes: 47%
No: 53%
MALE
Yes: 50%
No: 50%
UNITED STATES
Yes: 62%
No: 38%
UNITED STATES
Yes: 42%
No: 58%
BRAND LOYALTY

6 2018 STATE OF GLOBAL CUSTOMER SERVICE REPORT
BRAND LOYALTY
DO YOU HAVE HIGHER EXPECTATIONS FOR CUSTOMER SERVICE NOW THAN YOU HAD A YEAR AGO?
GERMANY
Yes: 50%
No: 50%
GLOBAL AVERAGE
Yes: 59%
No: 41%
AGES 55+
Yes: 49%
No: 51%
JAPAN
Yes: 52%
No: 48%
AGES 35 - 54
Yes: 57%
No: 43%
BRAZIL
Yes: 82%
No: 18%
FEMALE
AGES 18 - 34
Yes: 70%
No: 30%
UNITED KINGDOM
Yes: 54%
No: 46%
MALE
Yes: 59%
No: 41%
Yes: 59%
No: 41%
UNITED STATES
Yes: 56%
No: 44%
7 2018 STATE OF GLOBAL CUSTOMER SERVICE REPORT
BRAND LOYALTY
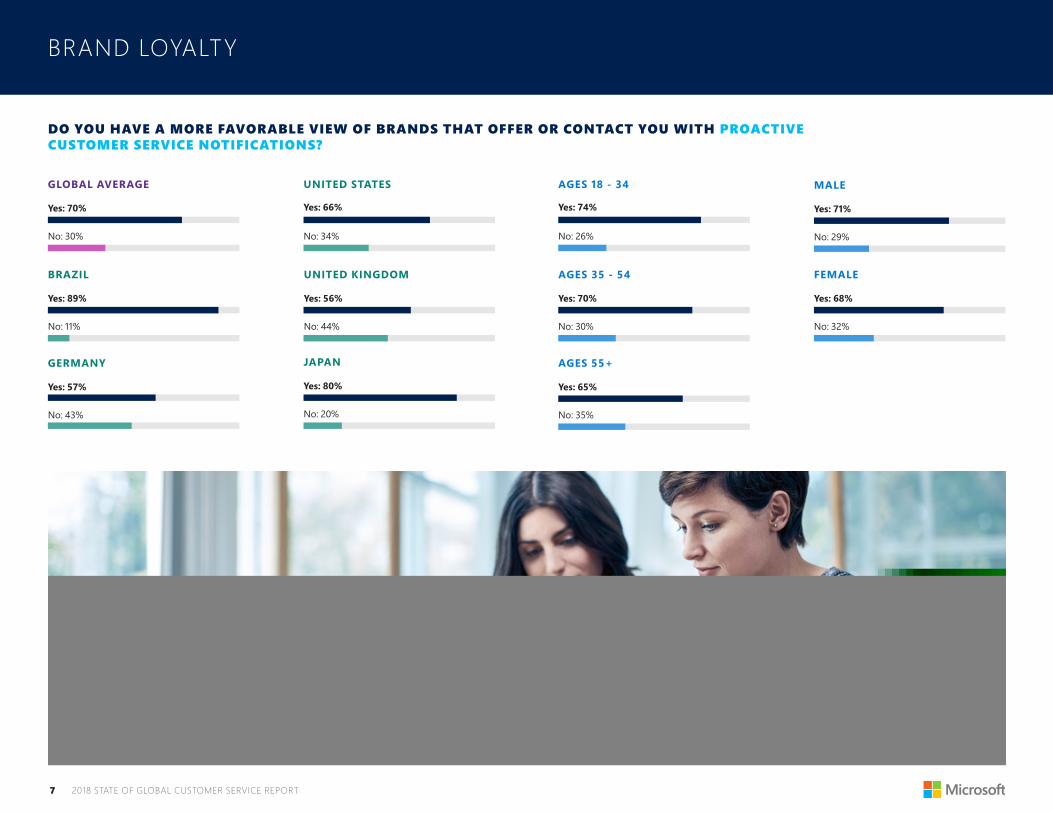
DO YOU HAVE A MORE FAVORABLE VIEW OF BRANDS THAT OFFER OR CONTACT YOU WITH PROACTIVE CUSTOMER SERVICE NOTIFICATIONS?
GERMANY
Yes: 57%
No: 43%
GLOBAL AVERAGE
Yes: 70%
No: 30%
AGES 55+
Yes: 65%
No: 35%
JAPAN
Yes: 80%
No: 20%
AGES 35 - 54
Yes: 70%
No: 30%
BRAZIL
Yes: 89%
No: 11%
FEMALE
Yes: 68%
No: 32%
AGES 18 - 34
Yes: 74%
No: 26%
UNITED KINGDOM
Yes: 56%
No: 44%
MALE
Yes: 71%
No: 29%
UNITED STATES
Yes: 66%
No: 34%

8 2018 STATE OF GLOBAL CUSTOMER SERVICE REPORT
GERMANY
Yes: 59%
No: 41%
GLOBAL AVERAGE
Yes: 59%
No: 41%
AGES 55+
Yes: 40%
No: 60%
JAPAN
Yes: 59%
No: 41%
AGES 35 - 54
Yes: 60%
No: 40%
BRAZIL
Yes: 85%
No: 15%
FEMALE
Yes: 61%
No: 39%
AGES 18 - 34
Yes: 77%
No: 23%
UNITED KINGDOM
Yes: 46%
No: 54%
MALE
Yes: 57%
No: 43%
UNITED STATES
Yes: 47%
No: 53%
BRAND LOYALTY
DO YOU HAVE A MORE FAVORABLE VIEW OF BRANDS THAT RESPOND TO CUSTOMER SERVICE QUESTIONS OR COMPLAINTS ON SOCIAL MEDIA?

9 2018 STATE OF GLOBAL CUSTOMER SERVICE REPORT
PERCEPTIONS & FRUSTRATIONS
9 2018 STATE OF GLOBAL CUSTOMER SERVICE REPORT
AVOID COMMON FRUSTRATIONS TO CREATE BETTER EXPERIENCES
The good news is that 66% of respondents feel the quality of customer service is getting better. However, more than a third (34%) think customer service is actually getting worse, and more than 60% don’t see it as getting any easier—which means there is plenty of room for growth for brands that want to stand out from the crowd. So, what’s working and what could be improved?
Providing support teams with a 360-degree view of the customer stands out as one of the biggest opportunities to improve the service experience. More than 75% of respondents expect customer service representatives to have visibility into previous interactions and purchases. Yet nearly half of those surveyed said agents almost never or only occasionally have the context they need to most effectively and efficiently solve their issue. It’s no surprise customers ranked a representative’s lack of knowledge about their issue and having to repeat themselves as the two most frustrating aspects of a poor service experience. By providing support teams with a 360-degree view, agents have the context and visibility they need to resolve inquiries during a single interaction, which our respondents rated as the single most important aspect of a good service experience.
A 360-degree view will also help you to create more meaningful engagement experiences, something our data indicates customers are looking for. For example, nearly all customers (90%) have a more favorable view of brands that give them the opportunity to provide feedback. Giving your customers a voice will not only help you create better experiences, it will build loyalty by giving your customers a stake in your brand.

10 2018 STATE OF GLOBAL CUSTOMER SERVICE REPORT
DO YOU FEEL THE QUALITY OF CUSTOMER SERVICE IS GETTING BETTER OR WORSE?
PERCEPTIONS & FRUSTRATIONS
GERMANY
Better: 60%
Worse: 40%
GLOBAL AVERAGE
Better: 66%
Worse: 34%
AGES 55+
Better: 60%
Worse: 40%
JAPAN
Better: 74%
Worse: 26%
AGES 35 - 54
Better: 65%
Worse: 35%
BRAZIL
Better: 78%
Worse: 22%
FEMALE
Better: 66%
Worse: 34%
AGES 18 - 34
Better: 75%
Worse: 25%
UNITED KINGDOM
Better: 62%
Worse: 38%
MALE
Better: 67%
Worse: 33%
UNITED STATES
Better: 58%
Worse: 42%

11 2018 STATE OF GLOBAL CUSTOMER SERVICE REPORT
DO YOU FEEL THE PROCESS OF ENGAGING WITH CUSTOMER SERVICE ORGANIZATIONS AND GETTING YOUR QUESTIONS ANSWERED IS GETTING EASIER?
PERCEPTIONS & FRUSTRATIONS
GLOBAL AVERAGE
Yes: 39%
It has remained the same: 35%
No, it’s getting harder: 26%
AGES 35 - 54
Yes: 37%
It has remained the same: 36%
No, it’s getting harder: 27%
UNITED STATES
Yes: 36%
It has remained the same: 34%
No, it’s getting harder: 30%
AGES 18 - 34
Yes: 51%
It has remained the same: 29%
No, it’s getting harder: 20%
BRAZIL
Yes: 64%
It has remained the same: 22%
No, it’s getting harder: 13%
JAPAN
Yes: 31%
It has remained the same: 47%
No, it’s getting harder: 22%
UNITED KINGDOM
Yes: 33%
It has remained the same: 37%
No, it’s getting harder: 30%
GERMANY
Yes: 28%
It has remained the same: 37%
No, it’s getting harder: 34%
AGES 55+
Yes: 27%
It has remained the same: 41%
No, it’s getting harder: 32%
FEMALE
Yes: 38%
It has remained the same: 36%
No, it’s getting harder: 26%
MALE
Yes: 39%
It has remained the same: 35%
No, it’s getting harder: 27%

12 2018 STATE OF GLOBAL CUSTOMER SERVICE REPORT
GLOBAL AVERAGE
Getting my issue resolved in a single interaction (no matter the length of time): 33%
Being able to find the information I need without having to contact a support representative: 12%
A knowledgeable customer service representative: 31%
Other: 2%
Not having to repeat myself if I’m transferred to a new agent: 21%
Being able to find the information I need without having to contact a support representative: 15%
Getting my issue resolved in a single interaction (no matter the length of time): 34%
Not having to repeat myself if I’m transferred to a new agent: 21%
Other: 2%
A knowledgeable customer service representative: 27%
AGES 18 - 34
Being able to find the information I need without having to contact a support representative: 12%
Getting my issue resolved in a single interaction (no matter the length of time): 33%
Not having to repeat myself if I’m transferred to a new agent: 24%
Other: 2%
A knowledgeable customer service representative: 28%
AGES 35 - 54
Being able to find the information I need without having to contact a support representative: 9%
Getting my issue resolved in a single interaction (no matter the length of time): 31%
Not having to repeat myself if I’m transferred to a new agent: 18%
Other: 2%
A knowledgeable customer service representative: 40%
AGES 55+
Being able to find the information I need without having to contact a support representative: 9%
Getting my issue resolved in a single interaction (no matter the length of time): 36%
Not having to repeat myself if I’m transferred to a new agent: 14%
Other: 1%
A knowledgeable customer service representative: 39%
UNITED STATES
Being able to find the information I need without having to contact a support representative: 12%
Getting my issue resolved in a single interaction (no matter the length of time): 34%
Not having to repeat myself if I’m transferred to a new agent: 21%
Other: 1%
A knowledgeable customer service representative: 32%
UNITED KINGDOM
Being able to find the information I need without having to contact a support representative: 17%
Getting my issue resolved in a single interaction (no matter the length of time): 26%
Not having to repeat myself if I’m transferred to a new agent: 21%
Other: 6%
A knowledgeable customer service representative: 30%
JAPAN
PERCEPTIONS & FRUSTRATIONS
WHAT IS THE MOST IMPORTANT ASPECT OF A GOOD CUSTOMER SERVICE EXPERIENCE?
BRAZILBeing able to find the information I need without having to contact a support representative: 14%
Getting my issue resolved in a single interaction (no matter the length of time): 43%
Not having to repeat myself if I’m transferred to a new agent: 26%
Other: 0%
A knowledgeable customer service representative: 16%
GERMANYBeing able to find the information I need without having to contact a support representative: 7%
Getting my issue resolved in a single interaction (no matter the length of time): 26%
Not having to repeat myself if I’m transferred to a new agent: 24%
Other: 1%
A knowledgeable customer service representative: 41%

13 2018 STATE OF GLOBAL CUSTOMER SERVICE REPORT
GLOBAL AVERAGE
Having to repeat or provide my information multiple times: 31%
Not being able to resolve the issue on my own using self-service: 12%
Difficulty reaching or inability to reach a live agent: 20%
The representative lacks the knowledge or ability to resolve my issue: 36%
Not being able to resolve the issue on my own using self-service: 12%
Having to repeat or provide my information multiple times: 32%
The representative lacks the knowledge or ability to resolve my issue: 37%
Difficulty reaching or inability to reach a live agent: 19%
AGES 35 - 54
Not being able to resolve the issue on my own using self-service: 8%
Having to repeat or provide my information multiple times: 31%
The representative lacks the knowledge or ability to resolve my issue: 35%
Difficulty reaching or inability to reach a live agent: 25%
AGES 55+
PERCEPTIONS & FRUSTRATIONS
WHAT IS THE MOST FRUSTRATING ASPECT OF A POOR CUSTOMER SERVICE EXPERIENCE?
AGES 18 - 34Not being able to resolve the issue on my own using self-service: 17%
Having to repeat or provide my information multiple times: 30%
The representative lacks the knowledge or ability to resolve my issue: 36%
Difficulty reaching or inability to reach a live agent: 18%
UNITED STATES
UNITED KINGDOM
JAPAN
Not being able to resolve the issue on my own using self-service: 7%
Having to repeat or provide my information multiple times: 29%
The representative lacks the knowledge or ability to resolve my issue: 40%
Difficulty reaching or inability to reach a live agent: 24%
Not being able to resolve the issue on my own using self-service: 9%
Having to repeat or provide my information multiple times: 37%
The representative lacks the knowledge or ability to resolve my issue: 34%
Difficulty reaching or inability to reach a live agent: 21%
Not being able to resolve the issue on my own using self-service: 19%
Having to repeat or provide my information multiple times: 31%
The representative lacks the knowledge or ability to resolve my issue: 28%
Difficulty reaching or inability to reach a live agent: 22%
BRAZILNot being able to resolve the issue on my own using self-service: 18%
Having to repeat or provide my information multiple times: 35%
The representative lacks the knowledge or ability to resolve my issue: 34%
Difficulty reaching or inability to reach a live agent: 12%
GERMANYNot being able to resolve the issue on my own using self-service: 7%
Having to repeat or provide my information multiple times: 25%
The representative lacks the knowledge or ability to resolve my issue: 44%
Difficulty reaching or inability to reach a live agent: 24%

14 2018 STATE OF GLOBAL CUSTOMER SERVICE REPORT
PERCEPTIONS & FRUSTRATIONS
SHOULD ORGANIZATIONS GIVE YOU THE OPPORTUNITY TO PROVIDE FEEDBACK?
GERMANY
Yes: 89%
No: 11%
GLOBAL AVERAGE
Yes: 90%
No: 10%
AGES 55+
Yes: 91%
No: 9%
JAPAN
Yes: 75%
No: 25%
AGES 35 - 54
Yes: 90%
No: 10%
BRAZIL
Yes: 97%
No: 3%
FEMALE
Yes: 91%
No: 9%
AGES 18 - 34
Yes: 90%
No: 10%
UNITED KINGDOM
Yes: 95%
No: 5%
MALE
Yes: 90%
No: 10%
UNITED STATES
Yes: 95%
No: 5%

15 2018 STATE OF GLOBAL CUSTOMER SERVICE REPORT
JAPAN
Almost never: 42%
About half the time: 18%
Often: 7%
Almost always: 3%
Occasionally: 31%
HOW OFTEN ARE YOU GIVEN THE OPPORTUNITY TO PROVIDE FEEDBACK?
PERCEPTIONS & FRUSTRATIONS
GLOBAL AVERAGE
Almost never: 17%
About half the time: 22%
Often: 17%
Almost always: 7%
Occasionally: 37%
BRAZIL
Almost never: 19%
About half the time: 18%
Often: 15%
Almost always: 6%
Occasionally: 42%
GERMANY
Almost never: 11%
About half the time: 22%
Often: 19%
Almost always: 7%
Occasionally: 42%
UNITED KINGDOM
Almost never: 6%
About half the time: 29%
Often: 20%
Almost always: 9%
Occasionally: 37%
UNITED STATES
Almost never: 7%
About half the time: 25%
Often: 24%
Almost always: 11%
Occasionally: 32%
AGES 18 - 34
Almost never: 14%
About half the time: 24%
Often: 16%
Almost always: 9%
Occasionally: 36%
AGES 34 - 54
Almost never: 19%
About half the time: 23%
Often: 15%
Almost always: 6%
Occasionally: 37%
AGES 55+
Almost never: 16%
About half the time: 20%
Often: 20%
Almost always: 6%
Occasionally: 38%

16 2018 STATE OF GLOBAL CUSTOMER SERVICE REPORT
PERCEPTIONS & FRUSTRATIONS
DO YOU BELIEVE MOST BRANDS TAKE ACTION ON FEEDBACK PROVIDED BY THEIR CUSTOMERS?
GERMANY
Yes: 42%
No: 58%
GLOBAL AVERAGE
Yes: 49%
No: 51%
AGES 55+
Yes: 44%
No: 56%
JAPAN
Yes: 47%
No: 53%
AGES 35 - 54
Yes: 48%
No: 52%
BRAZIL
Yes: 56%
No: 44%
FEMALE
Yes: 50%
No: 50%
AGES 18 - 34
Yes: 55%
No: 45%
UNITED KINGDOM
Yes: 46%
No: 54%
MALE
Yes: 49%
No: 51%
UNITED STATES
Yes: 55%
No: 45%
DO YOU EXPECT A CUSTOMER SERVICE REPRESENTATIVE TO KNOW YOUR CONTACT, PRODUCT AND SERVICE INFORMATION/HISTORY?
GERMANY
Yes: 79%
No: 21%
GLOBAL AVERAGE
Yes: 76%
No: 24%
AGES 55+
Yes: 72%
No: 28%
JAPAN
Yes: 64%
No: 36%
AGES 35 - 54
Yes: 76%
No: 24%
BRAZIL
Yes: 93%
No: 7%
FEMALE
Yes: 75%
No: 25%
AGES 18 - 34
Yes: 79%
No: 21%
UNITED KINGDOM
Yes: 72%
No: 28%
MALE
Yes: 77%
No: 23%
UNITED STATES
Yes: 70%
No: 30%

17 2018 STATE OF GLOBAL CUSTOMER SERVICE REPORT
PERCEPTIONS & FRUSTRATIONS
IN YOUR EXPERIENCE, HOW OFTEN DOES A SERVICE REPRESENTATIVE HAVE ACCESS TO THIS INFORMATION?
GLOBAL AVERAGE
Almost never: 15%
About half the time: 23%
Often: 21%
Almost always: 10%
Occasionally: 31%
BRAZIL
Almost never: 12%
About half the time: 23%
Often: 22%
Almost always: 7%
Occasionally: 36%
AGES 18 - 34
Almost never: 12%
About half the time: 26%
Often: 19%
Almost always: 10%
Occasionally: 33%
AGES 34 - 54
Almost never: 17%
About half the time: 24%
Often: 20%
Almost always: 9%
Occasionally: 30%
AGES 55+
Almost never: 15%
About half the time: 20%
Often: 24%
Almost always: 11%
Occasionally: 30%
UNITED KINGDOM
Almost never: 10%
About half the time: 24%
Often: 20%
Almost always: 10%
Occasionally: 35%
JAPAN
Almost never: 37%
About half the time: 20%
Often: 16%
Almost always: 4%
Occasionally: 24%
UNITED STATES
Almost never: 8%
About half the time: 27%
Often: 23%
Almost always: 15%
Occasionally: 26%
GERMANY
Almost never: 8%
About half the time: 23%
Often: 24%
Almost always: 13%
Occasionally: 33%

18 2018 STATE OF GLOBAL CUSTOMER SERVICE REPORT
OMNI-CHANNELDELIVER QUALITY SERVICE ANYTIME, ANYWHERE
Today’s customers expect to receive service across multiple channels and on any device. In fact, 59% of our 2018 respondents have used three or more channels to get their questions answered. As those customers jump from channel to channel—particularly during a single inquiry—many customer service organizations are unable to transform multiple touchpoints into a frictionless, personalized engagement experience. Regardless of the resolution path, customers should experience a smooth and effortless transition between channels and interactions.
With two thirds of all customers preferring to first try solving issues on their own, self-service should be a cornerstone of any omni-channel strategy. But not every inquiry can be resolved through self-service. For complex issues, customers should also be offered a choice of assisted service channels to effectively address their needs.
Chanel preferences vary from phone to chat to social media, so knowing how your customers prefer to interact remains a key priority. And it’s important to evolve with your customers. For instance, our study found that the percentage of customers ages 35+ using social channels for support doubled in the last year. No longer just an important option for millennials, social channels are fast becoming a standard for all demographics.
When it comes to channel options, you not only need to offer your customers choice and convenience—you need to deliver a consistent, effortless and unified customer service experience across every touchpoint.

19 2018 STATE OF GLOBAL CUSTOMER SERVICE REPORT
UNITED STATES
1 to 2 channels: 34%
6 or more: 9%
None of these: 3%
3 to 5 channels: 54%
GLOBAL AVERAGE
1 to 2 channels: 37%
6 or more: 9%
None of these: 4%
3 to 5 channels: 50%
BRAZIL
1 to 2 channels: 22%
6 or more: 18%
None of these: 0%
3 to 5 channels: 59%
GERMANY
1 to 2 channels: 40%
6 or more: 7%
None of these: 3%
3 to 5 channels: 50%
UNITED KINGDOM
1 to 2 channels: 31%
6 or more: 10%
None of these: 2%
3 to 5 channels: 58%
JAPAN
1 to 2 channels: 60%
6 or more: 1%
None of these: 14%
3 to 5 channels: 25%
MALE
1 to 2 channels: 39%
6 or more: 9%
None of these: 4%
3 to 5 channels: 48%
AGES 18 - 34
1 to 2 channels: 32%
6 or more: 12%
None of these: 4%
3 to 5 channels: 52%
AGES 34 - 54
1 to 2 channels: 37%
6 or more: 10%
None of these: 5%
3 to 5 channels: 48%
FEMALE
1 to 2 channels: 36%
6 or more: 9%
None of these: 4%
3 to 5 channels: 51%
AGES 55+
1 to 2 channels: 43%
6 or more: 4%
None of these: 4%
3 to 5 channels: 49%
OMNI-CHANNEL
HOW MANY DIFFERENT CUSTOMER SERVICE CHANNELS HAVE YOU USED?

20 2018 STATE OF GLOBAL CUSTOMER SERVICE REPORT
UNITED STATESGLOBAL AVERAGEEmail: 20%
Live chat: 16%
Online self-service options: 12%
Social Media: 5%
Phone or other voice channel: 39%
SMS or Text Message: 3%
Undecided: 5%
Email: 20%
Live chat: 21%
Online self-service options: 13%
Social Media: 10%
Phone or other voice channel: 29%
SMS or Text Message: 4%
Undecided: 4%
Email: 16%
Live chat: 23%
Online self-service options: 6%
Social Media: 4%
Phone or other voice channel: 44%
SMS or Text Message: 4%
Undecided: 4%
Email: 21%
Live chat: 16%
Online self-service options: 12%
Social Media: 4%
Phone or other voice channel: 38%
SMS or Text Message: 4%
Undecided: 5%
AGES 18-34 AGES 35-54 AGES 55+
WHICH OF THE FOLLOWING CUSTOMER SERVICE CHANNELS DO YOU PREFER?
JAPANEmail: 23%
Live chat: 4%
Online self-service options: 21%
Social Media: 3%
Phone or other voice channel: 30%
SMS or Text Message: 6%
Undecided: 14%
UNITED KINGDOMEmail: 26%
Live chat: 26%
Online self-service options: 8%
Social Media: 4%
Phone or other voice channel: 31%
SMS or Text Message: 3%
Undecided: 3%
Email: 20%
Live chat: 10%
Online self-service options: 10%
Social Media: 1%
Phone or other voice channel: 50%
SMS or Text Message: 1%
Undecided: 6%
OMNI-CHANNEL
BRAZIL GERMANYEmail: 19%
Live chat: 6%
Online self-service options: 10%
Social Media: 5%
Phone or other voice channel: 57%
SMS or Text Message: 1%
Undecided: 3%
Email: 18%
Live chat: 21%
Online self-service options: 15%
Social Media: 10%
Phone or other voice channel: 33%
SMS or Text Message: 2%
Undecided: 1%

21 2018 STATE OF GLOBAL CUSTOMER SERVICE REPORT
WHEN ENGAGING WITH A BRAND OR ORGANIZATION FOR CUSTOMER SERVICE, DO YOU TRY TO USE SELF-SERVICE FIRST, OR DO YOU IMMEDIATELY ENGAGE WITH AN AGENT?
DO YOU EXPECT A BRAND OR ORGANIZATION TO OFFER AN ONLINE SELF-SERVICE SUPPORT PORTAL?
GERMANY
Begin with self-service: 58%
Immediately engage with an agent: 42%
GLOBAL AVERAGE
Begin with self-service: 66%
Immediately engage with an agent: 34%
AGES 55+
Begin with self-service: 58%
Immediately engage with an agent: 42%
JAPAN
Begin with self-service: 70%
Immediately engage with an agent: 30%
AGES 35 - 54
Begin with self-service: 67%
Immediately engage with an agent: 33%
BRAZIL
Begin with self-service: 79%
Immediately engage with an agent: 21%
FEMALE
Begin with self-service: 67%
Immediately engage with an agent: 33%
AGES 18 - 34
Begin with self-service: 74%
Immediately engage with an agent: 26%
UNITED KINGDOM
Begin with self-service: 64%
Immediately engage with an agent: 36%
MALE
Begin with self-service: 66%
Immediately engage with an agent: 34%
GERMANY
Yes: 87%
No: 13%
GLOBAL AVERAGE
Yes: 88%
No: 12%
AGES 55+
Yes: 84%
No: 16%
JAPAN
Yes: 77%
No: 23%
AGES 35 - 54
Yes: 88%
No: 12%
BRAZIL
Yes: 96%
No: 4%
FEMALE
Yes: 89%
No: 11%
AGES 18 - 34
Yes: 92%
No: 8%
UNITED KINGDOM
Yes: 92%
No: 8%
MALE
Yes: 88%
No: 12%
UNITED STATES
Begin with self-service: 61%
Immediately engage with an agent: 39%
UNITED STATES
Yes: 88%
No: 12%
OMNI-CHANNEL

22 2018 STATE OF GLOBAL CUSTOMER SERVICE REPORT
IF YOU DID NOT FIND THE RESPONSE YOU WERE LOOKING FOR, WHAT WAS THE KEY ISSUE?
OMNI-CHANNEL
GLOBAL AVERAGE
My issue was too complex: 22%
Not enough information available through self-ser-vice: 43%
Too much information to sort through: 16%
The information was disorganized with no ability to search: 18%
Not enough information available through self-service: 44%
My issue was too complex: 21%
The information was disorganized with no ability to search: 19%
Too much information to sort through: 16%
AGES 35 - 54
Not enough information available through self-service: 44%
My issue was too complex: 25%
The information was disorganized with no ability to search: 17%
Too much information to sort through: 14%
AGES 55+Not enough information available through self-service: 48%
My issue was too complex: 14%
The information was disorganized with no ability to search: 15%
Too much information to sort through: 23%
JAPAN
Not enough information available through self-service: 44%
My issue was too complex: 31%
The information was disorganized with no ability to search: 13%
Too much information to sort through: 13%
UNITED STATESNot enough information available through self-service: 42%
My issue was too complex: 20%
The information was disorganized with no ability to search: 19%
Too much information to sort through: 19%
AGES 18 - 34
Not enough information available through self-service: 49%
My issue was too complex: 25%
The information was disorganized with no ability to search: 13%
Too much information to sort through: 13%
UNITED KINGDOMNot enough information available through self-service: 43%
My issue was too complex: 14%
The information was disorganized with no ability to search: 27%
Too much information to sort through: 15%
BRAZIL
Not enough information available through self-service: 32%
My issue was too complex: 26%
The information was disorganized with no ability to search: 23%
Too much information to sort through: 19%
GERMANY
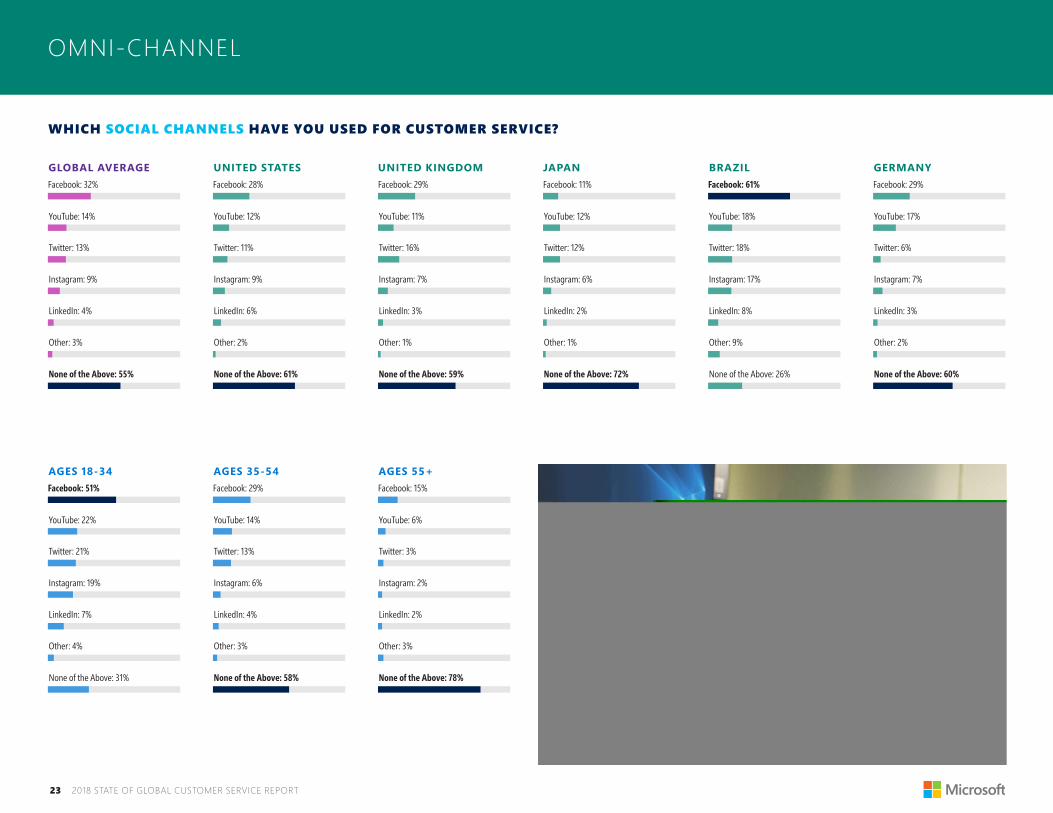
23 2018 STATE OF GLOBAL CUSTOMER SERVICE REPORT
UNITED KINGDOMFacebook: 29%
YouTube: 11%
Twitter: 16%
Instagram: 7%
LinkedIn: 3%
Other: 1%
None of the Above: 59%
JAPANFacebook: 11%
YouTube: 12%
Twitter: 12%
Instagram: 6%
LinkedIn: 2%
Other: 1%
None of the Above: 72%
GERMANYFacebook: 29%
YouTube: 17%
Twitter: 6%
Instagram: 7%
LinkedIn: 3%
Other: 2%
None of the Above: 60%
BRAZILFacebook: 61%
YouTube: 18%
Twitter: 18%
Instagram: 17%
LinkedIn: 8%
Other: 9%
None of the Above: 26%
OMNI-CHANNEL
WHICH SOCIAL CHANNELS HAVE YOU USED FOR CUSTOMER SERVICE?
UNITED STATESGLOBAL AVERAGEFacebook: 32%
YouTube: 14%
Twitter: 13%
Instagram: 9%
LinkedIn: 4%
Other: 3%
None of the Above: 55%
Facebook: 51%
YouTube: 22%
Twitter: 21%
Instagram: 19%
LinkedIn: 7%
Other: 4%
None of the Above: 31%
Facebook: 28%
YouTube: 12%
Twitter: 11%
Instagram: 9%
LinkedIn: 6%
Other: 2%
None of the Above: 61%
Facebook: 29%
YouTube: 14%
Twitter: 13%
Instagram: 6%
LinkedIn: 4%
Other: 3%
None of the Above: 58%
Facebook: 15%
YouTube: 6%
Twitter: 3%
Instagram: 2%
LinkedIn: 2%
Other: 3%
None of the Above: 78%
AGES 18-34 AGES 35-54 AGES 55+

24 2018 STATE OF GLOBAL CUSTOMER SERVICE REPORT
OMNI-CHANNEL
WHAT IS YOUR EXPECTED RESPONSE TIME FOR SOCIAL MEDIA QUESTIONS OR COMPLAINTS?
GLOBAL AVERAGE
Immediately: 18%
Sometime that day: 37%
I don’t expect a response: 17%
Within an hour: 28%
BRAZIL
Immediately: 29%
Sometime that day: 29%
I don’t expect a response: 3%
Within an hour: 39%
GERMANY
Immediately: 12%
Sometime that day: 45%
I don’t expect a response: 15%
Within an hour: 28%
UNITED KINGDOM
Immediately: 13%
Sometime that day: 39%
I don’t expect a response: 18%
Within an hour: 30%
JAPAN
Immediately: 13%
Sometime that day: 42%
I don’t expect a response: 23%
Within an hour: 21%
UNITED STATES
Immediately: 20%
Sometime that day: 31%
I don’t expect a response: 25%
Within an hour: 24%
AGES 18 - 34
Immediately: 22%
Sometime that day: 37%
I don’t expect a response: 8%
Within an hour: 34%
AGES 34 - 54
Immediately: 18%
Sometime that day: 39%
I don’t expect a response: 14%
Within an hour: 29%
AGES 55+
Immediately: 13%
Sometime that day: 36%
I don’t expect a response: 29%
Within an hour: 22%

25 2018 STATE OF GLOBAL CUSTOMER SERVICE REPORT
PROVIDE THE RIGHT DIGITAL TOOLS FOR THE JOB
Our survey participants said getting their issue resolved in a single interaction is the most important aspect of a good service experience. As you evolve your service strategy, consider the types of inquiries you typically receive, and then create alignment by offering the channels best suited for quick resolution.
Video chat and co-browse, for example, are incredibly effective for customers who require more hands-on, high-touch support. The proof is in the pudding: the vast majority of those we surveyed who had used video chat or co-browse for support found those channels helpful.
AI-driven virtual agents are one of the hottest emerging channels. Capabilities like natural language processing and machine learning can create an experience that is smart, conversational, and fast—and available 24/7. Bots can automate resolution while reducing costs and improving customer satisfaction, freeing agents to work on more complex issues. Learn how HP transformed its customer support experience with virtual agents.
Your customers are looking for end-to-end effortless customer service on the channel of their choice. Leveraging the right technology creates a significant opportunity to differentiate your brand.
DIGITAL & EMERGING TRENDS
25 2018 STATE OF GLOBAL CUSTOMER SERVICE REPORT

26 2018 STATE OF GLOBAL CUSTOMER SERVICE REPORT
DIGITAL & EMERGING TRENDS
IF YOU HAVE USED VIDEO CHAT, DID YOU FIND IT HELPFUL?
GERMANY
Yes: 80%
No: 20%
GLOBAL AVERAGE
Yes: 85%
No: 15%
AGES 55+
Yes: 82%
No: 18%
JAPAN
Yes: 89%
No: 11%
AGES 35 - 54
Yes: 82%
No: 18%
BRAZIL
Yes: 89%
No: 11%
FEMALE
Yes: 79%
No: 21%
AGES 18 - 34
Yes: 88%
No: 12%
UNITED KINGDOM
Yes: 78%
No: 22%
MALE
Yes: 89%
No: 11%
UNITED STATES
Yes: 85%
No: 15%
IF YOU HAVE USED CO-BROWSE, DID YOU FIND IT HELPFUL?
GERMANY
Yes: 90%
No: 10%
GLOBAL AVERAGE
Yes: 91%
No: 9%
AGES 55+
Yes: 90%
No: 10%
JAPAN
Yes: 93%
No: 7%
AGES 35 - 54
Yes: 90%
No: 10%
BRAZIL
Yes: 93%
No: 7%
FEMALE
Yes: 90%
No: 10%
AGES 18 - 34
Yes: 92%
No: 8%
UNITED KINGDOM
Yes: 82%
No: 18%
MALE
Yes: 92%
No: 8%
UNITED STATES
Yes: 92%
No: 8%

27 2018 STATE OF GLOBAL CUSTOMER SERVICE REPORT
Most organizations recognize customer experience as a major competitive differentiator, and customer service plays a key role in defining that experience. To provide a differentiated experience, organizations must first understand what their customers are looking for, and then use the right technology to reimagine the customer service experience. Key learnings from The Microsoft 2018 State of Global Customer Service Report include:
1. CUSTOMER SERVICE ORGANIZATIONS PERSONIFY YOUR BRAND
Customer service can make or break your brand. Every interaction provides an opportunity to transform negative experiences into positive outcomes and to create brand champions. Every touchpoint is meaningful.
2. CUSTOMERS WANT TO BE ENGAGED AND KNOWN BY BRANDS
Customers increasingly favor brands that recognize them and understand their needs. They want a two-way conversation, and to feel that brands are listening to them and taking what they say to heart. Customer service plays a strategic role in long-term customer engagement.
3. CUSTOMERS BRING HIGH EXPECTATIONS ACROSS ALL SERVICE CHANNELS
Regardless of which channel they choose, customer expectations for the quality and timeliness of service interactions are soaring. Smart alignment and application of digital tools like video chat and AI-enabled virtual agents as part of your omni-channel approach will help you achieve a level of support that’s sure to delight.
TAKEAWAYS & CONCLUSIONS
27 2018 STATE OF GLOBAL CUSTOMER SERVICE REPORT

28 2018 STATE OF GLOBAL CUSTOMER SERVICE REPORT
© 2018 Microsoft Corporation. All rights reserved.
Microsoft Dynamics 365 is the next generation of intelligent business applications that enable your organization to grow, evolve and transform. These applications unify CRM and ERP capabilities with purpose-built applications that work seamlessly together to help manage specific business functions.
Service organizations are at the epicenter of a company’s ability to deliver differentiated and consistent engagement experiences. Microsoft Dynamics 365 for Customer Service helps organizations digitally transform their service experience to more effectively engage their customers, empower their agents with the tools they need to deliver differentiated levels of support, optimize their business processes, and find new ways to provide value to their customers. Our industry leading technologies, including machine learning, IoT and advanced analytics, give our purpose-built service solution the breadth and depth necessary to address this transformation. Industry leading technology, including machine learning, IoT and advanced analytics, uniquely positions brands to capitalize on the new service economy, while building advocacy and loyalty through effortless service experiences.
Learn more at: https://dynamics.microsoft.com/en-us/customer-service/overview/ Contact us to discuss your unique needs: 1.888.477.7989 Follow us on Twitter: @MSFTDynamics365
DISCOVER INTELLIGENT CUSTOMER SERVICE