2018 Rental Apartment Review Mid-Year Greater Vancouvergoodmanreport.com/content/2018 Mid-Year...
12
The Newsletter for Apartment Owners since 1983 Issue 60 | July 2018 Mid-Year Greater Vancouver Rental Apartment Review 2018 View properties online at www.goodmanreport.com SUITE TALK GOVERNMENT GOES ACTIVIST ON RENTALS AS PRICES GO EVER-UPWARD Kitsilano Beach pool, diving tower. 1950s
Transcript of 2018 Rental Apartment Review Mid-Year Greater Vancouvergoodmanreport.com/content/2018 Mid-Year...

The Newsletter for Apartment Owners since 1983 Issue 60 | July 2018
Mid-Year Greater Vancouver Rental Apartment Review2018
View properties online at www.goodmanreport.com
Suite talkGovernment Goes activist on rentals
as prices Go ever-upward
Kitsilano Beach pool, diving tower. 1950s

The Goodman Report: 2018 Mid-Year Review2
So much for the anticipated drop-off in demand and pricing for Metro Vancouver’s rental apartment sector. Despite the B.C. government’s highly publicized efforts to impact real-estate values negatively by extracting tax dollars from almost all known transactions and sources, the market in the first six months of 2018 versus 2017 is very much alive, if not thriving.
The forces behind the rental market’s enduring strength are numerous. The most apparent is that Metro Vancouver’s low unemployment reflects a strong local economy. Tenant demand remains near insatiable, and with the erosion in homeownership affordability, growing numbers of people are resigned to renting. Vacancy rates are tracking less than 1% across many of the region’s urban centres, with rents rising at a rapid clip. Our research indicates that little new rental supply is making its way to the market. Additionally, high in-migration including a record volume of foreign students and low long-term mortgage rates are critical factors underpinning the rental asset class.
The only restraint to greater sales activity is the constrained supply of listings. Eager buyers are readily snapping buildings up at or near market. Of late, however, we observe a growing fickleness on the part of wary investors, who shun certain offerings whose asking price is positioned well above perceived market.
With respect to supply challenges, as evidenced by the modest number of yearly transactions, owners of multifamily rentals are generally a content lot, not typically prone to selling. Many are long-term owners who either self-manage or possess able property management. Furthermore, they’ve been fortunate beneficiaries of extreme value escalation within the past twenty years and are understandably not anxious to cut cheques to the CRA. Thus their business rationale for parting with rewarding rental assets are diverse, often complex. The decision may be triggered by estate planning issues, family dynamics, illness, liquidity requirements caused by trading up, a move away from Metro Vancouver or – of late – offers from developers that are so extraordinarily compelling that a “yes” is a given.
the market retainS itS luStre
This communication is not intended to cause or induce breach of an existing listing agreement. The information contained herein has been obtained from sources deemed reliable.
While we have no reason to doubt its accuracy, we do not guarantee it. It is your responsibility to confirm its accuracy and completeness independently.
Staying in the loop
Owners of older buildings currently not zoned to benefit from potential development as well as typical apartment owners who stand to reap significant value well over market with immediate development prospects have urged the Goodman Report to continue to provide ongoing status updates of new rental initiatives in their respective communities throughout Metro Vancouver. We’re pleased to furnish this latest information.
What has emerged from our latest internal survey of suburban activity is the staggering success of Coquitlam, with its municipal focus on new rental development. Spurred on by 15 separate projects in the Lougheed and Burquitlam areas, Coquitlam anticipates the addition of 2,402 new rental units. Burnaby, in second place, has 1,700 units in play derived from 8 separate projects, while an aggressive City of North Vancouver campaign now has 15 projects on the go expected to generate 1,336 new rental units.
While most suburban communities have been stellar in their efforts to create new rental housing, Delta, Richmond and White Rock remain most conspicuous in their lack of success in providing a meaningful development environment to address pent-up demand. Meanwhile, despite a vastly higher population, housing programs receiving much ballyhoo and a ten-year head start on new rental construction, Vancouver itself has only 7,316 units in the pipeline: a testament to the less-than-stellar effectiveness and lack of political will of Mayor Robertson’s administration.

goodmanreport.com 3
45 EAst 16th AVEnuE, VAncouVER
23 suites between Cambie and MainMount Pleasant neighbourhood
Asking $10,520,000
1900 MAYfAiR DRiVE, VictoRiA
107 suites on a 6-acre site Ocean, city and mountain views
Asking $10,800,000 (50% undivided interest)
1955 WEstERn DR, PoRt coquitlAM
65 suites on a 1.5-acre site 3% cap rate / $208,000 per unit
Asking $13,500,000
foR sAlE unDER contRAct foR sAlE
499.41’
neW hOuSinG PrOGram SPeCiFiCS
Metro Vancouver’s population has suffered through years of benign neglect during which various levels of government have displayed only token measures toward addressing chronic issues with housing supply and pricing. With housing inequity evolving into an untenable political crisis, both the B.C. government and the City of Vancouver, to address the affordability issue and the non-availability of certain housing types, have finally introduced a newly minted agenda for major segments of the population. We can now expect a stepped-up emphasis on social and supportive housing and increased support for purpose-built rental units.
The Housing Vancouver Strategy (2018–2027) provides the principal example of these new directions. Through this policy, the City intends to add a total of 72,000 housing units by 2027, as follows:
It’s worth noting, however, that Vancouver’s population, now approximately 640,000, is expected to grow over the same period to approximately 715,000. The city’s housing problems will not be easily resolved, even with this high-profile program.
Beyond Vancouver’s new housing strategy, the B.C. government has struck a new Rental Housing Task Force to modernize the province’s tenancy laws. Notwithstanding the need for review of the proposed amendments, landlords are wary of the implications and how it could negatively impact their holdings. For further thoughts, see Claire Immega’s “Shifting Sands” column on page 11.
the housing Vancouver strategy (2018–2027)
1. Social and supportive housing 12,000 units
2. Purpose-built rentals 20,000 units
3. Laneway rental housing 4,000 units
4. Market condos 32,000 units
5. Market townhomes 4,000 units
total 72,000 units
the housing Vancouver strategy (2018–2027) 72,000 housing units by 2027
1. Social and
3.La
new
ayre
ntal
s
4. Market condos
2. Purpose-built rentals
Mar
ket
Tow
nhom
es5.
supportive housing

The Goodman Report: 2018 Mid-Year Review4
Across Metro Vancouver, at this point in the market cycle, there are 177 proposed, permitted and under-construction rental projects that have the potential to add up to 17,296 suites. It is expected that these units will be added to the rental stock over the next five years.
At the time of this writing, Vancouver has 99 rental projects in the pipeline, 28 of which are situated on the Westside, 25 in Downtown and 46 on the Eastside. Together, these comprise 7,316 rental units under construction, approved and/or proposed, all to be finished by 2023 or earlier. Beyond these 99 projects, we’re aware of 737 newly built suites in 8 projects added to Vancouver’s rental inventory so far in 2018.
neW SuPPly in the PiPeline (mid-2018)
Municipality
Burnaby 1,700 (8) -
Coquitlam 2,402 (15) -
Delta - -
Langley 431 (4) -
Maple Ridge 315 (3) -
New Westminster 881 (8) 386 (2)
North Vancouver, City of 1,336 (15) -
North Vancouver, District of 640 (11) -
Port Coquitlam 294 (1) -
Port Moody 713 (5) -
Richmond 165 (1) -
Surrey 793 (3) 142 (1)
White Rock 29 (1) -
West Vancouver 281 (3) -
Suburban total 9,980 (78) 528 (3)
Vancouver (including UBC) 7,316 (99) 737 (8)
Total 17,296 (177) 1,265 (11)
Units (buildings) in play*
Units (buildings) completed 2018
* Proposed, approved or under construction
Proposed ApprovedUnder
constructionCompleted Cancelled
Units (buildings) Units (buildings) Units (buildings) Units (buildings) Units (buildings)
Suburbs 6,035 (45) 1,098 (13) 2,847 (20) 528 (3) 0 (0)
Vancouver 1,703 (32) 2,582 (37) 3,031 (30) 737 (8) 703 (2)
Total 7,738 (77) 3,680 (50) 5,878 (50) 1,265 (11) 703 (2)Projected occupancy
2020–2022Projected occupancy
2019–2021Projected occupancy
2018–2020Occupancy 2018
Source: Goodman Report
units completedunits under construction
units approved
units proposed
City of Vancouver 737 3,031 2,582 1,703
Burnaby - 559 230 911 Coquitlam - 471 - 1,931 Langley - 98 33 300 New Westminster 386 548 24 309 City of North Vancouver - 555 113 668 District of North Vancouver - 149 88 403 Surrey 142 173 - 620 Maple Ridge - - 200 115 West Vancouver - - 281 - Port Coquitlam 0 294 0 0Port Moody 0 0 100 613White Rock 0 0 29 0Richomond 0 0 0 165Suburbs 528 2,847 1,098 6,035
Metro Vancouver 1,265 5,878 3,680 7,738
5,878 units under construction (34%)
3,680 units approved
(21%)
7,738 units proposed (45%)
new rental stock in the pipeline across Metro
Van
couver
17,296 units in play
(177 buildings)
goodmanreport.com 5
0.9%*average Greater vancouver vacancy rate of rental apartments in 2017
$1,297*average rate of monthly rent in Greater vancouver for 2017
2.8%**average Greater vancouver cap rate 2018 year-to-date
60average age of purpose-built rental apartments
$1.45Btotal sales volume in Greater vancouver for first half of 2018
89number of building transactions in Greater vancouver for first half of 2018
$495,000average price per suite in Greater vancouver for first half of 2018
3,250total number of rental apartment buildings in Greater vancouver
1,925total number of apartment owners in Greater vancouver
MEtRo VAncouVER fActs
*as per CMHC
**as per RealNet
A wise person should have money in their head,
but not in their heart — JoNaTHaN SwifT
”“
In the suburbs, 78 projects are in various forms of development, representing 9,980 suites, all slated for completion by 2023 or sooner. Additionally, we have tracked 528 suites of newly added inventory in various communities delivered to date in 2018, representing 3 separate rental projects. For a complete breakdown of new rental stock by community, please refer to page 4.
Up until about five years ago, many landlords and developers would expand their rental portfolios by purchasing existing assets. Now, however, we’re faced with a preponderance of aging, inefficient product and scarce availability combined with poor economies of scale. Developers able to tap into municipal density incentives for new rental construction are not only building projects on spec but also interestingly retaining new rental buildings for their own account. On page 4, you’ll find an updated comprehensive survey that breaks down new purpose-built rentals in various stages of development throughout Metro Vancouver.
35 years and counting…
We’re very proud to be celebrating our 35th year of publishing the Goodman Report! Thank you for your continued support and constructive comments over the years. We know and understand rental buildings and development sites and remain committed to serving our clients with professionalism and integrity. Call us any time for an evaluation on your property – of course without cost or obligation.

The Goodman Report: 2018 Mid-Year Review6
advOCate’S COrner
Municipal costs including taxes, water, sewer and scavenging fees rise unabated and well above inflation rates. insurance costs have doubled in the last 10 years. Basic maintenance rises yearly, as of course the building is old. i do not have the ability to redevelop the site as the City of Vancouver has a moratorium on redevelopment in my zone. why?
Because they are well aware that private individuals like myself are in fact providing the only affordable housing in this city.
i am compassionate, but providing social housing is not my remit; it is yours. i will be forced to hand out rent increases for the very first time this year, and i am not happy to be doing so.
— LaNdLoRd
Simple ideas can change the world. The overall concepts are mainly drawn from historical precedent, reinterpreted into twenty-first century forms. The ideas are straightforward, but their implementation requires the cooperation of all levels of government and a wide range of public and private agencies. This is a market process and requires open market forces to be fully operational. Rent restrictions and affordability criteria operationalized in property transfer rules are blunt instruments that i believe will deter innovation.
I believe that the best application of affordability efforts is in the promotion of innovation
rather than restriction,
and i would welcome the opportunity to present such alternatives to the Task force.
— deVeLoPeR of ReNTaL HouSiNg
On July 4, we did something we almost never do. We wrote a super-urgent email asking all our readers to stop what they were doing and write to the provincial government ASAP.
Why?
In April, the province appointed a Rental Housing Task Force to “advise on how to improve security and fairness for renters and landlords throughout the province.” We attended the task force’s Vancouver session in June. While popular with renters, the event had very few landlords or property managers. Though this free event was supposedly “sold out,” 60+ people were waitlisted, and most of the tables designated for landlords were empty. It was clearly an unbalanced consultation.
Why it matters?
Imagine being forced to rent out one of your units at the same rate as to a previous tenant, after you’ve spent hundreds of thousands (even millions) upgrading an old building. Imagine a rent of 20 years ago sticking “with the unit” if someone moves out. We’re concerned that the Task Force isn’t truly interested in hearing from landlords. We anticipate that they’ll make sweeping changes to the Residential Tenancy Act that will deter owners from upgrading buildings and stop the construction of purpose-built rentals. If enacted, these changes could ensure the ongoing deterioration of the rental stock, negatively impacting your investment.
If you took the time to let the government know your thoughts, thank you! For a sampling of the responses, check out the column to the right and page 7.
“
“

goodmanreport.com 7
i am deeply concerned about many issues which the provincial government appears to be considering for purpose-built rental buildings which are privately owned and operated.
These ideas have serious consequences which will hurt renters for generations to come.
— LaNdLoRd
if you study markets where there’s no rental control, the markets stay balanced. alberta and Texas are good examples of this. The rents are reasonable because there is a fair market for landlords and tenants. The Residential Tenancy act should be reasonably studied to assess fairness.
The rental industry in B.C. is one of the more highly regulated and controlled industries in the province. There are perhaps 20 tenants to each property owner, which could pose obstacles when trying to hear landlords.
If the interests of landlords are not heard, their investment capital would simply go some place else, leading to no new rental construction.
— LaNdLoRd
we appreciate the challenges government has balancing landlord and tenant concerns. it is essential that market principles be allowed to function. Political interference only serves to drive up costs and act as a disincentive for private investors to provide new or updated/upgraded residences for rent. Having been in the real estate industry since 1980,
I have personally seen how rent controls, development cost charges and restrictive tenancy
regulations have only served to increase rents and discourage development.
— LaNdLoRd
“
““
… it is a universal and strongly held view in both our organization and our industry that the government must retain two critical elements of the current Residential Tenancy act:
1) the annual allowable increase of 2% + CPi (we note some stakeholders suggesting the annual allowable increase should be changed to just CPi); and
2) rent controls tied to the tenant not the unit, i.e., the ability of a landlord to negotiate a new tenancy at tenant turnover on the basis of the market and the actual cost to deliver safe, secure rental housing.
Any reconfiguring of either of these existing provisions under the Act, in whole or in part, will cause irreparable long-term harm to both renters and landlords.
The economics of continuing to provide rental housing will unravel, as will the incentive and ability to invest in one’s property. further, it will be impossible to build any business case for the construction of new purpose-built rental housing. This in our view is the only way in which the private sector can address the critical shortcoming in supply.
— deVeLoPeR of ReNTaL HouSiNg
“

The Goodman Report: 2018 Mid-Year Review8
Building transactionsArea 2018 transactions 2017 transactions % change
Vancouver 39 48 -19%
Suburbs 50 39 +28%
Total 89 87 +2%
Number of suites soldArea 2018 suites sold 2017 suites sold % change
Vancouver 1,278 1,329 -4%
Suburbs 1,643 1,978 -17%
Total 2,921 3,307 -12%
Dollar volumeArea 2018 dollar volume 2017 dollar volume % change
Vancouver $748,768,955 $708,778,000 +6%
Suburbs $696,316,314 $641,843,900 +8%
Total $1,445,085,269 $1,350,621,900 +7%
Average price per suiteArea 2018 $/suite 2017 $/suite % change
Vancouver $585,891 $533,317 +10%
Suburbs $423,808 $324,491 +31%
Total $494,723 $408,413 +21%
Buildings sold and average price per suiteVancouver areas 2018 transactions 2017 transactions 2018 $/suite 2017 $/suite % change
Eastside 15 17 $410,691 $375,206 +9%
Kerrisdale 1 7 $1,108,333 $536,576 +107%
Kitsilano 5 4 $529,430 $513,500 +3%
South Granville 2 8 $475,386 $564,038 -16%
Marpole 4 5 $348,652 $361,667 -4%
West End 12 5 $679,275 $776,801 -13%
Suburban areas 2018 transactions 2017 transactions 2018 $/suite 2017 $/suite % change
Burnaby 15 7 $607,189 $639,763 -5%
New Westminster 12 10 $253,385 $270,147 -6%
North Vancouver 5 6 $504,176 $472,697 +7%
Surrey 4 5 $206,321 $171,100 +21%
White Rock 4 3 $273,958 $212,443 +29%
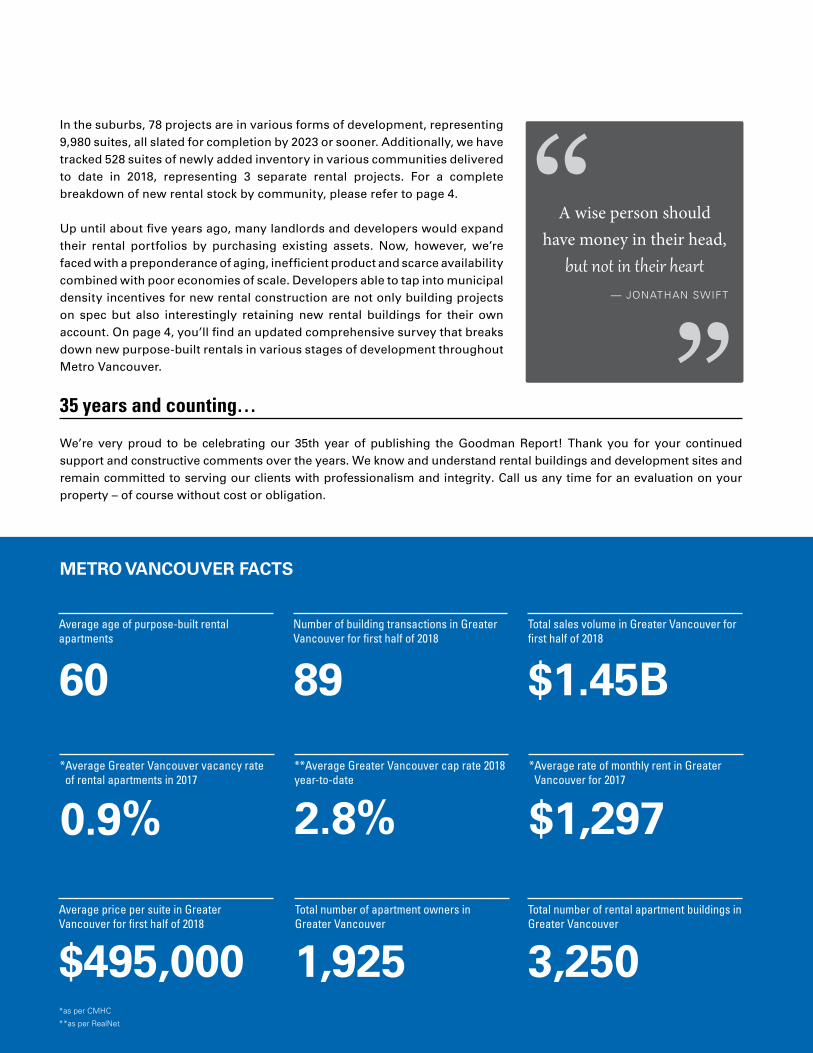
First six months | January 1 to June 30, 2018
aCtivity hiGhliGhtS: 2018 COmPared tO 2017
goodmanreport.com 9
(HR) Highrise
(MR) Midrise
(TH) Townhouse
(ST) Strata
(DS) Development site
(EST) Estimated price
(SP) Share purchase
(NC) New construction
(MU) Mixed-use
(CO) Co-op
The sale information provided is a general guide only. There are numerous variables to be considered such as:
1. Suite mix2. Rent/SF3. Rent leaseable area4. Buildings’ age and
condition5. Location6. Frame or highrise7. Strata vs. non-strata8. Land value
(development site)
9. Special financing
Since 1983
For apartment owners
ADDRESS SUITES PRICE ($) AVG $/UNIT ADDRESS SUITES PRICE ($) AVG $/UNIT
Vancouver (Eastside) Burnaby825 E. 8th Ave 41 $14,350,000 $350,000 ** 7387 10th Ave 13 $2,300,000 $176,923
3618 E. Hastings St (MU) 9 5,725,000 636,111 7110 Linden Ave 30 8,400,000 280,000
2185 Oxford St 8 2,672,000 334,000 4330 Maywood St (DS, SP) 27 13,500,000 500,000
396 E. 2nd Ave 53 24,850,000 468,868 6730 Dow Ave 10 5,900,000 590,000
866 E. Broadway (MU) 8 3,050,000 381,250 4495 Imperial St (DS) 8 4,300,000 537,500
2065 Triumph St 15 5,500,000 366,667 6730 Burlington Ave (DS) 18 11,500,000 638,889
736 E. Broadway (MU) 6 2,800,000 466,667 7227 Arcola St 36 11,350,000 315,278 1) Suite mix
2067 Pandora St 8 3,200,000 400,000 7265 Arcola St 48 TBA TBA 2) Rent/SF
1908 E. 5th Ave 7 3,285,000 469,286 * 6675 Dow Ave (DS) 23 TBA TBA 3) Rent leasable area
2285 Triumph St 16 6,000,000 375,000 6691 Dow Ave (DS) 15 TBA TBA 4) Buildings' age and condition
275 E. 13 Ave 23 9,450,000 410,870 6659 Dow Ave (DS) 16 TBA TBA 5) Location
3038 Commercial Dr (DS) 10 8,000,000 800,000 6645 Dow Ave (DS) 40 TBA TBA 6) Frame or highrise
225 North Garden Dr (SP) 18 5,739,130 318,841 7070 Inlet Dr (DS) 117 32,500,000 277,778 7) Strata vs. non-strata
2333 Oxford St (SP) 51 16,260,870 318,841 6630 Telford Ave (DS) 40 28,500,000 712,500 8) Land value (development site)
1522 E. 3rd Ave 5 3,290,000 658,000 6688 Willingdon Ave (DS) 45 28,000,000 622,222 9) Special financing
278 $114,172,000 $410,691 486 $295,094,050 $607,189
Vancouver (Kerrisdale) Coquitlam* 6310 East Blvd (DS, CO) 12 $13,300,000 $1,108,333 1411 Hachey Ave 22 $4,500,000 $204,545
12 $13,300,000 $1,108,333 605 Como Lake Ave (ST, DS) 44 26,839,000 609,977
545 Sydney Ave (ST, DS) 36 15,575,000 432,639
Vancouver (Kitsilano) 675 North Rd (DS) 76 34,400,000 452,632
2425 York Ave 24 $12,100,000 $504,167 520 Cottonwood Ave (DS, ST) 36 22,500,000 625,000
1875 Yew St 25 10,500,000 420,000 214 $103,814,000 $485,112
* 1406 Laburnum St 10 6,825,000 682,500
* 2358 York Ave 11 7,800,000 709,091 Delta2035 W. 5th Ave 9 4,600,000 511,111 4564 Evergreen Lane 24 $5,300,000 $220,833
79 $41,825,000 $529,430
Langley (HR) Highrise
Vancouver (South Granville) 20669 Eastleigh Cres (TH) 7 $2,745,000 $392,143 (MR) Midrise
230 W. 10th Ave 19 $9,546,200 $502,432 (TH) Townhouse
1110 W. 10th Ave 23 10,420,000 453,043 Maple Ridge (ST) Strata
42 $19,966,200 $475,386 22535 Royal Cres 11 $1,650,000 $150,000 (DS) Development site
(EST) Estimated price
Vancouver (Marpole) Mission (SP) Share purchase
8860 Montcalm St 24 $7,800,000 $325,000 33359 2nd Ave 12 $1,440,000 $120,000 (NC) New construction
8616 Fremlin St 8 2,850,000 356,250 (MU) Mixed-use
8623 Selkirk St 31 11,880,000 383,226 New Westminster (CO) Co-op
1133 W. 70th Ave (ST) 26 8,500,000 326,923 * 420 Eleventh St 61 $13,400,000 $219,672
89 $31,030,000 $348,652 404 Seventh St 42 9,250,000 220,238
610 Blackford St 29 6,670,000 230,000
Vancouver (West End) 329 7th St 21 4,830,000 230,000
1450 Burnaby St (HR, SP) 42 $18,350,000 $436,905 1222 Fifth Ave 21 6,950,000 330,952
** 1040 Barclay St (HR, SP, DS) 40 TBA TBA 508 Eighth St 42 TBA TBA
1005 Jervis St (HR) 135 65,115,338 482,336 1024 St. Andrews Ave 23 6,420,000 279,130
1501 Haro St (HR) 144 81,850,843 568,409 311 Ash St (SP) 27 6,480,000 240,000
1755 Haro St (HR) 138 74,459,574 539,562 530 Ninth St 14 3,600,000 257,143
* 1537 Burnaby St 24 8,750,000 364,583 304 Third Ave 17 5,900,000 347,059
1640-50 Alberni St (DS) 66 130,000,000 1,969,697 76 Coburg St 12 3,500,000 291,667
1057 Barclay St (DS) 29 19,000,000 655,172 * 1210 Seventh Ave 16 5,650,000 353,125
1830 Alberni St (DS, ST) 53 52,000,000 981,132 325 $82,350,000 $253,385
1065 Burnaby St (DS) 15 13,300,000 886,667
1958 Barclay St (HR) 42 19,650,000 467,857 North Vancouver1155 Haro St (HR) 50 16,000,000 320,000 150 E. Keith Rd (HR) 39 $26,493,283 $679,315
778 $528,475,755 $679,275 269 W. 4th St 47 19,400,000 412,766
3701 Princess Ave (TH) 57 41,855,000 734,298
170 W. 5th St 18 TBA TBA
1923 Purcell Way (DS, ST) 90 31,000,000 344,444
251 $126,548,283 $504,176
Port Moody* 2340-50 St. Johns St (MU) 10 $5,120,000 $512,000
10 $5,120,000 $512,000
Surrey13265 104 Ave 57 $13,650,000 $239,474
** 10011 150th St (ST) 23 5,125,000 222,826
5875 177B St (SP) 40 7,400,000 185,000
17719 58A Ave (ST) 39 6,629,981 170,000
159 $32,804,981 $206,321
White Rock** 1371 Blackwood St 45
** 14989 Roper Ave 48
1509 Martin St 42 11,700,000 278,571
15989 Marine Dr (ST) 9 2,500,000 277,778
144 $39,450,000 $273,958
* Sold by The Goodman Team
** December 2017 sale
obtained from sources which we deem reliable, and while thought to be correct, is not guaranteed by HQ Commercial. This is not intended to solicit properties already listed for sale with another agent.
David Goodman604 714 [email protected]
Mark GoodmanPersonal Real Estate Corporation
604 714 [email protected]
Cynthia JaggerPersonal Real Estate Corporation
604 912 [email protected]
Greater Vancouver’s authority on apartment buildings and development sitesgoodmanreport.com
The sale information provided is a general guide only. There are numerous variables to be considered such as:
$25,250,000 $271,505
Apartment Building Sales | Greater VancouverJanuary 1 – June 30, 2018
First six months | January 1 to June 30, 2018
2018 aPartment buildinG SaleS: metrO vanCOuver
Since 1983
For apartment owners
ADDRESS SUITES PRICE ($) AVG $/UNIT ADDRESS SUITES PRICE ($) AVG $/UNIT
Vancouver (Eastside) Burnaby825 E. 8th Ave 41 $14,350,000 $350,000 ** 7387 10th Ave 13 $2,300,000 $176,923
3618 E. Hastings St (MU) 9 5,725,000 636,111 7110 Linden Ave 30 8,400,000 280,000
2185 Oxford St 8 2,672,000 334,000 4330 Maywood St (DS, SP) 27 13,500,000 500,000
396 E. 2nd Ave 53 24,850,000 468,868 6730 Dow Ave 10 5,900,000 590,000
866 E. Broadway (MU) 8 3,050,000 381,250 4495 Imperial St (DS) 8 4,300,000 537,500
2065 Triumph St 15 5,500,000 366,667 6730 Burlington Ave (DS) 18 11,500,000 638,889
736 E. Broadway (MU) 6 2,800,000 466,667 7227 Arcola St 36 11,350,000 315,278 1) Suite mix
2067 Pandora St 8 3,200,000 400,000 7265 Arcola St 48 TBA TBA 2) Rent/SF
1908 E. 5th Ave 7 3,285,000 469,286 * 6675 Dow Ave (DS) 23 TBA TBA 3) Rent leasable area
2285 Triumph St 16 6,000,000 375,000 6691 Dow Ave (DS) 15 TBA TBA 4) Buildings' age and condition
275 E. 13 Ave 23 9,450,000 410,870 6659 Dow Ave (DS) 16 TBA TBA 5) Location
3038 Commercial Dr (DS) 10 8,000,000 800,000 6645 Dow Ave (DS) 40 TBA TBA 6) Frame or highrise
225 North Garden Dr (SP) 18 5,739,130 318,841 7070 Inlet Dr (DS) 117 32,500,000 277,778 7) Strata vs. non-strata
2333 Oxford St (SP) 51 16,260,870 318,841 6630 Telford Ave (DS) 40 28,500,000 712,500 8) Land value (development site)
1522 E. 3rd Ave 5 3,290,000 658,000 6688 Willingdon Ave (DS) 45 28,000,000 622,222 9) Special financing
278 $114,172,000 $410,691 486 $295,094,050 $607,189
Vancouver (Kerrisdale) Coquitlam* 6310 East Blvd (DS, CO) 12 $13,300,000 $1,108,333 1411 Hachey Ave 22 $4,500,000 $204,545
12 $13,300,000 $1,108,333 605 Como Lake Ave (ST, DS) 44 26,839,000 609,977
545 Sydney Ave (ST, DS) 36 15,575,000 432,639
Vancouver (Kitsilano) 675 North Rd (DS) 76 34,400,000 452,632
2425 York Ave 24 $12,100,000 $504,167 520 Cottonwood Ave (DS, ST) 36 22,500,000 625,000
1875 Yew St 25 10,500,000 420,000 214 $103,814,000 $485,112
* 1406 Laburnum St 10 6,825,000 682,500
* 2358 York Ave 11 7,800,000 709,091 Delta2035 W. 5th Ave 9 4,600,000 511,111 4564 Evergreen Lane 24 $5,300,000 $220,833
79 $41,825,000 $529,430
Langley (HR) Highrise
Vancouver (South Granville) 20669 Eastleigh Cres (TH) 7 $2,745,000 $392,143 (MR) Midrise
230 W. 10th Ave 19 $9,546,200 $502,432 (TH) Townhouse
1110 W. 10th Ave 23 10,420,000 453,043 Maple Ridge (ST) Strata
42 $19,966,200 $475,386 22535 Royal Cres 11 $1,650,000 $150,000 (DS) Development site
(EST) Estimated price
Vancouver (Marpole) Mission (SP) Share purchase
8860 Montcalm St 24 $7,800,000 $325,000 33359 2nd Ave 12 $1,440,000 $120,000 (NC) New construction
8616 Fremlin St 8 2,850,000 356,250 (MU) Mixed-use
8623 Selkirk St 31 11,880,000 383,226 New Westminster (CO) Co-op
1133 W. 70th Ave (ST) 26 8,500,000 326,923 * 420 Eleventh St 61 $13,400,000 $219,672
89 $31,030,000 $348,652 404 Seventh St 42 9,250,000 220,238
610 Blackford St 29 6,670,000 230,000
Vancouver (West End) 329 7th St 21 4,830,000 230,000
1450 Burnaby St (HR, SP) 42 $18,350,000 $436,905 1222 Fifth Ave 21 6,950,000 330,952
** 1040 Barclay St (HR, SP, DS) 40 TBA TBA 508 Eighth St 42 TBA TBA
1005 Jervis St (HR) 135 65,115,338 482,336 1024 St. Andrews Ave 23 6,420,000 279,130
1501 Haro St (HR) 144 81,850,843 568,409 311 Ash St (SP) 27 6,480,000 240,000
1755 Haro St (HR) 138 74,459,574 539,562 530 Ninth St 14 3,600,000 257,143
* 1537 Burnaby St 24 8,750,000 364,583 304 Third Ave 17 5,900,000 347,059
1640-50 Alberni St (DS) 66 130,000,000 1,969,697 76 Coburg St 12 3,500,000 291,667
1057 Barclay St (DS) 29 19,000,000 655,172 * 1210 Seventh Ave 16 5,650,000 353,125
1830 Alberni St (DS, ST) 53 52,000,000 981,132 325 $82,350,000 $253,385
1065 Burnaby St (DS) 15 13,300,000 886,667
1958 Barclay St (HR) 42 19,650,000 467,857 North Vancouver1155 Haro St (HR) 50 16,000,000 320,000 150 E. Keith Rd (HR) 39 $26,493,283 $679,315
778 $528,475,755 $679,275 269 W. 4th St 47 19,400,000 412,766
3701 Princess Ave (TH) 57 41,855,000 734,298
170 W. 5th St 18 TBA TBA
1923 Purcell Way (DS, ST) 90 31,000,000 344,444
251 $126,548,283 $504,176
Port Moody* 2340-50 St. Johns St (MU) 10 $5,120,000 $512,000
10 $5,120,000 $512,000
Surrey13265 104 Ave 57 $13,650,000 $239,474
** 10011 150th St (ST) 23 5,125,000 222,826
5875 177B St (SP) 40 7,400,000 185,000
17719 58A Ave (ST) 39 6,629,981 170,000
159 $32,804,981 $206,321
White Rock** 1371 Blackwood St 45
** 14989 Roper Ave 48
1509 Martin St 42 11,700,000 278,571
15989 Marine Dr (ST) 9 2,500,000 277,778
144 $39,450,000 $273,958
* Sold by The Goodman Team
** December 2017 sale
obtained from sources which we deem reliable, and while thought to be correct, is not guaranteed by HQ Commercial. This is not intended to solicit properties already listed for sale with another agent.
David Goodman604 714 [email protected]
Mark GoodmanPersonal Real Estate Corporation
604 714 [email protected]
Cynthia JaggerPersonal Real Estate Corporation
604 912 [email protected]
Greater Vancouver’s authority on apartment buildings and development sitesgoodmanreport.com
The sale information provided is a general guide only. There are numerous variables to be considered such as:
$25,250,000 $271,505
Apartment Building Sales | Greater VancouverJanuary 1 – June 30, 2018

The Goodman Report: 2018 Mid-Year Review10
For the first half of this year, transactions and dollar volumes remain essentially on par with the comparable period in 2017, while average prices have increased dramatically. A total of 89 sales occurred in the first six months of 2018, essentially mirroring the 87 sales in the corresponding period of 2017. Transactions to June 30, 2018 in Vancouver declined to 39, whereas 48 sales were recorded in 2017. As for the suburbs, an increase to 50 transactions have been registered in 2018, compared to 39 in the same period last year. Perhaps indicative of a somewhat slowing market, 128 building sold in the first 6 months of 2016 (two years ago) compared to this year’s 89 sales – a 30% decrease in overall sales activity.
Nevertheless, our latest research reveals clear evidence of a robust investment market in rental apartments. Metro Vancouver’s soaring values have surpassed historic highs, with average prices at $495,000 per suite, up from $408,000 per suite a year ago: a 21% increase. Vancouver’s averages are a remarkable $586,000 per suite, up 10% from last year’s figure of $533,000. Meanwhile the suburban averages have soared to $424,000, up 31% from a year ago at $325,000.
The shift to significant higher average prices must be seen in context. Partial credit goes to the approximately
22 properties acquired specifically by developers in Vancouver’s West End and in Coquitlam and Burnaby, significantly inflating the typical suite averages well above the norm. Another factor involves newly renovated and newly constructed product, which also skews the average price per unit beyond traditional figures.
For the first six months of 2018, total dollar volume for Metro Vancouver was $1.445 billion, up 7% from $1.35 billion in 2017. Broken down, Vancouver 2018 volume was $749 million, up 6% from $709 million in 2017, suburban volume also at $696 million, was up 8% from 2017’s volume of $642 million.
The total number of suites sold in Metro Vancouver in the first half of 2018 was 2,921, down 12% from 3,307 in 2017. Vancouver had a 4% decline from 1,329 suites in 2017 to 1,278 in 2018, whereas the suburbs had a significant decrease of 17% to 1643, down from 1,978 in 2017 (for the specific breakdown in all categories, please refer to Activity Highlights on page 8).
We forecast that approximately 165 buildings will sell in 2018, with record-high dollar volume expected to be approximately $2.6 billion.
2.0%
2.5%
3.0%
3.5%
4.0%
4.5%
5.0%
5.5%
2008 2009 2010 2011 2012 2013 2014 2015 2016 2017 2018 ytd
Greater Vancouver rental apartment cap rates An 11-year picture (2008–2018)
City Suburbs GVA (City & Suburbs)
data provided by RealNet
year-tO-year COmPariSOn

goodmanreport.com 11
ShiFtinG SandS
Renovating rental stock: Rewards come with new risks
Shifting Sands is a series by Claire Immega, lawyer at Singleton Reynolds, reporting on legal and political issues that impact apartment building owners. Claire can be reached at (604) 673-7401 or [email protected]
Throughout British Columbia, and particularly in Metro Vancouver, much of the rental stock is aging and requires major renovations. In a market with skyrocketing construction costs, bringing a building’s envelope, plumbing, electrical and environmental systems up to date can be very expensive. Many building owners need to increase the value of outdated rent rolls in order to make major renovations fit their business models within the context of prevailing cap rates. Yet rather than incentivizing owners to perform these much-needed repairs, local governments have increasingly been making it difficult to secure a return on costly renovations.
In 2015, the City of Vancouver implemented the Tenant Relocation and Protection Policy, requiring that landlords who are ending tenancies in order to perform major renovations or demolition must provide significant compensation and assistance to displaced tenants. Other municipalities may follow suit.
Recent changes to the Residential Tenancy Act (RTA) and decisions from the B.C. Supreme Court are going further. As of May 2018, the RTA includes an increased notice period for ending a tenancy and significant penalties if a landlord acts in bad faith. In Baumann v. Aarti Investments Ltd., released on April 6, 2018, the Supreme Court has decided that a tenant can offer to leave his or her unit for the duration of a significant renovation, even if the unit is going to be uninhabitable for 3–4 months (or longer), and return at the same rent. Baumann is currently under appeal, and the outcome is uncertain. However, this potential change in the law could detract dramatically from the financial feasibility of significant renovations.
The provincial government has struck the Rental Housing Task Force, headed by MLA Spencer Chandra Herbert, to provide further recommendations for changes to the RTA to protect renters. In the current housing market, protection for tenants from predatory landlords may be a good idea; however, recommendations to the task force by tenant unions and other interest groups on renovations and other issues are striking fear into the hearts of many landlords, and some changes, if implemented, may seriously erode the availability of rental housing in B.C.
What’s going to happen is anybody’s guess. Building owners operating on today’s shifting legal sands should get top-notch advice, advocate for themselves and their peers, and pay close attention to legal developments both from the courts and from the legislature.
induStry eXPertS SPeak
6675 & 6691 DoW st, BuRnABY
High density site—up to 6.3 FSR. 2 lots totalling 35,580 SF in Metrotown Downtown OCP
PRicE tBA
2358 YoRk AVE, VAncouVER
11 suites in Kitsilano. Totally renovated.Ocean and mountain views
solD $7,800,000
1210 sEVEnth st, nEW WEstMinstER
16-suite renovated apartment buildingFraser River views
solD $5,650,000
solD solD solD
suBjEct

David Goodman Direct 604 714 4778 [email protected]
Mark GoodmanPersonal Real Estate Corporation Direct 604 714 4790 [email protected]
Cynthia JaggerPersonal Real Estate CorporationDirect 604 912 9018 [email protected]
goodmanreport.com
HQ Commercial 320–1385 West 8th Ave Vancouver, BC V6H 3V9