Fatigue Analysis of Welded Structures Using nCode DesignLife

© 2018 HBM
HBM Prenscia: Public
2018 nCode User Group Meeting
February 28 ‐ March 1, 2018 – Novi, MI USA

HBM Prenscia: Public
© 2018 HBM
Correlating Virtual Fatigue Results withTest Failures
Kurt MunsonManager, Applications Engineering
3© 2018 HBM Prenscia Inc.
HBM Prenscia: Public
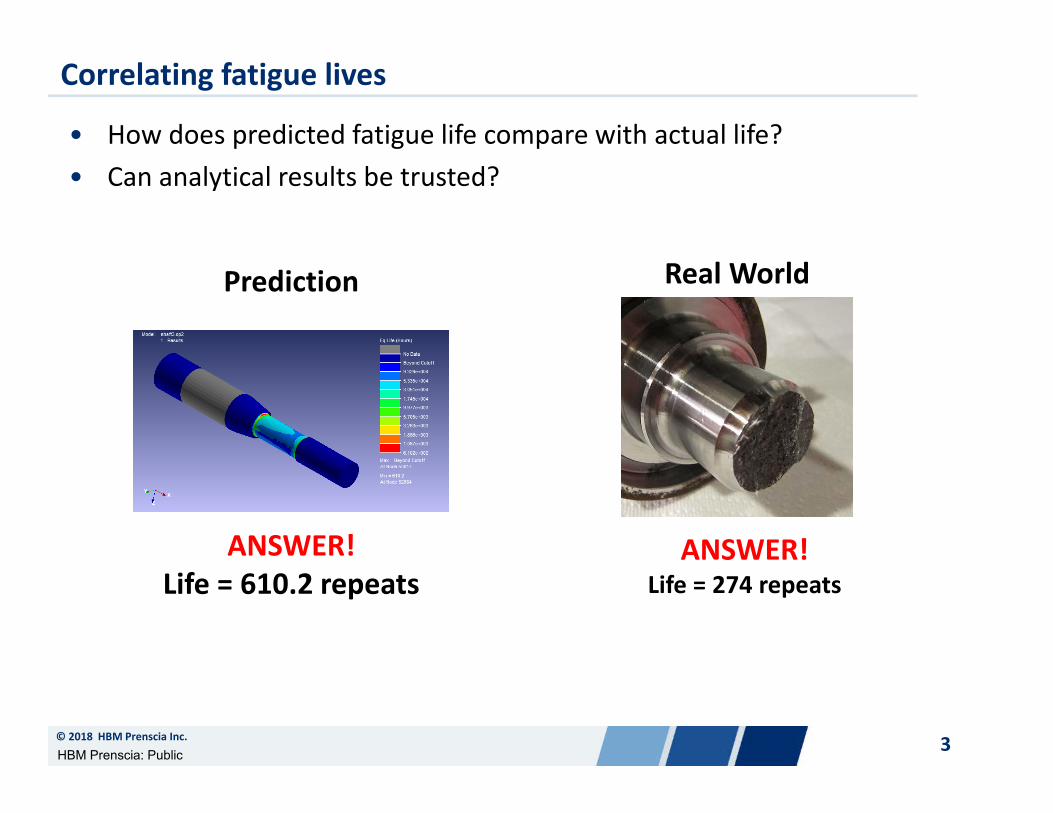
Correlating fatigue lives
• How does predicted fatigue life compare with actual life?• Can analytical results be trusted?
ANSWER!Life = 610.2 repeats
ANSWER!Life = 274 repeats
Prediction Real World
4© 2018 HBM Prenscia Inc.
HBM Prenscia: Public
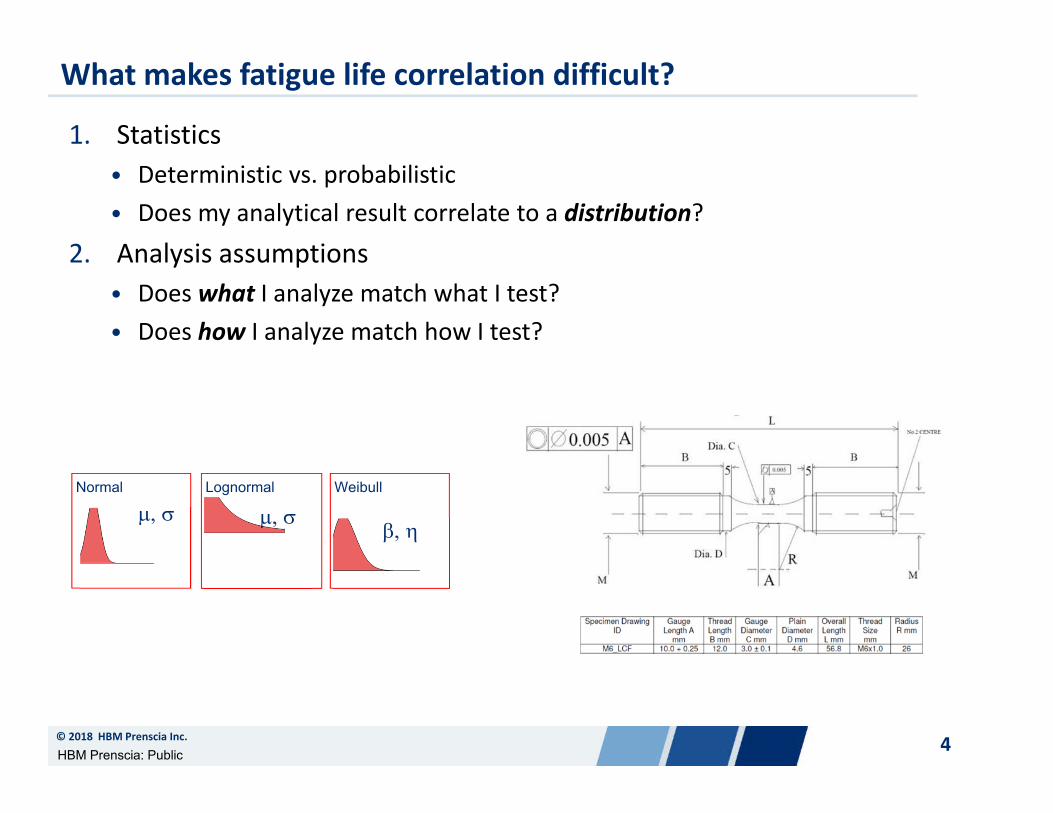
What makes fatigue life correlation difficult?
1. Statistics• Deterministic vs. probabilistic• Does my analytical result correlate to a distribution?
2. Analysis assumptions• Does what I analyze match what I test?• Does how I analyze match how I test?
Weibull
LognormalNormal

5© 2018 HBM Prenscia Inc.
HBM Prenscia: Public
What makes fatigue life correlation difficult?
1. Statistics• Deterministic vs. probabilistic• Does my analytical result correlate to a distribution?
2. Analysis assumptions• Does what I analyze match what I test?• Does how I analyze match how I test?
Weibull
LognormalNormal
6© 2018 HBM Prenscia Inc.
HBM Prenscia: Public
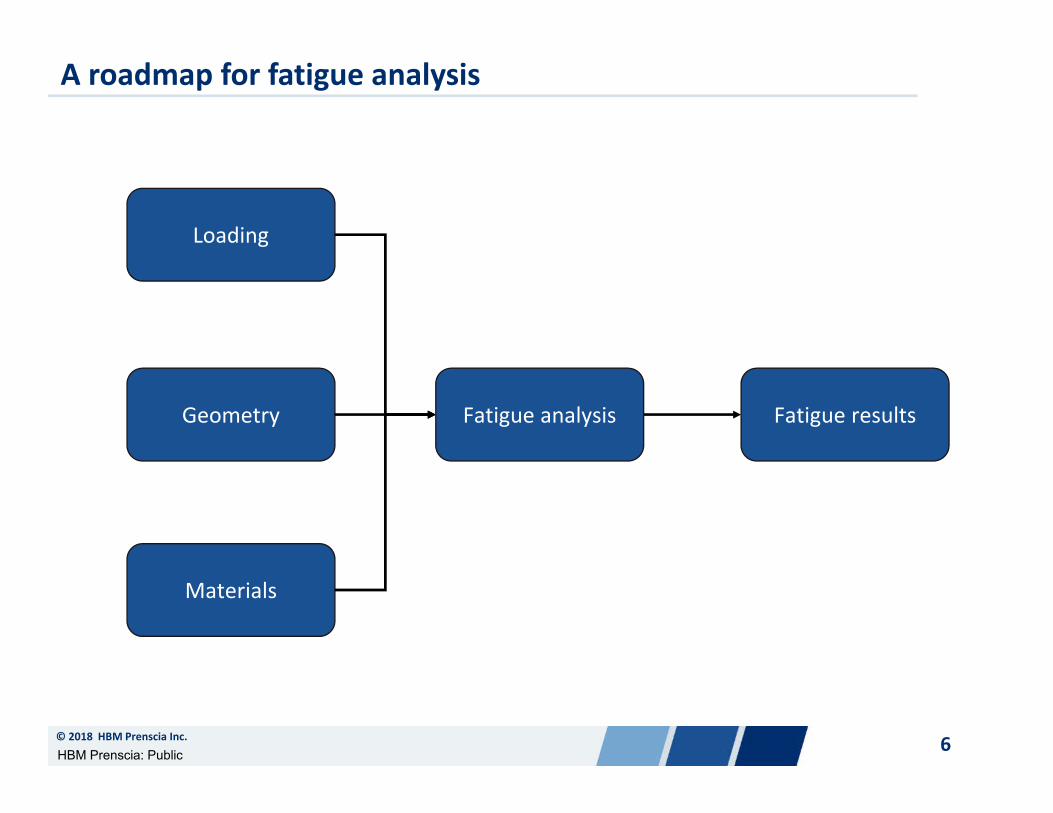
A roadmap for fatigue analysis
Loading
Geometry
Materials
Fatigue analysis Fatigue results

7© 2018 HBM Prenscia Inc.
HBM Prenscia: Public
Deterministic fatigue
Loading distribution
Geometry variability
Material variability
Fatigue analysisDistribution of results

8© 2018 HBM Prenscia Inc.
HBM Prenscia: Public
Deterministic correlation
• Is predicted life the same as actual life?• Or using a 2x rule of thumb, is the life within a 2x scatter band?
ANSWER!Life = 610.2 repeats
ANSWER!Sample 1 Life = 274 repeatsSample 2 Life = 974 repeats
::
Prediction Real World
≠

9© 2018 HBM Prenscia Inc.
HBM Prenscia: Public
Probabilistic fatigue
Loading distribution
Geometry variability
Material variability
Fatigue analysisDistribution of results

10© 2018 HBM Prenscia Inc.
HBM Prenscia: Public
Statistical correlation
• Also known as Weibull analysis or life data analysis• What can life distributions tell us?
ANSWER!Life = 610.2 repeats
ANSWER!Sample 1 Life = 274 repeatsSample 2 Life = 974 repeats
::
Prediction Real World

11© 2018 HBM Prenscia Inc.
HBM Prenscia: Public
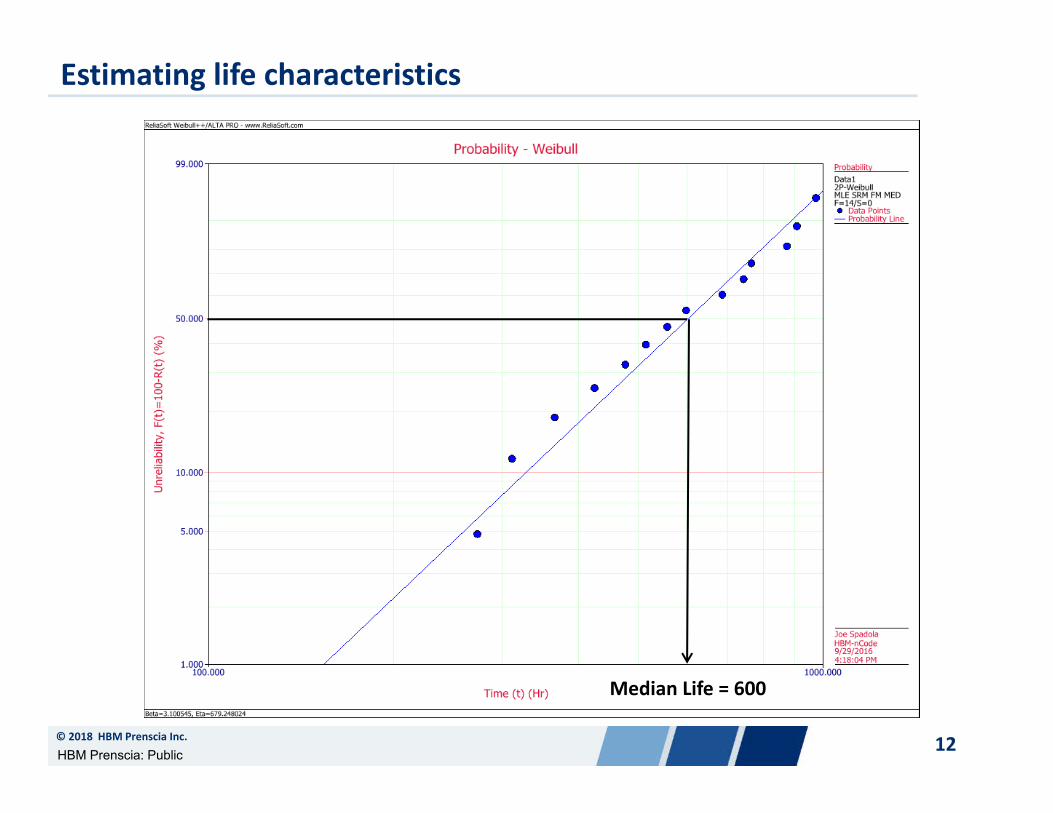
Weibull analysis
The attempt to make predictions about the life of all products in a population by fitting a statistical distribution to life data from a representative sample of units
1. Gather life data from field or test lab2. Select a distribution that will properly model life of the part3. Estimate parameters that will fit the distribution to the data4. Estimate life characteristics (e.g. reliability or mean life)
12© 2018 HBM Prenscia Inc.
HBM Prenscia: Public
Estimating life characteristics
Median Life = 600

13© 2018 HBM Prenscia Inc.
HBM Prenscia: Public
Understanding confidence bounds
• The confidence bounds are estimates of the likelihood that a sample will fall within a set of values
• The sample size has a large influence on these confidence bounds
Median Life582
890150

14© 2018 HBM Prenscia Inc.
HBM Prenscia: Public
Number of samples and confidence bounds
• As the sample population increase, the confidence bounds move closer together
B50 Life603.5
700480

15© 2018 HBM Prenscia Inc.
HBM Prenscia: Public
Is correlation achieved?
• Yes, if the simulated life result falls within the confidence bounds.
B50 Life603.5
700480
Predicted mean life610

16© 2018 HBM Prenscia Inc.
HBM Prenscia: Public
What makes fatigue life correlation difficult?
1. Statistics• Deterministic vs. probabilistic• Does my analytical result correlate to a distribution?
2. Analysis assumptions• Does what I analyze match what I test?• Does how I analyze match how I test?

17© 2018 HBM Prenscia Inc.
HBM Prenscia: Public
Loading and test conditions• Nominal vs. worst case• Are test fixtures infinitely stiff?
Modelling assumptions vs. test conditionsLoading
Geometry
Materials
Fatigue analysis
Fatigue results

18© 2018 HBM Prenscia Inc.
HBM Prenscia: Public
Are test fixtures infinitely stiff?
Modelling assumptions vs. test conditions

19© 2018 HBM Prenscia Inc.
HBM Prenscia: Public
Geometry• Is my FE model based on design
geometry or as‐manufactured?• Draft, radii, extra holes, etc. to make it
manufacturable• Worst case vs. nominal geometry?
• Assembly stackup• Where did the test samples come from?
• Prototype, best from the production line, randomly chosen, etc.?
Modelling assumptions vs. test conditionsLoading
Geometry
Materials
Fatigue analysis
Fatigue results
20© 2018 HBM Prenscia Inc.
HBM Prenscia: Public
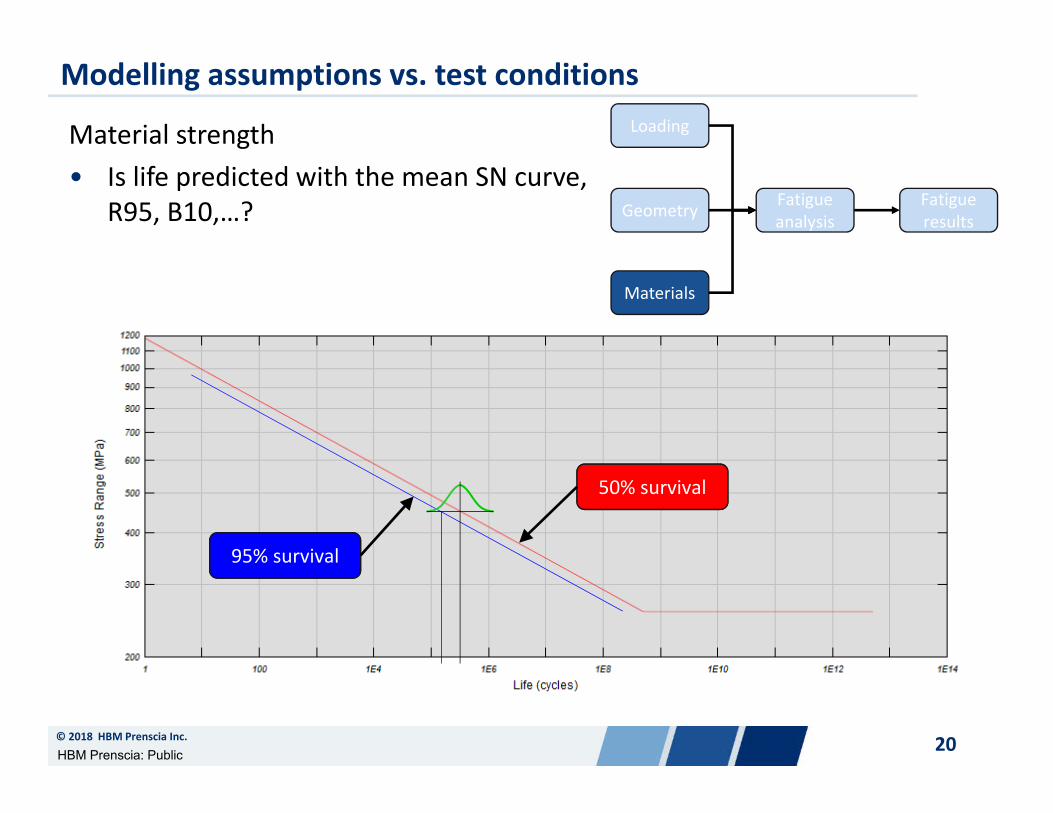
Material strength• Is life predicted with the mean SN curve,
R95, B10,…?
Modelling assumptions vs. test conditions
95% survival
50% survival
Loading
Geometry
Materials
Fatigue analysis
Fatigue results

21© 2018 HBM Prenscia Inc.
HBM Prenscia: Public
• What is the definition of failure?• Analysis = crack initiation• Test = fracture
Modelling assumptions vs. test conditionsLoading
Geometry
Materials
Fatigue analysis
Fatigue results
1st crack initiates here
But 2nd crack here leads to fracture

22© 2018 HBM Prenscia Inc.
HBM Prenscia: Public
Is correlation achieved?
• If modelling with worst case, expect the predictions to fall to the left side of the life distribution, not in the middle
B50 Life603.5
700480Predicted life

23© 2018 HBM Prenscia Inc.
HBM Prenscia: Public
Recommendations for improving fatigue life correlation
1. Use statistical techniques to quantify bounds on fatigue life2. Recognize interaction between sample size and confidence bounds3. Review assumptions in FE analysis vs. test conditions4. Don’t expect analysis results to match mean life if analysis is done
with worst case
Weibull
LognormalNormal

HBM Prenscia: Public
© 2018 HBM
www.hbmprenscia.com
Kurt Munson
Manager, Applications Engineering


![Using virtual strain gauges to correlate with bending and ... · shown in Fig 2 with virtual strain gauges applied using nCode DesignLife [2]. This shows forward and aft groups of](https://static.fdocuments.net/doc/165x107/5e72bfef1d1ce06035373e96/using-virtual-strain-gauges-to-correlate-with-bending-and-shown-in-fig-2-with.jpg)