2018 Ghana Banking Survey - pwc.com · PwC 2018 Ghana Banking Survey 3 the Nigerian experience to...
99
www.pwc.com/gh August 2018 2018 Ghana Banking Survey Having secured the new capital; what next for banks?
Transcript of 2018 Ghana Banking Survey - pwc.com · PwC 2018 Ghana Banking Survey 3 the Nigerian experience to...

www.pwc.com/gh
August 2018
2018 Ghana Banking Survey Having secured the new capital; what next for banks?

2018 Ghana Banking Survey 1PwC
Contents- A message from our CSP 2
- A message from the Executive Secretary of Ghana Association of Bankers (GAB)
6
- A message from our Tax Leader 8
1 Recapitalising Banks: The Nigerian Experience 12
2 Survey findings 16
3 An Overview of the Economy 28
4 Key developments in the banking industry 32
5 Quartile analysis 36
6 Market share analysis 56
7 Profitability and efficiency 66
8 Return to shareholders 72
9 Liquidity analysis 78
10 Asset quality analysis 84
- Appendix: A-List of banks in Ghana as at June 2018 92
- Appendix:B-Glossary of key financial terms, equations and ratios 93
- Appendix:C-Our Business School 94
- Appendix:D-Our leadership team 95
- Appendix: E-List of abbreviations 96
- Key Contacts 97
2018 Ghana Banking Survey 2PwC
Build up to this year’s survey
Bank of Ghana (BoG), through a directive issued on 11 September 2017, increased the minimum stated capital requirement of universal banks operating in Ghana from GHS120 million to GHS400 million and required that banks comply by the end of December 2018. This, BoG stated, is to “further develop, strengthen and modernise the financial sector to support the Government’s economic vision and transformational agenda”.
Following the directive for banks to increase their minimum stated capital, BoG, in line with their legislated authority, has taken some regulatory actions to deal with troubled banks. In a period of less than a year, ahead of the deadline given by the regulator for meeting the new minimum capital, the
number of banks has reduced in the wake of a number of decisive actions taken by the regulator.
The subject of an increased minimum stated capital has set off a rather charged conversation in bank boardrooms, the regulator’s and shareholders’ offices, bank Executive Committee meetings, bank personnel huddles, key customers and depositors’ homes. The conversation has carried on for a while on traditional media and social media platforms too. Among the myriad of questions asked, one that rang loud and clear was that asked by many bank CEOs – “What would we do with all that capital, assuming we raise all of it?”
This question has provided the theme for this year’s banking survey, as we felt it would indeed be useful to find out from the leadership of the banking industry the ideas they are contemplating for surviving this regulatory shakeout, and – beyond the deadline – their plans for building a stronger and thriving business.
Meeting the new minimum capital requirement
Truth is that this is not the first time that the banking industry in Ghana has been faced with a mandatory minimum capital raise. It would appear that the key difference this time is with the deadline – no phased timelines for any player category.
Banks, generally have three main options for meeting the new minimum capital requirement; i.e. (1) Injection of fresh capital; (2) Capitalisation of reserves; and (3) Business consolidations. And, at the time of writing this report, it was fairly apparent which banks or categories of banks are using what options.
It would seem that tier 1 and 2 banks would rely on the capitalisation of their reserves due to the relatively larger reserves of these banks. Foreign banks in the industry may rely on fresh capital injection from their parent entities, although this may serve as a complementary source, considering that they may also rely on distributable reserves. Some banks have also announced plans/ efforts to raise capital locally. However, with the Ghana capital market experiencing bearish conditions, generally, it would seem that banks would find it difficult to raise the capital needed to meet the regulator’s requirements. In all of these, it would seem that the local banks are hardest hit. Curiously, many of these banks, for which the first and second options seem beyond their means, appear averse to the third option. However, BoG, on 14 August 2018, approved a request by BSIC and Omni Bank to merge their businesses, whilst five other local banks have had their licenses revoked by the regulator and their businesses consolidated into one entity, now called Consolidated Bank Ghana (CBG) Limited.
So, though it was not disclosed as an express objective of the minimum capital increment, we have seen some amount of consolidation already, although these have been regulator-induced based on the deteriorating asset quality, inadequate capital and liquidity challenges faced by the merged banks. We expect that the industry would have experienced some more consolidations by the end of the 2018 financial year.
Lessons from Nigeria
Considering that minimum capital raises are not new in this region, we felt it would be instructive to find out a bit more about
Vish Ashiagbor
Country Senior Partner
A message from our CSP
2018 Ghana Banking Survey 3PwC
the Nigerian experience to throw light on some of the “likely futures” that the Ghana banking industry might evolve into after expiry of BoG’s deadline. Below are a few significant developments in the Nigerian experience, which we think are appropriate to highlight for the various stakeholders in the Ghana industry to mull over. In summary, the Central Bank of Nigeria (CBN), in 2005, undertook a recapitalisation exercise that saw the minimum capital for banks in Nigeria raised to N25 billion (US$192.2. million1) from N1 billion (US$7.7 million1) for existing banks and N2 billion (US$15.4 million1) for new entrants.
• Total number of banks in Nigeria shrank from 89 to 25
• The Nigerian banking industry, arguably, transformed into one with stronger banks that had the capacity to compete at a regional level, beyond Nigeria. The Ghana banking industry experienced an influx of Nigerian banks including Zenith Bank, InterContinental, GT Bank, UBA and Access Bank.
• The industry’s total assets grew from N3,753.3 billion (US$28.9. billion1) at December 2004 to N4,515.1 billion (US$34.7. billion1) at December 2005, enabling banks to finance bigger projects and investments.
These positive changes came with some challenges. To address the challenges that arose in the wake of the industry’s consolidation, and enhance the attractiveness of the industry, the CBN introduced various control measures. We have discussed many of these challenges and the CBN’s responses in this report.
1all USD Conversions reflect CBN’s average interbank rates for December 2005
A message from our CSP

2018 Ghana Banking Survey 4PwC
We should note that a common strain found in both regulators of the two jurisdictions relates to their proactive approach. In similarity with the Nigerian experience, BoG has already implemented interventions as if in anticipation of some of the developments that arose in the Nigerian banking industry, and also to minimise the probability of a “new, stronger banking industry” soon slipping into problems that are the result of weak corporate governance practices.
What do bank leadership and executive teams aim to do with the new expanded capital?
The survey revealed that bank executives are preoccupied with improving the operational efficiency of their businesses, as well as increasing their earning potential. As a result, they are likely to deploy part of their new/ increased capital into programmes or initiatives that will help them to achieve these.
Digital, improved service delivery, and enhanced customer experience were among the common words and phrases used by bank executives in their conversations with us. Many bank executives were of the view that these were key to achieving increased market presence or deeper market penetration, and were important for achieving cost efficiency in operations as well as increased earning potential. The traditional route to market involving branch expansion via brick and mortar was characterised as outdated and seemed to lack support among the majority of bank executives who also described it as not cost effective.
Investments in technology would also be targeted at improving banks’
A message from our CSP A message from our CSP
2018 Ghana Banking Survey 5PwC
risk management systems to ensure that capital is adequately protected and liquidity is prudently managed in conformity with regulatory requirements. Additionally, technology investments would aim at generally guarding the business against the heightened cyber security risks in a digital operating environment.
Interestingly, bank executives were less concerned about new product development, observing that the industry was awash with many products already. In their view, the challenge has been with market penetration and/or cost-effective distribution of these products. Hence, the focus will be on innovating around how to digitise these products and distribute them widely using digital channels.
Bank executives also mentioned that additional areas that will have their attention after they meet the regulator’s demands relate to corporate governance, and talent. Bank executives, on the back of the recent bank failures, noted that Boards must be truly independent, strengthened and challenged to abide by best practices to ensure that they properly represent the varied interests of the wider communities of stakeholders that are associated with banks. Additionally, banks must invest to enrich their talent capital to make them relevant and efficient in a digital operating model. It was very unlikely that banks (though probably bigger after December 2018) would embark on massive recruitment drives..
Though not mentioned as an expressed objective, a key, unavoidable, result of the new minimum capital requirement would be consolidation. The surviving banks are expected to
be stronger and well capitalised. If bank executives’ responses to our questions during the survey are anything to go by, the industry is set to see quite some exciting times in 2019 and the years after. We expect to see the “bold and quick” hit the streets with some innovative digital products that would excite customers about banking with some interesting experiences. These are likely to be existing products that have been improved through digitisation. Alongside, we expect the regulator to continue examining the remaining players through enhanced supervision and compliance across every aspect of their businesses, from governance to technology, to ensure that problems are identified early and nipped in the bud.
Banks will continue to need help to realise their visions around operating efficiency and earning potential. In our view, such help revolves around formulating a solid market strategy, building customer-focused business models, fostering innovation and embedding it as part of banks’ DNA, data and analytics, entrenching digital for enhanced delivery experiences, all the time managing risk, regulations and capital proactively.
Admittedly, it’s a complex dance and might seem challenging for most bank executives trying to align the pieces to achieve targets around growth, cost, profits, liquidity, capital, etc. Our Financial Services Industry Group is always eager to share our expertise and experience with banks and we will be happy to engage with you. Do contact us on 0302 761 500.
Happy reading!
In conclusion
Follow us on…
@PwCGhana
A message from our CSP A message from our CSP
2018 Ghana Banking Survey 6PwC
The role of capital to financial intermediaries such as banks cannot be overemphasized. Not
only are risks created by the primary functions of taking funds from the “haves” for onward lending to the “have nots” but also by the new and complex products and services offered by financial institutions nowadays. To ensure that these institutions have also invested enough funds to absorb the risks introduced by their functions, Bank of Ghana (BoG), through a directive issued on 11 September 2017, increased the minimum regulatory monetary capital and required that banks comply by the end of December 2018. BoG also issued the new Capital Requirements Directive (CRD) to banks and other deposit-taking financial institutions effective January 2018, with the first set of reports expected by July 2018.
The move is expected to ensure financial soundness for the individual banks and the entire banking system, allow banks to deal with some of the single obligor limitations and support the Government economic agenda. The directive
indicated (a) injection of fresh capital, (b) capitalisation from income surplus and (c) a combination of both as options to meet the new minimum regulatory monetary capital requirement. Not surprisingly, many of the first and second quartile banks are far advanced with plans to meet the requirement via option (b). Other foreign owned banks are using option (c), with the parent banks willing to inject additional capital to augment what can be transferred from income surplus. Those who seem to be having challenges are the third and fourth quartile banks mostly locally owned.
In April 2018, the locally-owned banks submitted a petition to the Presidency requesting for an extension in the deadline to meet the additional minimum capital requirement. This supports the fact that many of them are having challenges in meeting the new requirement. The good news however is that these local banks do recognise they would have to meet this requirement to keep their universal banking licenses but are asking for time. Suggestions relating to mergers and acquisitions among these banks have been made but these have not seen the needed traction given the differences in culture, strategies, goals and objectives for which many of these banks were initially set up. Government’s response coupled with recent pronouncements by the regulator on this additional minimum capital requirement are enough indication to the industry that the regulator is not likely to compromise on the deadline for compliance of 31 December 2018 as earlier communicated.
This year’s survey seeks to find answers to the question: what next for the banks, having secured the new capital? In line with the role of capital for banks indicated above, the regulator’s focus, in addition to the injection of the new minimum capital, will be on
improvement of the risk environment, culture, management, measurement and disclosures. These go to the core of how the business of banking is undertaken by the financial institutions in the first place. Risk management will no longer be expected to only be an outcome (an afterthought) of transactions undertaken or balances held by banks on reporting dates but will influence decisions relating to which transactions to undertake. Risk management will inform which risks, as well as how much of such risks, banks should assume in the first place. The need for this additional minimum capital is expected to remind management and shareholders of banks to put in place structures and systems to better understand and manage the risks they are exposed to, including building on the capacity of their personnel.
The implementation of the Capital Requirements Directive which is linked to the minimum additional regulatory capital is expected to go a long way to help management and shareholders of these institutions to continuously evaluate their banking operations and ensure the right level of capital is maintained to absorb the risks created and/or assumed. Going forward, banking decisions are not only expected to be influenced by profit motives, but also by the capital charges under the Capital Requirement Directive (CRD) which follow partly the requirements of Basel II and III. These together will provide useful reminders to decision makers on the need for an appropriate balance between profitability and risk or capital charges to protect not only depositors and creditors of these institutions but the entire banking system.
One consequence of the funds injected by banks by way of additional minimum capital will be enough buffer created for many of these banks to absorb risks associated with their present operations.
A message from the Executive Secretary of Ghana Association of Bankers (GAB)
D. K. Mensah
Executive Secretary, Ghana Association of Bankers
2018 Ghana Banking Survey 7PwC
Aside expenditures relating to improving the risk environment, management, procedures and policies in place, banks may use these funds to improve operational efficiencies in areas such as information technology, human capital, corporate governance etc. In addition to these, the additional funds may be used to improve the quality of assets or used to increase earning assets for some of these banks even though this may not be the traditional role of capital to banks.
My expectation is that responses to the survey questionnaire will provide enough insights on what banks are looking forward to after meeting the additional minimum capital requirements to help shape other regulator interventions where possible. Shareholder expectations need to be properly managed so as not to diminish the loss or risk absorption potentials of the additional funds injected. Recent experience indicate that aggressively pursuing perhaps profitable but more risky transactions in order to maximise shareholder returns may not be a sustainable option. The additional funds realised from the capital increase should be judiciously deployed and in doing so, management and shareholders of these financial institutions should not lose sight of the reasons why the regulator had to call for the additional capital in the first place.
In conclusion, the measures introduced by Bank of Ghana relating to both minimum regulatory monetary capital and the capital adequacy or risk and capital charge requirements are all intended to provide not just enough buffer to absorb the risks faced by these financial institutions but also cause a paradigm shift in risk management practices at these institutions to ensure financial soundness. The industry is expectant and I believe the key actors will do all it takes for the realisation of these objectives.
A message from the Executive Secretary of Ghana Association of Bankers (GAB)
2018 Ghana Banking Survey 8PwC
Ghana Revenue Authority (GRA) an annual report that provides information with respect to each reportable account maintained by that financial institution for a calendar year after applying the required and relevant due diligence procedures.
This report is due within six (6) months following the end of the calendar year to which the report relates. Even where a reporting financial institution does not identify a reportable account for the year after applying the required due diligence procedures, that institution is mandated to file an annual report which states that the institution does not maintain a reportable account..
Are all banks required to comply with Act 967?
Unless specifically exempted by a GRA notice, all financial institutions are required to comply with this reporting requirement and submit the relevant financial information to the C-G of the GRA.
The C-G is required to publish in the Gazette and at least two daily newspapers of nationwide circulation, a Government Notice specifying:
i. List of participating and reportable jurisdictions;
ii. List of excluded accounts; and
iii. List of non-reporting financial institutions.
As at July 2018, no notice had been issued by the C-G. My expectation is that almost all the countries that are signatories to the OECD automatic exchange of information would be part of the reportable jurisdictions and only few accounts would be excluded from this reporting requirement, for instance accounts of Government entities.
One of the key trending topics in the banking sector since the beginning of 2018 is bank
recapitalisation. In our 2017 banking survey report, we highlighted some of the main tax and regulatory considerations for banks in complying with the increase in minimum regulatory capital requirement. As some of the banks have already met the new capital requirements and others are in the process of doing so, I thought of bringing to your attention, from a taxation perspective, some of the key legislative and administrative changes in Ghana affecting banks.
Common Reporting Standards
The Standard for Automatic Exchange of Financial Account Information Act, 2018 (Act 967) was passed into law on 4 May 2018. This Act requires each reporting financial institution to submit to the competent authority i.e. the Commissioner-General (“C-G”) of the
George Kwatia
George Kwatia is the tax leader in PwC Ghana
A message from our Tax Leader
2018 Ghana Banking Survey 9PwC
A message from our Tax Leader
Reportable financial accounts and reportable information
Unless specifically excluded from the list of reportable accounts by the C-G’s public notice, reportable financial accounts would be financial accounts (which includes a Depository Account and a Custodial Account) held by individuals or entities connected to any of the reporting jurisdictions.
Information to be exchanged include the following:
• Information leading to the identification of the taxpayer as well as those entities controlling persons who are reportable and account number.
• Transaction history of custodial account and depository accounts.
Due diligence procedures required from reportable banks
In line with this obligation, each reporting institution is expected to establish, maintain and document due diligence procedures designed to identify reportable accounts maintained for each period and keep relevant documentation for six (6) years.
Some due diligence procedures are required to be completed by 31 December 2018. Correspondent banks are likely to request such information as part of their anti-money laundering procedures.
Withholding of VAT
Towards the end of 2017, the Government of Ghana enacted the Value Added Tax (Amendment) (No. 2) Act, 2017 (Act
954) which requires certain taxpayers, appointed by the C-G, to be VAT withholding agents. This withholding of VAT is restricted to supplies on which an effective standard VAT rate of 17.5% applies. This standard rate will soon be amended to 12.5%.
Duties of VAT withholding agent
A VAT withholding agent is required to withhold from the payment to a VAT-registered trader, 7% of the taxable output value at the time of payment. This VAT should be remitted to the GRA within 15 days of the month following the month of withholding the VAT.
The appointed agent is required pay the remaining 10.5% prior to the amended standard rate and thereafter 5.5% of the taxable output value to the supplier in question.
The withholding agent will also be required to issue an internally generated VAT withholding certificate to the supplier for the VAT withheld. Subject to the VAT deductibility rules, this certificate can be used as evidence for making an input VAT credit claim.
Impact on appointed bank’s businesses
Although appointed banks could take advantage of the additional cash inflow before the payment due date, this comes with additional administrative burden of complying. Failure to comply attracts interests and penalties. One key issue appointed banks will have to deal with is ensuring there are adequate security features to protect the integrity of VAT withholding certificate issued to suppliers.
2018 Ghana Banking Survey 10PwC
A message from our Tax Leader A message from our Tax Leader
Transfer Pricing (“TP”)
Banks have numerous related party arrangements that fall within the scope of TP. These transactions include:
• Arrangement involving intellectual property. This includes trade intangibles (e.g., proprietary IT software, clearing and settlement systems) and marketing intangibles (e.g. trademarks, tradenames, etc.)
• Commercial/financial transactions such as intercompany bank placements (term, overnights, etc.), loans, advances, borrowings, Guarantees, Nostro accounts, Group insurance;
• Arrangements involving the provision of services including shared services (e.g., IT services, corporate finance function, risk management, credit team, some middle/back office services); and
• Arrangement involving tangible assets.
TP compliance requirements
To fully comply with the TP requirements in Ghana and mitigate any associated reputational risks, banks should:
• Ensure all arrangements with related parties are at arm’s length reflecting arrangements that independent parties would have agreed upon under comparable circumstances and conditions;
• Prepare a contemporaneous TP documentation to demonstrate that those arrangements have been carried out in line with the arm’s length principle; and
• Complete and file an annual TP return with the GRA within four (4) months following the end of the financial year to which the return relates.
2018 Ghana Banking Survey 11PwC
A message from our Tax Leader A message from our Tax Leader
Key areas of concern
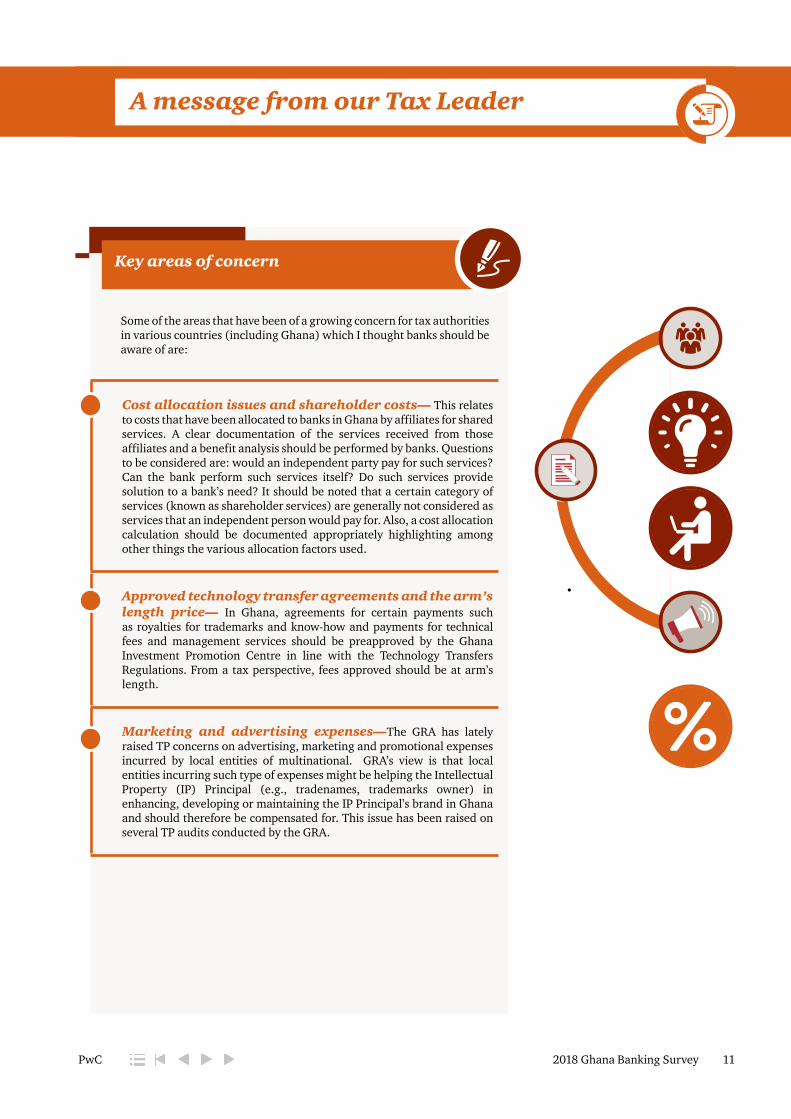
Some of the areas that have been of a growing concern for tax authorities in various countries (including Ghana) which I thought banks should be aware of are:
Cost allocation issues and shareholder costs— This relates to costs that have been allocated to banks in Ghana by affiliates for shared services. A clear documentation of the services received from those affiliates and a benefit analysis should be performed by banks. Questions to be considered are: would an independent party pay for such services? Can the bank perform such services itself? Do such services provide solution to a bank’s need? It should be noted that a certain category of services (known as shareholder services) are generally not considered as services that an independent person would pay for. Also, a cost allocation calculation should be documented appropriately highlighting among other things the various allocation factors used.
Approved technology transfer agreements and the arm’s length price— In Ghana, agreements for certain payments such as royalties for trademarks and know-how and payments for technical fees and management services should be preapproved by the Ghana Investment Promotion Centre in line with the Technology Transfers Regulations. From a tax perspective, fees approved should be at arm’s length.
Marketing and advertising expenses—The GRA has lately raised TP concerns on advertising, marketing and promotional expenses incurred by local entities of multinational. GRA’s view is that local entities incurring such type of expenses might be helping the Intellectual Property (IP) Principal (e.g., tradenames, trademarks owner) in enhancing, developing or maintaining the IP Principal’s brand in Ghana and should therefore be compensated for. This issue has been raised on several TP audits conducted by the GRA.
•
2018 Ghana Banking Survey 12PwC
Recapitalising Banks: The Nigerian Experience1
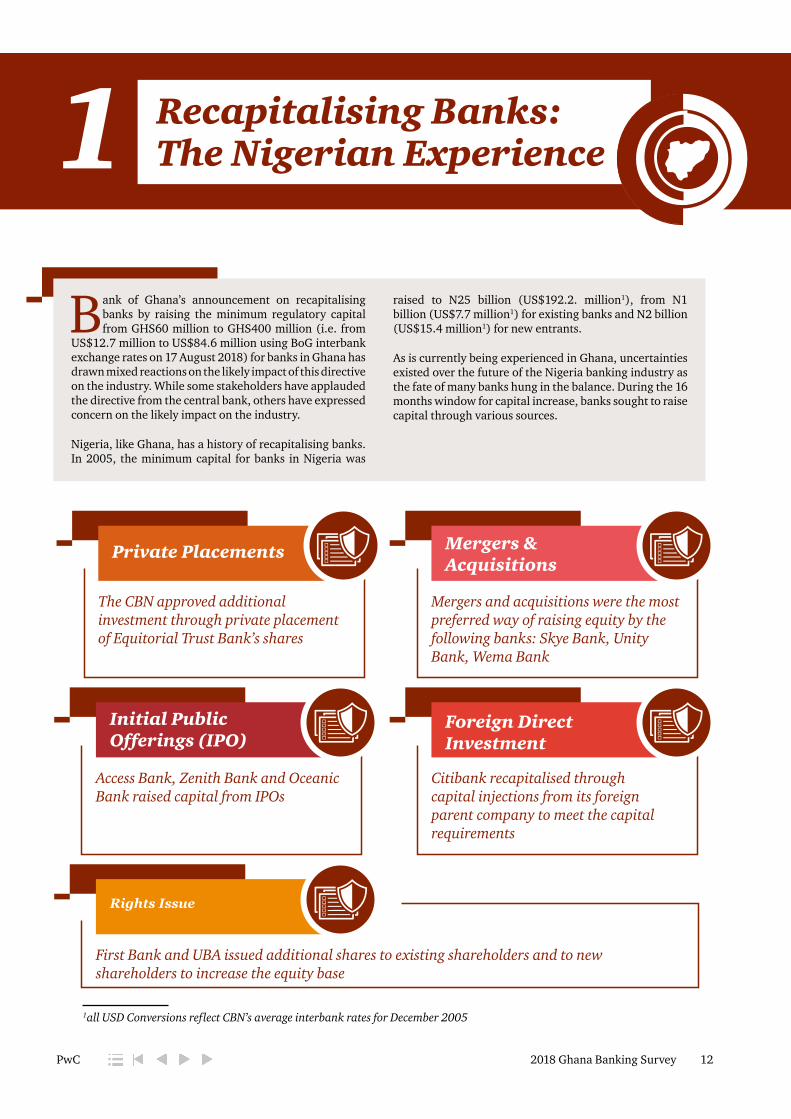
Mergers & Acquisitions
Mergers and acquisitions were the most preferred way of raising equity by the following banks: Skye Bank, Unity Bank, Wema Bank
Initial Public Offerings (IPO)
Access Bank, Zenith Bank and Oceanic Bank raised capital from IPOs
Private Placements
The CBN approved additional investment through private placement of Equitorial Trust Bank’s shares
Foreign Direct Investment
Citibank recapitalised through capital injections from its foreign parent company to meet the capital requirements
Rights Issue
First Bank and UBA issued additional shares to existing shareholders and to new shareholders to increase the equity base
Bank of Ghana’s announcement on recapitalising banks by raising the minimum regulatory capital from GHS60 million to GHS400 million (i.e. from
US$12.7 million to US$84.6 million using BoG interbank exchange rates on 17 August 2018) for banks in Ghana has drawn mixed reactions on the likely impact of this directive on the industry. While some stakeholders have applauded the directive from the central bank, others have expressed concern on the likely impact on the industry.
Nigeria, like Ghana, has a history of recapitalising banks. In 2005, the minimum capital for banks in Nigeria was
raised to N25 billion (US$192.2. million1), from N1 billion (US$7.7 million1) for existing banks and N2 billion (US$15.4 million1) for new entrants.
As is currently being experienced in Ghana, uncertainties existed over the future of the Nigeria banking industry as the fate of many banks hung in the balance. During the 16 months window for capital increase, banks sought to raise capital through various sources.
1all USD Conversions reflect CBN’s average interbank rates for December 2005

2018 Ghana Banking Survey 13PwC
Recapitalising Banks: The Nigerian Experience1
Many of the challenges faced by banks in Nigeria during the capital raise in 2005 are similar to the issues of interest to banks in Ghana.
For instance, there were scarcity of potential investors to provide the required capital due to high non-performing loan in 2004 (an industry average of c.28% which is higher than the average of 22.7% for the Ghanaian banking industry as at 31 December 2018) and consistent decline in shareholders’ funds fueled by depreciation of the local currency. Investors demanded higher returns due to the higher risk, making the cost of raising capital expensive to banks. Of the 89 banks that were in existence at the time, 25 eventually emerged under the new minimum capital regime.
The industry, which prior to 2005 was fragmented into small, weakly capitalised banks, emerged into stronger banks with the capacity to compete with other banks in the sub region. The effect of the capital raise subsequently trickled into Ghana with the entry of many Nigerian banks including, Zenith Bank, GT Bank, UBA, Access Bank etc.
Total assets of the banking industry grew by 20.3% from N3,753.3 billion at December 2004 to N4,515.1 billion at December 2005 right after the consolidations, enabling banks to finance bigger projects and investments. The industry received foreign investment amounting to US$1.5 billion, contributing to the 20% growth in total assets.
The consolidations and capital injection that happened were not without challenges, however. The efficiency ratio of the industry dropped from 77% (in 2004) to 40% (2005) mainly due to post-consolidation issues associated with business combinations.
Return on capital employed declined from 27% (in 2004) to 13% (in 2005) because of post-merger marketing costs and related mergers and acquisition cost.
2018 Ghana Banking Survey 14PwC
Recapitalising Banks: The Nigerian Experience1 Recapitalising Banks: The Nigerian Experience1
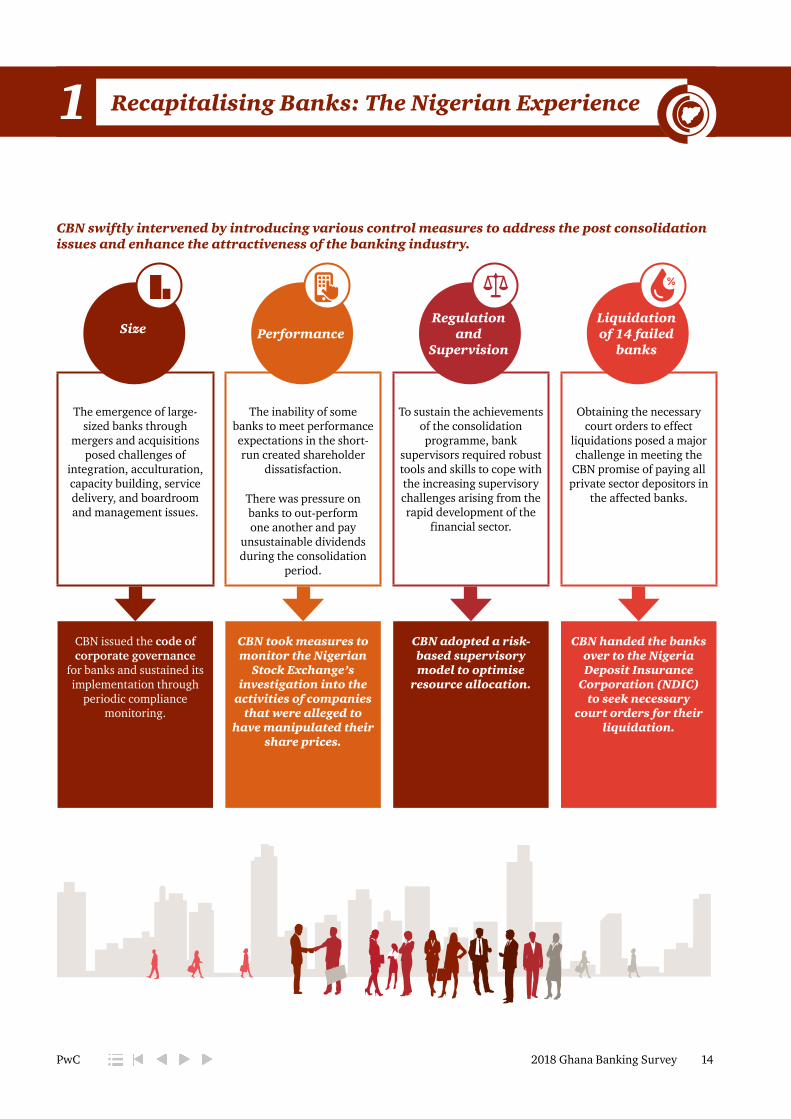
The emergence of large-sized banks through
mergers and acquisitions posed challenges of
integration, acculturation, capacity building, service delivery, and boardroom and management issues.
The inability of some banks to meet performance expectations in the short-run created shareholder
dissatisfaction.
There was pressure on banks to out-perform one another and pay
unsustainable dividends during the consolidation
period.
To sustain the achievements of the consolidation programme, bank
supervisors required robust tools and skills to cope with the increasing supervisory challenges arising from the rapid development of the
financial sector.
Obtaining the necessary court orders to effect
liquidations posed a major challenge in meeting the
CBN promise of paying all private sector depositors in
the affected banks.
CBN issued the code of corporate governance
for banks and sustained its implementation through
periodic compliance monitoring.
CBN took measures to monitor the Nigerian
Stock Exchange’s investigation into the
activities of companies that were alleged to
have manipulated their share prices.
CBN adopted a risk-based supervisory model to optimise
resource allocation.
CBN handed the banks over to the Nigeria Deposit Insurance
Corporation (NDIC) to seek necessary
court orders for their liquidation.
CBN swiftly intervened by introducing various control measures to address the post consolidation issues and enhance the attractiveness of the banking industry.
Size PerformanceRegulation
and Supervision
Liquidation of 14 failed
banks

2018 Ghana Banking Survey 15PwC
Recapitalising Banks: The Nigerian Experience1 Recapitalising Banks: The Nigerian Experience1
Significant improvement in transparency and public disclosure of transactions
Greater confidence in the banking supervision system with the removal of distressed banks and the adoption of a strict code of corporate governance
Improved access of Nigerian banks to external credit
Listing of majority of the consolidated banks on the stock exchange
Better cooperation between the regulatory authority and the banks through regular meetings and collaboration on policy issuesw
The CBN intervention paid off, with return on capital employed and efficiency picking up. Liquidity improved above the minimum limit of 30% set
by CBN. Branch network of banks grew from 3,200 in 2005 to 4,100 in 2007, thus enhancing easy access of financial services to users. As at the end of 2016, the total branch network of banks in Nigeria stood at 5446, indicating 71% growth relative to the pre-capitalisation branch network of 3,200. The branch network in 2016 however represent 6% contraction relative to the total branch network of 5,810 in 2011, reflecting the impact of digitization in the banking industry. Total employment in the banking sector was estimated to have grown from about 55,000 prior to the reform to over 61,000 after the reform.
Deposits and loans and advances doubled whiles the industry’s non-performing loan (NPL) ratio initially reduced from 22% to 6% in 2008, and thereafter, sharply rose to 28% in 2009 before sliding down year-on-year to reach 5% in 2015. The NPL ratio, as at the end of 2016, had risen to 14%, generally attributed to a tougher operating environment and rising operating costs.
Additionally, the Nigeria banking industry recognised the following benefits following the consolidation::
Even before the deadline for meeting the minimum regulatory capital in Ghana, BoG appears to have taken a proactive approach to dealing with some
of the issues that trailed the recapitalisation program in Nigeria:
In January 2018, the regulator implemented a Capital Requirement Directive which seeks to align risk appetite of banks to capital holding;
BoG also issued the Corporate Governance Guidelines in March 2018 with the intention to issue guidelines on Cyber Security later in the year;
Also issued in July 2018 by BoG is the “Fit and Proper” Directive, which seeks to guide financial institutions as well as the Bank of Ghana in determining whether a person is fit to be a director, a significant shareholder or to hold a key management position within the organization;
Additionally, BoG in July 2018 issued the Mergers and Acquisition Directive, primarily to ensure that the interests of all stakeholders and the stability of the financial system will not be compromised during mergers and acquisitions and related activities.
the total branch network
of banks in Nigeria stood at
5446
in 2016, indicating 71% growth relative to the pre-
capitalisation branch network of
3,200
As at the end of 2017,

PwC surveyed bank executives – Chief Executive Officers, Chief Risk Officers, Chief Finance Officers, Chief Operation Officers and Heads of Strategy - in Ghana through interviews and questionnaires carefully designed to elicit views on how the new minimum capital requirement is likely to impact bank’s investment decisions going forward.
In this regard, our questionnaire was structured into 2 main parts as follows: :
A total of seventeen (17) banks participated in our survey.
Majority of the questions required respondents to rank a number of options on a numerical scale, the length of which varied in line with the
number of options provided for each question (i.e. scale of 1-4 for 4 options, 1-5 for 5 options, 1-6 for 6 options etc). However, in all cases, respondents were asked to consider the number “1” on the scale as the highest in terms of priority or impact, with the last number on the scale representing the least in terms of priority or impact.
The findings from our survey is analysed and presented in the following sections.
Survey Questionnaire
Meeting the new capital requirement
ADeploying the
new capital
B
2. Income generatingactivities
1.Operational
efficiency
2018 Ghana Banking Survey 16PwC
Survey findings2Survey methodology
General expectation of banks
Q1. Which of the following represents the preferred option for your bank in raising the new capital?
Preferred options for banks in raising additional capital
24%
17%
22%
21%
16%
Appropriation from income surplus
Capital injection from parent company
Rights issue
Sale of shares to new investors
Merger with/Acquisition of another entity
We noted that majority of respondents would prefer to rely on their income surplus. A few respondents also indicated that this option, although preferred, was out of their reach considering the current size of their reserves.
Although banks’ preference generally lean more towards reliance on reserves, for fresh capital injection, banks will be required by law to explore a rights issue option first. Most banks are therefore forced to consider rights issue as one of the most realistic options to be explored.
Most banks surveyed also appear to lean more towards the sale of shares to new investors. This, we note, is influenced by banks’
2018 Ghana Banking Survey 17PwC
Survey findings2believe that the likelier source of fresh capital will be from new investors rather than existing shareholders. Some banks are however concerned about the possible dilution of ownership interest that comes with sale of shares to new investors.
Most banks are not very optimistic about mergers and acquisitions as an option for meeting the new capital requirement. Indications are that, banks prefer to avoid the usual post-consolidation issues and associated costs that comes with this option.
Most local banks view capital injection from parent company as least realistic option for them. This option applied to only a few foreign owned banks that could rely on their parent entities. We however noted that the few that expect fresh capital injection from parent banks generally consider that as a back-up plan should they be unable to raise the new capital on their own.
Overall, whilst majority of respondents see fresh capital from new investors as a more realistic option compared to rights issue, others appear worried about the possible shareholding dilution consequences, as well as the length of time required to achieve success with this option.
Aside the usual post-consolidation matters and costs associated with mergers and acquisitions, the lack of clear synergies does not make business combinations an attractive option for banks in Ghana. There is therefore a strong tendency for banks to rely on accumulated distributable reserves to meet the minimum capital requirements. The extent of reliance by a bank on its distributable reserves will however depend on the size of the bank’s reserves. We expect the accumulated distributable reserves to mainly serve as a complimentary source for most banks in Ghana in meeting the new capital requirement.
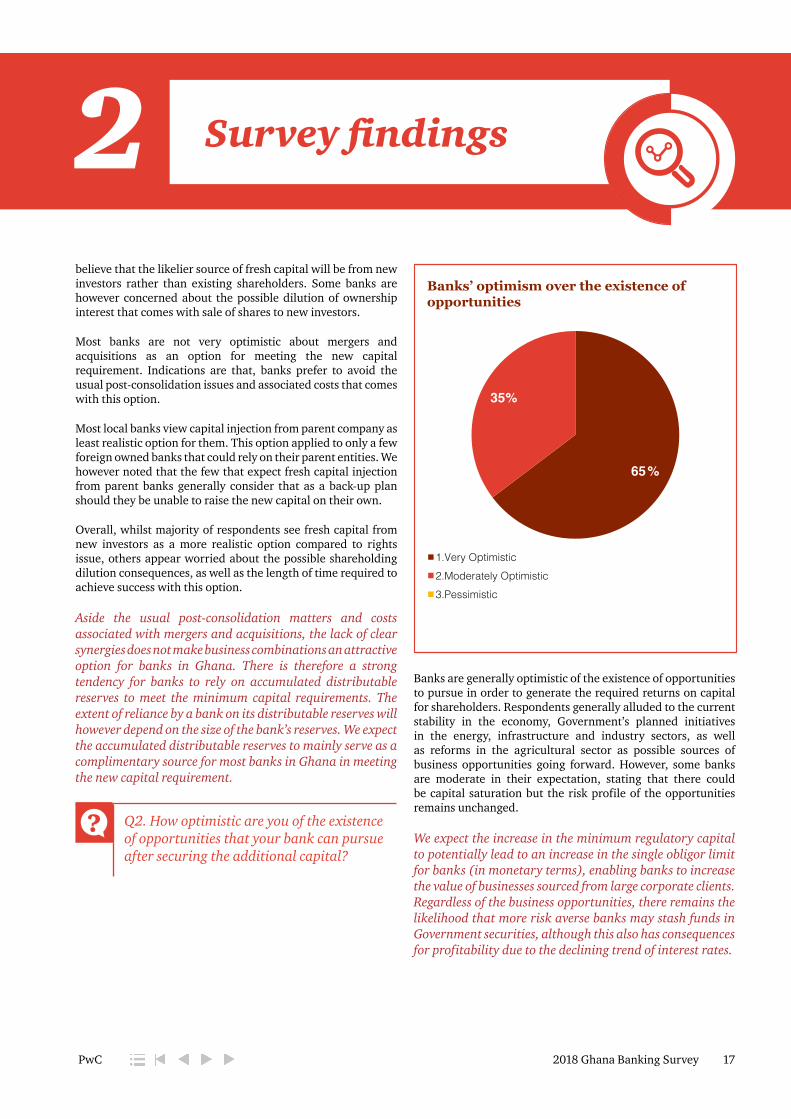
Q2. How optimistic are you of the existence of opportunities that your bank can pursue after securing the additional capital?
Banks’ optimism over the existence of opportunities
65%
35%
1.Very Optimistic2.Moderately Optimistic 3.Pessimistic
Banks are generally optimistic of the existence of opportunities to pursue in order to generate the required returns on capital for shareholders. Respondents generally alluded to the current stability in the economy, Government’s planned initiatives in the energy, infrastructure and industry sectors, as well as reforms in the agricultural sector as possible sources of business opportunities going forward. However, some banks are moderate in their expectation, stating that there could be capital saturation but the risk profile of the opportunities remains unchanged.
We expect the increase in the minimum regulatory capital to potentially lead to an increase in the single obligor limit for banks (in monetary terms), enabling banks to increase the value of businesses sourced from large corporate clients. Regardless of the business opportunities, there remains the likelihood that more risk averse banks may stash funds in Government securities, although this also has consequences for profitability due to the declining trend of interest rates.

2018 Ghana Banking Survey 18PwC
Survey findings2 Survey findings2
Q3. Which of the following are most likely to result from the sudden growth in the industry’s capital post implementation of the new minimum capital?
Banks’ view of most likely consequences of a possible sudden growth in industry’s capital going forward
31%
14% 29%
27%
Increase in credit supply to private sector
Increase in quality of assets (i.e. decrease in NPLs)
Increase in banks’ profitability
Increase in banks’ appetite for higher risk transactions
Credit supply is still seen by most executives as continuing to be the core service provision of banks regardless of the current challenges with high non-performing loans. Most banks also anticipate stronger appetite to undertake higher risk transactions in a bid to increase profitability and generate returns on capital.
Most bank executives do not believe a sudden growth in capital will have any bearing favourable on the quality of assets. At best, they expect growth in the loan book, but will not necessarily improve the quality of existing assets.
In terms of profitability, we observed that respondents generally expect a bank’s profitability to be impacted more by its competitive advantage in the market and how it organises itself internally to deliver service to customers rather than a sudden growth in capital.
Although the growth in capital presents opportunity for banks to possibly increase the volume and value of their transactions through a rise in their single obligor limit (i.e. the amount that can be lent to a single entity), banks must be guided by the need to protect capital adequacy and preserve liquidity as they drive up profitability.
Q4. As noted from your interactions with shareholders, which of the following will best meet your shareholders’ expectation after securing the additional capital?
Shareholder expectation
26%
25% 26%
23%
Increase in share value
Increase in dividends
Improvement in the bank’s risk management
Improvement in Corporate Governance
Whilst shareholders are traditionally interested in dividends and increase in share value, recent bank failures have alerted shareholders to the importance of good corporate governance and risk management practices. In this regard, banks view improvement in risk management as being of equal importance to increase in share value and increase in dividends.
We noted from discussions that banks that expect to raise the additional capital through reserves do not expect their shareholders to be aggressive with demands for dividend should they approve for the bank to rely on its reserves.

2018 Ghana Banking Survey 19PwC
Survey findings2 Survey findings2
Respondents are generally of the view that dividend demands will be higher from fresh capital providers as there is a general lack of supply in the capital market.
We also observed that banks are very much aware of BoG’s new corporate governance directive issued in March 2018 and are gearing up for its implementation, amidst creating awareness of same amongst shareholders.
Whilst banks may be pressurised to increase profitability due to the additional capital injection, we expect the increased awareness of the importance of risk management and corporate governance to significantly attract the attention of shareholders in their demands on banks going forward
Improving operational efficiency
Q1. Which of the five areas listed (in the chart) below will most likely be considered by your bank for further investment after securing the new capital?
Areas to be considered for further investment to improve operational efficiency
23%
27% 19%
18%
12%
Market PresenceInformation Technology Risk ManagementHuman Capital DevelopmentCorporate Governance Structures
Although market presence was very important to banks, most banks view information technology as the key driver of their market presence agenda going forward. In this regard most banks view market presence and information technology as the two topmost priorities going forward.
Banks also view risk management as important, particularly for preserving a bank’s capital adequacy and ensuring that liquidity is not overly compromised. Additionally, banks are gearing up for implementation of the Capital Requirement Directive (CRD) issued by BoG in January 2018. Being integral for Basel II & III compliance, respondents were of the view that the implementation of the CRD may require some investments in banks’ risk management functions.
Human capital is also seen as remaining integral going forward, although it ranked down the pecking order. Indications are that, banks will be most interested in retaining their best talents, however, talent loss and acquisition are quite fluid in the industry and are more within the control of employees rather than the bank.
As banks gear up to improve or expand their information technology systems, there is the need for banks to reinforce their systems to minimise cyber security risks. The urge to improve access to customers through information technology must be guided by adequate risk management structures to avoid unnecessary exposure to avoidable business risks.
2018 Ghana Banking Survey 20PwC
Survey findings2 Survey findings2
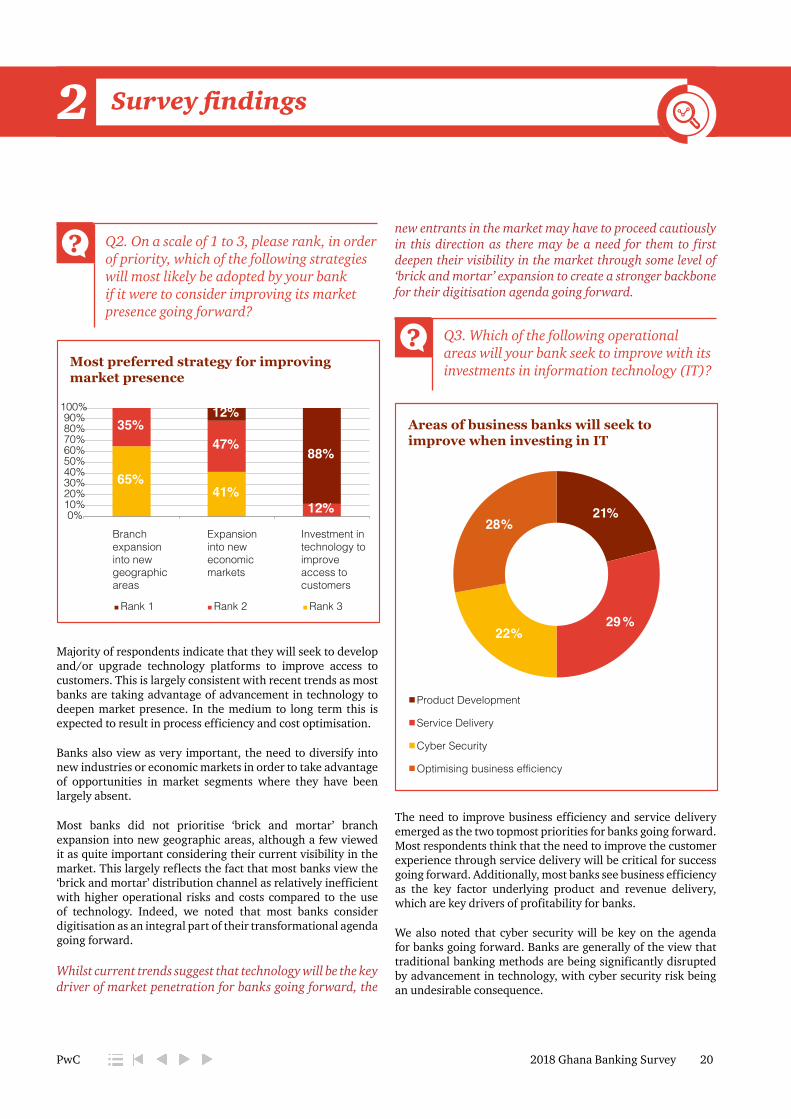
Q2. On a scale of 1 to 3, please rank, in order of priority, which of the following strategies will most likely be adopted by your bank if it were to consider improving its market presence going forward?
Most preferred strategy for improving market presence
65% 41%
35% 47%
12%
12%
88%
0%
10% 20% 30% 40% 50% 60% 70% 80% 90%
100%
Rank 1 Rank 2 Rank 3
Investment in technology to improve access to customers
Expansion into new economic markets
Branch expansion into new geographic areas
Majority of respondents indicate that they will seek to develop and/or upgrade technology platforms to improve access to customers. This is largely consistent with recent trends as most banks are taking advantage of advancement in technology to deepen market presence. In the medium to long term this is expected to result in process efficiency and cost optimisation.
Banks also view as very important, the need to diversify into new industries or economic markets in order to take advantage of opportunities in market segments where they have been largely absent.
Most banks did not prioritise ‘brick and mortar’ branch expansion into new geographic areas, although a few viewed it as quite important considering their current visibility in the market. This largely reflects the fact that most banks view the ‘brick and mortar’ distribution channel as relatively inefficient with higher operational risks and costs compared to the use of technology. Indeed, we noted that most banks consider digitisation as an integral part of their transformational agenda going forward.
Whilst current trends suggest that technology will be the key driver of market penetration for banks going forward, the
new entrants in the market may have to proceed cautiously in this direction as there may be a need for them to first deepen their visibility in the market through some level of ‘brick and mortar’ expansion to create a stronger backbone for their digitisation agenda going forward.
Q3. Which of the following operational areas will your bank seek to improve with its investments in information technology (IT)?
Areas of business banks will seek to improve when investing in IT
21%
29 % 22%
28%
Product Development
Service Delivery
Cyber Security
Optimising business efficiency
The need to improve business efficiency and service delivery emerged as the two topmost priorities for banks going forward. Most respondents think that the need to improve the customer experience through service delivery will be critical for success going forward. Additionally, most banks see business efficiency as the key factor underlying product and revenue delivery, which are key drivers of profitability for banks.
We also noted that cyber security will be key on the agenda for banks going forward. Banks are generally of the view that traditional banking methods are being significantly disrupted by advancement in technology, with cyber security risk being an undesirable consequence.
2018 Ghana Banking Survey 21PwC
Survey findings2 Survey findings2
Most banks appear not too keen on product development as they indicated that their focus will be to improve performance of existing products through the related service delivery rather than developing new products. This suggest that the sophisticated money market instruments, which are largely unavailable in this market, are unlikely to be a common feature of the product profiles in the near future.
The banking industry in Ghana is already saturated with products with similar features. Going forward, the key differentiator for banks will be the experiential value customers place on service delivery. In this regard, the ability of banks to continuously improve customer experience will be a critical success factor.
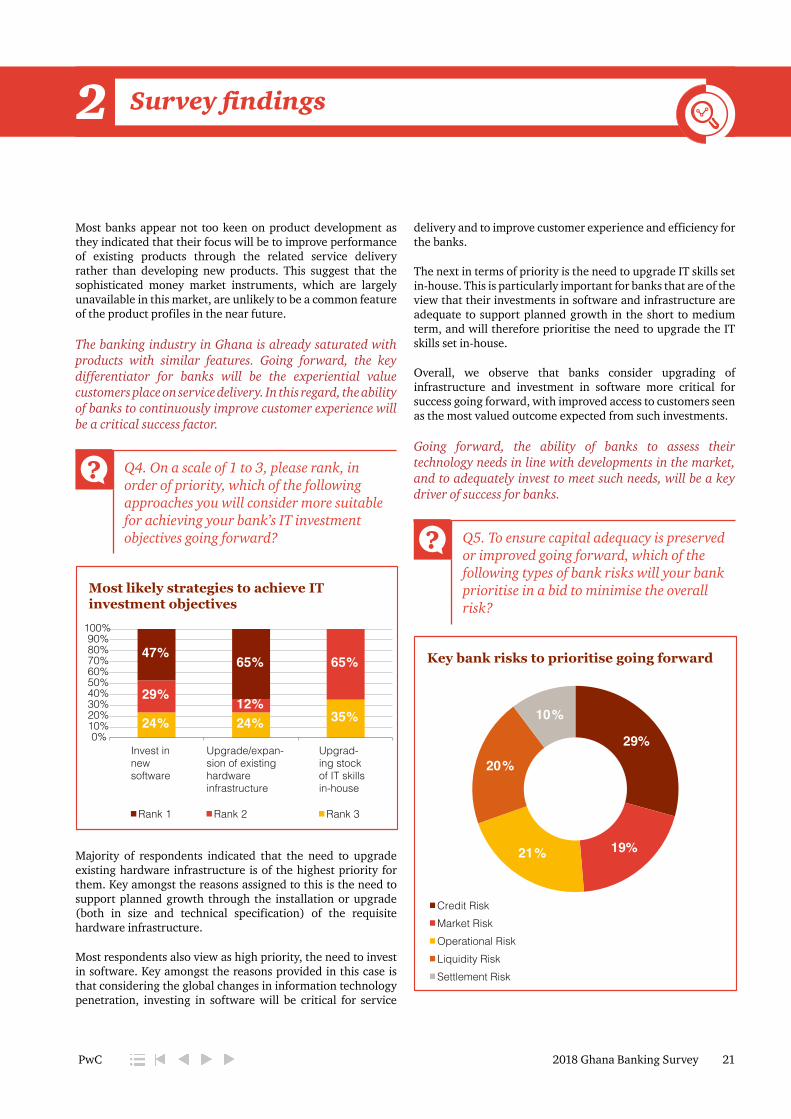
Q4. On a scale of 1 to 3, please rank, in order of priority, which of the following approaches you will consider more suitable for achieving your bank’s IT investment objectives going forward?
Most likely strategies to achieve IT investment objectives
24% 24% 35% 29%
12%
65% 47%
65%
0% 10% 20% 30% 40% 50% 60% 70% 80% 90%
100%
Rank 1 Rank 2 Rank 3
Invest in new software
Upgrade/expan-sion of existing hardware infrastructure
Upgrad-ing stock of IT skills in-house
Majority of respondents indicated that the need to upgrade existing hardware infrastructure is of the highest priority for them. Key amongst the reasons assigned to this is the need to support planned growth through the installation or upgrade (both in size and technical specification) of the requisite hardware infrastructure.
Most respondents also view as high priority, the need to invest in software. Key amongst the reasons provided in this case is that considering the global changes in information technology penetration, investing in software will be critical for service
delivery and to improve customer experience and efficiency for the banks.
The next in terms of priority is the need to upgrade IT skills set in-house. This is particularly important for banks that are of the view that their investments in software and infrastructure are adequate to support planned growth in the short to medium term, and will therefore prioritise the need to upgrade the IT skills set in-house.
Overall, we observe that banks consider upgrading of infrastructure and investment in software more critical for success going forward, with improved access to customers seen as the most valued outcome expected from such investments.
Going forward, the ability of banks to assess their technology needs in line with developments in the market, and to adequately invest to meet such needs, will be a key driver of success for banks.
Q5. To ensure capital adequacy is preserved or improved going forward, which of the following types of bank risks will your bank prioritise in a bid to minimise the overall risk?
Key bank risks to prioritise going forward
29%
19% 21%
20%
10%
Credit RiskMarket RiskOperational RiskLiquidity RiskSettlement Risk
2018 Ghana Banking Survey 22PwC
Survey findings2 Survey findings2
Credit risk emerged as the most important exposure banks need to mitigate in a bid to preserve capital adequacy going forward. We observed that the above results, particularly relating to credit and liquidity risks, largely reflects lessons learnt from recent capital erosion from non-performing loans, which has also impacted the liquidity of some banks and contributed to some bank failures in the industry.
Banks are also of the view that operational risk is more difficult to manage as a bank’s operations are typically decentralised through branches and outlets that require very strict and regular monitoring to ensure operational risk is minimised.
Although banks consider market risk as being of high priority, most respondents are of the view that banks can only put systems in place to allow them react in good time and in adequate measure to market changes, as individual banks, on their own, do not have significant control of the key market factors comprising interest and foreign exchange rates.
Overall, banks alertness to credit risk has increased in the wake of the deterioration in asset quality across the industry as evidenced by the high non-performing loans (NPLs). In addition to credit risk, banks will be concerned about liquidity going forward as this is the lifeline for banks.
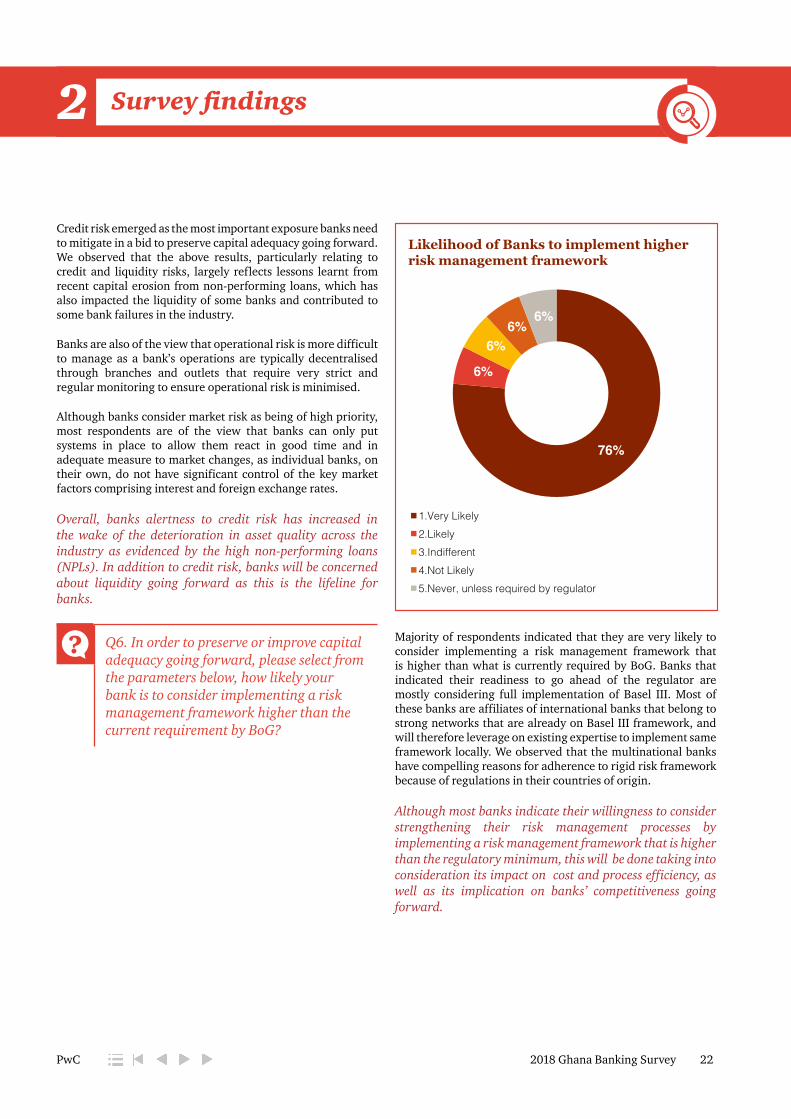
Q6. In order to preserve or improve capital adequacy going forward, please select from the parameters below, how likely your bank is to consider implementing a risk management framework higher than the current requirement by BoG?
Likelihood of Banks to implement higher risk management framework
76%
6%
6% 6%
6%
1.Very Likely2.Likely3.Indifferent4.Not Likely5.Never, unless required by regulator
Majority of respondents indicated that they are very likely to consider implementing a risk management framework that is higher than what is currently required by BoG. Banks that indicated their readiness to go ahead of the regulator are mostly considering full implementation of Basel III. Most of these banks are affiliates of international banks that belong to strong networks that are already on Basel III framework, and will therefore leverage on existing expertise to implement same framework locally. We observed that the multinational banks have compelling reasons for adherence to rigid risk framework because of regulations in their countries of origin.
Although most banks indicate their willingness to consider strengthening their risk management processes by implementing a risk management framework that is higher than the regulatory minimum, this will be done taking into consideration its impact on cost and process efficiency, as well as its implication on banks’ competitiveness going forward.
2018 Ghana Banking Survey 23PwC
Survey findings2 Survey findings2
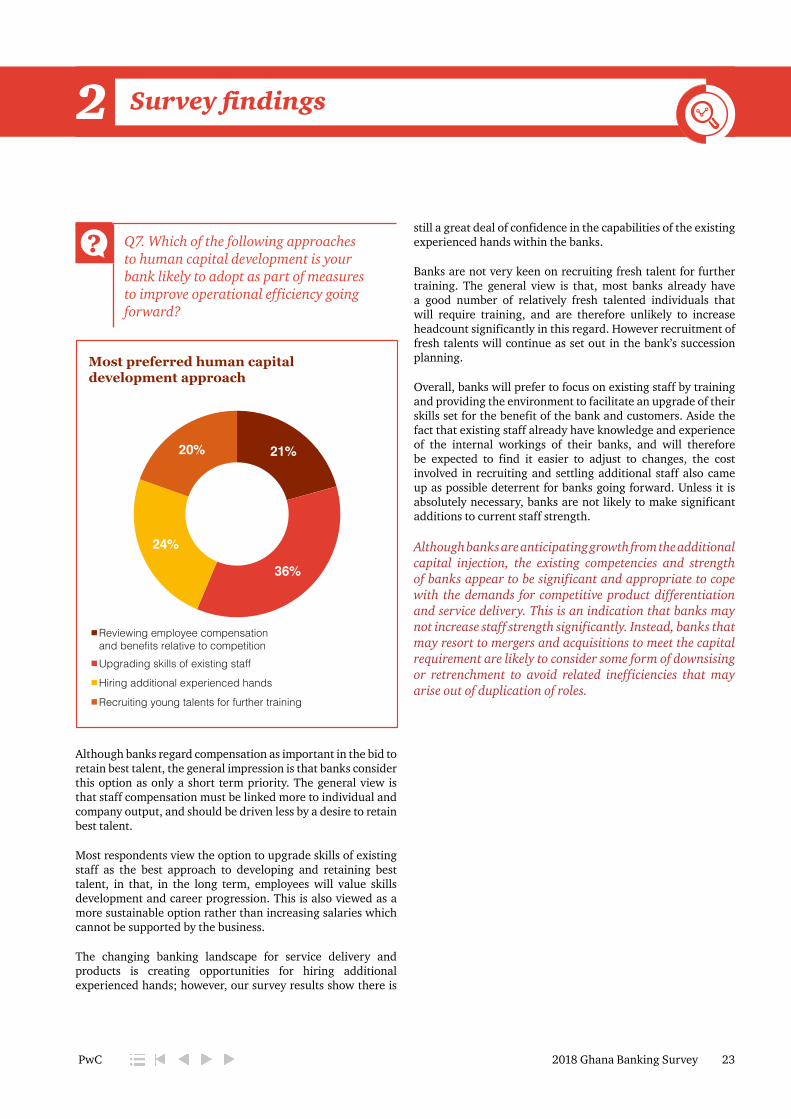
Q7. Which of the following approaches to human capital development is your bank likely to adopt as part of measures to improve operational efficiency going forward?
Most preferred human capital development approach
21%
36%
24%
20%
Reviewing employee compensation and benefits relative to competition Upgrading skills of existing staff
Hiring additional experienced hands
Recruiting young talents for further training
Although banks regard compensation as important in the bid to retain best talent, the general impression is that banks consider this option as only a short term priority. The general view is that staff compensation must be linked more to individual and company output, and should be driven less by a desire to retain best talent.
Most respondents view the option to upgrade skills of existing staff as the best approach to developing and retaining best talent, in that, in the long term, employees will value skills development and career progression. This is also viewed as a more sustainable option rather than increasing salaries which cannot be supported by the business.
The changing banking landscape for service delivery and products is creating opportunities for hiring additional experienced hands; however, our survey results show there is
still a great deal of confidence in the capabilities of the existing experienced hands within the banks.
Banks are not very keen on recruiting fresh talent for further training. The general view is that, most banks already have a good number of relatively fresh talented individuals that will require training, and are therefore unlikely to increase headcount significantly in this regard. However recruitment of fresh talents will continue as set out in the bank’s succession planning.
Overall, banks will prefer to focus on existing staff by training and providing the environment to facilitate an upgrade of their skills set for the benefit of the bank and customers. Aside the fact that existing staff already have knowledge and experience of the internal workings of their banks, and will therefore be expected to find it easier to adjust to changes, the cost involved in recruiting and settling additional staff also came up as possible deterrent for banks going forward. Unless it is absolutely necessary, banks are not likely to make significant additions to current staff strength.
Although banks are anticipating growth from the additional capital injection, the existing competencies and strength of banks appear to be significant and appropriate to cope with the demands for competitive product differentiation and service delivery. This is an indication that banks may not increase staff strength significantly. Instead, banks that may resort to mergers and acquisitions to meet the capital requirement are likely to consider some form of downsising or retrenchment to avoid related inefficiencies that may arise out of duplication of roles.

2018 Ghana Banking Survey 24PwC
Survey findings2 Survey findings2
Q8. Which of the following functions or skill sets are likely to be considered more important by your bank in developing its human capital going forward?
Skills sets to be prioritised by banks in their human capital development activities
12% 12% 11% 10% 10% 9% 9%
8% 8%
6% 5%
0%
2%
4%
6%
8%
10%
12%
14%
Risk Management
Credit (Retail &
Corporate)
Information Technology
Treasury Sales and Marketing
Retail Operations
Strategy Human Resource
Compliance Finance and Accounting
Internal Audit
The chart above indicates the scores from respondents’ ranking of the skills set to be prioritised in developing banks’ human capital going forward.
Whilst developing risk management skills is seen by respondents as critical for preserving and improving banks’ capital adequacy, credit administration skills is seen by many as critical for improving asset quality of banks going forward. Banks also see information technology as integral to their operations, particularly to enhance service delivery and product development in a market that is fast becoming technology-driven.
In addition, banks view skill sets relating to treasury management as very important for ensuring that banks’ liquidity are not overly compromised in a bid to increase profitability. The sales and marketing function is also seen as key for driving business growth and profitability.
We expect that in light of the recent challenges faced by the industry, banks will generally seek to find a good balance between risk management, business growth and profitability. This is likely to be a key consideration for banks’ human capital development activities going forward.

2018 Ghana Banking Survey 25PwC
Survey findings2 Survey findings2
Q9. Which of the following Corporate Governance elements will your bank most likely prefer to improve going forward?
Corporate Governance elements banks will seek to improve
24%
16%
26%
23%
11%
Board Qualification and Composition
Board Size and Structure
Board Performance Evaluation
Quality of Information Available to Board
Board Compensation
The results indicate that Board Performance Evaluation will become a priority for most banks going forward. The general view is that banks, in the past, did not pay sufficient attention to the need to critically evaluate a Board’s performance and this is beginning to have a toll on the industry, hence the need to reverse this trend.
Board Qualification and Composition was also evaluated as the next level of priority after performance evaluation with respondents generally indicating that the banking landscape in Ghana is rapidly evolving and will require highly qualified and experienced Board members to successfully direct affairs of banks.
Whilst most banks view Board Performance Evaluation and Qualification and Composition as critical going forward, many believe that no significant impact will be made without ensuring that the quality of information made available to the Board is adequate.

2018 Ghana Banking Survey 26PwC
Survey findings2 Survey findings2
On the contrary, most banks view the current structure and size of their boards, as well as compensation of board members as adequate, and are therefore unlikely to make any significant changes to these in the short term.
Corporate governance will be key to the expected transformation of banks going forward. Whilst the recent Corporate Governance Directive and Fit and Proper Directive issued by BoG in March 2018 and July 2018 respectively promises to provide good guidance on Board Qualification and Composition, banks may have to upgrade their management information systems to improve the quality of information made available to their Boards, and also to allow for effective Board Performance Evaluation.
Increasing earning potential
Q1. Which of the following offers you the most likely investment opportunity for your bank to consider going forward?
Preferred outlets for deploying banks’ funds
20%
18%
12%24%
15%
11%
Government BondsMoney MarketPlacements with other banks LendingFX Trading VolumesInvest in products relatively new to the market
The results indicate that banks still consider lending as their core business regardless of the rising stock of non-performing loans seen across the industry in recent times. The general view is that loans yield higher earnings for banks and is therefore key for profitability going forward. Some banks are also concerned about creating the right impact in their chosen markets, with loans to individuals and businesses seen as key for this agenda.
In terms of priority, bank lending was followed by investing in Government bonds and short term money market instruments, as these are mostly considered to be of significantly lower risk compared to other outlets. In particular, the money market is seen as a good outlet for bank’s seeking to improve liquidity in the short term.
FX trading and bank placements were ranked lower, although they attracted a fair amount of interest from respondents. The general view is that these outlets will continue to play complimentary roles for banks in terms of income generating activities.
Overall, banks will continue to grow their loan books, although we expect any such growth to be slower in the short term. Banks will most likely continue with the tightened credit stance adopted over the last year in a bid to clean their loan books and improve asset quality going forward.

2018 Ghana Banking Survey 27PwC
Survey findings2 Survey findings2
Q2. Please rank, on a scale of 1 to 3, which of the following key interventions, if adopted by Government, will most likely influence your bank to consider extending credit to the private sector for further investment in Government’s “Planting for Food and Jobs” and “1 District; 1 Factory” policies?
Banks’ rating of possible interventions aimed at supporting government’s flagship policies
6%35%
65%
53%35%
94%
12%
0% 10% 20% 30% 40% 50% 60% 70% 80% 90%
100%
Rank 1 Rank 2 Rank 3
Making available a guarantee fund for loan recovery
Providing Agric-related insurance for Farmers
Proving technical assistance to farmers and investors
Majority of banks surveyed will be most interested in supporting Government’s development’s initiatives targeted at the private sector and agriculture development if Government provides a guarantee for lending. The general concern is that the Agricultural sector remains largely a volatile and risky sector for banks.
Most respondents also view the provision of agri-business insurance to farmers as key to attracting interest from banks. This, according to respondents, will ensure that farmers are able to recover some of their losses in the event of unforeseen occurrences, which may help to ensure that they remain in business and preserve their loan repayment capacity as a business.
Whilst banks will welcome measures aimed at ensuring that the risk of non-recovery of funds invested in Government’s initiatives are kept at a barest minimum, banks will be more interested in supporting Government’s initiatives if policies are put in place to ensure continuity with successive Governments are safeguarded.

32018 Ghana Banking Survey 28PwC
An Overview of the Economy3
Overview of the global economy
Global economic growth in 2017 strengthened to 3.8% according to the World Economic Outlook (“WEO”) report (April 2018) of the International Monetary Fund (“IMF”). The report also forecasts global economic growth in the year 2018 to be 3.9%. This represents a 25% increase on the growth of 3.1% reported in 2016, which was the weakest since the global financial crisis in 2008.
The recovery in 2017 is attributed to investment recovery in advanced economies, continued strong growth in Asia, improvements in Europe and signs of recovery in several commodity exporting countries.
The recovery in global activity is projected to continue in 2018, with growth rate for 2018 estimated at 3.9% supported by strong momentum, favourable market sentiment, accommodative financial conditions, and the domestic and international repercussions of expansionary fiscal policy in the United States.
(Source: World Economic Outlook –April 2018)
Macroeconomic performance in Ghana
Gross Domestic Product
The April 2018 GDP bulletin estimates GDP annual growth rate for 2017 at 8.5%, up from the original forecast of 6.3%, indicating that the Ghanaian economy outperformed the Global economy.
While Ghana’s GDP growth rate is expected to decline slightly to 6.8% in 2018, this is still expected to be higher than that of the world economy. The Industry sector grew by 16.7% in 2017, making it the best performing sector in terms of growth. This is largely attributed to an increased production in upstream oil and gas. The Agriculture sector also expanded by 8.4% in 2017, exceeding its targeted growth of 3.5%, while the Services sector expanded by 4.3% in 2017, which is less than the 5.1% target for the year.
Sectoral distribution of GDP growth:
Sectors 2014 2015 2016 2017*
Services 5.6% 6.3% 5.7% 4.3%
Agriculture 4.6% 2.8% 3.6% 8.4%
Industry 0.8% (0.3)% (0.5)% 16.7%
GDP 4.0% 3.8% 3.7% 8.5%
*Provisional actual sourced from Ghana Statistical Service, April 2018
(Source: Budget Statement and Economic Policy – March 2017 and November 2017, Ghana statistical service – GDP presentation, April 2018)
¢

2018 Ghana Banking Survey 29PwC
An Overview of the Economy3 ¢
Inflation
Headline inflation eased from 15.4% in December 2016 to 11.8% in December 2017 and further downwards to 9.6% in April 2018 mainly driven by exchange rate stability, tight monetary stance and prudent fiscal consolidation policies.
The chart below depicts a declining trend in monthly headline inflation over the period January 2017 to April 2018..
13.3% 13.2% 12.8% 13.0% 12.6% 12.1% 11.9% 12.3% 12.2% 11.6% 11.7% 11.8% 10.3% 10.6% 10.4%
9.6%
0%2%4%6%8%
10%12%14%
Jan-17Jul-17
Aug-17Feb-17
Mar-17
Apr-17
Jan-18Feb-18
Mar-18
Apr-18
May-17
Jun-17Sep-17
Oct-17
Nov-17
Dec-17
Inflation Rate
Headline inflation (January 2017 - April 2018)
(Source: Budget Statement and Economic Policy – March 2017 and November 2017, Bank of Ghana –
Summary of Economic and Financial Data – May 2018)
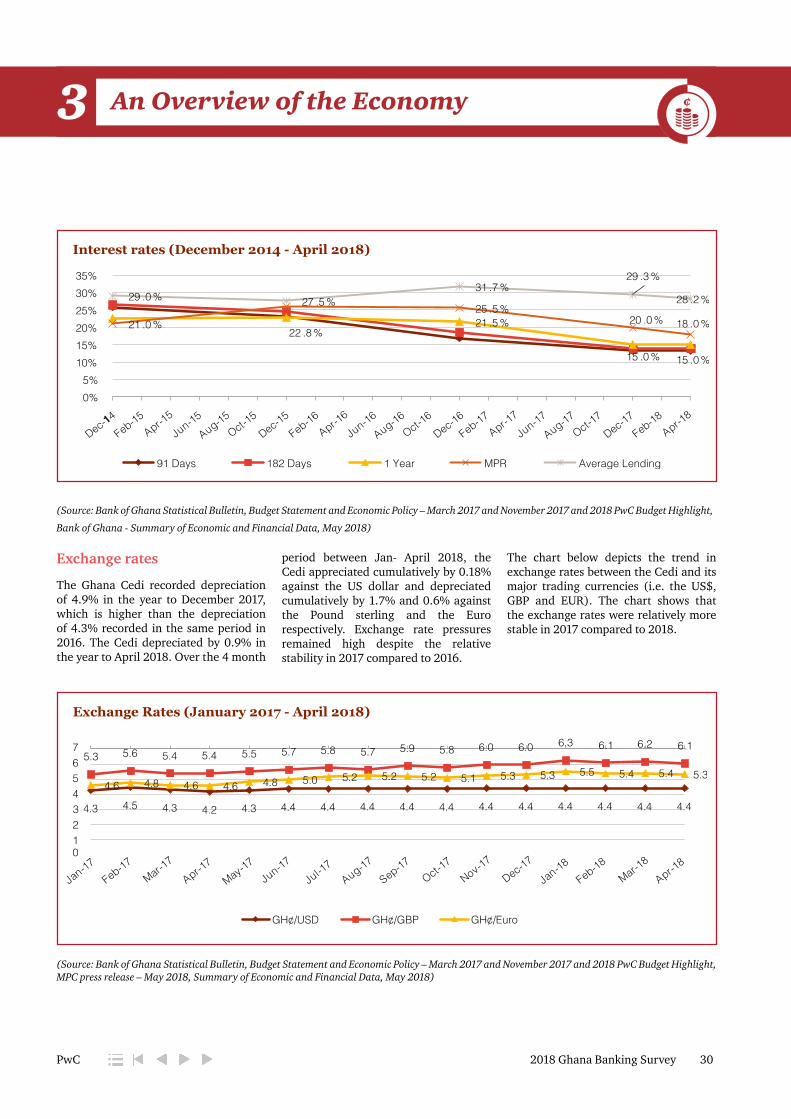
Interest rates
The year begun with a Monetary Policy Rate (MPR) of 25.5% which was reduced to 20% in November 2017 and has remained at 17% since May 2018. This was attributed to gradual improvement in the macroeconomic fundamentals, exchange rate stability, easing inflationary pressures and improved sentiments.
Interest rates on the short term instruments (91-day treasury bills, 182-day treasury bills and 1 year note) also declined in response to Government’s policy to re-profile public debt from short to medium and longer end instruments. However, average lending rates has declined at a much slower rate, indicating a general unresponsiveness of bank’s lending rates to Government’s monetary policy measures.
The chart below depicts a downward trend in interest rates, particularly from December 2016 to April 2018.
2018 Ghana Banking Survey 30PwC
Interest rates (December 2014 - April 2018)
22 .8 %21 .5 %
15 .0 % 15 .0 %
21 .0 %25 .5 %
20 .0 % 18 .0 %
29 .0 % 27 .5 %31 .7 %
29 .3 %
28 .2 %
0%5%
10%15%20%25%30%35%
91 Days 182 Days 1 Year MPR Average Lending
Dec-14Dec-15
Feb-15Apr-1
5Jun-15
Aug-15Oct-1
5Dec-16
Feb-16Apr-1
6Feb-18
Apr-18
Jun-16Aug-16
Oct-16
Dec-17Feb-17
Apr-17
Jun-17Aug-17
Oct-17
(Source: Bank of Ghana Statistical Bulletin, Budget Statement and Economic Policy – March 2017 and November 2017 and 2018 PwC Budget Highlight,
Bank of Ghana - Summary of Economic and Financial Data, May 2018)
Exchange rates
The Ghana Cedi recorded depreciation of 4.9% in the year to December 2017, which is higher than the depreciation of 4.3% recorded in the same period in 2016. The Cedi depreciated by 0.9% in the year to April 2018. Over the 4 month
period between Jan- April 2018, the Cedi appreciated cumulatively by 0.18% against the US dollar and depreciated cumulatively by 1.7% and 0.6% against the Pound sterling and the Euro respectively. Exchange rate pressures remained high despite the relative stability in 2017 compared to 2016.
The chart below depicts the trend in exchange rates between the Cedi and its major trading currencies (i.e. the US$, GBP and EUR). The chart shows that the exchange rates were relatively more stable in 2017 compared to 2018.
4.3 4.5 4.3 4.2 4.3 4.4 4.4 4.4 4.4 4.4 4.4 4.4 4.4 4.4 4.4 4.4
5.376543
10
2
5.6 5.4 5.4 5.5 5.7 5.8 5.7 5.9 5.8 6.0 6.0 6.3 6.1 6.2 6.1
4.6 4.8 4.6 4.6 4.8 5.0 5.2 5.2 5.2 5.1 5.3 5.3 5.5 5.4 5.4 5.3
GH¢/USD GH¢/GBP GH¢/Euro
Jan-17Jul-1
7Aug-17
Feb-17Mar-1
7Apr-1
7Jan-18
Feb-18Mar-1
8Apr-1
8May-17
Jun-17Sep-17
Oct-17
Nov-17Dec-17
Exchange Rates (January 2017 - April 2018)
(Source: Bank of Ghana Statistical Bulletin, Budget Statement and Economic Policy – March 2017 and November 2017 and 2018 PwC Budget Highlight, MPC press release – May 2018, Summary of Economic and Financial Data, May 2018)
An Overview of the Economy3 An Overview of the Economy3¢
2018 Ghana Banking Survey 31PwC
An Overview of the Economy3 An Overview of the Economy3 ¢
2018 Ghana Banking Survey 32PwC
Key developments in the banking industry4
with their businesses consolidated into one entity, now called Consolidated Bank Ghana Limited as noted earlier in this section.
The Governor of BoG in December 2017 announced a freeze on licensing of new banks and other financial institutions in a bid to strengthen supervision of the existing financial institutions and ensure efficiency in the banking system.
Increase in minimum capital requirements for banks
BoG, through a directive issued on 11 September 2017, increased the minimum capital requirement of existing banks and new entrants from GHS120 million to GHS400 million and required that banks comply by the end of December 2018. Per BoG’s notice on the new minimum capital requirement, the upward review of bank’s minimum capital requirement is to “further develop, strengthen and modernise the financial sector to support the Government’s economic vision and transformational agenda”. Post implementation, we will expect banks in Ghana to have adequate capital to back big ticket transactions and compete favourably with other banks in the sub region.
As at July 2018, many of the banks that require additional capital and intend to do so by raising the needed funds from new investors were evaluating non-binding offers or undergoing due diligence. A few banks however continue to have difficulty in attracting interested investors mainly due to the quality of their loan books. Such entities are likely to become targets for acquisition or suffer revocation of banking licenses.
Overview
The banking sector has experienced tighter regulatory landscape in recent past. The enactment of the Banks and Specialised Deposit-Taking Institutions Act, 2016 (Act 930) and the Deposit Protection Act in late 2016, followed by a stream of other initiatives and proactive monitoring to further strengthen and stabilise the sector. Some of these key initiatives and the cascading effect on the sector are discussed below:
New entrants in the Banking Sector
In 2017, BoG licensed 3 institutions to begin operations as universal banks in Ghana.
Construction Bank, a wholly owned Ghanaian bank received a universal banking license from BoG in the second quarter of 2017.
The Beige Bank, a wholly owned Ghanaian bank received a universal banking license from BoG in the second quarter of 2017. Before its licensing as a universal bank, The Beige Bank formerly operated as a non-bank financial institution under the name: Beige Capital Savings and Loans Company.
GHL Bank Limited, which used to operate as a mortgage finance institution under the name: Ghana Home Loans, obtained a banking license from BoG in June 2017.
The licenses of Construction Bank and Beige Bank, along with 3 other local banks- UniBank Ghana Limited, The Royal Bank Limited and Sovereign Bank Limited, were revoked on 1 August 2018,

2018 Ghana Banking Survey 33PwC
Key developments in the banking industry4
In addition, BoG requires boards of banks to provide annual certification of their compliance to this framework. The directive is expected to contribute to a more resilient banking sector and enhance the confidence in the sector.
The Ghana Reference Rate (GRR)
In a bid to close the gap between the policy rate and the increasing borrowing rate, BoG introduced the GRR in April 2018 to be used as a benchmark rate on which banks will add or subtract the risk premium based on customers’ risk profile. The GRR replaced the Base Rate Model as the new formula for interest rate calculation. The GRR for July and August 2018 stood at 16.11% and 16.10% respectively.
The determination of the GRR is based on some market observable variables including the Policy Rate, interbank rate, cash reserve requirement, cash-in-vault and some market-related factors. The formula for the calculation the GRR show greater transparency in its computation. Banks now price their credit based on the new reference rate by adding a risk premium or discount. Banks are also required to report to BoG the component of the risk premium charged to its customers in a prescribed form.
Monetary Policy rate and the borrowing rate
The Monetary Policy Committee (MPC) of BoG has consistently reviewed downward the Policy Rate since 2017 as part of measures to reduce the cost of funding and boost productivity in the private sector. On 21 May 2018, the
MPC reduced the policy rate by 100 basis point, from 18% to 17% and has since remained unchanged as at August 2018.
To further improve private sector access to funding, Government has significantly reduced domestic borrowing and this has had knock on effect on market interest rates. The interest rates on the 91-day treasury bills, the 182-day treasury bills and the 1-year note have all trended downwards over the last twelve months to April 2018. Notwithstanding the decline in the shorter term money market instruments, average lending rates have remained largely resilient, closely hovering around the 30% mark. This was largely sustained by the declining quality of banks’ loan book.
Mergers and acquisition directive
On 5 July 2018, BoG issued an exposure draft on Mergers and acquisition directive for Banks, Specialised Deposit-Taking Institutions and Financial Holding Companies. The key objectives of the directives are:
a. To help ensure that the interests of the regulated financial institutions, depositors and other stakeholders as well as the stability of the financial system will not otherwise be threatened by a change in significant shareholding or control in such institutions.;
b. To prescribe criteria, including fit and proper tests, for approving requests for proposed mergers and acquisitions of regulated financial institutions;
c. To set minimum conditions that must be fulfilled by merging or acquiring regulated financial institutions during the due diligence process;
Implementation of the Capital Requirement Directive (CRD)
As part of measures to further strengthen risk management across the industry, BoG issued the Capital Requirement Directive, the rule book for Basel II&III compliance, effective January 2018. Reporting under the CRD framework commenced in July 2018. The implementation is expected to align the level of risk banks choose to carry with the amount of capital they hold, which is particularly important to protect investors’ and customers’ funds as banks take steps to increase their capital in line with the new minimum capital requirement.
Corporate governance directive
In order to strengthen corporate governance structures across the industry, BoG published the Banks and Specialized Deposit- Taking Institutions Corporate Governance Directive in March 2018 to provide a framework to regulate corporate governance practices in banks.
The key components of the directive include but not limited to guidelines on:
• Board Qualification and Composition;
• Board Size and Structure;
• Directors’ Appointment, Tenure and Age Limit;
• Board Performance Evaluation;
• Risk Management and Internal Controls; and
• Separation of Powers.

2018 Ghana Banking Survey 34PwC
Key developments in the banking industry4 Key developments in the banking industry4
Taking Institutions Act 2016 (Act 930) relating to Financial Holding Companies;
• Prescribe the permissible and non-permissible activities for Financial Holding Companies;
• Set forth the procedures for the Registration of a financial holding company pursuant to the Banks and Specialised Deposit-Taking Institutions Act 2016 (Act 930); and
• Prescribe the minimum prudential and regulatory requirements (liquid assets and capital adequacy) to be maintained by the Financial Holding Companies.
Dealing with troubled banks
Collapse of UT Bank Limited and Capital Bank Limited:
Following their inability to improve their capital adequacy and address insolvency challenges, BoG revoked the banking licenses of UT Bank Ghana Limited and Capital Bank Limited on 14 August 2017 and approved a Purchase and Assumption transaction. According to BoG, this step was taken to safeguard “the stability of the financial system and create a healthy financial sector” by preventing spillover effects to the rest of the financial sector. The purchase and assumption agreement allowed GCB Bank Limited to take over the affected banks’ selected assets and deposits.
Appointment of Official Administrator for UniBank Ghana Limited:
In a press release dated 20 March 2018, BoG appointed an official administrator for UniBank Ghana Limited to manage affairs of the bank for 6 months, stating that “The appointment by the Bank of Ghana of the official administrator is
d. To provide guidance on the processes and procedures for evaluating applications for merger and acquisition and the required documents or agreements to be submitted; and
e. To prescribe post-merger or post-acquisition requirements.
The directive also highlights relevant legal requirements for Sale of business, mergers, amalgamations and reconstructions.
“Fit and proper” directive
Also issued on 5 July 2018 by BoG is the “Fit and Proper” for Banks, Specialized Deposit-Taking Institutions and Financial Holding Companies. Per the exposure draft, the objective of this directive is “to set out a framework which can be used by regulated financial institutions as well as the Bank of Ghana in determining whether a person is fit to be a director, a significant shareholder or to hold a key management position within the organization”
The directive also highlights relevant legal requirements for determining whether significant shareholders, directors and persons occupying key management positions in regulated financial institutions are fit and proper persons.
Financial Holding Companies Directive
BoG, on 27 July 2018, issued the Financial Holding Companies Directive for Banks, Specialized Deposit-Taking Institutions and Financial Holding Companies to:
• Operationalise the provisions of the Banks and Specialised Deposit-
2018 Ghana Banking Survey 35PwC
Key developments in the banking industry4 Key developments in the banking industry4
aimed at saving UniBank from imminent collapse. It will prevent potential losses to depositors and other creditors, and ensure that the financial condition of the bank does not create further risks for the entire financial system”
Appointment of an advisor for Sovereign Bank Limited:
In a press release dated 4 May 2018, BoG announced that it has appointed an advisor for Sovereign Bank Limited in April 2018 to advise the management of Sovereign Bank Limited. The Advisor was expected to help monitor the bank’s recapitalisation efforts and implementation of governance reforms agreed with the Bank of Ghana.
Revocation of banking licenses:
On 1 August 2018, BoG revoked the licenses of UniBank Ghana Limited, The Royal Bank Limited, Beige Bank Limited, Sovereign Bank Limited, and Construction Bank Limited and appointed a receiver in respect of their assets and liabilities. The regulator also granted a universal banking license to a newly established bank named Consolidated Bank Ghana Limited to take over all assets and liabilities of these banks in a Purchase and Assumption transaction.
Issue of bonds to settle liabilities of collapsed banks:
In April 2018, BoG issued a GHS2.2 billion bond to cover the funding gap arising from the Purchase and Assumption of UT Bank Limited and Capital Bank Limited. In August 2018, BoG also announced that “to finance the gap between the liabilities and good assets assumed by Consolidated Bank, the Government has issued a bond of up to GH¢ 5.76 billion”. This brings to GHS7.96 billion, the total amount raised through bond issues to deal with the exposures related to the defunct banks.
5
2018 Ghana Banking Survey 36PwC
Quartile analysis5For a reasonable comparison and
analysis of the industry, we group participating banks into four (4)
quartiles (as shown in the table below) based on the book values of their operating assets as at 31 December 2017.
Total operating assets
Operating assets are defined to include all assets that are directly deployed to generate interest income or related fee income. These comprise cash and funds with BoG, liquid assets including Treasury bills and bonds and investment securities, equity securities and loans and advances. Investment in intangible assets, property, plant and equipment are excluded as they provide a platform to facilitate a bank’s business and not directly used to generate income.
We consider banks’ operating assets to be a key business performance indicator because the ability of banks to grow depends largely on balancing the liquidity and profitability of operating assets while maintaining efficiencies and enhancing the income generating capacity of these resources. Please refer to Appendix A and E for the list of banks and their corresponding abbreviated names used in our analysis.
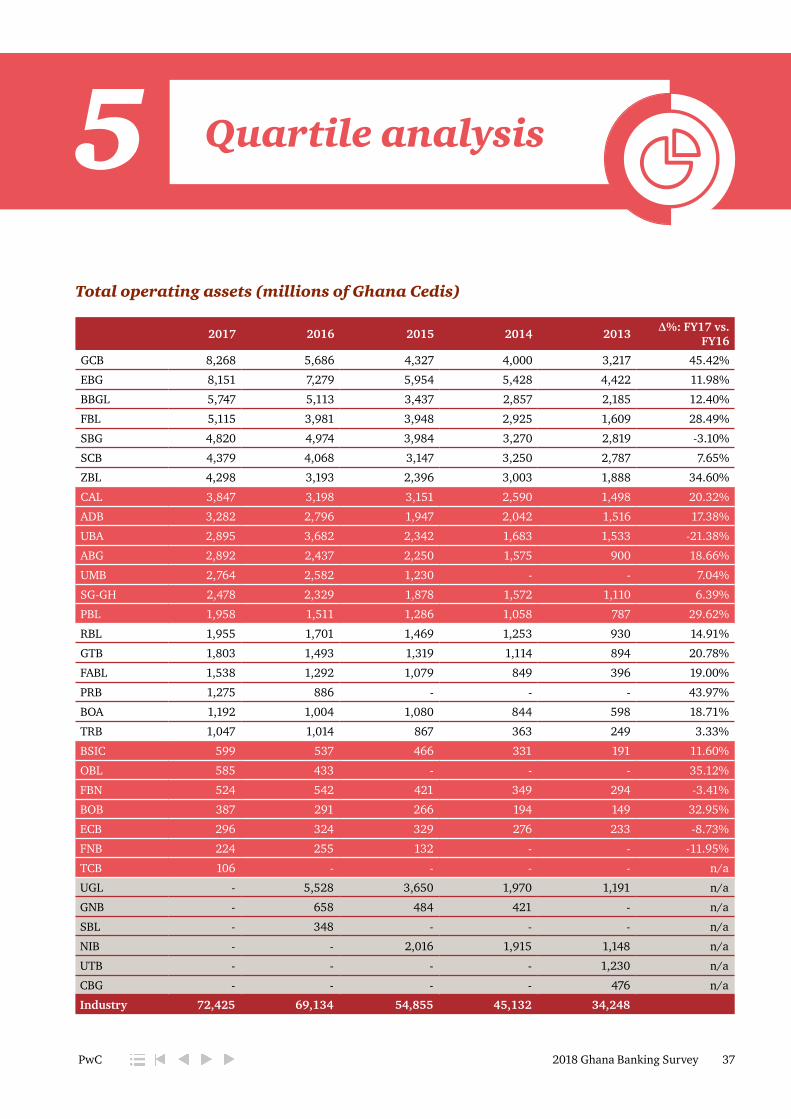
2018 Ghana Banking Survey 37PwC
Quartile analysis5Total operating assets (millions of Ghana Cedis)
2017 2016 2015 2014 2013 Δ%: FY17 vs. FY16
GCB 8,268 5,686 4,327 4,000 3,217 45.42%
EBG 8,151 7,279 5,954 5,428 4,422 11.98%
BBGL 5,747 5,113 3,437 2,857 2,185 12.40%
FBL 5,115 3,981 3,948 2,925 1,609 28.49%
SBG 4,820 4,974 3,984 3,270 2,819 -3.10%
SCB 4,379 4,068 3,147 3,250 2,787 7.65%
ZBL 4,298 3,193 2,396 3,003 1,888 34.60%
CAL 3,847 3,198 3,151 2,590 1,498 20.32%
ADB 3,282 2,796 1,947 2,042 1,516 17.38%
UBA 2,895 3,682 2,342 1,683 1,533 -21.38%
ABG 2,892 2,437 2,250 1,575 900 18.66%
UMB 2,764 2,582 1,230 - - 7.04%
SG-GH 2,478 2,329 1,878 1,572 1,110 6.39%
PBL 1,958 1,511 1,286 1,058 787 29.62%
RBL 1,955 1,701 1,469 1,253 930 14.91%
GTB 1,803 1,493 1,319 1,114 894 20.78%
FABL 1,538 1,292 1,079 849 396 19.00%
PRB 1,275 886 - - - 43.97%
BOA 1,192 1,004 1,080 844 598 18.71%
TRB 1,047 1,014 867 363 249 3.33%
BSIC 599 537 466 331 191 11.60%
OBL 585 433 - - - 35.12%
FBN 524 542 421 349 294 -3.41%
BOB 387 291 266 194 149 32.95%
ECB 296 324 329 276 233 -8.73%
FNB 224 255 132 - - -11.95%
TCB 106 - - - - n/a
UGL - 5,528 3,650 1,970 1,191 n/a
GNB - 658 484 421 - n/a
SBL - 348 - - - n/a
NIB - - 2,016 1,915 1,148 n/a
UTB - - - - 1,230 n/a
CBG - - - - 476 n/a
Industry 72,425 69,134 54,855 45,132 34,248

2018 Ghana Banking Survey 38PwC
Quartile analysis5 Quartile analysis5
NB: We were unable to obtain the published financial statements of UGL, GNB, SBL and NIB for our analysis as these were not publicly available as at the time of conducting our analysis. We note that UGL held GHS5.5 billion in total operating assets at the end of 2016, which constituted 8.0% of the industry’s total operating assets at the end of 2016. In addition, UTB and CBG were placed into receivership in 2017 with GCB taking over the deposit liabilities and selected assets of the defunct banks.
Liquid assets and loans and advances accounted for 38.2% and 34.1% respectively of total operating assets as at end of 2017 (2016: 32.3% and 48.74% respectively). The growth in operating assets was mainly funded by growth in deposits by GHS4.1 billion to GHS56.7 billion as at end of 2017 and complimented with capital injection of GHS312.7 million by SCB, PBL, RBL, ZBL, TRB and FNB in 2017.
The industry experienced a decline of 11.7% in loans and advances in 2017 as compared to a growth of 8.8% in 2016. This is attributable to the conversion of legacy energy sector debts to the Energy Sector Levy Act (ESLA) bonds. Investments in securities, which comprise of Government of Ghana Securities and ESLA bonds, is now the largest component of the operating assets of the industry. Investment securities as at the end of 2017 stood at GH¢27.64 billion (2016: GH¢20.24 billion).
Aside the conversion of the legacy debts into securities through the ESLA Bond, banks generally slowed down on advancing new loans and intensified recovery efforts in a bid to improve asset quality, which contributed to the contraction in total industry loans and advances as at end of 2017.
First Quartile
First Quartile- Operating Assets (in millions of Ghana cedis)
0 1,000 2,000 3,000 4,000 5,000 6,000 7,000 8,000 9,000
2017 2016 2015 2014 2013GCB EBG BBGL FBL SBG SCB ZBL
Total operating assets of the first quartile banks grew by 18.9% from GHS34.3 billion at end of 2016 to GHS40.8 billion at end of 2017 and approximates 56.3% of the industry’s total operating assets, up from 49.5% as at end of 2016.
With a 45.4% growth in total operating assets, GCB has taken over EBG to hold the largest operating assets in the industry following their assumption of selected assets from UT Bank and Capital Bank. This contributed to the highest increase in operating assets in the first quartile.
FBL experienced significant growth in its operating assets. This has been funded through active deposit mobilisation to achieve a 22.8% growth in deposits to GHS4.0 billion and doubling of borrowings to GHS683.8 million over the same period.
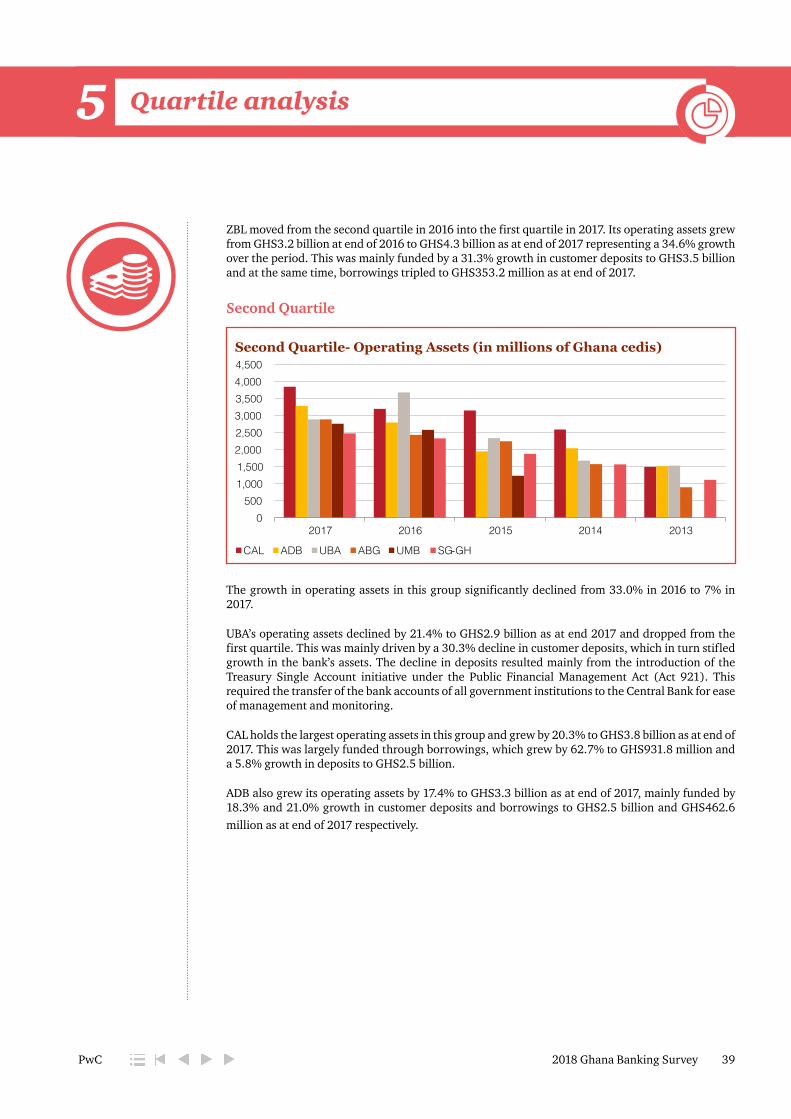
2018 Ghana Banking Survey 39PwC
Quartile analysis5 Quartile analysis5
ZBL moved from the second quartile in 2016 into the first quartile in 2017. Its operating assets grew from GHS3.2 billion at end of 2016 to GHS4.3 billion as at end of 2017 representing a 34.6% growth over the period. This was mainly funded by a 31.3% growth in customer deposits to GHS3.5 billion and at the same time, borrowings tripled to GHS353.2 million as at end of 2017.
Second Quartile
Second Quartile- Operating Assets (in millions of Ghana cedis)
0 500
1,000 1,500 2,000 2,500 3,000 3,500 4,000 4,500
2017 2016 2015 2014 2013
CAL ADB UBA ABG UMB SG-GH
The growth in operating assets in this group significantly declined from 33.0% in 2016 to 7% in 2017.
UBA’s operating assets declined by 21.4% to GHS2.9 billion as at end 2017 and dropped from the first quartile. This was mainly driven by a 30.3% decline in customer deposits, which in turn stifled growth in the bank’s assets. The decline in deposits resulted mainly from the introduction of the Treasury Single Account initiative under the Public Financial Management Act (Act 921). This required the transfer of the bank accounts of all government institutions to the Central Bank for ease of management and monitoring.
CAL holds the largest operating assets in this group and grew by 20.3% to GHS3.8 billion as at end of 2017. This was largely funded through borrowings, which grew by 62.7% to GHS931.8 million and a 5.8% growth in deposits to GHS2.5 billion.
ADB also grew its operating assets by 17.4% to GHS3.3 billion as at end of 2017, mainly funded by 18.3% and 21.0% growth in customer deposits and borrowings to GHS2.5 billion and GHS462.6 million as at end of 2017 respectively.
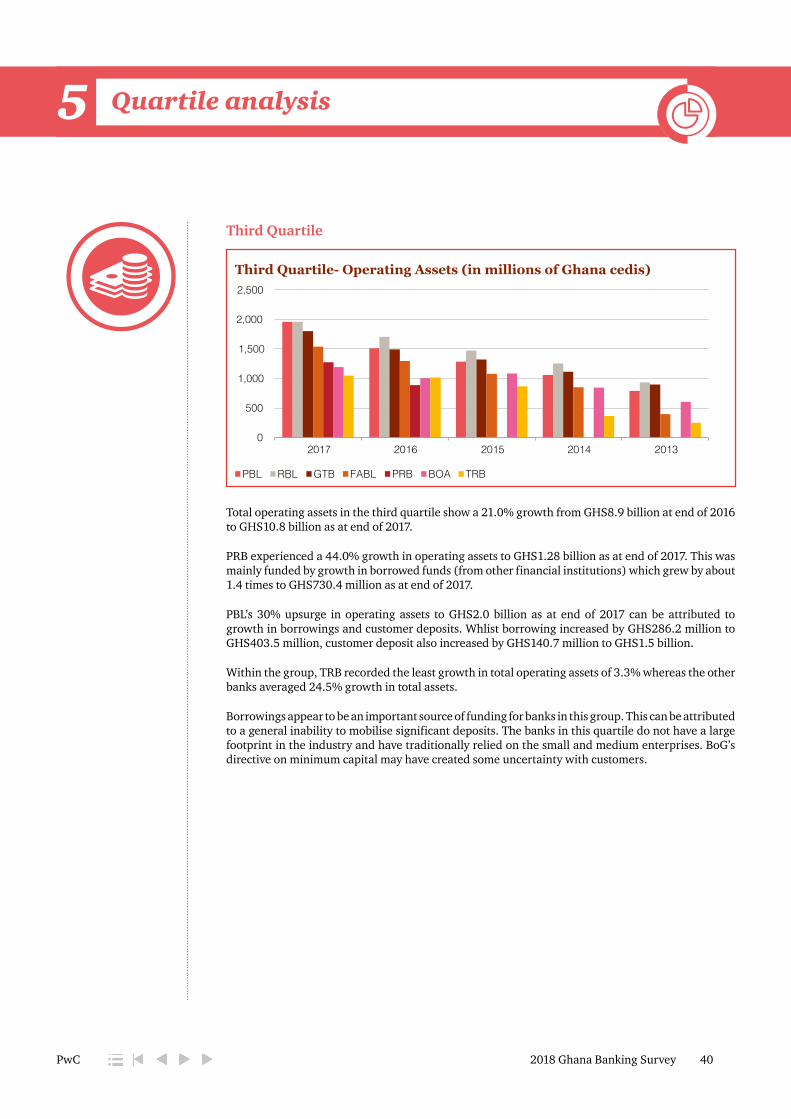
2018 Ghana Banking Survey 40PwC
Quartile analysis5 Quartile analysis5
Third Quartile
Third Quartile- Operating Assets (in millions of Ghana cedis)
0
500
1,000
1,500
2,000
2,500
2017 2016 2015 2014 2013
PBL RBL GTB FABL PRB BOA TRB
Total operating assets in the third quartile show a 21.0% growth from GHS8.9 billion at end of 2016 to GHS10.8 billion as at end of 2017.
PRB experienced a 44.0% growth in operating assets to GHS1.28 billion as at end of 2017. This was mainly funded by growth in borrowed funds (from other financial institutions) which grew by about 1.4 times to GHS730.4 million as at end of 2017.
PBL’s 30% upsurge in operating assets to GHS2.0 billion as at end of 2017 can be attributed to growth in borrowings and customer deposits. Whlist borrowing increased by GHS286.2 million to GHS403.5 million, customer deposit also increased by GHS140.7 million to GHS1.5 billion.
Within the group, TRB recorded the least growth in total operating assets of 3.3% whereas the other banks averaged 24.5% growth in total assets.
Borrowings appear to be an important source of funding for banks in this group. This can be attributed to a general inability to mobilise significant deposits. The banks in this quartile do not have a large footprint in the industry and have traditionally relied on the small and medium enterprises. BoG’s directive on minimum capital may have created some uncertainty with customers.
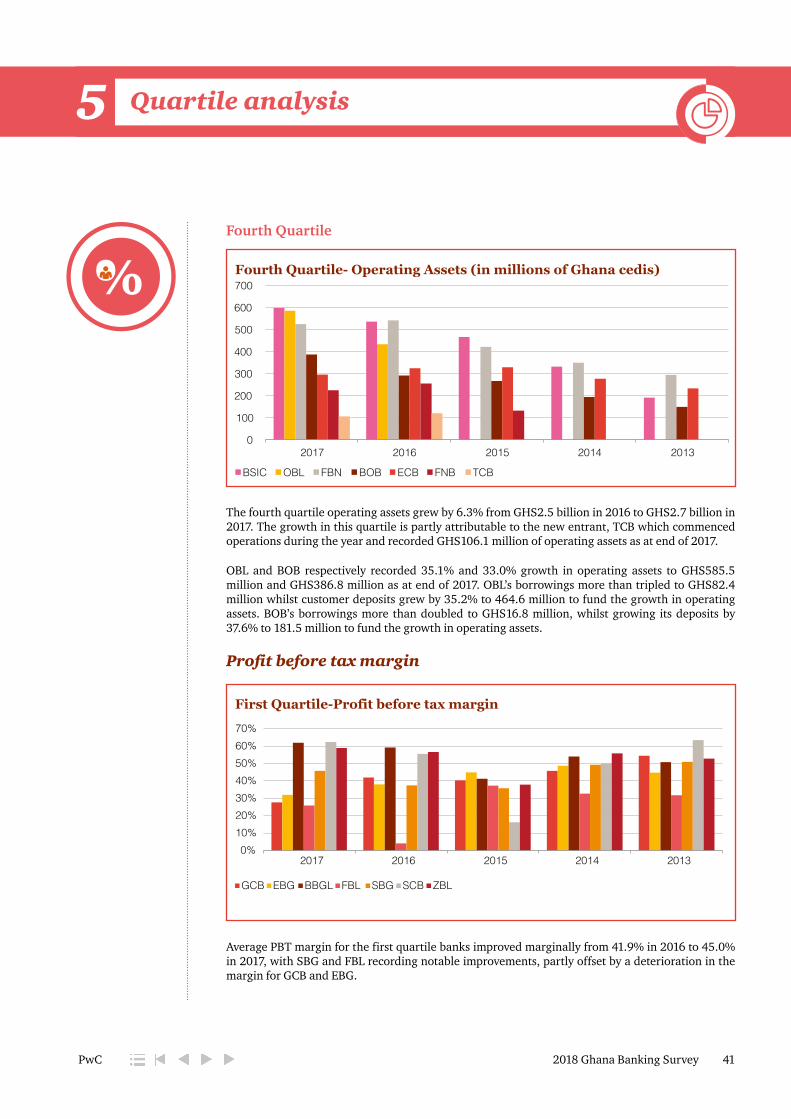
2018 Ghana Banking Survey 41PwC
Quartile analysis5 Quartile analysis5
Fourth Quartile
Fourth Quartile- Operating Assets (in millions of Ghana cedis)
0
100
200
300
400
500
600
700
2017 2016 2015 2014 2013
BSIC OBL FBN BOB ECB FNB TCB
The fourth quartile operating assets grew by 6.3% from GHS2.5 billion in 2016 to GHS2.7 billion in 2017. The growth in this quartile is partly attributable to the new entrant, TCB which commenced operations during the year and recorded GHS106.1 million of operating assets as at end of 2017.
OBL and BOB respectively recorded 35.1% and 33.0% growth in operating assets to GHS585.5 million and GHS386.8 million as at end of 2017. OBL’s borrowings more than tripled to GHS82.4 million whilst customer deposits grew by 35.2% to 464.6 million to fund the growth in operating assets. BOB’s borrowings more than doubled to GHS16.8 million, whilst growing its deposits by 37.6% to 181.5 million to fund the growth in operating assets.
Profit before tax margin
First Quartile-Profit before tax margin
0% 10% 20% 30% 40% 50% 60% 70%
2017 2016 2015 2014 2013
GCB EBG BBGL FBL SBG SCB ZBL
Average PBT margin for the first quartile banks improved marginally from 41.9% in 2016 to 45.0% in 2017, with SBG and FBL recording notable improvements, partly offset by a deterioration in the margin for GCB and EBG.
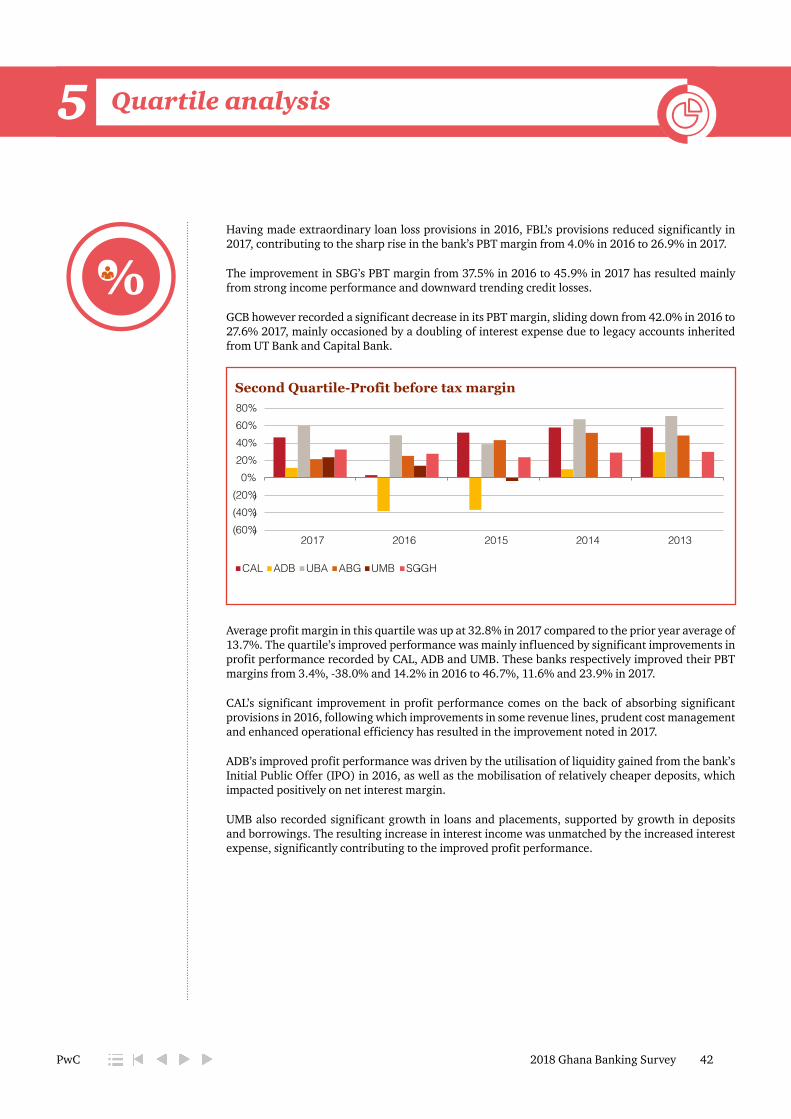
2018 Ghana Banking Survey 42PwC
Quartile analysis5 Quartile analysis5
Having made extraordinary loan loss provisions in 2016, FBL’s provisions reduced significantly in 2017, contributing to the sharp rise in the bank’s PBT margin from 4.0% in 2016 to 26.9% in 2017.
The improvement in SBG’s PBT margin from 37.5% in 2016 to 45.9% in 2017 has resulted mainly from strong income performance and downward trending credit losses.
GCB however recorded a significant decrease in its PBT margin, sliding down from 42.0% in 2016 to 27.6% 2017, mainly occasioned by a doubling of interest expense due to legacy accounts inherited from UT Bank and Capital Bank.
Second Quartile-Profit before tax margin
(60%)(40%)(20%)
0% 20% 40% 60% 80%
2017 2016 2015 2014 2013
CAL ADB UBA ABG UMB SG-GH
Average profit margin in this quartile was up at 32.8% in 2017 compared to the prior year average of 13.7%. The quartile’s improved performance was mainly influenced by significant improvements in profit performance recorded by CAL, ADB and UMB. These banks respectively improved their PBT margins from 3.4%, -38.0% and 14.2% in 2016 to 46.7%, 11.6% and 23.9% in 2017.
CAL’s significant improvement in profit performance comes on the back of absorbing significant provisions in 2016, following which improvements in some revenue lines, prudent cost management and enhanced operational efficiency has resulted in the improvement noted in 2017.
ADB’s improved profit performance was driven by the utilisation of liquidity gained from the bank’s Initial Public Offer (IPO) in 2016, as well as the mobilisation of relatively cheaper deposits, which impacted positively on net interest margin.
UMB also recorded significant growth in loans and placements, supported by growth in deposits and borrowings. The resulting increase in interest income was unmatched by the increased interest expense, significantly contributing to the improved profit performance.
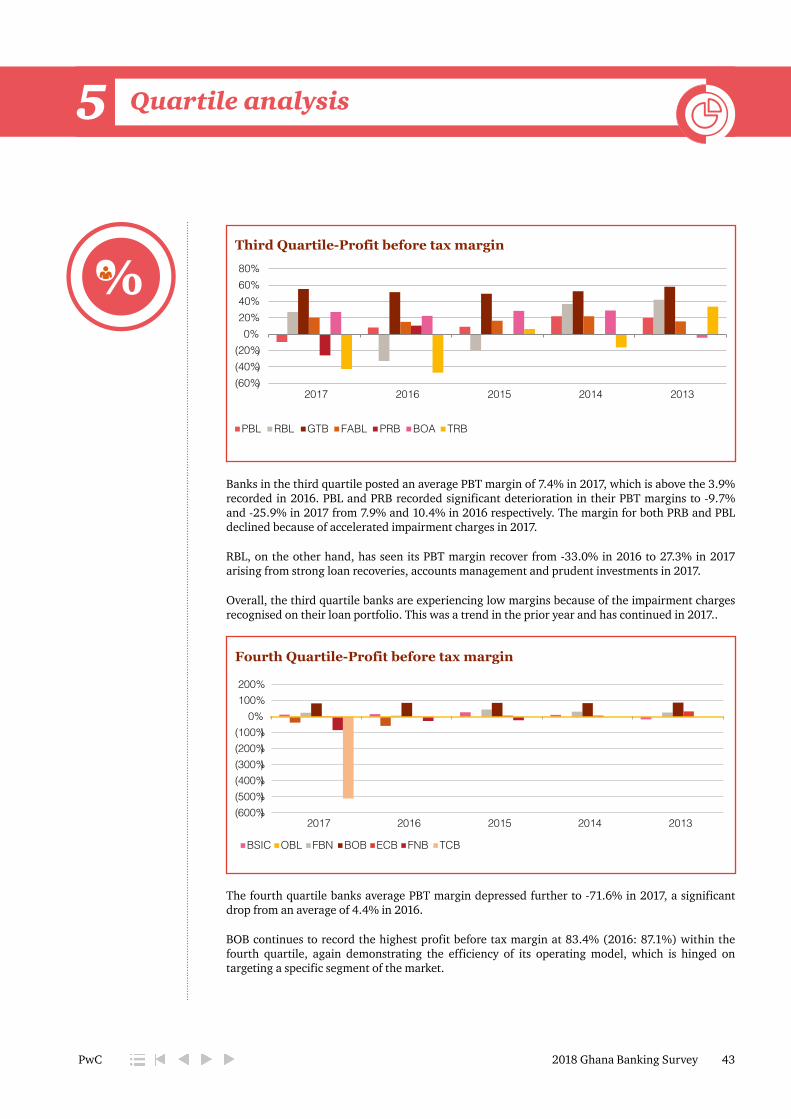
2018 Ghana Banking Survey 43PwC
Quartile analysis5 Quartile analysis5
Third Quartile-Profit before tax margin
(60%)(40%)(20%)
0% 20% 40% 60% 80%
2017 2016 2015 2014 2013
PBL RBL GTB FABL PRB BOA TRB
Banks in the third quartile posted an average PBT margin of 7.4% in 2017, which is above the 3.9% recorded in 2016. PBL and PRB recorded significant deterioration in their PBT margins to -9.7% and -25.9% in 2017 from 7.9% and 10.4% in 2016 respectively. The margin for both PRB and PBL declined because of accelerated impairment charges in 2017.
RBL, on the other hand, has seen its PBT margin recover from -33.0% in 2016 to 27.3% in 2017 arising from strong loan recoveries, accounts management and prudent investments in 2017.
Overall, the third quartile banks are experiencing low margins because of the impairment charges recognised on their loan portfolio. This was a trend in the prior year and has continued in 2017..
Fourth Quartile-Profit before tax margin
(600%)(500%)(400%)(300%)(200%)(100%)
0% 100% 200%
2017 2016 2015 2014 2013
BSIC OBL FBN BOB ECB FNB TCB
The fourth quartile banks average PBT margin depressed further to -71.6% in 2017, a significant drop from an average of 4.4% in 2016.
BOB continues to record the highest profit before tax margin at 83.4% (2016: 87.1%) within the fourth quartile, again demonstrating the efficiency of its operating model, which is hinged on targeting a specific segment of the market.

2018 Ghana Banking Survey 44PwC
Quartile analysis5 Quartile analysis5
TCB, being in its start-up phase, recorded significant under-recovery of its costs, culminating into a loss before tax equivalent to more than 5 times its total income in 2017, and significantly driving down the group’s average PBT margin in 2017. OBL continues to post negative PBT margins, although the margin of -36.0% in 2017 is an improvement over the -56.3% recorded in 2016.
FNB’s margin worsened from -25.8% in 2016 to -82.8% in 2017, mainly driven by a combination of decrease in net interest margin and an increase in operating expenses.
The fourth quartile is characterised by new banks, which are yet to recover operating costs hence posting losses. The start-up banks held significant portion of their funds in government securities. A declining trend in interest rates in these securities led to a decline in interest income and worsening of their loss positions. The declining yield on government securities is likely to have a significant adverse impact on their profitability in the future.
Return on equity
First Quartile - Return on equity
0%
10%
20%
30%
40%
50%
60%
2017 2016 2015 2014 2013
GCB EBG BBGL FBL SBG SCB ZBL
The first quartile banks, on average, posted a ROE of 25.0% in 2017, marginally down from the ROE of 25.8% posted in 2016. Key drivers of the decline include GCB and EBG, which respectively had their ROEs decline from 29.5% and 34.2% in 2016 to 19.1% and 24.9% in 2017, as a result of worsened profit performance as noted with the PBT margins. The drop from GCB and EBG was partly offset by an improvement in FBL’s ROE, which increased from 3.0% in 2016 to 16.9% in 2017 on account of a marked improvement in profit performance.

2018 Ghana Banking Survey 45PwC
Quartile analysis5 Quartile analysis5
Second Quartile - Return on equity
(30%)(20%)(10%)
0% 10% 20% 30% 40% 50% 60%
2017 2016 2015 2014 2013
CAL ADB UBA ABG UMB SG-GH
ROE for second quartile banks improved from an average of 11.9% in 2016 to 19.0% in 2017. ADB’s ROE overturned from a loss in 2016 to 5.5% in 2017. CAL and UMB showed marked improvement in profit performance to drive up their ROEs from 1.4% and 12.4% in 2016 to 22.4% for each bank in 2017 respectively.
Third Quartile - Return on equity
(80%)
(60%)
(40%)
(20%)
0%
20%
40%
2017 2016 2015 2014 2013
PBL RBL GTB FABL PRB BOA TRB
The quartile did not experience significant changes in the ROE as the average ROE for these banks, though unfavourable, remained fairly stable at -4% in 2017. The strong and consistent returns posted by GTB, FABL and BOA have been offset by adverse returns from PBL, PRB and TRB. These banks appear to have suffered setbacks in their performance.
RBL recorded significant improvement in ROE from -27.4% in 2016 to 16.3% in 2017, mainly on account of increased profitability and also capital injection, which may have diluted the ROE. PBL accelerated impairment charges in 2017 and had its ROE drop from 5.7% in 2016 to -11.1% in 2017. PRB’s ROE also dropped from 1.7% to -10.1% also on account of significant impairment charges recorded in 2017.
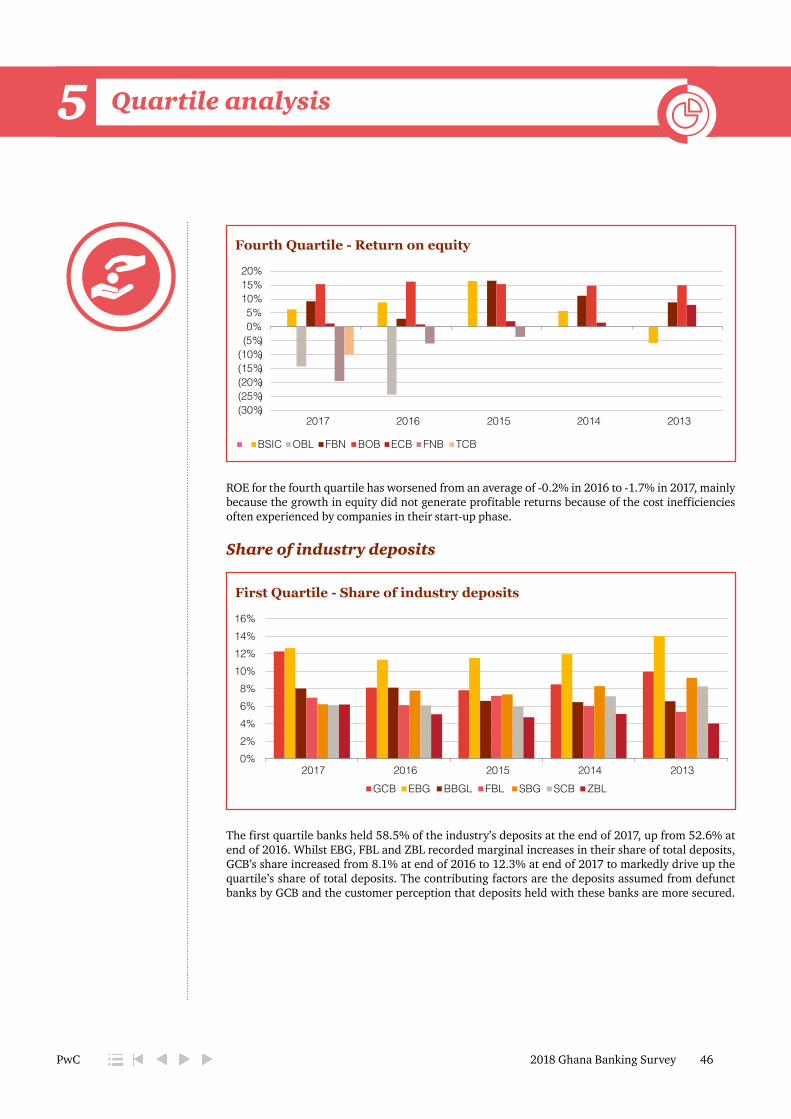
2018 Ghana Banking Survey 46PwC
Quartile analysis5 Quartile analysis5
Fourth Quartile - Return on equity
(30%)(25%)(20%)(15%)(10%)(5%)0% 5%
10% 15% 20%
2017 2016 2015 2014 2013
BSIC OBL FBN BOB ECB FNB TCB
ROE for the fourth quartile has worsened from an average of -0.2% in 2016 to -1.7% in 2017, mainly because the growth in equity did not generate profitable returns because of the cost inefficiencies often experienced by companies in their start-up phase.
Share of industry deposits
First Quartile - Share of industry deposits
0% 2% 4% 6% 8%
10% 12% 14% 16%
2017 2016 2015 2014 2013GCB EBG BBGL FBL SBG SCB ZBL
The first quartile banks held 58.5% of the industry’s deposits at the end of 2017, up from 52.6% at end of 2016. Whilst EBG, FBL and ZBL recorded marginal increases in their share of total deposits, GCB’s share increased from 8.1% at end of 2016 to 12.3% at end of 2017 to markedly drive up the quartile’s share of total deposits. The contributing factors are the deposits assumed from defunct banks by GCB and the customer perception that deposits held with these banks are more secured.
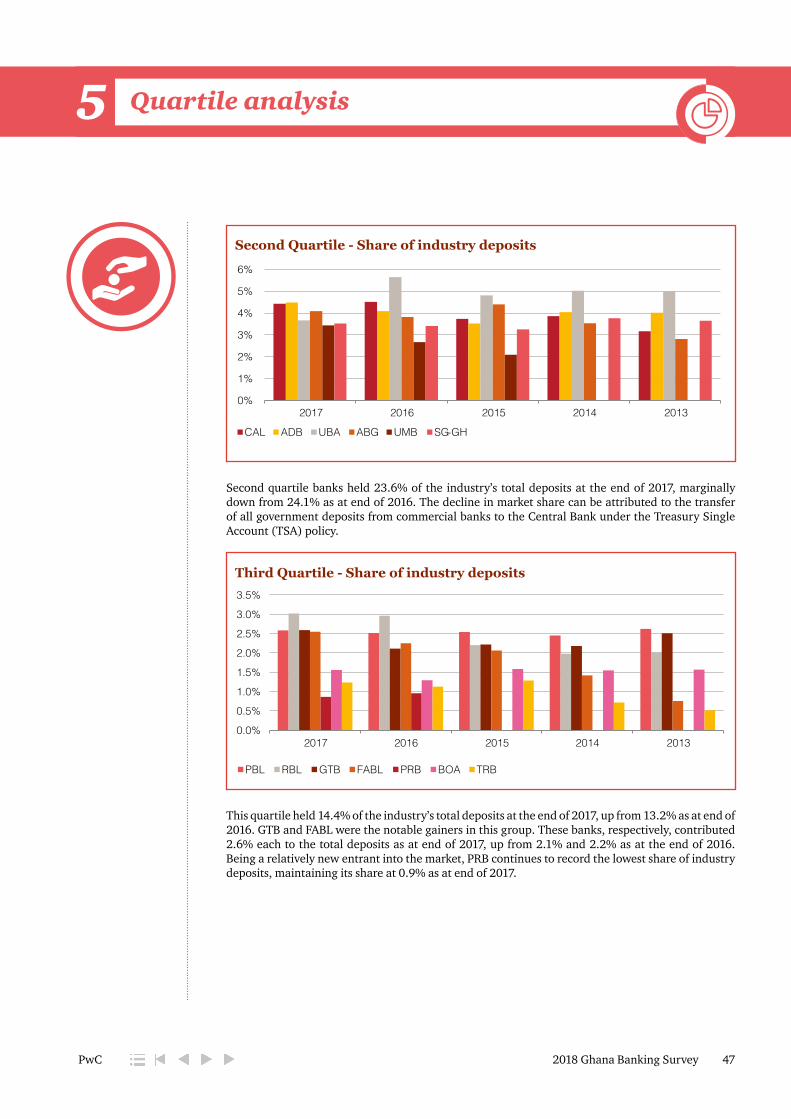
2018 Ghana Banking Survey 47PwC
Quartile analysis5 Quartile analysis5
Second Quartile - Share of industry deposits
0%
1%
2%
3%
4%
5%
6%
2017 2016 2015 2014 2013
CAL ADB UBA ABG UMB SG-GH
Second quartile banks held 23.6% of the industry’s total deposits at the end of 2017, marginally down from 24.1% as at end of 2016. The decline in market share can be attributed to the transfer of all government deposits from commercial banks to the Central Bank under the Treasury Single Account (TSA) policy.
Third Quartile - Share of industry deposits
-
0.0%
0.5%
1.0%
1.5%
2.0%
2.5%
3.0%
3.5%
2017 2016 2015 2014 2013
PBL RBL GTB FABL PRB BOA TRB
This quartile held 14.4% of the industry’s total deposits at the end of 2017, up from 13.2% as at end of 2016. GTB and FABL were the notable gainers in this group. These banks, respectively, contributed 2.6% each to the total deposits as at end of 2017, up from 2.1% and 2.2% as at the end of 2016. Being a relatively new entrant into the market, PRB continues to record the lowest share of industry deposits, maintaining its share at 0.9% as at end of 2017.
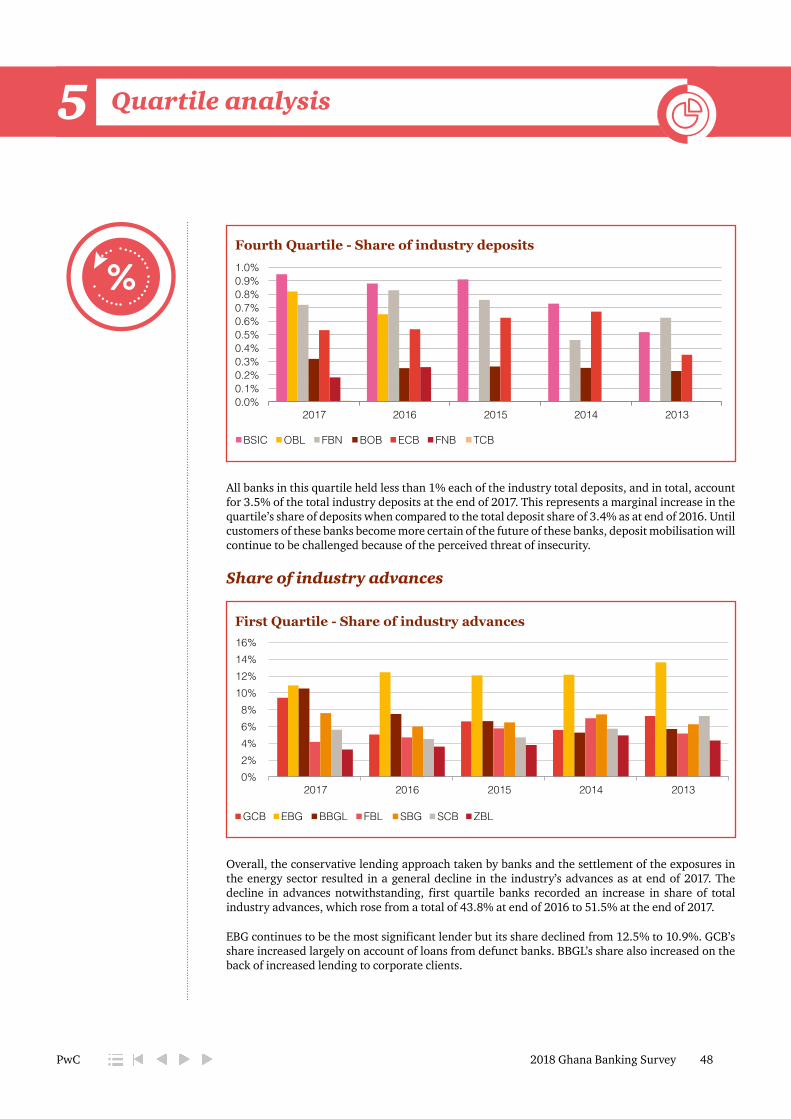
2018 Ghana Banking Survey 48PwC
Quartile analysis5 Quartile analysis5
Fourth Quartile - Share of industry deposits
0.0%0.1%0.2%0.3%0.4%0.5%0.6%0.7%0.8%0.9%1.0%
2017 2016 2015 2014 2013
BSIC OBL FBN BOB ECB FNB TCB
All banks in this quartile held less than 1% each of the industry total deposits, and in total, account for 3.5% of the total industry deposits at the end of 2017. This represents a marginal increase in the quartile’s share of deposits when compared to the total deposit share of 3.4% as at end of 2016. Until customers of these banks become more certain of the future of these banks, deposit mobilisation will continue to be challenged because of the perceived threat of insecurity.
Share of industry advances
First Quartile - Share of industry advances
0% 2% 4% 6% 8%
10% 12% 14% 16%
2017 2016 2015 2014 2013
GCB EBG BBGL FBL SBG SCB ZBL
Overall, the conservative lending approach taken by banks and the settlement of the exposures in the energy sector resulted in a general decline in the industry’s advances as at end of 2017. The decline in advances notwithstanding, first quartile banks recorded an increase in share of total industry advances, which rose from a total of 43.8% at end of 2016 to 51.5% at the end of 2017.
EBG continues to be the most significant lender but its share declined from 12.5% to 10.9%. GCB’s share increased largely on account of loans from defunct banks. BBGL’s share also increased on the back of increased lending to corporate clients.
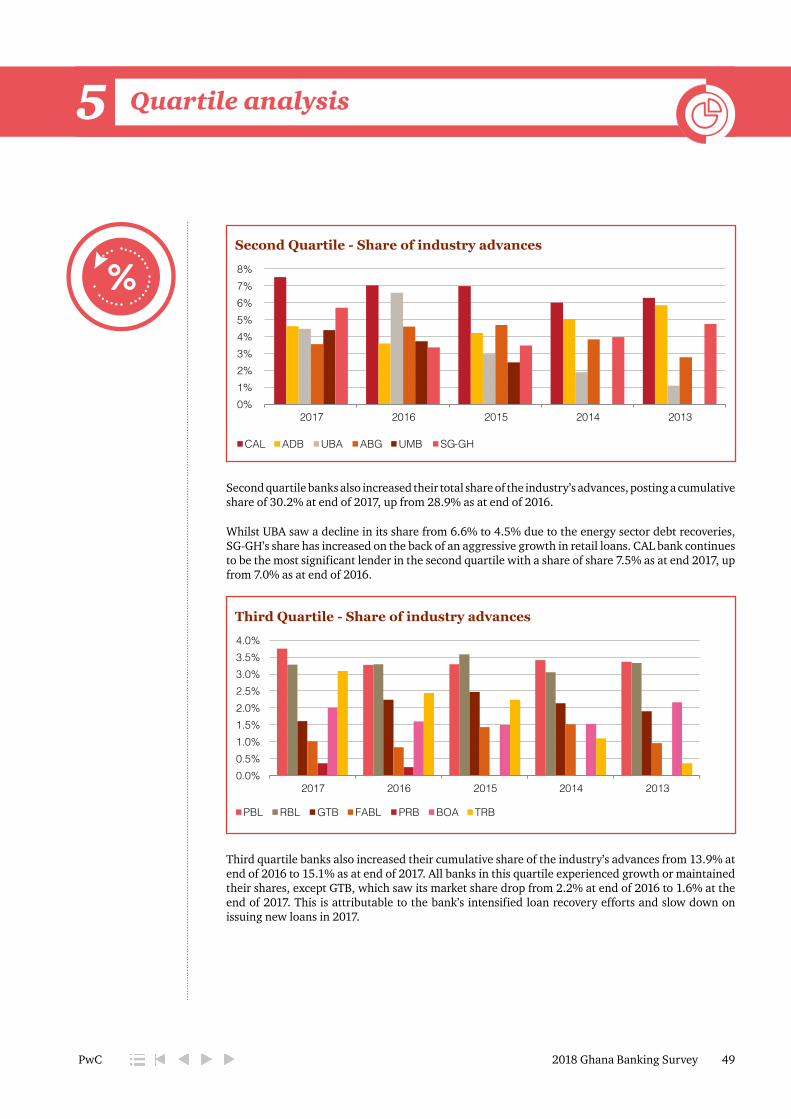
2018 Ghana Banking Survey 49PwC
Quartile analysis5 Quartile analysis5
Second Quartile - Share of industry advances
0% 1% 2% 3% 4% 5% 6% 7% 8%
2017 2016 2015 2014 2013
CAL ADB UBA ABG UMB SG-GH
Second quartile banks also increased their total share of the industry’s advances, posting a cumulative share of 30.2% at end of 2017, up from 28.9% as at end of 2016.
Whilst UBA saw a decline in its share from 6.6% to 4.5% due to the energy sector debt recoveries, SG-GH’s share has increased on the back of an aggressive growth in retail loans. CAL bank continues to be the most significant lender in the second quartile with a share of share 7.5% as at end 2017, up from 7.0% as at end of 2016.
Third Quartile - Share of industry advances
0.0%0.5%1.0%1.5%2.0%2.5%3.0%3.5%4.0%
2017 2016 2015 2014 2013
PBL RBL GTB FABL PRB BOA TRB
Third quartile banks also increased their cumulative share of the industry’s advances from 13.9% at end of 2016 to 15.1% as at end of 2017. All banks in this quartile experienced growth or maintained their shares, except GTB, which saw its market share drop from 2.2% at end of 2016 to 1.6% at the end of 2017. This is attributable to the bank’s intensified loan recovery efforts and slow down on issuing new loans in 2017.

2018 Ghana Banking Survey 50PwC
Quartile analysis5 Quartile analysis5
Fourth Quartile - Share of industry advances
0.0%
0.2%
0.4%
0.6%
0.8%
1.0%
1.2%
2017 2016 2015 2014 2013
BSIC OBL FBN BOB ECB FNB TCB
The group’s market share of advances grew from 2.3% at end of 2016 to 3.2% as at end of 2017. These were funded mainly by increased borrowings and customer deposits. The drop in yield from government securities may have contributed to banks in this quartile relying on advances as alternative option to deploying funds.
Ratio of impairment allowance to gross loans and advances
First Quartile - Impairment allowance/ gross loans and advances
0%
5%
10%
15%
20%
25%
2017 2016 2015 2014 2013
GCB EBG BBGL FBL SBG SCB ZBL
The first quartile banks generally experienced an improvement in the quality of loan book, with drop in average ratio of impairment allowance to gross loans and advances for the quartile from 10.2% to 9.9%. This is as a result of steps taken to clean up bank’s books in previous years and is also attributable to the settlement of the energy sector debts.
ZBL and BBGL showed improvement from prior year while SCB maintained its aggressive provisioning stance on loans. GCB’s impairment allowance to gross loans and advances position is attributable to a 56.6% growth in its gross loans with a less than proportionate increase in impairment allowance of 10.0%, resulting mainly from the assumed loans from defunct banks.

2018 Ghana Banking Survey 51PwC
Quartile analysis5 Quartile analysis5
Second Quartile - Impairment allowance/gross loans and advances
0%
5%
10%
15%
20%
25%
2017 2016 2015 2014 2013
CAL ADB UBA ABG UMB SG-GH
The second quartile banks generally experienced a deterioration in asset quality, with an average impairment allowance to gross loans ratio of 11.4% at the end of 2017, worsening from 10.0% as at the end of 2016. The banks in this quartile had the largest exposure to the Bulk Distribution Company (BDC) loans. Except for SG-GH, all other banks in this quartile recorded declines in their ratios, mainly due to additional impairment charges recorded in 2017 and a slower growth in loans.
.
Third Quartile - Impairment allowance/ gross loans and advances
0%
5%
10%
15%
20%
25%
2017 2016 2015 2014 2013
PBL RBL GTB FABL PRB BOA TRB
The third quartile banks also experienced further deterioration in asset quality, posting an average impairment allowance to gross loans ratio of 12.1% at the end of 2017, worsening from a ratio of 9.5% as at the end of 2016. These banks do not have significant participation in the energy sector loans but are experiencing deterioration driven by the inherent weaknesses in credit monitoring and unfavourable performance in the small and medium scale business sector.
Whilst TRB and PRB have seen their ratios deteriorate from 8.6% and 10.4% at end of 2016 to 17.7% and 21.9% as at end of 2017, FABL recorded significant improvement in its ratio, which declined from 18.2% to 8.4% over the same period. The worsened position of TRB and PRB has arose from increased impairment charges. FABL, on the other hand, intensified recovery efforts and strengthened its credit risk management function, which accounted for the improvement noted.

2018 Ghana Banking Survey 52PwC
Quartile analysis5 Quartile analysis5
Fourth Quartile - Impairment allowance/ gross loans and advances
0% 5%
10% 15% 20% 25% 30%
2017 2016 2015 2014 2013
BSIC OBL FBN BOB ECB FNB TCB
In line with the general trend seen in the industry, the fourth quartile banks’ average impairment allowance to gross loans ratio also worsened from 6.6% at the end of 2016 to 7.6% at the end of 2017. This quartile has suffered the same trend as the third quartile banks because its customer portfolio is dominated by the small and medium enterprises with a higher risk of default.
BSIC recorded additional impairment expense in 2017 but was unable to achieve the same level of credit loss recoveries as in 2016, leading to a 36.3% increase in net impairment charge.
ECB experienced a 27.6% growth in impairment allowance, but only achieved a 4.0% growth in its gross loans, leading to a worsened ratio in 2017.
Cost to income ratio
First Quartile - Cost income ratio
0% 10% 20% 30% 40% 50% 60% 70% 80%
2017 2016 2015 2014 2013
GCB EBG BBGL FBL SBG SCB ZBL
The average cost to income ratio for first quartile banks increased marginally from 46.2% in 2016 to 48.5% in 2017. Improved cost efficiencies achieved by SCB and SBG were depressed by deterioration in GCB’s cost efficiencies. The assumption of assets and liabilities of the defunct banks increased GCB’s costs.
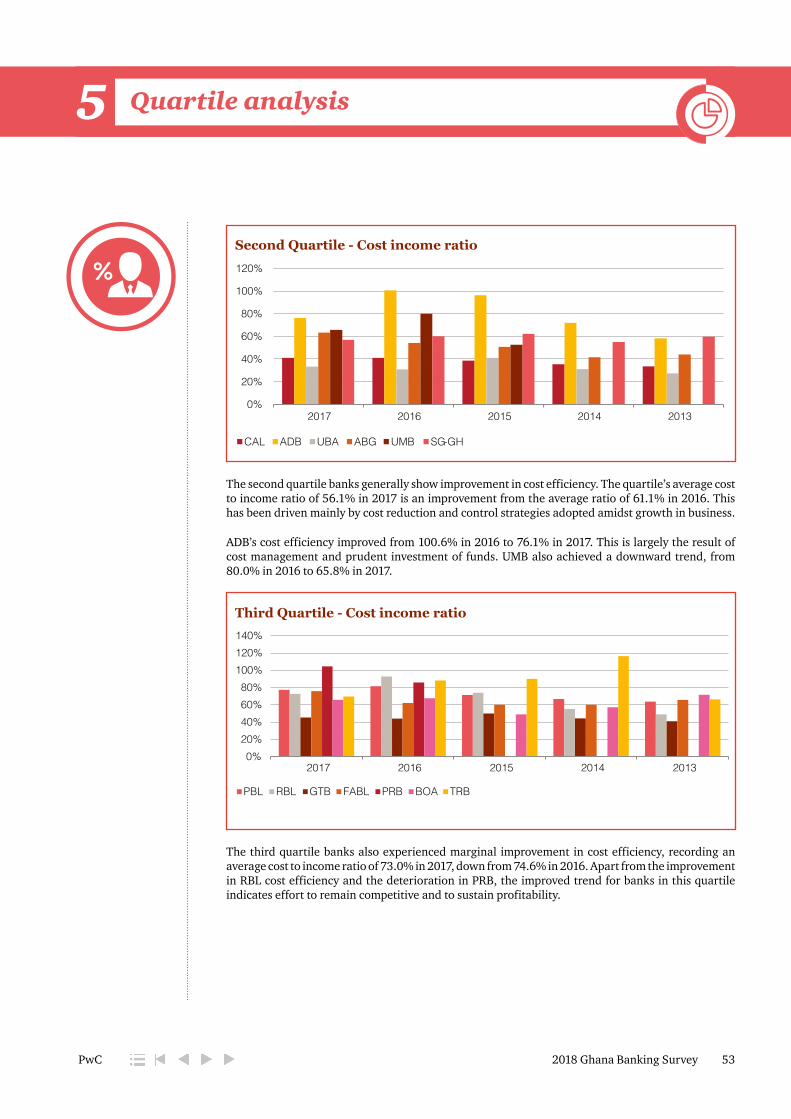
2018 Ghana Banking Survey 53PwC
Quartile analysis5 Quartile analysis5
Second Quartile - Cost income ratio
0%
20%
40%
60%
80%
100%
120%
2017 2016 2015 2014 2013
CAL ADB UBA ABG UMB SG-GH
The second quartile banks generally show improvement in cost efficiency. The quartile’s average cost to income ratio of 56.1% in 2017 is an improvement from the average ratio of 61.1% in 2016. This has been driven mainly by cost reduction and control strategies adopted amidst growth in business.
ADB’s cost efficiency improved from 100.6% in 2016 to 76.1% in 2017. This is largely the result of cost management and prudent investment of funds. UMB also achieved a downward trend, from 80.0% in 2016 to 65.8% in 2017.
Third Quartile - Cost income ratio
0% 20% 40% 60% 80%
100% 120% 140%
2017 2016 2015 2014 2013
PBL RBL GTB FABL PRB BOA TRB
The third quartile banks also experienced marginal improvement in cost efficiency, recording an average cost to income ratio of 73.0% in 2017, down from 74.6% in 2016. Apart from the improvement in RBL cost efficiency and the deterioration in PRB, the improved trend for banks in this quartile indicates effort to remain competitive and to sustain profitability.

2018 Ghana Banking Survey 54PwC
Quartile analysis5 Quartile analysis5
Fourth Quartile - Cost income ratio
0% 100% 200% 300% 400% 500% 600% 700%
2017 2016 2015 2014 2013
BSIC OBL FBN BOB ECB FNB TCB
The cost to income ratio for the fourth quartile banks deteriorated from an average of 67.9% in 2016 to 162.6% in 2017. The deterioration of the quartile’s ratio can be attributed to the start-up phase of TCB which began operations in 2017. The other banks in the quartile did not experience significant interest income growth because of the declining yield on investment securities. This had an adverse impact on the cost efficiencies because inflationary trend continues to drive cost upwards.
TCB, which is still in its start-up phase, recorded the highest ever cost to income ratio since 2013, generating an operating cost which is equivalent to more than 6 times its total income in 2017. This is attributable to usual start-up costs as the bank invests in key areas of the business to allow it to compete in the market.
FNB’s cost efficiency deteriorated further due to a decline in interest earnings as the bank held significant amount of funds in money market instruments which experienced drop in yield in 2017.
OBL improved its cost efficiency from 126.3% in 2016 to 101.3% in 2017. Establishing structures to enable it compete with other banks may have contributed to cost improvement strategies.
2018 Ghana Banking Survey 55PwC
Quartile analysis5 Quartile analysis5
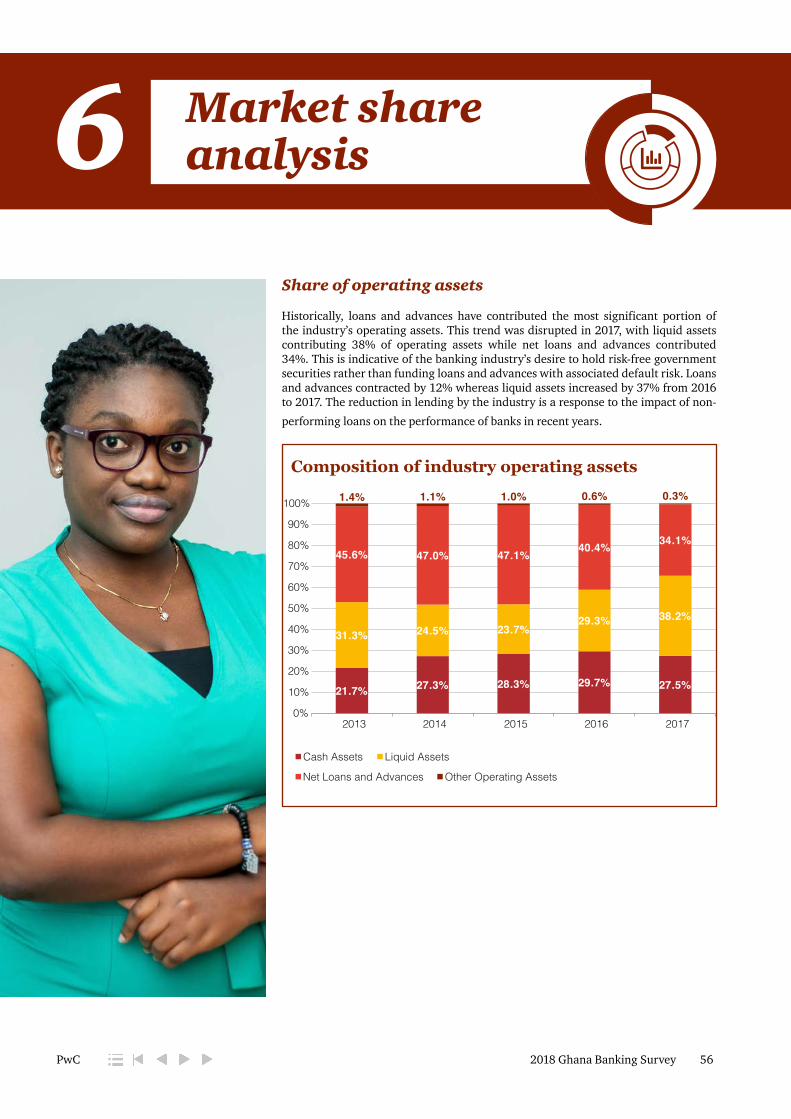
2018 Ghana Banking Survey 56PwC
Market share analysis6
Share of operating assets
Historically, loans and advances have contributed the most significant portion of the industry’s operating assets. This trend was disrupted in 2017, with liquid assets contributing 38% of operating assets while net loans and advances contributed 34%. This is indicative of the banking industry’s desire to hold risk-free government securities rather than funding loans and advances with associated default risk. Loans and advances contracted by 12% whereas liquid assets increased by 37% from 2016 to 2017. The reduction in lending by the industry is a response to the impact of non-
performing loans on the performance of banks in recent years.
Composition of industry operating assets
21.7% 27.3% 28.3% 29.7% 27.5%
31.3% 24.5% 23.7%29.3% 38.2%
45.6% 47.0% 47.1% 40.4% 34.1%
1.4% 1.1% 1.0% .0 6% 0.3%
0%
10%
20%
30%
40%
50%
60%
70%
80%
90%
100%
2013 2014 2015 2016 2017
Cash Assets Liquid Assets
Net Loans and Advances Other Operating Assets
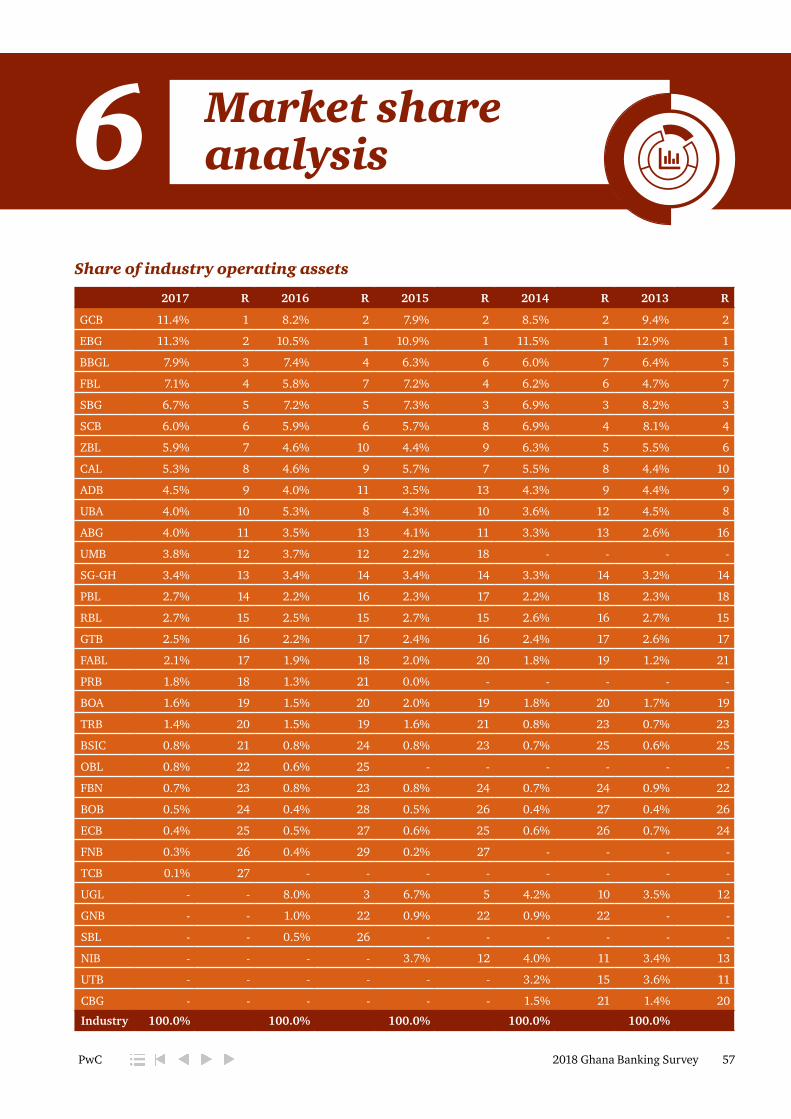
2018 Ghana Banking Survey 57PwC
Market share analysis6
Share of industry operating assets
2017 R 2016 R 2015 R 2014 R 2013 R
GCB 11.4% 1 8.2% 2 7.9% 2 8.5% 2 9.4% 2
EBG 11.3% 2 10.5% 1 10.9% 1 11.5% 1 12.9% 1
BBGL 7.9% 3 7.4% 4 6.3% 6 6.0% 7 6.4% 5
FBL 7.1% 4 5.8% 7 7.2% 4 6.2% 6 4.7% 7
SBG 6.7% 5 7.2% 5 7.3% 3 6.9% 3 8.2% 3
SCB 6.0% 6 5.9% 6 5.7% 8 6.9% 4 8.1% 4
ZBL 5.9% 7 4.6% 10 4.4% 9 6.3% 5 5.5% 6
CAL 5.3% 8 4.6% 9 5.7% 7 5.5% 8 4.4% 10
ADB 4.5% 9 4.0% 11 3.5% 13 4.3% 9 4.4% 9
UBA 4.0% 10 5.3% 8 4.3% 10 3.6% 12 4.5% 8
ABG 4.0% 11 3.5% 13 4.1% 11 3.3% 13 2.6% 16
UMB 3.8% 12 3.7% 12 2.2% 18 - - - -
SG-GH 3.4% 13 3.4% 14 3.4% 14 3.3% 14 3.2% 14
PBL 2.7% 14 2.2% 16 2.3% 17 2.2% 18 2.3% 18
RBL 2.7% 15 2.5% 15 2.7% 15 2.6% 16 2.7% 15
GTB 2.5% 16 2.2% 17 2.4% 16 2.4% 17 2.6% 17
FABL 2.1% 17 1.9% 18 2.0% 20 1.8% 19 1.2% 21
PRB 1.8% 18 1.3% 21 0.0% - - - - -
BOA 1.6% 19 1.5% 20 2.0% 19 1.8% 20 1.7% 19
TRB 1.4% 20 1.5% 19 1.6% 21 0.8% 23 0.7% 23
BSIC 0.8% 21 0.8% 24 0.8% 23 0.7% 25 0.6% 25
OBL 0.8% 22 0.6% 25 - - - - - -
FBN 0.7% 23 0.8% 23 0.8% 24 0.7% 24 0.9% 22
BOB 0.5% 24 0.4% 28 0.5% 26 0.4% 27 0.4% 26
ECB 0.4% 25 0.5% 27 0.6% 25 0.6% 26 0.7% 24
FNB 0.3% 26 0.4% 29 0.2% 27 - - - -
TCB 0.1% 27 - - - - - - - -
UGL - - 8.0% 3 6.7% 5 4.2% 10 3.5% 12
GNB - - 1.0% 22 0.9% 22 0.9% 22 - -
SBL - - 0.5% 26 - - - - - -
NIB - - - - 3.7% 12 4.0% 11 3.4% 13
UTB - - - - - - 3.2% 15 3.6% 11
CBG - - - - - - 1.5% 21 1.4% 20
Industry 100.0% 100.0% 100.0% 100.0% 100.0%

2018 Ghana Banking Survey 58PwC
Market share analysis6 Market share analysis6
EBG and GCB to dominate and together control 22.7% of the industry’s total operating assets as at end of 2017. In total, the tier 1 banks controlled 56% of the industry’s total operating assets as at end of 2017, an increase from 49.5% held as at end of 2016.
GCB has become the market leader following the assumption of selected assets and all deposits of the erstwhile UT Bank and Capital Bank in August 2017. Consequently, GCB experienced significant increases in its loan book and liquid assets.
EBG experienced a GHS1.9 billion increase in liquid assets. The conversion of the energy sector loans to ESLA bonds may have contributed to the liquid assets holding. The net loans and advances mimic the industry trend of holding government securities rather than lending. EBG however remains the industry’s most significant lender as a holder of deposits.
FBL also grew its share of operating assets to 7.1% as at end of 2017, up from 5.7% as at end of 2016. This was largely on account of 53% growth in investment securities and 61% growth in cash and cash equivalents. The growth in the key assets mentioned was funded mainly by deposit mobilisation which yielded a 24% growth (GHS743 million) in customer deposits to GHS3.8 billion as at end of 2017.
ZBL increased its share of operating assets from 4.6% at end of 2016 to 5.9% as at end of 2017. The bank experienced a 52.2% growth in investment securities and a scale up of more than 1.5 times in bank placements to expand its share of operating assets. This was funded by a 31.7% growth in customer deposits to GHS3.5 billion as at end of 2017. The bank slowed down on new advances and intensified loan recovery (leading to a contraction of the loan book), coupled with a strategy to redirect funds into less risky portfolios, mainly investment securities and bank placements with Zenith Bank Plc.
The non-performing loans (NPLs) have taken a heavy toll on the banking industry in recent years, with a number of banks facing constraints due to challenges surrounding bad debt recovery and loan performance. Banks are adapting to the situation by investing in safer government securities and cash assets. These have grown in significance and contributed to the industry’s operating assets, to the detriment of loans and advances. Additionally, the industry’s ability to fund loans and advances also diminished with government’s enforced directive on the Treasury Single Account (TSA) in 2017. However, declining returns on government securities might compel the industry to realign itself and settle in an appropriate balance with operating assets spread across liquid assets, cash assets and loans and advances.

2018 Ghana Banking Survey 59PwC
Market share analysis6 Market share analysis6
Share of industry deposits
Although banks employed various strategies to boost deposit mobilisation, total industry deposits only grew by 8% within the last year. This is considerably lower than year on year average growth rate of 21.5% in the last 5 years. The comparatively slower growth can be attributed to attractive rates offered by government securities. Despite the drop in yields, these securities continue to offer more favourable returns. Also the collapse of banks in the last quarter of 2017 may have deepened customer uncertainties in the banking sector.
To grow this source of trading, it is essential for banks to become more innovative especially in the areas of product customisation and digitisation in order to mobilise new deposits, bridge the financial inclusion gap and restore customer confidence.
The composition of deposits is as follows:
Composition of Industry Deposits (in %)
0%
10%
20%
30%
40%
50%
60%
2017 2016 2015 2014 2013
Current accounts Time & fixed deposits Savings accountsCertificates of deposits Call deposits Deposits from other banksDeposits from BoG Forex deposits
0%
10%
20%
30%
40%
50%
60%
2017 2016 2015 2014 2013
Composition of Industry Deposits (in %)
Current accounts Time & fixed deposits Savings accounts
Call deposits Deposits from other banks Others
The composition of industry deposits has not changed much in recent years and remains largely skewed in favor of current accounts because banks continue to pursue a strategy of mobilising cheaper deposits in the form of current and savings accounts to fund their operations. Both current and savings accounts grew marginally by 0.8% and 0.9% in 2017. Time and fixed deposits however saw the highest growth of 3.1%.

2018 Ghana Banking Survey 60PwC
Market share analysis6 Market share analysis6
Share of industry deposits
2017 R 2016 R 2015 R 2014 R 2013 R
EBG 12.6% 1 11.3% 1 11.5% 1 12.0% 1 14.0% 1
GCB 12.3% 2 8.1% 2 7.8% 2 8.5% 2 10.0% 2
BBGL 8.0% 3 8.1% 3 6.6% 6 6.5% 5 6.6% 5
FBL 7.0% 4 6.1% 5 7.2% 5 6.0% 6 5.4% 6
SBG 6.2% 5 7.8% 4 7.3% 4 8.3% 3 9.2% 3
ZBL 6.2% 6 5.1% 8 4.8% 9 5.1% 7 4.0% 9
SCB 6.1% 7 6.1% 6 6.0% 7 7.1% 4 8.3% 4
ADB 4.5% 8 4.1% 11 3.5% 13 4.0% 10 4.0% 10
CAL 4.4% 9 4.5% 10 3.7% 12 3.9% 11 3.2% 13
ABG 4.1% 10 3.8% 12 4.4% 10 3.5% 14 2.8% 15
UBA 3.7% 11 5.7% 7 4.8% 8 5.0% 8 5.0% 7
SG-GH 3.5% 12 3.4% 13 3.3% 14 3.8% 12 3.6% 12
UMB 3.4% 13 2.7% 15 2.1% 18 - - - -
RBL 3.0% 14 3.0% 14 2.2% 17 2.0% 18 2.0% 18
GTB 2.6% 15 2.1% 18 2.2% 16 2.2% 17 2.5% 17
PBL 2.6% 16 2.5% 16 2.5% 15 2.4% 16 2.6% 16
FABL 2.6% 17 2.2% 17 2.1% 19 1.4% 20 0.8% 21
BOA 1.6% 18 1.3% 19 1.6% 20 1.6% 19 1.6% 19
TRB 1.2% 19 1.1% 21 1.3% 21 0.7% 24 0.5% 23
BSIC 0.9% 20 0.9% 23 0.9% 23 0.7% 23 0.5% 24
PRB 0.9% 21 1.0% 22 - - - - - -
OBL 0.8% 22 0.7% 25 - - - - - -
FBN 0.7% 23 0.8% 24 0.8% 24 0.5% 26 0.6% 22
ECB 0.5% 24 0.5% 26 0.6% 25 0.7% 25 0.4% 25
BOB 0.3% 25 0.3% 29 0.3% 26 0.3% 27 0.2% 26
FNB 0.2% 26 0.3% 28 0.0% 27 - - - -
TCB 0.0% 27 0.0% - - - - - - -
UGL - - 5.0% 9 7.5% 3 4.9% 9 4.1% 8
GNB - - 1.2% 20 1.0% 22 0.9% 22 - -
SBL - - 0.5% 27 - - - - - -
NIB - - - - 4.1% 11 3.7% 13 3.0% 14
UTB - - - - - - 3.3% 15 4.0% 11
CBG - - - - - - 1.0% 21 1.1% 20
Industry 100.0% 100.0% 100.0% 100.0% 100.0%

2018 Ghana Banking Survey 61PwC
Market share analysis6 Market share analysis6
GCB posted 62.5% growth in deposits and gained market share. This is mainly driven by the bank’s assumption of all the deposits of UT Bank and Capital Bank. GCB, with the largest branch network, is competitively positioned to become the leader in market share if deposit mobilisation strategies are effective in the coming years. The bank intends to focus more on digitisation and aggressive deposit growth.
FBL’s objective to become a significant holder of deposits in the industry may have had some traction because the bank’s deposit base grew by 24% to GH¢3.8 billion during the year. FBL adopted the strategy of enhancing its online presence with the addition of new features to its corporate banking platform and creating commercial and SME hubs within the retail banking divisions to better serve such markets.
UMB gained market share by growing its deposits across current and savings accounts as well as time deposits by 39%. Deposits from individuals, private enterprises and financial institutions collectively grew by 66% whilst deposits from public enterprises declined by 26%. Almost all of the deposits are due to mature within 12 months and the 20 largest deposits to total deposit ratio has increased to 48% from 42% in 2016. It appears that the bank is highly dependent on very few short term depositors. The strategies for diluting maturities of deposits and diversification of its customer base may define the growth and stability of UMB’s deposit base.
In 2017, SBG Bank adopted several strategies to aid in mobilising deposits. The bank launched an initiative dubbed ‘save to gain’ to aggressively grow its deposit base as well as help improve the national savings culture. Despite the initiative, there was a decline in the bank’s customer deposits by 14% in comparison to 2016, which resulted in a reduction of their share of industry deposits by 1.6%. The decline in deposits
was largely driven by a reduction in placements from other banks and exit of some high interest-bearing call deposits. This is an indication of the aggressive pricing of deposits as other banks offer depositors attractive rates.
UBA’s deposits reduced by 30% resulting in a decline of its market share by 2%. Although deposits by retail customers of the bank increased by 30% to GHS801 million, this was offset by a 46% decline in deposits from corporate customers. The decline in corporate accounts largely resulted from the effects of the introduction of the Treasury Single Account initiative as demanded by the Public Financial Management Act (Act 921).
Although new banks (TCB, PRB, OBL, FNB, SBL and a few others) have come on stream in the last three years, the total deposits has not changed significantly. This may be attributable to the fact that a large segment of the market remains outside the scope of the existing financial institutions. In addition, there is intense competition in the industry in the area of deposit mobilisation from growing mobile money and financial technology (“Fintech”) entities which have increasingly become popular because of convenience and the drive towards financial inclusion.
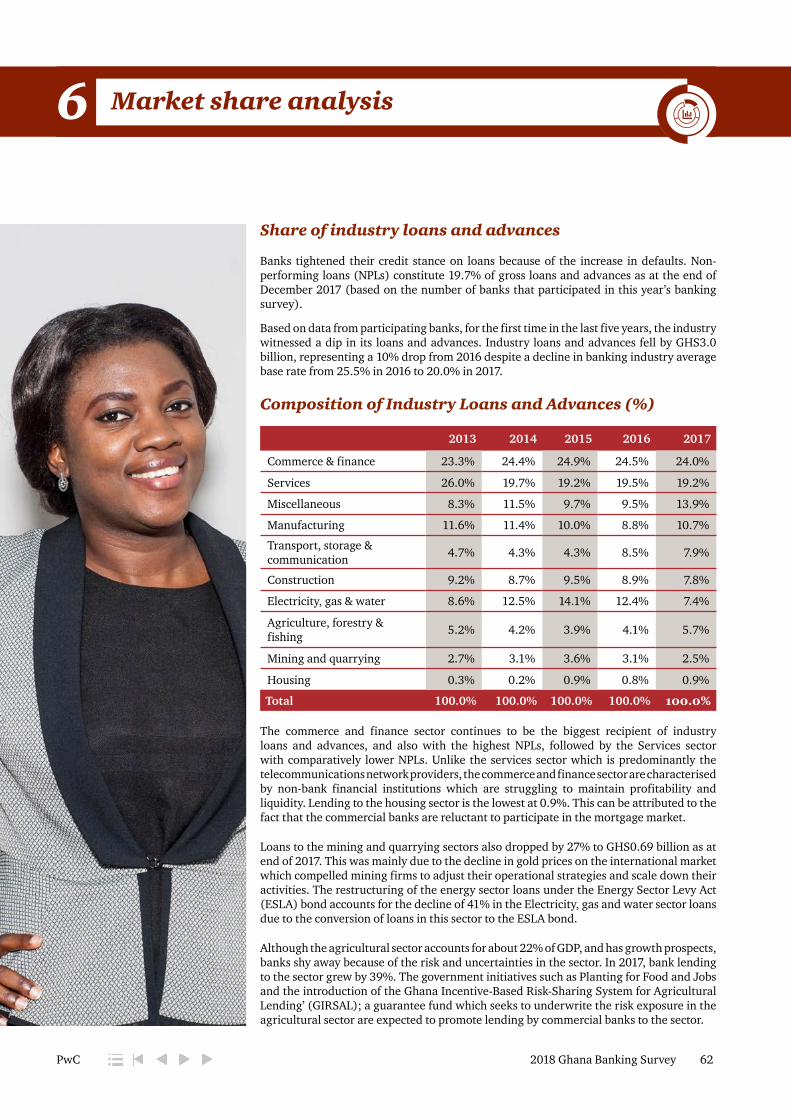
2018 Ghana Banking Survey 62PwC
Market share analysis6 Market share analysis6
Share of industry loans and advances
Banks tightened their credit stance on loans because of the increase in defaults. Non-performing loans (NPLs) constitute 19.7% of gross loans and advances as at the end of December 2017 (based on the number of banks that participated in this year’s banking survey).
Based on data from participating banks, for the first time in the last five years, the industry witnessed a dip in its loans and advances. Industry loans and advances fell by GHS3.0 billion, representing a 10% drop from 2016 despite a decline in banking industry average base rate from 25.5% in 2016 to 20.0% in 2017.
Composition of Industry Loans and Advances (%)
2013 2014 2015 2016 2017
Commerce & finance 23.3% 24.4% 24.9% 24.5% 24.0%
Services 26.0% 19.7% 19.2% 19.5% 19.2%
Miscellaneous 8.3% 11.5% 9.7% 9.5% 13.9%
Manufacturing 11.6% 11.4% 10.0% 8.8% 10.7%
Transport, storage & communication 4.7% 4.3% 4.3% 8.5% 7.9%
Construction 9.2% 8.7% 9.5% 8.9% 7.8%
Electricity, gas & water 8.6% 12.5% 14.1% 12.4% 7.4%
Agriculture, forestry & fishing 5.2% 4.2% 3.9% 4.1% 5.7%
Mining and quarrying 2.7% 3.1% 3.6% 3.1% 2.5%
Housing 0.3% 0.2% 0.9% 0.8% 0.9%
Total 100.0% 100.0% 100.0% 100.0% 100.0%
The commerce and finance sector continues to be the biggest recipient of industry loans and advances, and also with the highest NPLs, followed by the Services sector with comparatively lower NPLs. Unlike the services sector which is predominantly the telecommunications network providers, the commerce and finance sector are characterised by non-bank financial institutions which are struggling to maintain profitability and liquidity. Lending to the housing sector is the lowest at 0.9%. This can be attributed to the fact that the commercial banks are reluctant to participate in the mortgage market.
Loans to the mining and quarrying sectors also dropped by 27% to GHS0.69 billion as at end of 2017. This was mainly due to the decline in gold prices on the international market which compelled mining firms to adjust their operational strategies and scale down their activities. The restructuring of the energy sector loans under the Energy Sector Levy Act (ESLA) bond accounts for the decline of 41% in the Electricity, gas and water sector loans due to the conversion of loans in this sector to the ESLA bond.
Although the agricultural sector accounts for about 22% of GDP, and has growth prospects, banks shy away because of the risk and uncertainties in the sector. In 2017, bank lending to the sector grew by 39%. The government initiatives such as Planting for Food and Jobs and the introduction of the Ghana Incentive-Based Risk-Sharing System for Agricultural Lending’ (GIRSAL); a guarantee fund which seeks to underwrite the risk exposure in the agricultural sector are expected to promote lending by commercial banks to the sector.
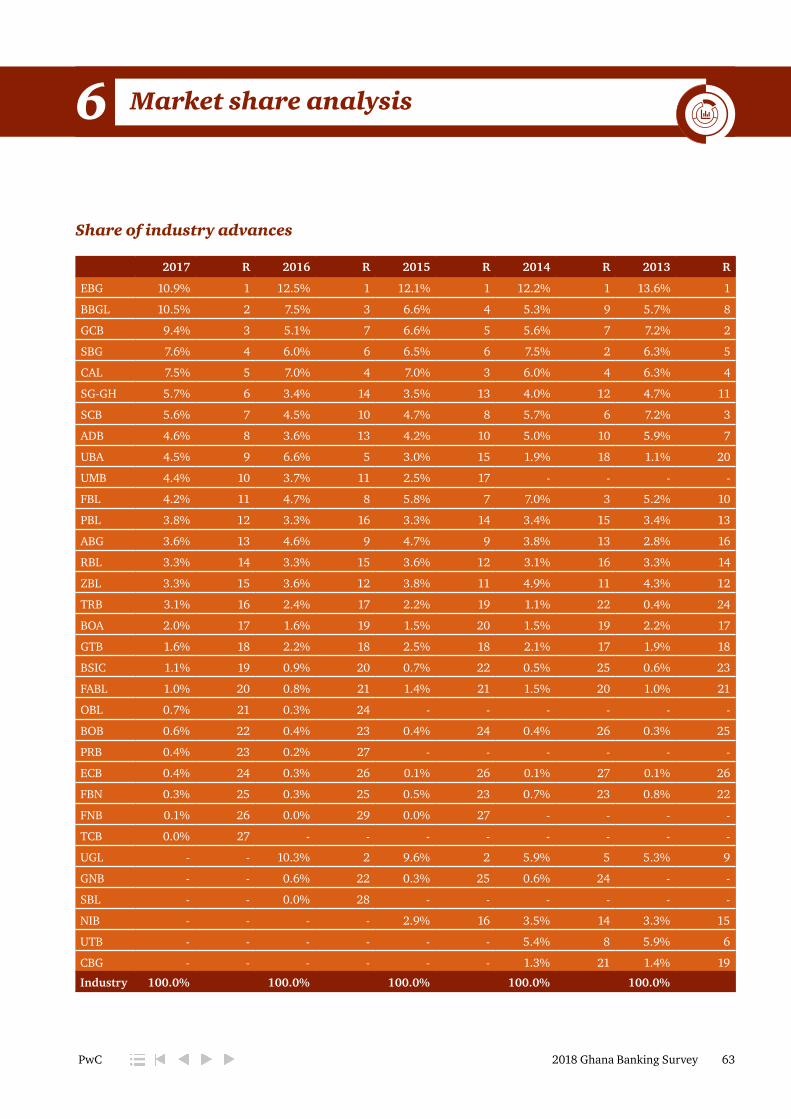
2018 Ghana Banking Survey 63PwC
Market share analysis6 Market share analysis6
Share of industry advances
2017 R 2016 R 2015 R 2014 R 2013 R
EBG 10.9% 1 12.5% 1 12.1% 1 12.2% 1 13.6% 1
BBGL 10.5% 2 7.5% 3 6.6% 4 5.3% 9 5.7% 8
GCB 9.4% 3 5.1% 7 6.6% 5 5.6% 7 7.2% 2
SBG 7.6% 4 6.0% 6 6.5% 6 7.5% 2 6.3% 5
CAL 7.5% 5 7.0% 4 7.0% 3 6.0% 4 6.3% 4
SG-GH 5.7% 6 3.4% 14 3.5% 13 4.0% 12 4.7% 11
SCB 5.6% 7 4.5% 10 4.7% 8 5.7% 6 7.2% 3
ADB 4.6% 8 3.6% 13 4.2% 10 5.0% 10 5.9% 7
UBA 4.5% 9 6.6% 5 3.0% 15 1.9% 18 1.1% 20
UMB 4.4% 10 3.7% 11 2.5% 17 - - - -
FBL 4.2% 11 4.7% 8 5.8% 7 7.0% 3 5.2% 10
PBL 3.8% 12 3.3% 16 3.3% 14 3.4% 15 3.4% 13
ABG 3.6% 13 4.6% 9 4.7% 9 3.8% 13 2.8% 16
RBL 3.3% 14 3.3% 15 3.6% 12 3.1% 16 3.3% 14
ZBL 3.3% 15 3.6% 12 3.8% 11 4.9% 11 4.3% 12
TRB 3.1% 16 2.4% 17 2.2% 19 1.1% 22 0.4% 24
BOA 2.0% 17 1.6% 19 1.5% 20 1.5% 19 2.2% 17
GTB 1.6% 18 2.2% 18 2.5% 18 2.1% 17 1.9% 18
BSIC 1.1% 19 0.9% 20 0.7% 22 0.5% 25 0.6% 23
FABL 1.0% 20 0.8% 21 1.4% 21 1.5% 20 1.0% 21
OBL 0.7% 21 0.3% 24 - - - - - -
BOB 0.6% 22 0.4% 23 0.4% 24 0.4% 26 0.3% 25
PRB 0.4% 23 0.2% 27 - - - - - -
ECB 0.4% 24 0.3% 26 0.1% 26 0.1% 27 0.1% 26
FBN 0.3% 25 0.3% 25 0.5% 23 0.7% 23 0.8% 22
FNB 0.1% 26 0.0% 29 0.0% 27 - - - -
TCB 0.0% 27 - - - - - - - -
UGL - - 10.3% 2 9.6% 2 5.9% 5 5.3% 9
GNB - - 0.6% 22 0.3% 25 0.6% 24 - -
SBL - - 0.0% 28 - - - - - -
NIB - - - - 2.9% 16 3.5% 14 3.3% 15
UTB - - - - - - 5.4% 8 5.9% 6
CBG - - - - - - 1.3% 21 1.4% 19
Industry 100.0% 100.0% 100.0% 100.0% 100.0%

2018 Ghana Banking Survey 64PwC
Market share analysis6 Market share analysis6
EBG’s dominant market share declined in 2017. The bank’s net loans and advances dropped to GHS2.69 billion as at end of 2017 from GHS3.48 billion at end of 2016. This is attributable to the settlement of some energy sector exposure under the ESLA bond arrangement. With the resultant impact on the interest income, the business focused more on driving trade and cash management activities to diversify its revenue sources.
BBGL’s net loans and advances grew by 23.9% to GHS2.6 billion as at the end of 2017 notwithstanding the general slowdown in advances across the industry and gained market share. This was partly funded by growth in customer deposits and liquidation of government securities amidst the declining yield on investment securities in 2017.
GCB’s net loan book grew by 48% to GHS2.1 billion as at end of 2017. The selected loans assumed by GCB from the defunct banks contributed to the growth in GCB’s market share to 9.4% as at end of 2017, up from 5.1% at end of 2016. The bank’s lending to commerce and finance institutions more than doubled to GHS1 billion as at end of 2017, whiles lending to the manufacturing sector recorded a seven-fold increase from GHS25 million at end of 2016 to GHS188 million as at end of 2017.
SCB grew its market share of advances to 5.6% in 2017, up from 4.5% in 2016. Being cautiously optimistic, its focus on growth opportunities in 2017 resulted in 38.1% growth in loans and advances to GHS1.7 billion as at the end of 2017. Aside repositioning the bank’s corporate and business banking segment, management intensified the digitisation of its retail segment to drive up its retail business growth in 2017.
SG-GH grew its share of industry advances to 5.7% as at end of 2017, from 3.4% in 2016. The introduction of the Controller and Accountant General Department’s (CAGD) loan scheme in the latter part of 2016 contributed to the growth. The scheme, together with other loan schemes targeted at workers in the formal sector, gained full momentum in 2017, resulting in a 50% growth in the bank’s loan book to GHS1.4 billion as at end of 2017.
Following a contraction in loans by 40.5% to GHS1.1 billion as at the end of 2017, UBA’s market share of advances declined from 6.6% in 2016 to 4.5% in 2017. Aside slowing down on new advances and intensifying recovery efforts in a bid to improve asset quality, the bank experienced a 30.3% contraction in deposits following the introduction of the Treasury Single Account (TSA) policy by Government, which led to the exit of some high profile deposits, further stifling the bank’s ability to grow its loan book in 2017. The bank’s strategies aimed at mobilising cheap deposits and diversify the deposit mix will be key to its growth and profitability.
OBL, having secured banking license in 2016, has grown its loans by 84.3% to GHS174.7 million at the end of 2017. This has been
2018 Ghana Banking Survey 65PwC
Market share analysis6 Market share analysis6
funded by a 35.4% growth in deposits as the business gained momentum in 2017, and a triple growth in borrowings to GHS82.4 million at the end of 2017. Consequently, the bank’s market share of advances has grown from 0.3% in 2016 to 0.7% in 2017.
TCB which had the lowest market share of industry loans, was officially launched to the public in 2017, and was yet to fully roll out its strategies aimed at growing its loan book.
The central bank’s continued stance on monetary easing, Government’s efforts to reduce NPLs through the ESLA bond and smaller fiscal deficit to reduce the government’s demand for credit are likely to have positive impact on the availability and cost of lending. Additionally, government’s initiatives such as 1Distric 1Factory (1D1F), Planting for Food and Jobs and The National Entrepreneurship and Innovation Plan (NEIP) are expected to create opportunities for lending.
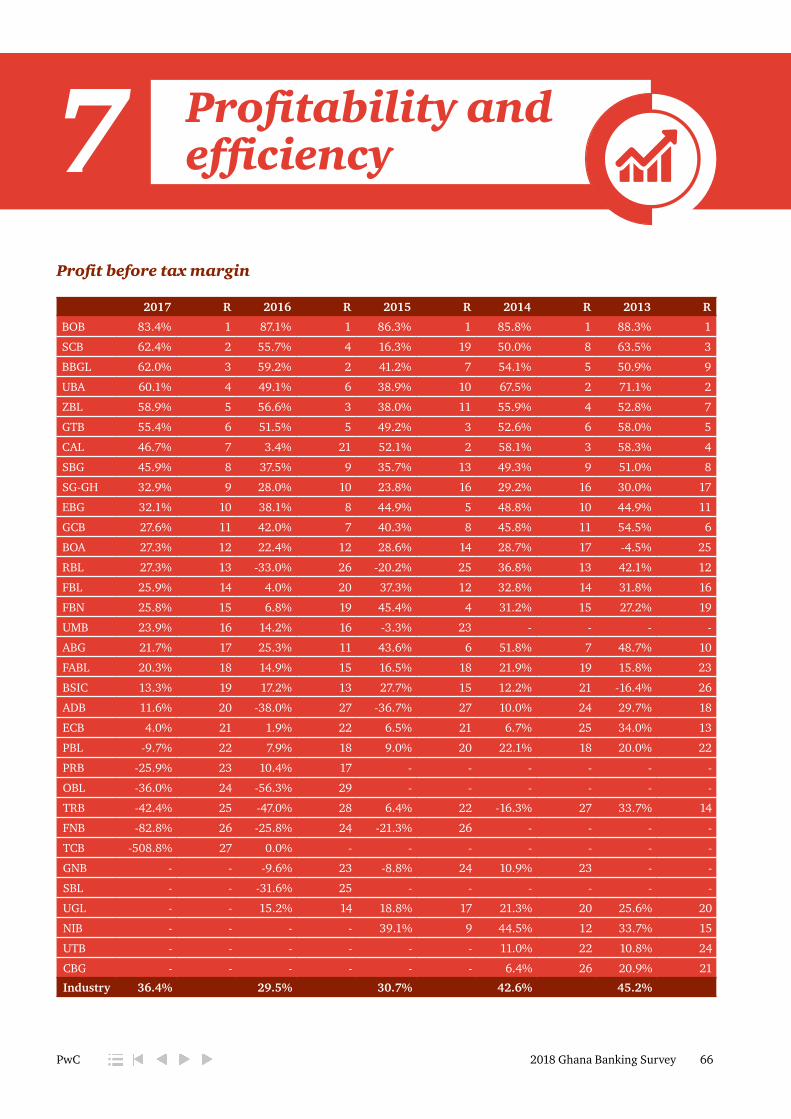
2018 Ghana Banking Survey 66PwC
Profitability and efficiency7
Profit before tax margin
2017 R 2016 R 2015 R 2014 R 2013 R
BOB 83.4% 1 87.1% 1 86.3% 1 85.8% 1 88.3% 1
SCB 62.4% 2 55.7% 4 16.3% 19 50.0% 8 63.5% 3
BBGL 62.0% 3 59.2% 2 41.2% 7 54.1% 5 50.9% 9
UBA 60.1% 4 49.1% 6 38.9% 10 67.5% 2 71.1% 2
ZBL 58.9% 5 56.6% 3 38.0% 11 55.9% 4 52.8% 7
GTB 55.4% 6 51.5% 5 49.2% 3 52.6% 6 58.0% 5
CAL 46.7% 7 3.4% 21 52.1% 2 58.1% 3 58.3% 4
SBG 45.9% 8 37.5% 9 35.7% 13 49.3% 9 51.0% 8
SG-GH 32.9% 9 28.0% 10 23.8% 16 29.2% 16 30.0% 17
EBG 32.1% 10 38.1% 8 44.9% 5 48.8% 10 44.9% 11
GCB 27.6% 11 42.0% 7 40.3% 8 45.8% 11 54.5% 6
BOA 27.3% 12 22.4% 12 28.6% 14 28.7% 17 -4.5% 25
RBL 27.3% 13 -33.0% 26 -20.2% 25 36.8% 13 42.1% 12
FBL 25.9% 14 4.0% 20 37.3% 12 32.8% 14 31.8% 16
FBN 25.8% 15 6.8% 19 45.4% 4 31.2% 15 27.2% 19
UMB 23.9% 16 14.2% 16 -3.3% 23 - - - -
ABG 21.7% 17 25.3% 11 43.6% 6 51.8% 7 48.7% 10
FABL 20.3% 18 14.9% 15 16.5% 18 21.9% 19 15.8% 23
BSIC 13.3% 19 17.2% 13 27.7% 15 12.2% 21 -16.4% 26
ADB 11.6% 20 -38.0% 27 -36.7% 27 10.0% 24 29.7% 18
ECB 4.0% 21 1.9% 22 6.5% 21 6.7% 25 34.0% 13
PBL -9.7% 22 7.9% 18 9.0% 20 22.1% 18 20.0% 22
PRB -25.9% 23 10.4% 17 - - - - - -
OBL -36.0% 24 -56.3% 29 - - - - - -
TRB -42.4% 25 -47.0% 28 6.4% 22 -16.3% 27 33.7% 14
FNB -82.8% 26 -25.8% 24 -21.3% 26 - - - -
TCB -508.8% 27 0.0% - - - - - - -
GNB - - -9.6% 23 -8.8% 24 10.9% 23 - -
SBL - - -31.6% 25 - - - - - -
UGL - - 15.2% 14 18.8% 17 21.3% 20 25.6% 20
NIB - - - - 39.1% 9 44.5% 12 33.7% 15
UTB - - - - - - 11.0% 22 10.8% 24
CBG - - - - - - 6.4% 26 20.9% 21
Industry 36.4% 29.5% 30.7% 42.6% 45.2%

2018 Ghana Banking Survey 67PwC
Profitability and efficiency7
The industry’s profit before tax grew by 31%, from GHS 2.54 billion in 2016 to GHS 3.32 billion in 2017, which is higher than the growth of 6% achieved in the previous year. Profit before tax margin of 36.4% is the highest recorded margin in the last two years. Interest income from loans and advances represent 47% of total interest income and interest income from investment securities represent 42% of total interest income earned in the industry.
The industry’s net interest income grew by 6% from GHS 6.1 billion in 2016 to GHS 6.5 billion in 2017, which is slower than the 14% growth rate achieved in 2016. This is attributable to the 16% fall in earnings from loans and advances to customers in 2017, which is a significant component of the total interest income for the year. This is generally due to tightened credit stance adopted by banks in a bid to control the adverse impact of NPLs on their profitability.
The growth of interest income from cash and short-term funds and investment securities in 2017 was significantly lower compared to 2016. In 2016, interest income from cash and short-term funds almost doubled to GHS 896.5 million. However, in 2017, interest income from cash and short-term funds grew by only 16% to GHS1.0 billion. Similarly, interest income from investment securities grew by 13% from GHS3.7 billion in 2016 to GHS 4.2 billion in 2017, which is significantly lower compared to the growth of 47% achieved 2016. This is largely attributable to the decline in yields of government securities in 2017.
Fee and commission income for 2017 for the industry grew by 10% to GHS 1.37 billion, from GHS 1.25 billion in 2016. This is attributed to the spike in trading activities backed by Ghana’s economic growth over the period. Expenses relating to fees and commission income did not experience the rapid increase
as in prior year and only went up by 23% in 2017 compared with the 31% in 2016. This may be an outcome of bold negotiations to lower charges for services from investment banks.
Even though the industry experienced an averagely slow growth in its interest income, the relatively stronger performance from investment income, trading income and fee and commissions combined with a notable slowdown in interest expense growth (also due to falling interest rates) improved profitability in Ghana’s banking industry.
CAL recovered from an 8% fall in total income in 2016 and recorded a 25% upsurge in total income to GHS446.3 million in 2017. The bank’s improvement in interest income from loans and advances has been guided by a strategy which focused on extending credit support to individuals and businesses operating in economic sectors with high growth opportunities. Aside the upgrade of its core banking application which led to improvements in some of its revenue components, the bank’s performance can also be attributed to cost management and operational efficiency. Overall, CAL managed to control and keep its interest expense and operating costs relatively stable.
FBL reported a profit before tax after of GHS135.4 million in comparison with the performance of GHS18.6 million in 2016. Together with its moderate growth in total income, the improvement is an outcome of a reduction in the impairment to financial assets in 2017 and relatively stable operating and interest expenses over the period.
In 2017, ADB recovered from a loss of GHS105.7 million in 2016 and posted a profit before tax of GHS47.3 million. The significant growth of income from both cash and short-term funds as well as interest from investments securities
contributed to profitability. Additionally, having absorbed significant impairment charges relating to non-performing loans in 2016, the impairment charges in 2017 was significantly lower, and had a favourable impact on operations.
UMB’s profit before tax increased from GHS27.5 million in 2016 to GHS68.5 million in 2017. Despite recording more than 100% increase in impairment on financial assets in 2017, UMB grew its net interest income from GHS143.1 million in 2016 to GHS214.4 million in 2017. This was achieved from its investment held in placements and investment securities.
FBN’s profit improvement is largely attributable to the steep decline in impairment charges, which decreased by 91% to 1.7 million in 2017. This culminated in a significant cost reduction. The bank’s profit before tax increased from GHS4.4 million in 2016 to GHS18.2 million in 2017.
ABG’s profitability fell by almost 30%, from GHS41.9 million in 2016 to GHS 29.5 million in 2017. This is attributable to an increase in other operating expenses, in particular, administrative expenses. Other operating expenses increased by 21.3% to GHS91.1 million in 2017. However, operating income declined by 0.8% to GHS270.3 million, because of a 50% drop in commissions and fees and only 8.1% increase in net interest income. The bank appeared to have slowed down on advancing new loans, whilst intensifying recovery efforts, leading to a significant decline in interest income from loan and advances.

2018 Ghana Banking Survey 68PwC
Profitability and efficiency7 Profitability and efficiency7
Net interest margin
2017 R 2016 R 2015 R 2014 R 2013 R
UBA 16.8% 1 12.3% 6 8.2% 19 9.4% 12 13.8% 5
BOB 12.7% 2 12.4% 5 12.1% 6 13.3% 4 13.9% 4
GCB 12.6% 3 16.6% 2 16.5% 2 15.7% 2 14.5% 3
OBL 11.9% 4 17.7% 1 - - - - - -
SCB 11.6% 5 11.9% 7 10.9% 7 10.3% 11 10.4% 10
BBGL 11.1% 6 10.4% 9 12.3% 5 11.8% 5 12.5% 6
TRB 11.0% 7 8.3% 17 8.9% 15 7.0% 22 23.2% 1
SG-GH 10.9% 8 8.9% 14 9.5% 14 10.8% 7 9.4% 14
ADB 10.7% 9 7.1% 24 8.4% 18 11.0% 6 11.4% 7
FBN 10.5% 10 10.5% 8 12.7% 4 13.5% 3 10.6% 8
FNB 10.3% 11 13.9% 3 18.2% 1 - - - -
UMB 9.7% 12 6.8% 26 14.0% 3 - - - -
EBG 9.3% 13 9.6% 12 10.9% 8 10.5% 8 9.6% 13
CAL 9.1% 14 7.1% 23 8.0% 23 8.5% 16 10.5% 9
GTB 8.9% 15 9.2% 13 7.8% 24 8.7% 14 8.6% 17
ZBL 8.7% 16 8.8% 15 9.8% 11 10.5% 9 9.2% 16
FBL 8.6% 17 8.6% 16 10.4% 10 7.9% 17 7.8% 19
PBL 8.6% 18 7.8% 20 8.1% 21 8.6% 15 8.5% 18
RBL 8.5% 19 7.0% 25 9.5% 12 10.3% 10 9.8% 12
SBG 8.3% 20 7.3% 22 8.7% 16 7.7% 18 7.0% 21
ABG 7.6% 21 7.8% 19 8.5% 17 9.1% 13 10.1% 11
PRB 6.9% 22 5.1% 29 - - - - - -
BSIC 6.4% 23 7.7% 21 8.1% 22 7.3% 21 9.3% 15
FABL 5.9% 24 7.9% 18 7.2% 25 6.0% 24 7.4% 20
BOA 5.8% 25 9.8% 11 8.2% 20 7.4% 20 5.4% 24
ECB 5.6% 26 5.5% 28 4.9% 26 4.7% 27 6.5% 22
TCB 3.6% 27 0.0% - - - - - - -
SBL - - 13.3% 4 - - - - - -
GNB - - 10.4% 10 9.5% 13 18.3% 1 - -
UGL - - 6.3% 27 4.6% 27 5.1% 25 4.8% 26
NIB - - - - 10.4% 9 7.6% 19 5.3% 25
CBG - - - - - - 6.9% 23 16.3% 2
UTB - - - - - - 4.9% 26 6.2% 23
Industry 9.4% 9.2% 9.8% 9.7% 9.7%
2018 Ghana Banking Survey 69PwC
Profitability and efficiency7 Profitability and efficiency7
The industry’s net interest margin (NIM) increased from 9.2% in 2016 to 9.4% in 2017 despite the decline in industry’s interest income by 2% to GHS10.2 billion in 2017. The decline in interest income was more than compensated by a 14% drop in interest expense to GHS3.7 billion in 2017 to drive up NIM. Whilst the general slowdown in advances by banks has largely resulted in the decrease of interest income, the decline in interest rates offered by banks on deposits also drove down interest expense. The downward trend in interest on deposits was mainly influenced by the decline in interest rates on money market instruments as these usually form benchmarks for pricing term deposits.
Interest income from cash and short term funds increased by 16% to GHS1.0 billion in 2017 but significantly lower than the 99% increase recorded in 2016. Similarly, interest income from investment securities increased by 16% to GHS4.3 billion in 2017, which is significantly lower than the 47% increase recorded in 2016. In a sharp contrast, interest from loans and advances decreased by 16% to GHS4.9 billion in 2017, underperforming the increase of 8% growth achieved in 2016.
UBA and ADB recorded significant improvements in their NIMs but GCB and BOA posted significant deterioration in their NIMs in 2017 compared to 2016.
UBA’s NIM improved from 12.3% in 2016 to 16.8% in 2017 due to a 19% increase in net interest income. The combined effect of a drop in deposits and the downward trend in interest on term deposits in 2017 resulted in a 44% decline in interest expense. A 6% drop in interest income arising from the 40% contraction of the loan book did not erode the net interest margin because of the significant drop in interest expense.
ADB’s NIM also improved from 7.1% in 2016 to 10.7% in 2017 as a result of a 59% increase in net interest income, which was a stronger return from a 17% growth
in total assets over the period. The net interest income growth was driven mainly by investments in government securities and bank placements as the bank slowed down on loans in 2017. The increase in total assets mainly reflect an increase in cash generated through deposits and borrowings.
The NIM of GCB declined from 16.6% in 2016 to 12.6% in 2017. This followed from a marked increase in interest in August 2017 through the assumption of legacy deposit liabilities from the defunct UT Bank and Capital Bank. In effect, a 1% increase in net interest income was insignificant compared to a 58% increase in total assets, leading to a worsened NIM in 2017. It is expected that with a full year’s operation of these assets assumed, the NIM will improve subsequently.
BOA’s NIM worsened from 9.8% in 2016 to 5.8% in 2017 following a 35% drop in net interest income. Total assets grew by 17% over the same period to push down the bank’s NIM. The decline in NIM was substantially driven by the downward trend in interest rates of money market instruments as the bank held significant amount of funds in investment securities.

2018 Ghana Banking Survey 70PwC
Profitability and efficiency7 Profitability and efficiency7
Cost income ratio
2017 R 2016 R 2015 R 2014 R 2013 R
BOB 0.14 1 0.13 1 0.14 1 0.14 1 0.12 1
UBA 0.33 2 0.31 2 0.41 3 0.31 2 0.27 2
BBGL 0.36 3 0.40 4 0.43 4 0.45 8 0.42 7
SCB 0.38 4 0.31 3 0.44 5 0.41 4 0.32 3
ZBL 0.39 5 0.40 5 0.44 7 0.41 5 0.41 5
CAL 0.41 6 0.41 6 0.39 2 0.35 3 0.34 4
GTB 0.45 7 0.44 7 0.50 11 0.44 7 0.41 6
SBG 0.46 8 0.51 9 0.53 14 0.46 9 0.44 9
EBG 0.52 9 0.47 8 0.44 6 0.47 10 0.46 10
SG-GH 0.57 10 0.60 13 0.62 18 0.55 14 0.60 17
FBL 0.60 11 0.59 12 0.53 15 0.58 17 0.60 16
ABG 0.63 12 0.54 10 0.51 12 0.42 6 0.44 8
BOA 0.66 13 0.68 17 0.49 9 0.57 16 0.72 24
UMB 0.66 14 0.80 20 0.53 13 - - - -
GCB 0.68 15 0.55 11 0.49 10 0.51 12 0.47 13
TRB 0.70 16 0.88 23 0.90 24 1.16 27 0.66 21
FBN 0.72 17 0.64 15 0.47 8 0.53 13 0.46 12
RBL 0.73 18 0.93 24 0.74 23 0.55 15 0.49 14
FABL 0.76 19 0.62 14 0.60 17 0.60 18 0.66 19
ADB 0.76 20 1.01 25 0.96 25 0.72 21 0.58 15
PBL 0.77 21 0.81 21 0.71 21 0.67 19 0.64 18
BSIC 0.79 22 0.71 18 0.63 19 0.74 23 0.80 26
ECB 0.81 23 0.75 19 0.66 20 0.93 26 0.66 20
OBL 1.01 24 1.26 28 - - - - - -
PRB 1.05 25 0.86 22 - - - - - -
FNB 1.82 26 1.26 27 1.21 27 - - - -
TCB 6.09 27 - - - - - - - -
NIB - - - - 0.53 16 0.49 11 0.46 11
UGL - - 0.64 16 0.73 22 0.72 22 0.71 23
GNB - - 1.08 26 1.06 26 0.93 25 - -
SBL - - 1.31 29 - - - - - -
UTB - - - - - - 0.70 20 0.70 22
CBG - - - - - - 0.91 24 0.76 25
Industry 0.54 0.54 0.53 0.51 0.47

2018 Ghana Banking Survey 71PwC
Profitability and efficiency7 Profitability and efficiency7
Total operating expenses (excluding impairment charges) and total income increased by 6% respectively to GHS5.0 billion and GHS9.1 billion in 2017, leaving the cost to income ratio unchanged at 0.54 in 2017.
Although the overall industry average has remained fairly stable over the last two years, the cost efficiency worsened for some banks, whilst others recorded improvements resulting from either cost control and reduction achieved or increased profits or a combination of both. The cost to income ratios for GCB, PRB and FNB notably worsened in 2017, whilst those of RBL and ADB reflected improvements.
GCB’s cost efficiency deteriorated to 0.68 in 2017, from 0.55 in 2016. This is largely attributable to the related costs commitments arising from the assumption of the defunct banks.
PRB’s cost efficiency worsened from 0.86 in 2016 to 1.05 in 2017. This is because the bank was unable to generate sufficient income to cover its operating costs. Whilst operating expenses more than doubled in 2017 despite the 92% growth in operating income over the same period. The bank may be experiencing restructuring costs relating to its transformation from a non-bank financial institution to a bank. In its first full year of operations as a bank, it has incurred significant expense relating to the increase in staff numbers. These structural transformation costs which include marketing and administration expense are normal as PRB is at the stage of establishing visibility and brand presence.
FABL’s cost efficiency worsened from 0.62 in 2016 to 0.76 in 2017. This is mainly due to a combination of 18.4% drop in net interest income and 22.6% drop in fees and commissions. The 5.6% increase in operating expenses contributed to further depress its cost efficiency. The decrease in net interest income was driven mainly by the
bank’s deposit drive, which resulted in a 32.2% growth in customer deposits which in turn drove up interest expense on deposits by 52.1%. The drop in fees and commissions is an outcome of the contraction in the bank’s loan book which accounts for a 44.5% decrease in loan related fees in 2017.
RBL’s cost efficiency improved from 0.93 in 2016 to 0.73 in 2017. The prudent investment and cost management effort in 2017 appear to have yielded results. This resulted in 20.2% increase in operating income, which combined with a 5.6% decline in operating expenses to improve the bank’s cost to income ratio in 2017.
ADB’s cost efficiency improved from unfavourable erosion of its income in 2016 to 0.76 in 2017. This is attributable to interest earnings from investment securities and bank placements in 2017. The bank channelled funds into government securities and bank placements whilst slowing down on advancing new loans in a bid to improve asset quality. Consequently, whilst there was no change in interest from loans, overall, operating income increased by 46.2% because of the strong interest earnings from investment securities and placements. The 10.6% increase in operating expenses did not erode the strong gains achieved.

2018 Ghana Banking Survey 72PwC
Return to shareholders8
Return on Equity The industry’s Return on Equity (ROE) recovered from the decline to 17.1% in 2016 and posted a more favourable return of 19.7% in 2017. This resulted mainly from stronger profit performance in 2017 compared to 2016. Net profits for the industry increased by 29.3% to GHS2.3 billion in 2017, driven mainly by a 39% decrease in impairment expense to GHS841.8 million in 2017. Most banks appear to have accelerated their impairment charges in 2016, leading to a much lower impact of impairments on net profits in 2017.
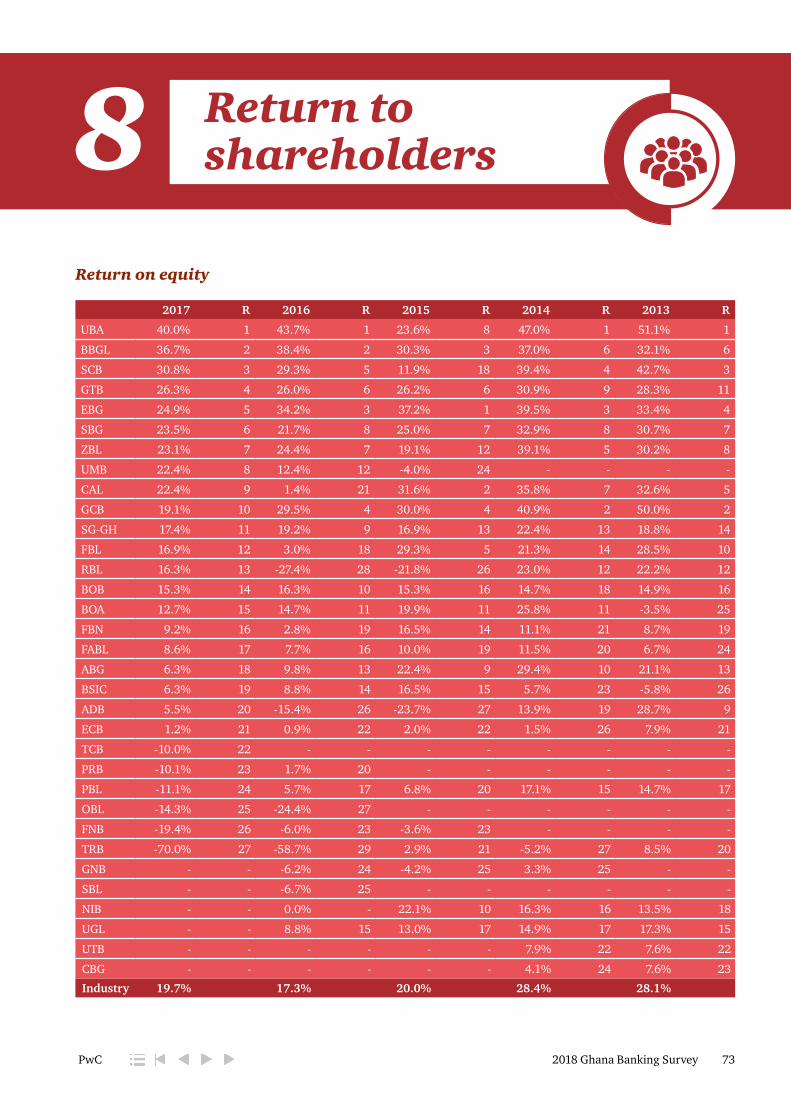
2018 Ghana Banking Survey 73PwC
Return to shareholders8
Return on equity
2017 R 2016 R 2015 R 2014 R 2013 R
UBA 40.0% 1 43.7% 1 23.6% 8 47.0% 1 51.1% 1
BBGL 36.7% 2 38.4% 2 30.3% 3 37.0% 6 32.1% 6
SCB 30.8% 3 29.3% 5 11.9% 18 39.4% 4 42.7% 3
GTB 26.3% 4 26.0% 6 26.2% 6 30.9% 9 28.3% 11
EBG 24.9% 5 34.2% 3 37.2% 1 39.5% 3 33.4% 4
SBG 23.5% 6 21.7% 8 25.0% 7 32.9% 8 30.7% 7
ZBL 23.1% 7 24.4% 7 19.1% 12 39.1% 5 30.2% 8
UMB 22.4% 8 12.4% 12 -4.0% 24 - - - -
CAL 22.4% 9 1.4% 21 31.6% 2 35.8% 7 32.6% 5
GCB 19.1% 10 29.5% 4 30.0% 4 40.9% 2 50.0% 2
SG-GH 17.4% 11 19.2% 9 16.9% 13 22.4% 13 18.8% 14
FBL 16.9% 12 3.0% 18 29.3% 5 21.3% 14 28.5% 10
RBL 16.3% 13 -27.4% 28 -21.8% 26 23.0% 12 22.2% 12
BOB 15.3% 14 16.3% 10 15.3% 16 14.7% 18 14.9% 16
BOA 12.7% 15 14.7% 11 19.9% 11 25.8% 11 -3.5% 25
FBN 9.2% 16 2.8% 19 16.5% 14 11.1% 21 8.7% 19
FABL 8.6% 17 7.7% 16 10.0% 19 11.5% 20 6.7% 24
ABG 6.3% 18 9.8% 13 22.4% 9 29.4% 10 21.1% 13
BSIC 6.3% 19 8.8% 14 16.5% 15 5.7% 23 -5.8% 26
ADB 5.5% 20 -15.4% 26 -23.7% 27 13.9% 19 28.7% 9
ECB 1.2% 21 0.9% 22 2.0% 22 1.5% 26 7.9% 21
TCB -10.0% 22 - - - - - - - -
PRB -10.1% 23 1.7% 20 - - - - - -
PBL -11.1% 24 5.7% 17 6.8% 20 17.1% 15 14.7% 17
OBL -14.3% 25 -24.4% 27 - - - - - -
FNB -19.4% 26 -6.0% 23 -3.6% 23 - - - -
TRB -70.0% 27 -58.7% 29 2.9% 21 -5.2% 27 8.5% 20
GNB - - -6.2% 24 -4.2% 25 3.3% 25 - -
SBL - - -6.7% 25 - - - - - -
NIB - - 0.0% - 22.1% 10 16.3% 16 13.5% 18
UGL - - 8.8% 15 13.0% 17 14.9% 17 17.3% 15
UTB - - - - - - 7.9% 22 7.6% 22
CBG - - - - - - 4.1% 24 7.6% 23
Industry 19.7% 17.3% 20.0% 28.4% 28.1%

2018 Ghana Banking Survey 74PwC
Return to shareholders8 Return to shareholders8
By way of rights issue and deposits towards capital an additional GHS312.7 million was injected into the industry. Other key changes in the industry’s equity is attributable to earnings of GHS2.3 billion retained in 2017. In comparison with the prior year, the industry is experiencing a higher retention in 2017 because of Bank of Ghana’s directive for all banks to increase their minimum capital requirements from GHS120 million to GHS400 million by December 2018. Only GCB and FBL recommended dividends of GHS0.1 and GHS0.7 per share, which works out to approximate total amount of GHS44.2 million for the industry in 2017, and represents an earnings retention of 98.0% compared to the total net profit of GHS2.3 billion in 2017.
UBA experienced a marginal decline in ROE from 43.7% in 2017 to 40.0% in 2017 but posted the industry’s highest ROE of 52.2%. The improved profit performance of GHS219.3 million is an outcome of significant loan recoveries made in 2017, which depressed the impairment expense. Another contributory factor is the significant dip in interest expense resulting from the liquidation of some high profile deposits in 2017 under the Treasury Single Account. The 66% growth in shareholders’ funds arising largely from earnings retained contributed to the marginal dilution of the ROE.
EBG posted a decline in profit by 27% from GHS326 million to GHS255 million. The decline in performance resulted from a 7% decrease in interest income, coupled with the accelerated recognition of impairment charges of GHS174 million arising from legacy energy sector loans. The above factors combined to push the bank’s ROE to 24.9% in 2017 from 34.2% in 2016.
GCB experienced a dip in its ROE to 19.1% in 2017, down from 29.5% in 2016. This is mainly attributable to a 29% decrease in profits to GHS213 million
in 2017, resulting from an upsurge in interest expense unmatched by the increase in interest income. This follows the assumption of all the deposits of the defunct banks.
CAL Bank experienced the most significant improvement in ROE from 1.4% in 2016 to 22.4% in 2017. The bank posted a significant increase in net profits from GHS7.2 million in 2016 to GHS145.2 million in 2017. This is attributable to 39% growth in net interest income to GHS345.2 million in 2017. The aggressive cleanup of the loan book undertaken in 2016 begins to yield results because of the lower impairment charge of GHS54.9 million, a drop by 72.4% from prior year. The bank’s acceleration of impairment charges in 2016 has resulted in a lower expense in 2017. Also, its commitment to improve some revenue lines, manage costs and enhance operational efficiency through its digitisation transformation agenda appear to have paid off in 2017.
FBL’s ROE improved from 3.0% in 2016 to 16.9% in 2017. With shareholders’ funds growing by only 8.3% to GHS534.2 million as at end of 2017, the bank achieved a 5-fold increase in net profits to GHS90.4 million in 2017. The bank’s improved profitability is the result from a 58.2% decrease in impairment expense to GHS71.4 million in 2017 following an acceleration of impairment charges of GHS 170.7 million in 2016.
RBL’s ROE improved from -27.4% in 2016 to 16.3% in 2017. The bank’s shareholders injected additional capital of GHS50 million in 2017 and recovered from a net loss of GHS39 million in 2016 to post a net profit of GHS37 million in 2017. The bank’s improved profit performance comes on the back of strong loan recoveries, aggressive deposit drive, cost management and prudent investments made in 2017.
ADB recovered from an unfavourable ROE of -15.4% in 2016 to 5.5% in 2017.
The operating results improved from a net loss of GHS70million in 2016 to post a net profit of GHS26.5 million in 2017. Similar to other banks, the bank’s aggressive impairment charge in 2016 of GHS104.0 million coupled with a slowdown in advancing new loans in 2017, led to a much lower impairment expense of GHS49.8 million in 2017. This combined with the 66.8% increase in net interest income to GHS305.2 million in 2017 to improve the ROE in 2017.
PRB’s ROE dropped from 1.7% in 2016 to -10.1% in 2017 as the bank’s profitability worsened from a net profit of GHS2.2 million in 2016 to a net loss of GHS11.9 million in 2017. Having only secured a banking license in December 2016 to convert from a non-bank financial institution to a bank, the enforcement of more stringent banking regulations may have taken its toll on the banks operations. Also at this stage of its transformation, such expenses relating to strengthening the bank’s systems and human capital base are necessary to enable it compete effectively.
TCB commenced business as a Bank in May 2017 and is yet to establish its market presence. It recorded a ROE of -10.0% in 2017 after posting a net loss of GHS11.2 million in 2017.

2018 Ghana Banking Survey 75PwC
Return to shareholders8 Return to shareholders8
Return on Assets
A general slowdown in advancing new loans, and intensified recovery efforts led to only 6.5% growth in total assets in 2017 compared to the growth of 25.5% achieved in 2016. Together with a 29.3% increase in the industry’s net profits, industry’s Return on Assets (ROA) improved from 2.3% in 2016 to 2.8% in 2017.

2018 Ghana Banking Survey 76PwC
Return to shareholders8 Return to shareholders8
Return on assets
2017 R 2016 R 2015 R 2014 R 2013 R
UBA 7.4% 1 3.8% 8 2.6% 14 5.4% 6 5.8% 6
BOB 6.6% 2 7.9% 1 6.8% 1 7.6% 1 8.5% 1
BBGL 6.5% 3 5.8% 2 4.9% 4 6.0% 3 6.2% 4
SCB 5.9% 4 5.1% 3 2.0% 17 0.0% 26 7.0% 2
GTB 4.7% 5 4.8% 5 4.5% 7 5.4% 5 5.6% 7
SBG 4.1% 6 2.8% 9 3.1% 12 4.1% 11 3.7% 13
ZBL 3.7% 7 4.1% 6 3.3% 11 4.5% 9 3.8% 11
CAL 3.4% 8 0.2% 21 4.8% 5 5.2% 7 5.9% 5
SG-GH 3.2% 9 2.6% 10 2.2% 16 3.0% 15 3.0% 16
EBG 2.8% 10 4.1% 7 5.0% 3 5.5% 4 4.0% 10
GCB 2.2% 11 4.9% 4 5.3% 2 6.4% 2 6.6% 3
FBN 2.1% 12 0.6% 17 4.1% 8 3.0% 14 2.5% 18
BOA 1.8% 13 2.1% 11 2.4% 15 3.1% 13 -0.5% 25
RBL 1.8% 14 -2.1% 24 -2.5% 25 4.1% 10 3.7% 12
FBL 1.7% 15 0.4% 19 3.6% 9 2.7% 16 2.6% 17
UMB 1.6% 16 0.7% 15 -0.4% 23 - - - -
BSIC 1.2% 17 1.8% 12 3.0% 13 1.2% 20 -2.0% 26
FABL 1.2% 18 1.1% 14 1.3% 18 1.2% 21 1.3% 22
ABG 0.9% 19 1.6% 13 3.3% 10 5.0% 8 4.6% 9
ADB 0.7% 20 -2.3% 26 -3.7% 27 2.2% 17 5.0% 8
ECB 0.2% 21 0.2% 22 0.4% 21 0.3% 25 2.3% 19
PRB -0.9% 22 0.2% 20 - - - - - -
PBL -1.2% 23 0.5% 18 0.7% 20 1.7% 18 1.7% 21
OBL -2.2% 24 -5.8% 29 - - - - - -
TRB -4.0% 25 -3.5% 28 0.3% 22 -1.2% 27 3.3% 14
TCB -9.2% 26 - - - - - - - -
FNB -10.2% 27 -2.9% 27 -3.2% 26 - - - -
GNB - - -1.0% 23 -1.0% 24 0.9% 22 - -
SBL - - -2.2% 25 - - - - - -
UGL - - 0.7% 16 1.0% 19 1.5% 19 2.0% 20
NIB - - - - 4.5% 6 3.4% 12 3.2% 15
UTB - - - - - - 0.7% 23 0.7% 24
CBG - - - - - - 0.4% 24 1.1% 23
Industry 2.8% 2.3% 2.9% 4.1% 4.3%

2018 Ghana Banking Survey 77PwC
Return to shareholders8 Return to shareholders8
UBA’s ROA improved from 3.8% in 2016 to 7.8% in 2017 achieved through a 52.2% increase in net profits despite the contraction in total assets. The implementation of the TSA led to the liquidation of high profile deposits and resulted in 20.8% decline in total assets to GHS3.0 billion as at end of 2017.
CAL also improved its ROA from 0.2% in 2016 to 3.4% in 2017. The bank grew its total assets by 17% but achieved a 19-fold growth in net profits from GHS7.2 million to GHS145.2 million in 2017. The growth in total assets was partly funded from a 62.7% growth in borrowings to GH¢931.8 million as at end of 2017. The bank deepened credit support to high growth business opportunities.
ADB recorded a ROA of 0.7% in 2017, up from the deficit of-2.3% in 2016. This reflects the significant turnaround in operating results from a net loss of GHS70 million in 2016 to a net profit of GHS26.5 million in 2017 and 16.8% growth in total assets to GHS3.5 billion as at end of 2017. The growth in total assets was primarily funded by deposits, which increased by 18.3% to GHS2.5 billion, complimented by 20.4% growth in borrowings to GHS458.6 million as at end of 2017. The bank’s ROA still lags behind the industry’s average.
RBL’s ROA improved from -2.1% in 2016 to 1.8% in 2017. Although the bank’s total assets grew by 12.0% to GHS2.1 billion as at end of 2017, it recovered from a net loss of GHS38.6 million in 2016 to post a net profit of GHS36.9 million in 2017. The growth in total assets reflects the significant non-pledged government securities held as the bank slowed down on growing its loan book. This was funded primarily through aggressive customer deposit mobilisation, which saw deposits grow by 9.9% to GHS1.7 billion as at end of 2017.
FNB’s ROA worsened from -2.9% in 2016 to -10.2% in 2017 because its loss position dropped further from GHS8.2 million in 2016 to a loss of GHS26.6
million in 2017. The bank held significant amount of government securities as at the beginning of 2017. However, the decline in yield from these securities combined with an increase in operating expenses related to its expansion depressed profitability further. The liquidation of treasury bill investments held in 2017 led to a decline in total assets by 8.3% to GHS260.3 million and ‘cushioned’ the ROA from further dilution as at end of 2017.
TCB, having commenced business in May 2017, posted an ROA of -9.2% in 2017. As already noted, the bank under recovered cost incurred to strengthen systems and put structures in place to enable it fully compete in its new environment.
There is a growing need from shareholders for Banks to sustain the improved profitability. The banks seeking injection of fresh capital and those relying on internally generated funding may have to consider viable deployment of these funds because with the steady decline, yield from government securities cannot be relied upon to sustain appreciable return on assets.

2018 Ghana Banking Survey 78PwC
Liquidity analysis9Liquid funds to total interest bearing liabilitiesA bank’s liquid funds cover of total interest bearing liabilities indicates the bank’s ability to meet its obligations, including any interest on such liabilities, without incurring excessive costs or suffering reputational damages. The acceptable cover varies from bank to bank depending on the risk appetite
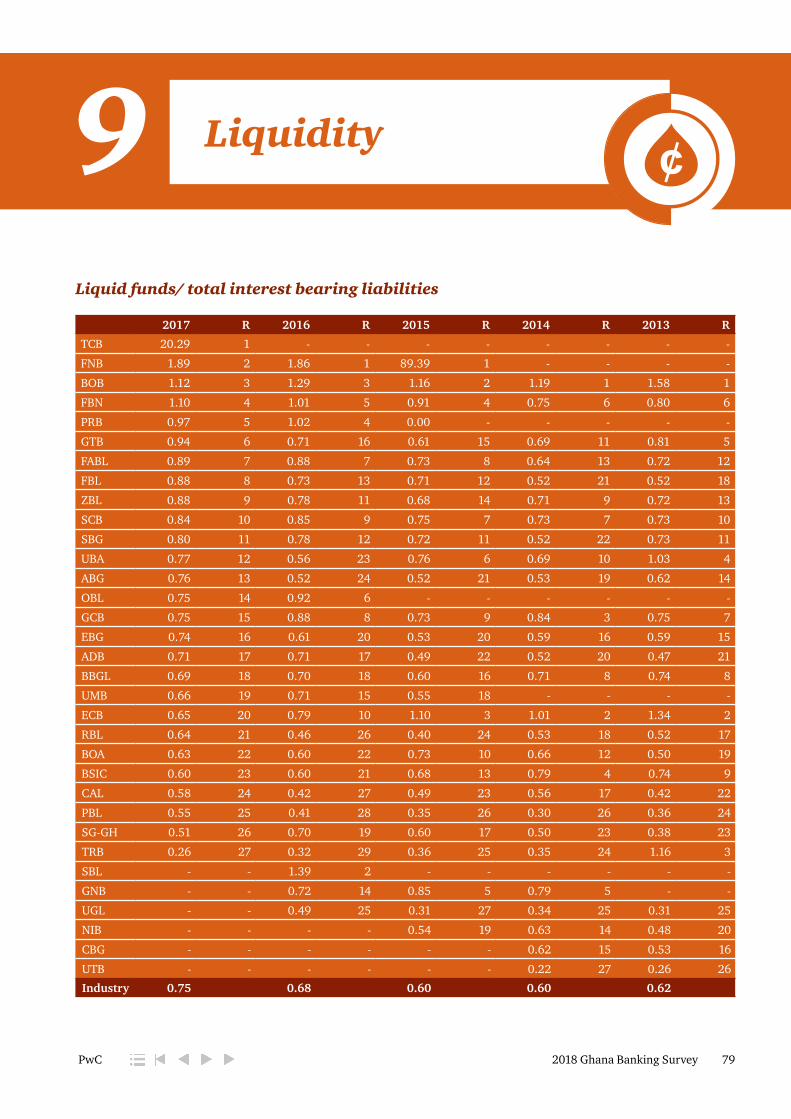
2018 Ghana Banking Survey 79PwC
Liquidity9Liquid funds/ total interest bearing liabilities
2017 R 2016 R 2015 R 2014 R 2013 R
TCB 20.29 1 - - - - - - - -
FNB 1.89 2 1.86 1 89.39 1 - - - -
BOB 1.12 3 1.29 3 1.16 2 1.19 1 1.58 1
FBN 1.10 4 1.01 5 0.91 4 0.75 6 0.80 6
PRB 0.97 5 1.02 4 0.00 - - - - -
GTB 0.94 6 0.71 16 0.61 15 0.69 11 0.81 5
FABL 0.89 7 0.88 7 0.73 8 0.64 13 0.72 12
FBL 0.88 8 0.73 13 0.71 12 0.52 21 0.52 18
ZBL 0.88 9 0.78 11 0.68 14 0.71 9 0.72 13
SCB 0.84 10 0.85 9 0.75 7 0.73 7 0.73 10
SBG 0.80 11 0.78 12 0.72 11 0.52 22 0.73 11
UBA 0.77 12 0.56 23 0.76 6 0.69 10 1.03 4
ABG 0.76 13 0.52 24 0.52 21 0.53 19 0.62 14
OBL 0.75 14 0.92 6 - - - - - -
GCB 0.75 15 0.88 8 0.73 9 0.84 3 0.75 7
EBG 0.74 16 0.61 20 0.53 20 0.59 16 0.59 15
ADB 0.71 17 0.71 17 0.49 22 0.52 20 0.47 21
BBGL 0.69 18 0.70 18 0.60 16 0.71 8 0.74 8
UMB 0.66 19 0.71 15 0.55 18 - - - -
ECB 0.65 20 0.79 10 1.10 3 1.01 2 1.34 2
RBL 0.64 21 0.46 26 0.40 24 0.53 18 0.52 17
BOA 0.63 22 0.60 22 0.73 10 0.66 12 0.50 19
BSIC 0.60 23 0.60 21 0.68 13 0.79 4 0.74 9
CAL 0.58 24 0.42 27 0.49 23 0.56 17 0.42 22
PBL 0.55 25 0.41 28 0.35 26 0.30 26 0.36 24
SG-GH 0.51 26 0.70 19 0.60 17 0.50 23 0.38 23
TRB 0.26 27 0.32 29 0.36 25 0.35 24 1.16 3
SBL - - 1.39 2 - - - - - -
GNB - - 0.72 14 0.85 5 0.79 5 - -
UGL - - 0.49 25 0.31 27 0.34 25 0.31 25
NIB - - - - 0.54 19 0.63 14 0.48 20
CBG - - - - - - 0.62 15 0.53 16
UTB - - - - - - 0.22 27 0.26 26
Industry 0.75 0.68 0.60 0.60 0.62
2018 Ghana Banking Survey 80PwC
Liquidity9 Liquidity9
ECB’s liquidity holding declined from 0.79 in 2016 to 0.65 in 2017 because it pledged 56% of its trading assets against its interbank borrowings. As a consequence, its liquid assets shrunk from GHS69 million to GHS53 million. The bank’s interest bearing liabilities on the other hand, grew by 6% to GHS301 million mainly from its deposit mobilisation.
With the collapse of seven banks so far, there is heightened market awareness on the ability of banks demonstrating sufficient liquidity to sustain their operations. A seemingly strong liquidity cover may adversely impact profitability as yield on government securities decline. Banks may pursue strategic lending opportunities to sustain profitability.
The industry’s liquid funds covering interest bearing liabilities improved from 0.68 in 2016 to 0.75 in 2017. This was driven by holdings in government securities and other liquid assets which together grew from GHS20.2 billion to GHS 27.6 billion in 2017. Banks are trending towards longer-dated government bonds due to the drop in yield from treasury bills and active trading on the Ghana Fixed Income Market. Government securities, including treasury and bonds, together constitute 51.5% of the total liquid funds as at end of 2017.
BOB and FBN hold sufficient liquid fund cover for their interest bearing liabilities. This may indicate the adoption of a conservative approach to the deployment of its resources because a significant portion of deposits mobilised are held in liquid assets. This strategy may tighten net interest margins and may not sustain profitability over time.
TCB was in the initial stages of operating as a bank and is yet to commence full-fledged lending activities. The proceeds from its initial capital was being held as cash and bank placements.
SG-GH during the year scaled down on its investment securities and deployed funds towards growing the loan book. Although the bank settled its indebtedness to the International Finance Corporation under existing borrowing arrangements, it was unable to restore its prior year’s stronger liquidity position.
GTB experienced a drop in its loan book from GHS627 million in 2016 to GHS396 million in 2017 and channeled the resources from customer deposits into investment securities. In that respect, liquid funds grew by 62.4% to GHS1.4 billion. The bank’s liquid funds cover of interest bearing liabilities strengthened from 0.71 to 0.94. To widen its net interest margin, GTB may consider pursuing lending opportunities because of the declining yield of money market securities.

2018 Ghana Banking Survey 81PwC
Liquidity9 Liquidity9
Liquid funds/ total deposits
2017 R 2016 R 2015 R 2014 R 2013 R
TCB 20.29 1 - - - - - - - -
PRB 2.43 2 1.63 2 - - - - - -
FNB 1.89 3 1.86 1 89.39 1 - - - -
BOB 1.34 4 1.45 3 1.48 2 1.19 1 1.58 2
FBN 1.10 5 1.01 6 0.91 5 1.13 2 1.03 7
FBL 1.03 6 0.81 15 0.79 9 0.60 20 0.55 21
ZBL 0.96 7 0.82 14 0.69 17 1.03 4 1.10 5
GTB 0.96 8 0.78 18 0.71 14 0.81 11 0.90 8
FABL 0.89 9 0.89 10 0.80 8 1.00 6 1.23 4
OBL 0.88 10 0.99 8 - - - - - -
ABG 0.87 11 0.57 25 0.55 23 0.56 21 0.63 17
UBA 0.87 12 0.62 23 0.76 11 0.69 17 1.03 6
UMB 0.86 13 1.09 5 0.65 18 - - - -
SCB 0.86 14 0.87 11 0.75 12 0.76 13 0.76 10
GCB 0.85 15 0.99 7 0.77 10 0.89 9 0.78 9
ADB 0.84 16 0.83 12 0.57 22 0.62 19 0.57 20
SBG 0.83 17 0.81 16 0.73 13 0.52 22 0.74 14
CAL 0.79 18 0.52 27 0.84 7 0.90 8 0.62 19
BOA 0.79 19 0.82 13 1.00 4 0.90 7 0.63 16
EBG 0.76 20 0.63 22 0.57 21 0.62 18 0.62 18
PBL 0.70 21 0.45 29 0.39 26 0.33 26 0.37 24
BBGL 0.69 22 0.70 21 0.60 19 0.71 15 0.74 13
RBL 0.66 23 0.49 28 0.55 24 0.76 14 0.74 12
ECB 0.65 24 0.79 17 1.10 3 1.01 5 2.35 1
BSIC 0.60 25 0.60 24 0.70 15 0.82 10 0.74 15
SG-GH 0.53 26 0.77 19 0.70 16 0.50 23 0.38 23
TRB 0.41 27 0.55 26 0.52 25 0.45 24 1.40 3
SBL - - 1.39 4 - - - - - -
UGL - - 0.94 9 0.33 27 0.35 25 0.32 25
GNB - - 0.72 20 0.85 6 0.79 12 0.00 -
NIB - - - - 0.59 20 0.70 16 0.52 22
CBG - - - - - - 1.08 3 0.75 11
UTB - - - - - - 0.26 27 0.30 26
Industry 0.84 0.77 0.66 0.68 0.69

2018 Ghana Banking Survey 82PwC
Liquidity9 Liquidity9
Similar to the ratio of liquid funds to total interest bearing liabilities, the ratio of liquid funds cover of total deposits is increasingly becoming a key performance indicator for better customer appreciation of the security of their deposits.
The industry’s liquid funds to deposits inched up from 0.78 in 2016 to 0.84 in 2017. As noted earlier, banks deepened their holdings in government securities as they became more risk averse with lending. This resulted in a growth of 16.2% in liquid funds to GHS47.5 billion as at end of 2017. Deposits, on the other hand, grew by only 7.8% to GHS56.7 billion as at end of 2017, owing to a general customer appreciation of the security of deposits and competition from the mobile and fintech companies. According to BoG’s Payment Systems Statistics for 4th quarter of 2017, total mobile money deposits in float as at the end of 2017 amounted to GHS2.3 billion and represents a growth of 84.6% when compared with total deposits of GHS1.3 billion as at end of 2016. The total number of registered mobile money accounts also grew by 21.3% from 19.7 million accounts as at end of 2016 to 23.9 million accounts as at end of 2017.
The ratio for the banking industry has improved mainly as a result of a higher margin of growth in liquid funds compared to the growth in deposits over the period. ABG, GCB, CAL, RBL and SG-GH are amongst the key drivers of the industry’s liquid funds to deposits ratio in 2017.
ABG’s liquid funds cover of deposits increased from 0.57 in 2016 to 0.87 in 2017. Deposits grew by 15% to GHS2.3 billion as at end of 2017 and at the same time net loans declined by 31.7% to GHS877.7 million as at end of 2017. The deposits together with the funds that have not been deployed into loans were channeled into investment securities and cash and cash equivalents, hence the increase in liquid funds to deposit ratio in 2017.
2018 Ghana Banking Survey 83PwC
Liquidity9 Liquidity9
rates on investment securities. Banks’ ability to find a good balance between liquidity and profitability will be a critical success factor going forward.
GCB’s liquid funds cover of deposits dipped from 0.99 at end of 2016 to 0.88 as at end of 2017. This is attributable mainly to the assumption of legacy accounts (all deposits) from the defunct banks in November 2017. The dip indicates that the resultant growth of 62.5% in deposits to GHS7.0 billion as at end of 2017 was not backed by liquid assets.
CAL experienced growth in deposit cover from 0.52 in 2016 to 0.79 in 2017 as liquid funds grew by 62.0% to GHS2.0 billion as at end of 2017. CAL achieved only 5.8% growth in deposits to GHS2.5 billion as at end of 2017. However, cautious lending practices and ESLA bonds led to growth in liquid funds.
RBL also extended liquid funds cover of deposits to 0.66 in 2017 from 0.49 in 2016. It would appear that funds realised from capital injection, growth in deposits and loan recoveries in 2017 were channeled into liquid funds as the bank tightened its credit stance. Consequently, a 49.2% growth in liquid assets to GHS1.1 billion as at end of 2017 was unmatched by a 9.9% growth in deposits to GHS1.7 billion, leading to an extension in the liquid funds cover of total deposits.
SG-GH scaled down holding of investment securities by 23.1% to GHS1.11 billion. The resulting decline in liquid funds combined with the 11.2% growth in deposits and eroded the liquid funds available to cover deposits in 2017. Despite the erosion in funds cover, SG-GH achieved favourable operating results.
Notwithstanding how critical liquidity can be for an assessment of a bank’s survival, the expected highly capitalised regime is likely to pressurise banks to meet shareholder expectations regarding returns on their investment. Dumping funds into liquid assets at the expense of lending may not be sustainable considering the current slump in interest

2018 Ghana Banking Survey 84PwC
Asset quality analysis10
Ratio of impairment charge to gross loans and advances
The industry’s impairment charge to gross loans and advances has improved from 4.5% in 2016 to 3.0% in 2017, resulting mainly from a general tightening of banks’ credit stance in 2017 and conversion of energy sector debts to bonds. Indications are that, banks, generally concerned about their deteriorating asset quality, resorted to more stringent credit risk assessment practices, which led to a reduction in impairment charges for the industry.
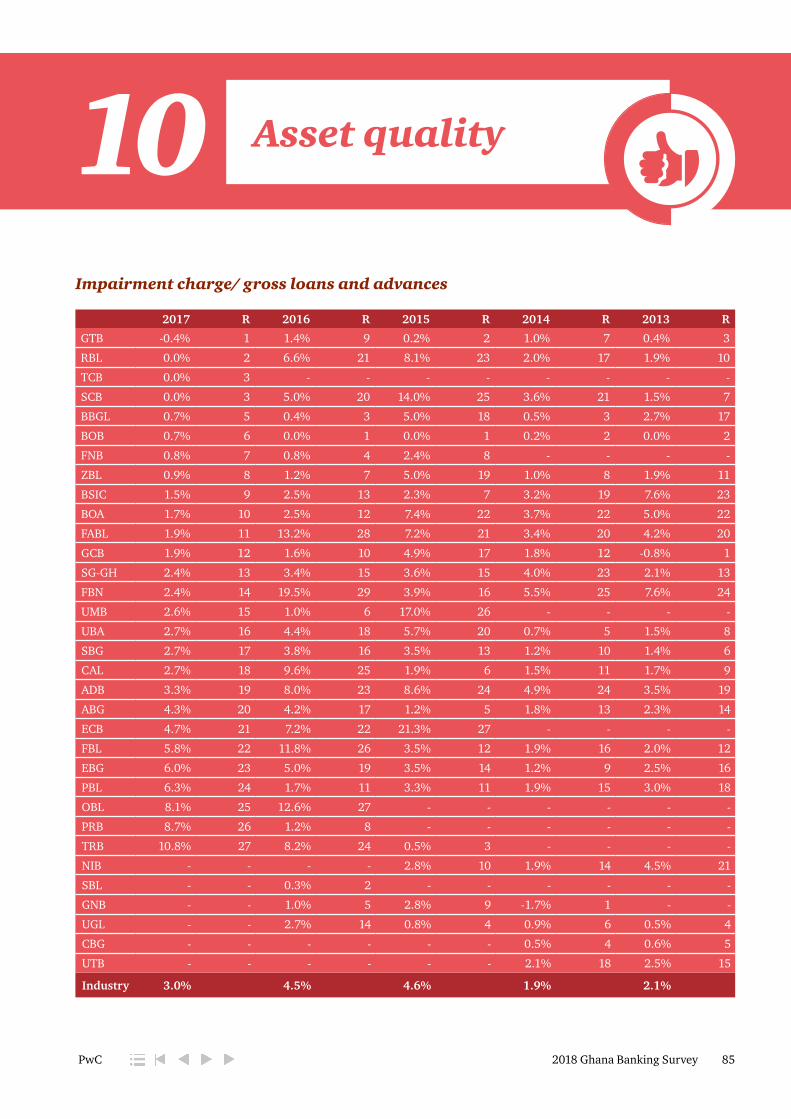
2018 Ghana Banking Survey 85PwC
Asset quality10Impairment charge/ gross loans and advances
2017 R 2016 R 2015 R 2014 R 2013 R
GTB -0.4% 1 1.4% 9 0.2% 2 1.0% 7 0.4% 3
RBL 0.0% 2 6.6% 21 8.1% 23 2.0% 17 1.9% 10
TCB 0.0% 3 - - - - - - - -
SCB 0.0% 3 5.0% 20 14.0% 25 3.6% 21 1.5% 7
BBGL 0.7% 5 0.4% 3 5.0% 18 0.5% 3 2.7% 17
BOB 0.7% 6 0.0% 1 0.0% 1 0.2% 2 0.0% 2
FNB 0.8% 7 0.8% 4 2.4% 8 - - - -
ZBL 0.9% 8 1.2% 7 5.0% 19 1.0% 8 1.9% 11
BSIC 1.5% 9 2.5% 13 2.3% 7 3.2% 19 7.6% 23
BOA 1.7% 10 2.5% 12 7.4% 22 3.7% 22 5.0% 22
FABL 1.9% 11 13.2% 28 7.2% 21 3.4% 20 4.2% 20
GCB 1.9% 12 1.6% 10 4.9% 17 1.8% 12 -0.8% 1
SG-GH 2.4% 13 3.4% 15 3.6% 15 4.0% 23 2.1% 13
FBN 2.4% 14 19.5% 29 3.9% 16 5.5% 25 7.6% 24
UMB 2.6% 15 1.0% 6 17.0% 26 - - - -
UBA 2.7% 16 4.4% 18 5.7% 20 0.7% 5 1.5% 8
SBG 2.7% 17 3.8% 16 3.5% 13 1.2% 10 1.4% 6
CAL 2.7% 18 9.6% 25 1.9% 6 1.5% 11 1.7% 9
ADB 3.3% 19 8.0% 23 8.6% 24 4.9% 24 3.5% 19
ABG 4.3% 20 4.2% 17 1.2% 5 1.8% 13 2.3% 14
ECB 4.7% 21 7.2% 22 21.3% 27 - - - -
FBL 5.8% 22 11.8% 26 3.5% 12 1.9% 16 2.0% 12
EBG 6.0% 23 5.0% 19 3.5% 14 1.2% 9 2.5% 16
PBL 6.3% 24 1.7% 11 3.3% 11 1.9% 15 3.0% 18
OBL 8.1% 25 12.6% 27 - - - - - -
PRB 8.7% 26 1.2% 8 - - - - - -
TRB 10.8% 27 8.2% 24 0.5% 3 - - - -
NIB - - - - 2.8% 10 1.9% 14 4.5% 21
SBL - - 0.3% 2 - - - - - -
GNB - - 1.0% 5 2.8% 9 -1.7% 1 - -
UGL - - 2.7% 14 0.8% 4 0.9% 6 0.5% 4
CBG - - - - - - 0.5% 4 0.6% 5
UTB - - - - - - 2.1% 18 2.5% 15
Industry 3.0% 4.5% 4.6% 1.9% 2.1%

2018 Ghana Banking Survey 86PwC
Asset quality10
charge by 72% from GHS199.2 million at end of 2016 to GHS54.9 million at end of 2017.
SCB experienced an improvement of the impairment of its loan book recognised during the year from 5.0% in 2016 to almost nil in 2017. This is as a result of continued monitoring and recovery of impaired defaulting loans, in particular, the conversion of the energy sector debts to ESLA bonds. Consequently, impairment charge dropped by 88% from GHS81.1 million in 2016 to GHS9.5 million in 2017, although gross loans increased by 6% from GHS1.6 billion at end of 2016 to GHS1.7 billion at end of 2017.
FBL also recorded improvement in its impairment charge recognised from 11.8% of the loan portfolio in 2016 to 5.8% in 2017. This follows loan recoveries made on the legacy debts through the conversion to ESLA bond. This largely accounted for a 58% decrease in impairment charge from GHS170.7 million in 2016 to GHS71.4 million in 2017. Gross loans also declined by 14% from GHS1.4 billion at end of 2016 to GHS1.2 billion at end of 2017.
ADB’s charge for defaulting loans improved from 8.0% of the loan book in 2016 to 3.3% in 2017 resulting mainly from the fact that the bank had recognised the impairment losses on a significant portion of its loans in 2016, and also slowed down on advancing new loans. Consequently, impairment charge decreased from GHS104.0 million in 2016 to GHS49.8 million in 2017, although there was a 14% rise in gross loans from GHS1.3 billion at end of 2016 to GHS1.4 billion at end of 2017.
PRB experienced a deterioration in quality of it loan book. The impairment charge to gross loans ratio worsened from 1.2% in 2016 to 8.7% in 2017 because impairment charges increased from GHS0.9 million in 2016 to GHS10.0 million in 2017. This may reflect the fact that barely a year after securing its
Of the banks surveyed, FBN, FABL, RBL, CAL, SCB, FBL and ADB recorded significant improvement in their ratio of impairment charges to gross loans in 2017 compared to 2016:
FBN’s impairment charge on loans reduced by 91% from GHS19.0 million in 2016 to GHS1.7 million in 2017, hence the impairment charge in relation to its loan book improved from 19.5% in 2016 to 2.4% in 2017. The bank made significant recoveries which accounts for 26% decline in gross loans and advances from GHS97.4 million as at end of 2016 to GHS72.4 million as at end of 2017.
FABL’s impairment charge to gross loans and advances improved from 13.2% in 2016 to 1.9% in 2017. This is attributable to a drop in the bank’s impairment charge from GHS37.2 billion in 2016 to GHS5.2 billion in 2017. The reduction in impairment charge reflects the bank’s resolve to focus efforts on recovering delinquent loans. In addition, the bank strengthened its credit risk management system as it adopted a more rigorous approach to advancing new loans.
RBL made significant progress on quality of its loan portfolio. The impairment charge to gross loans dropped from 6.6% in 2016 to nil. The bank focused on accounts monitoring to ensure performing loans are not deteriorating, whilst recovering delinquent loans. These measures adversely impacted the size of the loan book, which shrunk from GHS919.4 million as at end of 2016 to GHS809.7 million as at end of 2017. However, the bank’s impairment dropped from an expense of GHS69.8 million in 2016 to a net gain of GHS21 thousand in 2017.
CAL’s impairment charge in relation to its loan book reduced from 9.6% in 2016 to 2.7% in 2017. In combination with the aggressive provisioning undertaken in the prior year, and conversion of energy sector debts to ESLA bonds, the bank’s credit management systems has been successful in reducing impairment
2018 Ghana Banking Survey 87PwC
banking license, the inherent default in its loan book may begin to emerge as the bank applies the rigid prudential requirements.
PBL’s impairment charge to gross loans deteriorated from 1.7% in 2016 to 6.3% in 2017. Although impairment charges more than tripled from GHS17.4 million in 2016 to GHS67.1 million in 2017, the loan book only recorded a 1% increase to GHS925.8 million at end of 2017. The bank, like many others, is facing issues of default, the effect of which appear to have been accelerated in 2017 through impairment charges. The bank also appear to have slowed down on growing its loan book in line with the general trend in the industry.
TRB experienced a significant increase in impairment charges from GHS61.2 million in 2016 to GHS100.4 million in 2017 resulting in the worsened impairment charge to gross loans ratio. Indications are that the bank was more cautious with advancing new loans in 2017, as they channelled efforts into recovering defaulting loans. However, the bank’s gross loans grew by 24% from GHS747.4 million at end of 2016 to GHS927.3 million at end of 2017. Interest accumulated on existing facilities contributed to the growth. This may suggest a growing concern of interest default in the loan portfolio.
Overall, banks slowed down on advancing new loans in 2017, a situation that resulted mainly from concerns over defaults by borrowers. The banks appear to show greater effort to recover existing loans. A risk averse approach to lending may ease the increasing rate of defaults but this should be backed by strong credit underwriting practices.
Asset quality10
2018 Ghana Banking Survey 88PwC
Asset quality10
Ratio of impairment allowance to gross loans and advancesThe industry’s impairment allowance to gross loans and advances deteriorated further from 8.6% at end of 2016 to 10.7% as at end of 2017, notwithstanding the measures taken by banks to improve asset quality in 2017. Banks generally adopted more cautious approach to lending, whilst intensifying recovery efforts in a bid to improve asset quality. The high interest rate regime is seen by customers as a contributing factor to the rising defaults on loans and advances.

2018 Ghana Banking Survey 89PwC
Impairment allowance/ gross loans and advances
2017 R 2016 R 2015 R 2014 R 2013 R
TCB 0.0% 1 - - - - - - - -
FNB 1.1% 2 1.8% 4 2.4% 4 - - - -
BOA 1.3% 3 1.6% 3 2.6% 5 3.7% 12 10.0% 18
BOB 1.4% 4 1.0% 2 2.9% 6 1.2% 2 - -
BBGL 3.3% 5 6.8% 13 8.7% 17 6.3% 18 8.3% 17
GTB 4.8% 6 4.0% 8 3.0% 7 5.6% 14 7.3% 16
SBG 5.4% 7 6.8% 14 5.5% 12 3.0% 11 3.3% 4
ZBL 6.1% 8 9.7% 20 9.6% 18 4.4% 13 5.4% 11
UMB 6.9% 9 4.6% 11 5.9% 13 - - - -
EBG 7.4% 10 2.4% 5 4.9% 11 2.4% 7 4.2% 8
CAL 7.7% 11 4.9% 12 3.3% 8 1.6% 3 3.8% 5
ABG 7.7% 12 3.9% 7 1.7% 2 2.6% 10 2.6% 3
FBN 7.9% 13 4.4% 10 6.3% 14 2.4% 8 18.9% 22
FABL 8.4% 14 18.2% 27 11.4% 20 11.8% 24 17.7% 21
GCB 10.2% 15 14.5% 24 11.0% 19 8.7% 21 10.7% 19
BSIC 11.6% 16 9.6% 19 16.4% 24 25.5% 25 24.8% 23
OBL 12.6% 17 14.3% 23 - - - - - -
SG-GH 13.6% 18 17.8% 26 14.0% 22 9.4% 22 5.5% 12
PBL 13.7% 19 8.1% 16 6.9% 15 6.2% 17 7.3% 15
UBA 13.8% 20 7.2% 15 6.9% 16 2.3% 6 3.9% 6
RBL 14.8% 21 13.3% 22 12.1% 21 5.8% 16 5.0% 10
FBL 16.3% 22 9.1% 18 4.2% 9 2.5% 9 4.9% 9
TRB 17.7% 23 8.6% 17 0.5% 1 - - - -
ECB 18.4% 24 15.0% 25 21.3% 26 - - - -
SCB 20.5% 25 21.9% 28 19.9% 25 6.6% 19 4.0% 7
PRB 21.9% 26 10.4% 21 0.0% - - - - -
ADB 23.6% 27 23.1% 29 15.4% 23 7.7% 20 5.9% 13
NIB - - - - 21.5% 27 10.5% 23 14.5% 20
SBL - - 0.3% 1 - - - - - -
GNB - - 2.9% 6 4.6% 10 1.0% 1 - -
UGL - - 4.1% 9 1.7% 3 1.7% 4 1.3% 1
CBG - - - - - - 2.2% 5 2.3% 2
UTB - - - - - - 5.6% 15 5.9% 14
Industry 10.7% 8.6% 7.9% 4.9% 6.1%
Asset quality10

2018 Ghana Banking Survey 90PwC
Asset quality10
26% rise in impairment allowance as at the end of 2017. It may appear that residual debts after conversion of loans to securities have been impaired.
PBL’s ratio worsened from 8.1% as at end of 2016 to 13.7% at end of 2017. This resulted principally from an 84% rise in impairment allowance to GHS147.6 million over the same period. The bank has been challenged with loan defaults, the effect of which appear to have been accelerated in 2017 through increased impairment charges, hence the significant rise in impairment allowance as at the end of 2017.
EBG’s ratio deteriorated from 2.4% at end of 2016 to 7.4% as at end of 2017 due to accelerated impairment charges of GHS173.9 million. This mainly relate to the resolution of the legacy BDC debt.
FABL’s has seen its composition of impaired loans improve from 18.2% as at end of 2016 to 8.4% as at end 2017. A contributing factor is the GHS34.5 million impaired loans written off the loans book during the year. This led to a decline in impairment allowance to GHS22.9 million as at end of 2017, down from GHS51.7 million at end of 2016. Indications are that, the bank channelled efforts into recovering delinquent loans, whilst strengthening its credit risk assessment system, which largely accounts for the improvement.
GCB also experienced an improvement in its impairment allowance to gross loans ratio from 14.5% as at end of 2016 to 10.2% as at end of 2017. The bank’s gross loan book grew by 43% from GHS1.7 billion at end of 2016 to GHS2.4 billion as at end of 2017 upon assumption of selected loans from the defunct banks. Impairment allowance however increased by only 10% from GHS238.4 million to GHS263.0 million. This may indicate that GCB only assumed performing loans of the defunct banks.
The quality of BBGL’s loan portfolio improved. Only 3.3% of its loan
The industry, whilst not lacking in efforts to recover from its challenges with high NPLs, is still feeling the effects of weak credit underwriting practices and the unfavourable economic condition for businesses is telling its toll as businesses struggle to settle loans. This has resulted in a consistent rise in the industry’s ratio of impairment allowance to gross loans year-on-year over the last four years. The expectation that after the conversion of the energy sector debts to ESLA bonds, the quality of the industry’s loan book will improve has not yielded the desired results.
PRB’s composition of impaired loans within its portfolio worsened from 10.4% at end of 2016 to 21.9% as at end of 2017, mainly resulting from increase in its impairment allowance from GHS5.8 million at end of 2016 to GHS15.8 million as at end of 2017. The bank, having been licensed only in April 2016, has seen its NPLs rise significantly overtime, which has resulted in an increased impairment expense and the impairment allowance as at end of 2017.
TRB experienced a deterioration in loan quality from 8.6% at end of 2016 to 17.7% as at end of 2017 following a substantial impairment charge of GHS100.4 million in 2017 compared to GHS61.2 million in 2016. Although the bank slowed down on advancing new loans and intensified efforts at recovery to improve asset quality, the default status of some significant loans remained unchanged. The indications are that the profile of its customers continues to be skewed towards the small and medium enterprises which are prone to default.
UBA was unable to maintain the assets quality it achieved in 2016. The impairment allowance to gross loans ratio worsened from 7.2% at the end of 2016 to 13.8% as at end of 2017. As a lender to the energy sector, the conversion of debt to securities did not improve the quality of asset. Additional impairment loss of GHS34.4 million was recognised in 2017, resulting in a

2018 Ghana Banking Survey 91PwC
book was considered impaired in 2017 compared to 6.8% in the prior year. The bank’s impairment charges doubled from GHS8.0 million in 2016 to GHS17.4 million in 2017. However, the uncollectable loans of GHS84.6 million written off in 2017 had an impact of “cleaning” up the loan book. Meanwhile, the bank continued to grow its loan book as it recorded a 21% growth in gross loans to GHS2.3 billion at end of 2017 without experiencing significant deterioration.
ZBL experienced an improvement of the quality of its portfolio. The composition of impaired loans dropped from 9.7% in 2016 to 6.1% in 2017. The decline in impairment allowance by 52% from GHS108.7 million at the end of 2016 to GHS52.2 million as at end of 2017 can be attributed to the GHS41.7 million non-performing loans written off. The bank tightened credit stance and intensified recovery of existing loans which led to the improvement recorded.
The banks will continue to strengthen their credit administration and adopt more conservative lending practices. A fair balance has to be achieved because the downward trend in yield of government securities will erode interest income which can only be restored from the returns on loans and advances. The basis for determining impairment under IFRS 9 [Financial Instruments] and the requirements of the new Capital Requirement Directive (CRD) will have significant impact on determining the quality of the industry’s loan book.
Asset quality10
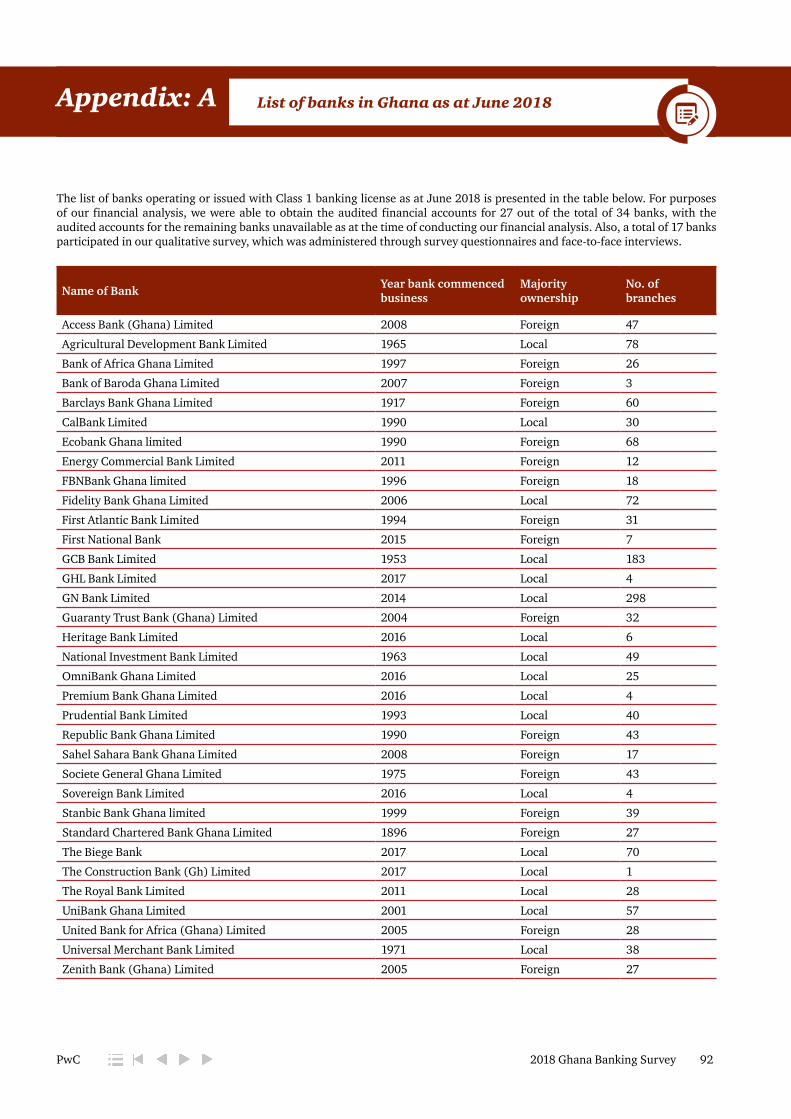
2018 Ghana Banking Survey 92PwC
The list of banks operating or issued with Class 1 banking license as at June 2018 is presented in the table below. For purposes of our financial analysis, we were able to obtain the audited financial accounts for 27 out of the total of 34 banks, with the audited accounts for the remaining banks unavailable as at the time of conducting our financial analysis. Also, a total of 17 banks participated in our qualitative survey, which was administered through survey questionnaires and face-to-face interviews.
Name of Bank Year bank commenced business
Majority ownership
No. of branches
Access Bank (Ghana) Limited 2008 Foreign 47
Agricultural Development Bank Limited 1965 Local 78
Bank of Africa Ghana Limited 1997 Foreign 26
Bank of Baroda Ghana Limited 2007 Foreign 3
Barclays Bank Ghana Limited 1917 Foreign 60
CalBank Limited 1990 Local 30
Ecobank Ghana limited 1990 Foreign 68
Energy Commercial Bank Limited 2011 Foreign 12
FBNBank Ghana limited 1996 Foreign 18
Fidelity Bank Ghana Limited 2006 Local 72
First Atlantic Bank Limited 1994 Foreign 31
First National Bank 2015 Foreign 7
GCB Bank Limited 1953 Local 183
GHL Bank Limited 2017 Local 4
GN Bank Limited 2014 Local 298
Guaranty Trust Bank (Ghana) Limited 2004 Foreign 32
Heritage Bank Limited 2016 Local 6
National Investment Bank Limited 1963 Local 49
OmniBank Ghana Limited 2016 Local 25
Premium Bank Ghana Limited 2016 Local 4
Prudential Bank Limited 1993 Local 40
Republic Bank Ghana Limited 1990 Foreign 43
Sahel Sahara Bank Ghana Limited 2008 Foreign 17
Societe General Ghana Limited 1975 Foreign 43
Sovereign Bank Limited 2016 Local 4
Stanbic Bank Ghana limited 1999 Foreign 39
Standard Chartered Bank Ghana Limited 1896 Foreign 27
The Biege Bank 2017 Local 70
The Construction Bank (Gh) Limited 2017 Local 1
The Royal Bank Limited 2011 Local 28
UniBank Ghana Limited 2001 Local 57
United Bank for Africa (Ghana) Limited 2005 Foreign 28
Universal Merchant Bank Limited 1971 Local 38
Zenith Bank (Ghana) Limited 2005 Foreign 27
List of banks in Ghana as at June 2018Appendix: A

2018 Ghana Banking Survey 93PwC
Capital adequacy ratio is the ratio of adjusted equity base to risk adjusted asset base as required by the Bank of Ghana (BoG)
Cash assets includes cash on hand, balances with the central bank, money at call or short notice and cheques in course of collection and clearing
Cash ratio = (Total cash assets + Total liquid assets)/ (Total assets - Net book value of fixed assets - Investments in subsidiaries and associated companies)
Cash tax rate = Actual tax paid/ Net operating income
Cost income ratio = Non-interest operating expenses/Operating income
Current ratio = (Total assets - Net book value of fixed assets– Investments in subsidiaries and associated companies)/ (Total liabilities - Long term borrowings)
Dividend payout ratio = Proposed dividends /Net profit
Dividend per share = Proposed dividends/ Number of ordinary shares outstanding
Earnings per share = After-tax profits before proposed profits/ Number of ordinary shares outstanding
Financial leverage ratio = Total assets/ common equity
Liquid assets includes cash assets and assets that are relatively easier to convert to cash, e.g., investments in government securities, quoted and unquoted debt and equity investments, equity investments in subsidiaries and associated companies
Loan loss provisions = (General and specific provisions for bad debts + Interest in suspense)/ Gross loans and advances
Loan portfolio profitability = (Interest income attributable to advances - Provisions for bad and doubtful loans)/ Net loans and advances
Loan loss rate = Bad debt provisions/ Average operating assets
Net book value per share = Total shareholder’s funds / Number of ordinary shares outstanding
Net interest income = Total interest income - Total interest expense
Net interest margin = Net interest income/ Average operating assets
Net operating income = Total operating income – Total noninterest operating expenses + Depreciation and amortisation - Loan loss adjustment + Exceptional credits
Net operating (or intermediation) margin = [(Total interest income + Total non-interest operating revenue) / Total operating assets] - [Total interest expense/ Total interest bearing liabilities]
Net profit = Profit before tax - Income tax expense
Net spread = (Interest income from advances/ Net loans and advances) - (Interest expense on deposits/ Total deposits)
Non-interest operating expenses include employee related expenses, occupancy charges or rent, depreciation and amortisation, directors’ emoluments, fees for professional advice and services, publicity and marketing expenses
Non-interest operating revenue includes commissions and fees, profit on exchange, dividends from investments and other non-interest investment income, and bank and service charges
Non-operating assets comprises net book value of fixed assets (e.g., landed property, information technology infrastructure, furniture and equipment, vehicles) and other assets, including prepayments, sundry debtors and accounts receivable
Operating assets include cash and liquid assets, loans and advances, and any other asset that directly generates interest or fee income
Profit after tax margin = Profit after tax/ Total operating income
Profit before tax margin = Profit after extraordinary items but before tax/ Total operating income
Quick (acid test) ratio = (Total cash assets + Total liquid assets)/ (Total liabilities - Long term borrowings)
Return on assets = Profit after tax/ Average total assets
Return on equity = Profit after tax/ Average total shareholders’ funds
Shareholders’ funds comprise paid-up stated capital, income surplus, statutory reserves, and capital surplus or revaluation reserves
Total assets = Total operating assets + Total non-operating assets
Total debt ratio = Total liabilities/ Total assets
Glossary of key financial terms, equations and ratiosAppendix:B

2018 Ghana Banking Survey 94PwC
For PwC, developing people and sharing knowledge are central to how we do business. We believe it is pivotal to the achievement of growth in our firm, our clients’ businesses, industries and the broader economy.
The focus of PwC’s Business School is to:
• Enhance the skills of our people;
• Provide relevant development offerings to our clients;
• Contribute to our profession; and
• Help uplift the communities we are embedded in.
PwC Ghana Business School
PwC’s Business School is not a traditional learning institution. Due to our deep experience within our industry and our knowledge of our clients and the industries in which they operate, we are subject matter experts in a variety of areas..
PwC’s Business School is therefore focused on delivering relevant learning and development solutions based on this knowledge, as well as offering public courses on selected topics and a wide range of bespoke training solutions tailored to the needs and capacity of organisations.
For more information on the Business School please visit our website http://www.pwc.com/gh/en/business-school.html
Our Business SchoolAppendix:C
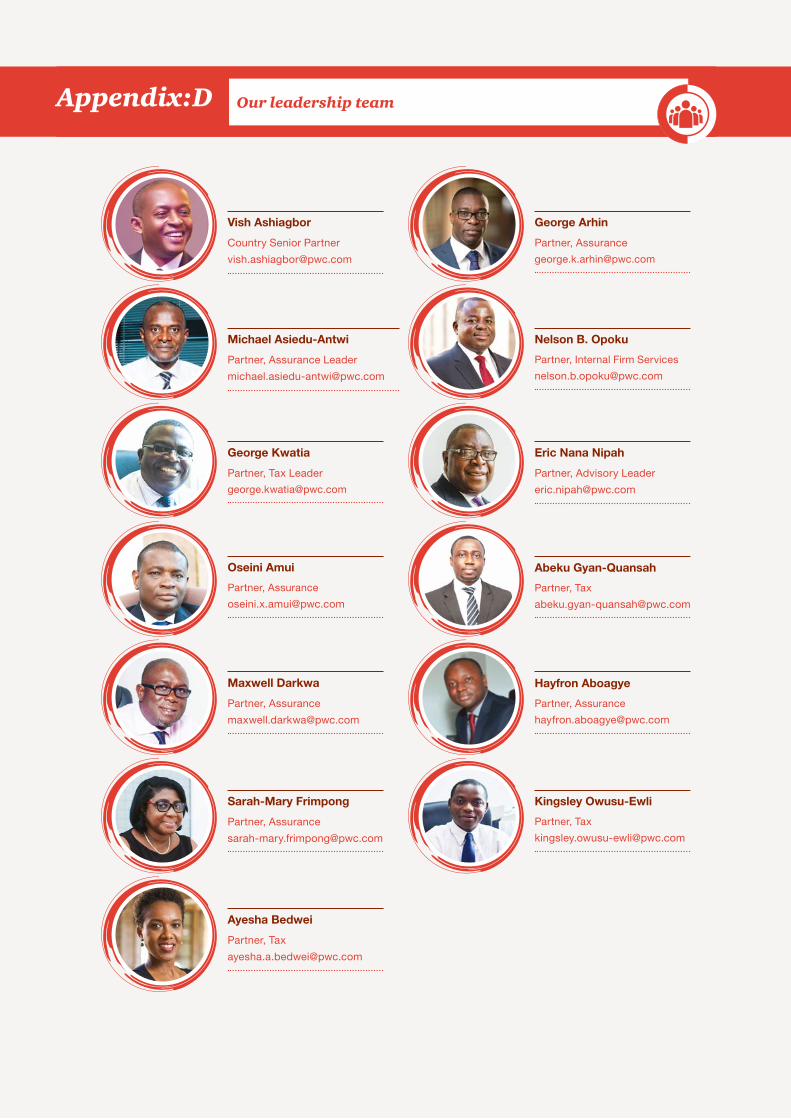
Michael Asiedu-AntwiPartner, Assurance [email protected]
Nelson B. OpokuPartner, Internal Firm [email protected]
George KwatiaPartner, Tax [email protected]
Eric Nana NipahPartner, Advisory [email protected]
Oseini AmuiPartner, [email protected]
Abeku Gyan-QuansahPartner, [email protected]
Maxwell DarkwaPartner, [email protected]
Hayfron AboagyePartner, [email protected]
Sarah-Mary FrimpongPartner, [email protected]
Kingsley Owusu-EwliPartner, [email protected]
Ayesha BedweiPartner, [email protected]
George ArhinPartner, [email protected]
Vish AshiagborCountry Senior [email protected]
Our leadership teamAppendix:D
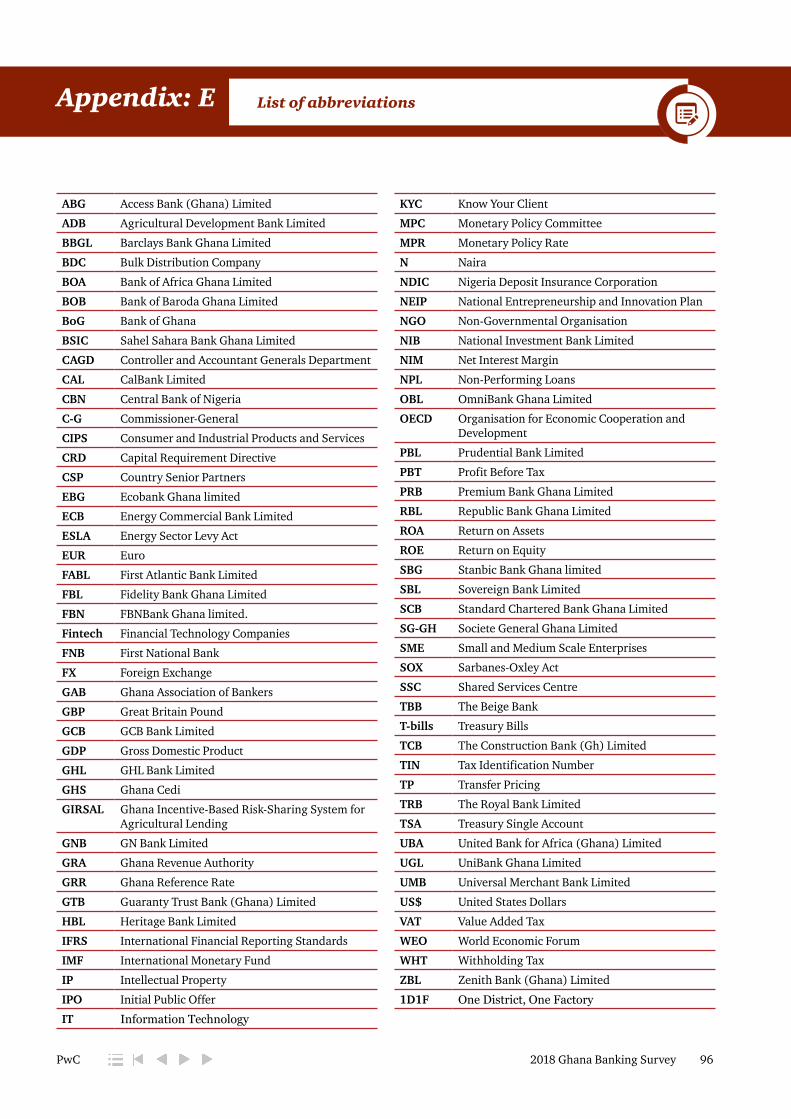
List of abbreviationsAppendix: E
2018 Ghana Banking Survey 96PwC
ABG Access Bank (Ghana) Limited
ADB Agricultural Development Bank Limited
BBGL Barclays Bank Ghana Limited
BDC Bulk Distribution Company
BOA Bank of Africa Ghana Limited
BOB Bank of Baroda Ghana Limited
BoG Bank of Ghana
BSIC Sahel Sahara Bank Ghana Limited
CAGD Controller and Accountant Generals Department
CAL CalBank Limited
CBN Central Bank of Nigeria
C-G Commissioner-General
CIPS Consumer and Industrial Products and Services
CRD Capital Requirement Directive
CSP Country Senior Partners
EBG Ecobank Ghana limited
ECB Energy Commercial Bank Limited
ESLA Energy Sector Levy Act
EUR Euro
FABL First Atlantic Bank Limited
FBL Fidelity Bank Ghana Limited
FBN FBNBank Ghana limited.
Fintech Financial Technology Companies
FNB First National Bank
FX Foreign Exchange
GAB Ghana Association of Bankers
GBP Great Britain Pound
GCB GCB Bank Limited
GDP Gross Domestic Product
GHL GHL Bank Limited
GHS Ghana Cedi
GIRSAL Ghana Incentive-Based Risk-Sharing System for Agricultural Lending
GNB GN Bank Limited
GRA Ghana Revenue Authority
GRR Ghana Reference Rate
GTB Guaranty Trust Bank (Ghana) Limited
HBL Heritage Bank Limited
IFRS International Financial Reporting Standards
IMF International Monetary Fund
IP Intellectual Property
IPO Initial Public Offer
IT Information Technology
KYC Know Your Client
MPC Monetary Policy Committee
MPR Monetary Policy Rate
N Naira
NDIC Nigeria Deposit Insurance Corporation
NEIP National Entrepreneurship and Innovation Plan
NGO Non-Governmental Organisation
NIB National Investment Bank Limited
NIM Net Interest Margin
NPL Non-Performing Loans
OBL OmniBank Ghana Limited
OECD Organisation for Economic Cooperation and Development
PBL Prudential Bank Limited
PBT Profit Before Tax
PRB Premium Bank Ghana Limited
RBL Republic Bank Ghana Limited
ROA Return on Assets
ROE Return on Equity
SBG Stanbic Bank Ghana limited
SBL Sovereign Bank Limited
SCB Standard Chartered Bank Ghana Limited
SG-GH Societe General Ghana Limited
SME Small and Medium Scale Enterprises
SOX Sarbanes-Oxley Act
SSC Shared Services Centre
TBB The Beige Bank
T-bills Treasury Bills
TCB The Construction Bank (Gh) Limited
TIN Tax Identification Number
TP Transfer Pricing
TRB The Royal Bank Limited
TSA Treasury Single Account
UBA United Bank for Africa (Ghana) Limited
UGL UniBank Ghana Limited
UMB Universal Merchant Bank Limited
US$ United States Dollars
VAT Value Added Tax
WEO World Economic Forum
WHT Withholding Tax
ZBL Zenith Bank (Ghana) Limited
1D1F One District, One Factory

Oseini AmuiPartner, [email protected]
Vish AshiagborCountry Senior [email protected]
For further information or discussion kindly contact
Key Contacts

This publication has been prepared for general guidance on matters of interest only, and does not constitute professional advice. You should not act upon the information contained in this publication without obtaining specific professional advice. No representation or warranty (express or implied) is given as to the accuracy or completeness of the information contained in this publication, and, to the extent permitted by law, PricewaterhouseCoopers (Ghana) Ltd, its members, employees and agents do not accept or assume any liability, responsibility or duty of care for any consequences of you or anyone else acting, or refraining to act, in reliance on the information contained in this publication or for any decision based on it.
© 2018 PricewaterhouseCoopers (Ghana) Limited. All rights reserved. In this document, “PwC” refers to PricewaterhouseCoopers (Ghana) Limited which is a member firm of PricewaterhouseCoopers International Limited, each member firm of which is a separate legal entity.
Contact us:
Accra OfficeNo. 12 Airport CityUna Home 3rd FloorPMB CT42 CantonmentsAccra, Ghana
Tel: +233 30 276 1500Fax: +233 30 276 1544www.pwc.com/gh
Takoradi OfficeNo.13, GK Ntow StreetSouth Chapel HillTakoradi
Tel: +233 31 202 8416Fax: +233 31 202 8410www.pwc.com/gh
Sierra Leone OfficeDavid BrockeNumber 117 Jomo Kenyatta Road Freetown Sierra Leone Tel:+232 (0) 78361701www.pwc.com/gh
www.pwc.com/gh