2018 Annual Health Care COST TRENDS 2019REPORT ANNUAL ...
64
FEBRUARY 2020 2018 Annual Health Care COST TRENDS REPORT 2019 ANNUAL HEALTH CARE COST TRENDS REPORT
Transcript of 2018 Annual Health Care COST TRENDS 2019REPORT ANNUAL ...

FEBRUARY 2020
2018 Annual Health Care
COST TRENDS REPORT2019
ANNUAL HEALTH CARE COST TRENDS REPORT


2019 COST TRENDS REPORTHEALTH POLICY COMMISSION
TABLE OF CONTENTSINDEX OF ACRONYMS � � � � � � � � � � � � � � � � � � � � � � � � � � � � � � � � � � � � � � � � � � � � � � � � � � � � � � � � � � � � � 1
CHAPTER 1: INTRODUCTION � � � � � � � � � � � � � � � � � � � � � � � � � � � � � � � � � � � � � � � � � � � � � � � � � � � � � � � � � 3
Exhibit 1�1 Annual growth in total health care expenditures per capita in Massachusetts
Exhibit 1�2 Growth of premiums, income, and inflation in Massachusetts, 2000 – 2018
CHAPTER 2: TRENDS IN SPENDING AND CARE DELIVERY � � � � � � � � � � � � � � � � � � � � � � � � � � � � � � � � � � � � � � 8
Exhibit 2�1 Annual growth in total health care expenditures per capita in Massachusetts
Exhibit 2�2 Change in enrollment and per enrollee spending by major market segment, 2017 – 2018
Exhibit 2�3 Medicare spending growth per Medicare beneficiary by service category, Massachusetts and the U.S., 2017 – 2018
Exhibit 2�4 Rates of spending growth in Massachusetts in 2017 and 2018, by category
Exhibit 2�5 Annual growth in total health care spending per capita in Massachusetts and the U.S.
Exhibit 2�6 Annual growth in per capita commercial health care spending, Massachusetts and the U.S.
Exhibit 2�7 Cumulative growth in per capita TME, premiums, and employer-sponsored premiums in the Massachusetts commercial market compared to the U.S., 2013 – 2018
Exhibit 2�8 Annual premium for single coverage in the employer market and average annual unsubsidized benchmark premium for a 40-year-old in the ACA Exchanges, Massachusetts and the U.S., 2013 – 2019
Exhibit 2�9 Allocation of the increase in monthly compensation between 2016 and 2018 for a median Massachusetts family with health insurance through an employer
Exhibit 2�10 Percent of employees who pay a higher premium contribution if their spouse is eligible for coverage through their own employer, 2015 and 2018
CHAPTER 3: HOSPITAL INPATIENT SPENDING AND UTILIZATION � � � � � � � � � � � � � � � � � � � � � � � � � � � � � � � � 18
Exhibit 3�1�1 Change in commercial member risk scores over time, by payer, 2013 – 2018
Exhibit 3�1�2 COPD APR-DRG weights for each severity level; MassHealth 3M APR™DRG versions 30 (2015 – 2017) and version 34 (introduced in 2018)
Exhibit 3�1�3 Percent increase in overall DRG weight, patient length of stay, and use of intensive care settings, 2013 – 2018
Exhibit 3�1�4 Change in number of hospital admissions at each severity/complication level for all payers, 2013 – 2018
Exhibit 3�1�5 Distribution of COPD severity levels, all-payer, 2013 – 2018, and payment for each severity level, 2018
Exhibit 3�1�6 Volume of inpatient stays for septicemia and select substitutable conditions for all payers, 2010 – 2018
Exhibit 3�1�7 Changes in acuity, length of stay, and intensive care days by payer, 2013 – 2018
Exhibit 3�2�1 Cumulative change in commercial inpatient hospital volume and commercial inpatient hospital spending, 2013 – 2018
Exhibit 3�2�2 Inpatient admissions per 1,000 commercial members by type of admission and contribution to volume decline, FY 2013 – FY 2018
Exhibit 3�2�3 Maternity discharges by hospital cohort, 2014 – 2018
Exhibit 3�2�4 Number of selected commercial inpatient discharges in Massachusetts, according to major surgical procedure, 2013 and 2018
Exhibit 3�2�5 Percent of surgeries taking place in inpatient and outpatient settings for select case studies, 2015 – 2017
Exhibit 3�2�6 Change in volume of hysterectomy procedures by hospital system, 2015 – 2017

HEALTH POLICY COMMISSION2019 COST TRENDS REPORT
CHAPTER 4: HOSPITAL OUTPATIENT SPENDING GROWTH � � � � � � � � � � � � � � � � � � � � � � � � � � � � � � � � � � � � 37
Exhibit 4�1 Hospital outpatient departments
Exhibit 4�2 Hospital outpatient spending per member-year by HCCI outpatient service category, 2015 – 2017
Exhibit 4�3 Growth in spending, volume, and payments for major and minor outpatient surgeries, 2015 – 2017
Exhibit 4�4 Change in volume, payment, and severity for twelve major outpatient surgery categories, 2015 – 2017
Exhibit 4�5 Average payment for inpatient and outpatient hysterectomy at selected hospitals
Exhibit 4�6 Change in volume, payment, and severity for minor surgery categories taking place in hospital outpatient by spending, 2015 – 2017
Exhibit 4�7 Share of spending and volume of major outpatient surgeries by hospital system, 2017; including both prior and current hospital system affiliations
Exhibit 4�8 Average payment by hospital for three major outpatient surgeries: hysterectomy, knee repair, and cholecystectomy, 2017
Exhibit 4�9 Average payment by hospital for three minor outpatient surgeries: upper gastrointestinal endoscopy and biopsy, colonoscopy and biopsy, and breast biopsy and other diagnostic procedures, 2017
Exhibit 4�10 Percent increase in payments due to movement across hospital outpatient facilities, 2015 – 2017
CHAPTER 5: POLICY RECOMMENDATIONS � � � � � � � � � � � � � � � � � � � � � � � � � � � � � � � � � � � � � � � � � � � � � � � 49
Exhibit 5�1 Dashboard of HPC system performance metrics
Exhibit 5�2 Dashboard of HPC improvement targets
LIST OF TECHNICAL APPENDICES � � � � � � � � � � � � � � � � � � � � � � � � � � � � � � � � � � � � � � � � � � � � � � � � � � � � 56
ACKNOWLEDGMENTS � � � � � � � � � � � � � � � � � � � � � � � � � � � � � � � � � � � � � � � � � � � � � � � � � � � � � � � � � � � � 57

2019 COST TRENDS REPORTHEALTH POLICY COMMISSION - 1 -
INDEX OF ACRONYMS
ACA Affordable Care ActACO Accountable Care OrganizationAGO Attorney General's OfficeAMC Academic Medical Center
APCD All-Payer Claims DatabaseAPR-DRG All Patient Refined Diagnosis-Related Group
BH Behavioral HealthCCU Cardiac Care UnitCHIA Center for Health Information and AnalysisCMIR Cost and Market Impact ReviewCOPD Chronic Obstructive Pulmonary DiseaseDPH Department of Public HealthDRG Diagnosis-Related GroupED Emergency Department
EOANF Executive Office of Administration and FinanceEOHHS Executive Office of Health and Human Services
FDA Food and Drug AdministrationFFS Fee-For-Service
HCCI Health Care Cost Institute HIDD Hospital Inpatient Discharge DatabaseHPC Health Policy CommissionHPP High Public PayerICU Intensive Care Unit
I-ICU Intermediate Intensive Care UnitIUD Intrauterine DeviceLOS Length of StayMCO Managed Care OrganizationMDC Major Diagnostic Category
MS-DRG Medicare Severity Diagnosis-Related GroupNICU Neonatal Intensive Care UnitNPI National Provider IdentifierOP Outpatient
PBM Pharmacy Benefit ManagerPCC Primary Care ClinicianPIP Performance Improvement Plan
POS Point Of ServiceRVU Relative Value Unit
THCE Total Health Care ExpendituresTME Total Medical ExpendituresUTI Urinary Tract Infection

CHAPTER 1: INTRODUCTION

2019 COST TRENDS REPORTHEALTH POLICY COMMISSION - 3 -
CHAPTER 1
CHAPTER 1: INTRODUCTIONWhile Massachusetts has a long history as a leading state for health care access and innovation, the affordability of the state’s overall high-quality health care continues to be a challenge. In an effort to restrain rapidly increasing health care costs, comprehensive health care reform legislation passed in 2012 set a first-in-the-nation statewide target for sustainable growth in total health care spending (3.6 percent) and established the independent Massachusetts Health Policy Commission (HPC) to help monitor and guide this ambitious effort (see Sidebar: What is the Role of the Massachusetts Health Policy Commission?). Seven years later, the HPC has reported mean-ingful progress towards health care cost containment in the Commonwealth. Overall, since the benchmark was established, the state’s health care spending has grown at a below-the-benchmark average annual rate of 3.4 percent. Most recently, from 2017 to 2018, the state’s preliminary health care spending growth was 3.1 percent, equaling the newly lowered benchmark target for 2018 (Exhibit 1.1). Massachusetts total health care spending growth (including both public and private payers) has been below national growth rates for the ninth consecutive year, a reversal from previous trends.
In this annual report, the HPC presents new research to further enhance the collective understanding of health care spending trends and cost drivers in the Commonwealth, and evaluates the state’s progress in meeting several cost containment, care delivery, and payment system goals set by the Commonwealth and the HPC. The report examines the market dynamics and spending drivers in two areas of particular interest: hospital inpatient and hospital outpatient services. These were two of the fastest growing health care spending categories from 2017 to 2018 (3.7 percent and 3.8 percent, respectively) and together account for over 40 percent of all health care spend-ing in Massachusetts. Based on this analysis and other HPC research and programs, the report also includes a set of rec-ommendations for policymakers as well as providers, payers, employers, patients, and other health care market participants who work collaboratively toward a more high-value system.
By many important indicators, Massachusetts has a high per-forming health care system. As the forerunner to the federal Patient Protection and Affordable Care Act (ACA), the state has the lowest rate of uninsured residents in the U.S. Again this year, Massachusetts ranked first in the Commonwealth Fund’s
2017-20182016-20172015-20162014-20152013-20142012-2013
2.4%
4.2%
4.8%
3.0%
2.8%
3.1%
BENCHMARK: 3.1%
2012 – 2017
BENCHMARK: 3.6%
Notes: 2017-2018 spending growth is preliminary.Sources: Center for Health Information and Analysis Annual Report, 2019
Exhibit 1�1 Annual growth in total health care expenditures per capita in Massachusetts

HEALTH POLICY COMMISSION2019 COST TRENDS REPORT - 4 -
scorecard on state health system performance in the categories of access and prevention and treatment.1 The United Health Foundation, a nationally recognized organization dedicated to improving health and health care, ranked Massachusetts as the second healthiest state in the country.2 Massachusetts is home to many renowned health care institutions that pos-itively contribute to health care research and education for the entire world. The state’s thriving life sciences industry generates foundational scientific advances leading to drugs and treatments that improve and save lives.
However, there are a number of metrics of health system per-formance in which Massachusetts trails the country. Despite ranking as a very healthy state, emergency department, hospital outpatient, and acute care hospital use in Massachusetts are above national averages, and the hospital readmissions rate in Massachusetts is higher than nearly every state in the U.S. The higher utilization of care in intensive and costly settings in Massachusetts may reflect a number of factors such as patient preference or richer benefits and may, in some cases, reflect greater access to necessary care. However, these data also reflect some care that may have been unnecessary, is excessively priced, or which could have been safely delivered in lower cost settings.
The Commonwealth Fund’s scorecard ranked Massachusetts 31st in the nation for avoidable hospital use and costs, while the United Health Foundation ranked Massachusetts 37th in preventable hospitalizations.1, 2 Massachusetts’ place in the variation between states warrants attention, given the impli-cations of avoidable use of intensive care settings for patient experience and overall health system spending.
Massachusetts also faces continued health equity challenges. As detailed in the Department of Public Health’s 2017 Mas-sachusetts State Health Assessment, persistent disparities in health outcomes remain among low-income communities, people of color, LGBTQ+ individuals, and other populations, despite Massachusetts’ long-standing commitments to inclusive health care reform and access to care.3 Additionally, while the Commonwealth Fund’s scorecard still ranks Massachu-setts highly on the category of “disparities based on income,” Massachusetts dropped five places in this category (to 7th in the nation) in the most recent year.
Health care affordability is also a significant and growing challenge. Premium growth has far outpaced general price inflation, with employees paying an increasing share. Between
50%
100%
150%
200%
250%
300%
20
18
20
17
20
16
20
15
20
14
20
13
20
12
20
11
20
10
20
09
20
08
20
07
20
06
20
05
20
04
20
03
20
02
20
01
20
00
GENERAL PRICE INFLATION
EMPLOYEE PREMIUM
CONTRIBUTION
TOTAL FAMILY PREMIUM
EMPLOYER PREMIUM
CONTRIBUTION
PERSONAL INCOME
276%
197%
176%
50%
86%
Notes: Total family premium includes the portion of the premium paid by employees and the part paid by the employer. Personal income refers to income per capita in Massachusetts. General inflation refers to changes in the Consumer Price Index (CPI-U).Sources: HPC analysis of Medical Expenditure Panel Survey (MEPS), Bureau of Labor Statistics (BLS), and Federal Reserve data, 2000-2018
Exhibit 1�2 Growth of premiums, income, and inflation in Massachusetts, 2000 – 2018

2019 COST TRENDS REPORTHEALTH POLICY COMMISSION - 5 -
CHAPTER 1
2000 and 2018 in Massachusetts, the consumer price index grew by 50 percent, while the average cost for a family pre-mium nearly tripled, from $7,341 to $21,801 (Exhibit 1.2). Employees’ direct premium contributions rose even faster (by a factor of nearly four) as employees paid an increasingly larger share of premiums over this time period out of their paychecks (increasing from 21 percent of the premium being paid by employees to 26 percent).4 In addition to paying higher premiums, individuals and families are also paying substan-tially more in cost-sharing and other out-of-pocket spending. Cost-sharing has risen even faster than premium growth in the past several years, and nearly one-third of privately insured Massachusetts residents now have high-deductible health plans.5
The growth in health care costs contributes to financial chal-lenges for many families. In 2017, one in four Massachusetts residents reported having gone without needed medical or dental care due to cost, and 17 percent reported having family medical debt.6 In 2019, one in four Massachusetts residents reported forgoing medically necessary prescription drugs, resulting in difficult choices (rationing or cutting pills) and ultimately worsening health for many residents.7 As detailed in this report, high health care costs in Massachusetts dispropor-tionately burden low- and middle-income families, non-white families, and families with greater health care needs, among other populations. Affordability challenges in Massachusetts echo national trends, with the share of Americans postponing medical care for a serious condition due to costs doubling in the last 20 years, from 12 percent in 2001 to 25 percent in 2019 – the highest level ever recorded.8
This report is being released in the context of robust discus-sions about the future of health care nationally, as well as in Massachusetts and in states across the U.S. In late 2019, the Baker-Polito Administration proposed comprehensive health care reform legislation that builds on past reforms, provides new tools for health care market accountability, and sets bold new goals for improving primary and behavioral health care, among many notable provisions. Leaders in the Massa-chusetts House of Representatives and Senate have similarly committed to advancing the next phase of health care cost con-tainment legislation this year. The recommendations included in this report are intended to inform this debate and identify high-priority areas for policy action based on data, evidence, and lessons learned.
Therefore, despite considerable and persistent cost and equity challenges, Massachusetts is uniquely positioned to continue to lead the nation in advancing a high performing, high value,
and affordable health care system. Inspired by the success of Massachusetts, a number of states around the country have recently established health care cost containment goals and monitoring government agencies. In early 2020, the Altarum Healthcare Value Hub ranked states on their efforts to improve health care affordability, citing Massachusetts as first in the nation for its efforts to date.9
Nonetheless, as evidenced by the findings contained in this report and other HPC research, it is clear that further policy action and a redoubled commitment from health care market participants is needed to realize this promise for the next decade. The HPC stands ready to support these efforts with data insights and independent policy leadership.
HOW THE REPORT IS ORGANIZEDThe report includes material in two formats, a narrative written report and a graphical chartpack. This report is informed by the research of the Center for Health Information and Analysis (CHIA) and the Massachusetts Attorney General’s Office (AGO), as well as by presentations and testimony submitted during the HPC’s 2019 Annual Health Care Cost Trends Hearing.
Chapter 2 of the report compares health care cost growth in 2018 to the state’s health care cost growth benchmark and discusses trends and levels of health care spending in Massa-chusetts and the nation overall. Chapter 3 analyzes drivers of hospital inpatient spending in two sections, presenting evidence on how hospital coding intensity efforts contribute to rising inpatient spending despite a constant or declining number of hospital stays, and exploring shifts in care from inpatient to outpatient settings. Chapter 4 examines the factors that result in hospital outpatient care being the highest growth sector of health care in Massachusetts. The HPC’s policy recommen-dations for improving efficiency in health care spending and quality of care in Massachusetts can be found in Chapter 5 at the end of the report, along with a dashboard summarizing performance on key measures.
The chartpack presents updated results and trends previously reported on by the HPC. These include areas for improvement in care delivery performance, such as decreasing avoidable hospital inpatient and emergency department utilization and maximizing value in post-acute care, and progress in aligning incentives, including expanding the use of alternative payment methods. The chartpack also explores variation in practice patterns and spending by provider organization, including use of low value care services.

HEALTH POLICY COMMISSION2019 COST TRENDS REPORT - 6 -
SIDEBAR: WHAT IS THE ROLE OF THE MASSACHUSETTS HEALTH POLICY COMMISSION?The Massachusetts Health Policy Commission (HPC), established in 2012, is an independent state agency charged with monitoring health care spending growth in Massachusetts and providing data-driven policy recom-mendations regarding health care delivery and payment system reform. The HPC’s mission is to advance a more transparent, accountable, and innovative health care system through independent policy leadership and inno-vative investment programs. The HPC’s goal is better health and better care – at a lower cost – for all people across the Commonwealth.
HPC staff and its Board of Commissioners work collab-oratively to monitor and improve the performance of the health care system. Key activities include setting the health care cost growth benchmark; setting and mon-itoring provider and payer performance relative to the health care cost growth benchmark; creating standards for care delivery systems that are accountable to better meet patients’ medical, behavioral, and social needs; ana-lyzing the impact of health care market transactions on cost, quality, and access; investing in community health care delivery and innovations; and safeguarding the rights of health insurance consumers and patients regarding coverage and care decisions by health plans and certain provider organizations.
REFERENCES1 Radley DC, Collins SR, Hayes SL. 2019 Scorecard on state
health system performance. The Commonwealth Fund. Avail-able at: https://scorecard.commonwealthfund.org/
2 United Health Foundation. 2019 America’s Health Rankings Annual Report. Available at: https://www.americashealthrank-ings.org/
3 Department of Public Health. 2017 Massachusetts State Health Assessment. Oct. 2017. Available at: https://www.mass.gov/files/documents/2017/11/03/2017%20MA%20SHA%20final%20compressed.pdf
4 HPC analysis of data from the Agency for Healthcare Research and Quality. Data available at: https://nhqrnet.ahrq.gov/inhqrdr/Massachusetts/benchmark/summary/All_Measures/All_Topics
5 Center for Health Information and Analysis. Annual Report on the Performance of the Massachusetts Health Care System: 2019. Oct. 2019. Available at: http://www.chiamass.gov/assets/2019-annual-report/2019-Annual-Report.pdf
6 Center for Health Information and Analysis. Findings from the 2017 Massachusetts Health Insurance Survey. Dec. 2017. Available at: http://www.chiamass.gov/assets/docs/r/survey/mhis-2017/2017-MHIS-Report.pdf.
7 WBUR Massachusetts Poll. June 24, 2019. Available at: https://d279m997dpfwgl.cloudfront.net/wp/2019/06/Topline-2019-05-WBUR-Statewide.pdf
8 Saad L. More Americans Delaying Medical Treat-ment Due to Cost. Gallup News. 9 Dec. 2019. Available at: https://news.gallup.com/poll/269138/americans-delaying-medical- treatment-due-cost .aspx?fbclid=IwAR34v0JxhKXVuruXC8_PAKke1yooTFCS1x-EjxmPtHRMRSr4da6wIfUNNFZU
9 Altarum Healthcare Value Hub. Healthcare Affordability State Policy Scorecard: Summary Report. Jan. 2020. Avail-able at: https://www.healthcarevaluehub.org/application/files/5415/7858/8694/Healthcare_Affordability_Scorecard_-_Summary_Report.pdf

CHAPTER 2: TRENDS IN SPENDING
AND CARE DELIVERY
Health care spending growth in Massachusetts in 2018 exactly matched the benchmark rate (3.1 percent) and was below the national trend for the 9th consecutive year.
3.1%
Employee premium contributions for family coverage for workers in low-wage firms have risen rapidly in recent years and now exceed $8,000 per year ($683 per month) on average, higher than for other workers (less than $6,000 per year, or $500 monthly).
$
Health care spending growth in Massachusetts between 2016 and 2018 absorbed almost 40 cents of every additional dollar earned for families with coverage through employers, more than they took home in pay after taxes.
40¢
Spending growth per enrollee varied by sector with both commercial (4.6 percent) and Medicare FFS (3.9 percent) exceeding the benchmark, and MassHealth below (2.6 percent).

HEALTH POLICY COMMISSION2019 COST TRENDS REPORT - 8 -
CHAPTER 2: TRENDS IN SPENDING AND CARE DELIVERYThe Commonwealth’s landmark health care cost containment law, Chapter 224 of the Acts of 2012,1 establishes a benchmark for sustainable growth in health care spending, recognizing that containing spending growth is critical to easing the burden of health care spending on government, households, and busi-nesses. Chapter 224 directs the Massachusetts Health Policy Commission (HPC) and the Center for Health Information and Analysis (CHIA) to monitor health care spending growth annually relative to the benchmark, which is indexed to a pro-jection of the Commonwealth’s long-term economic growth.
From 2013 to 2017, the benchmark for annual health care spending growth was set at 3.6 percent. From 2018 to 2022, the benchmark was set by law to equal potential gross state product minus 0.5 percent, or 3.1 percent, but the HPC has limited authority to increase it back up to 3.6 percent. On March 29, 2017, the HPC board voted unanimously to main-tain the benchmark at 3.1 percent for the 2018 calendar year relative to 2017 – the period of focus for much of the data presented in this chapter. This chapter also discusses broader trends regarding health care spending, value, and performance in the Commonwealth (see Sidebar: Factors Underlying Health Care Spending).
SIDEBAR: FACTORS UNDERLYING HEALTH CARE SPENDINGTotal health care spending is a function of the prices of health care services as well as health care utilization. Utiliza-tion, in turn, is affected by both the number of people who use health care services and the frequency and intensity of the services they receive. The HPC’s Annual Health Care Cost Trends Report examines the latest changes in both prices and utilization in Massachusetts, as well as factors that may explain and contextualize these recent trends in health care spending. This report largely focuses on aspects of the health care system that can be influenced by policymakers, government agencies, and market partici-pants in the state, instead of population health factors such as aging of the population and other underlying changes in health status.
SPENDING GROWTH FROM 2017-2018The measure of spending growth that is compared to the benchmark is the change in Total Health Care Expenditures (THCE) per state resident. THCE includes health care spending incurred by individuals, the state, and the federal government via Medicaid (MassHealth) and Medicare, as well as commer-cial spending as reported by health insurers to CHIA. CHIA reported that, from 2017 to 2018, the per capita growth in THCE in Massachusetts was 3.1 percent, matching the bench-mark set by the HPC.2 Total spending increased from $58.8 billion in 2017i to $60.9 billion in 2018,ii while the state’s population grew by 0.6 percent over the same time period, resulting in an increase in per capita spending from $8,562 to $8,827. This marks the first year that THCE growth was measured against the lower 3.1 percent benchmark, after two years of trending below the previous benchmark of 3.6 percent. From 2012 to 2018, six years since the passage of Chapter 224 for which THCE growth has been assessed, the average annual spending growth rate has been 3.38 percent.
Exhibit 2�1 Annual growth in total health care expenditures per capita in Massachusetts
Notes: 2017-2018 spending growth is preliminary.Sources: Center for Health Information and Analysis Annual Report, 2019
i Final assessment of 2016-2017 THCE per capita growth was revised upward from 1.6% to 2.8%. This difference in preliminary and final THCE per capita growth was driven primarily by two payers identifying and removing payments made by third parties that were reflected elsewhere in THCE.
ii This figure is preliminary.
2017-20182016-20172015-20162014-20152013-20142012-2013
2.4%
4.2%
4.8%
3.0%
2.8%
3.1%
BENCHMARK: 3.1%
2012 – 2017
BENCHMARK: 3.6%

2019 COST TRENDS REPORTHEALTH POLICY COMMISSION - 9 -
CH
APTER 2
While the state met the 3.1 percent spending growth benchmark in the aggregate in 2018, there were differences in performance by market segment (see Exhibit 2.2). In the commercial sector, spending grew 3.9 percent in total while enrollment declined slightly, resulting in spending growth per enrollee of 4.6 percent– substantially above the benchmark.iii For MassHealth enrollees who receive full coverage under either the Primary Care Clinician (PCC) program or through a managed care organization (MCO), most of whom transitioned by 2018 into one of MassHealth’s new Accountable Care Organization (ACO) programs, spending per enrollee grew 2.6 percent, the lowest of any major market sector; total enrollment declined by 1.8 percent.iv In the Medicare program, spending per enrollee also grew faster than the benchmark (3.9 percent) for the roughly three-fourths of Massa-chusetts Medicare beneficiaries enrolled in traditional (fee-for-service or FFS) Medicare, while spending growth per enrollee was just below the benchmark (3.0 percent) for enrollees in privately-administered Medicare Advantage, which also saw a 5.4 percent surge in enrollment.
The increase in Medicare spending per enrollee con-trasts with prior years in which spending growth per enrollee has been below the benchmark and even nega-tive in some years (a reduction in spending). Medicare spending in the FFS program was also relatively high in the U.S. overall in 2018 (see Exhibit 2.3), but growth in Massachusetts was higher in every category of care except for skilled nursing facilities. Per enrollee Medi-care spending for hospital inpatient services increased by 2.9 percent in Massachusetts last year, nearly triple the national rate. Home health Medicare spending per enrollee in Massachusetts grew by 2.1 percent, also far above the national rate; this could reflect a shift from skilled nursing facilities where spending declined 3.1 percent in Massachusetts, also in excess of the national rate (see Chartpack that explores the decline in institutional post-acute care use).
iii This growth rate is higher than other measures of commer-cial spending growth such as total medical expenditures (TME) per member. The difference between measures is discussed later in the chapter.
iv This excludes, for example, disabled or other enrollees receiving coverage on a fee-for-service basis and enrollees who are dually eligible for Medicare coverage and Mass-Health benefits.
Spending per enrollee Enrollment
-4%
-2%
0%
2%
4%
6%
Medicare FFSMedicare
Advantage
MassHealth
(MCO+PCC+ACO)
Commercial
4.6%
2.6%
-0.6%
5.4%
3.9%
0.6%
-1.8%
3.0%
3.9%
0.8%
8.6%
X%
4.5%
Change in total spendingNotes: Medicare FFS spending does not include Part D prescription drug coverage. Commercial spending and enrollment growth includes enrollees with full and partial claims and the net cost of private health insurance. MassHealth includes only full coverage enrollees in the MCO, PCC, and ACO programs. Figures are not adjusted for changes in health status.Sources: Center for Health Information and Analysis Annual Report, 2019
Exhibit 2�2 Change in enrollment and per enrollee spending by major market segment, 2017 – 2018
Exhibit 2�3 Medicare spending growth per Medicare beneficiary by service category, Massachusetts and the U.S., 2017 – 2018
MA
U.S.
-4%
-2%
0%
2%
4%
6%
8%
Home health
Skilled nursing
PharmacyPhysician +
other
professionals
Hospital
outpatient
Hospital
inpatient
2.9%
1.0%
2.5%2.4%
6.6%
5.0%
2.1%
0.2%
-3.1%
7.3%
7.1%
-1.8%
MA
U.S.
-4%
-2%
0%
2%
4%
6%
8%
Home health
Skilled nursing
PharmacyPhysician +
other
professionals
Hospital
outpatient
Hospital
inpatient
2.9%
1.0%
2.5%2.4%
6.6%
5.0%
2.1%
0.2%
-3.1%
7.3%
7.1%
-1.8%
MA
U.S.
-4%
-2%
0%
2%
4%
6%
8%
Home health
Skilled nursing
PharmacyPhysician +
other
professionals
Hospital
outpatient
Hospital
inpatient
2.9%
1.0%
2.5%2.4%
6.6%
5.0%
2.1%
0.2%
-3.1%
7.3%
7.1%
-1.8%
Notes: Spending reflects fee-for-service (traditional Medicare) beneficiaries only.Sources: Centers for Medicare and Medicaid Services, special data request
In the commercial sector, spending grew 3.9 percent in total while enrollment declined
slightly, resulting in spending growth per enrollee of 4.6 percent– substantially above the benchmark
Spending per enrollee Enrollment
-4%
-2%
0%
2%
4%
6%
Medicare FFSMedicare
Advantage
MassHealth
(MCO+PCC+ACO)
Commercial
4.6%
2.6%
-0.6%
5.4%
3.9%
0.6%
-1.8%
3.0%
3.9%
0.8%
8.6%
X%
4.5%
Change in total spending

HEALTH POLICY COMMISSION2019 COST TRENDS REPORT - 10 -
SPENDING BY CATEGORY OF SERVICEWhen analyzed by category of service, physician and other professionals’ spending grew by 4.5 percent in Massachusetts in 2018, representing the fastest-grow-ing category of spending (see Exhibit 2.4). Within this category, physician spending growth was 2.8 percent, whereas spending for “other professional” services (such as care provided by a nurse practitioner or psychologist) grew more sharply at 8.4 percent. This represents an acceleration from growth of 5.9 percent from 2016 to 2017 and was driven by an 11.1 percent increase in the commercial sector. Some of the increase may reflect a growing presence of nurse practitioners in care delivery.v
Hospital outpatient spending grew by 3.8 percent in 2018 – lower than the growth rate of 4.9 percent in 2017, but still the fastest-growing category of spending over the 2016-2018 two-year period (8.9 percent). Increases in hospital outpatient spending can occur due to a number of factors, including price increases, volume increases, and shifts in care to outpatient settings from either higher-cost inpatient settings or lower-cost office-based settings. The HPC has previ-ously reported on outpatient spending and continues this examination in Chapter 4 of this report.3
Hospital inpatient spending grew by 3.7 percent in 2018, despite continued decline in inpatient utilization (see Chartpack). Chapter 3 examines the underlying reasons for falling hospital volumes, as well as trends that prevented this decrease in utili-zation from resulting in decreased hospital inpatient spending.
Prescription drug spending grew by 3.6 percent in 2018, slightly lower than in 2017, but still above the benchmark growth rate, continuing a multi-year trend. The slightly lower growth rate appears to be due in part to an increase in manufacturer rebates, which payers typically negotiate and receive through their pharmacy benefit managers (PBMs). For example, commer-cial payers received 15.6 percent of pharmacy spending back
v According to data from the Bureau of Labor Statistics (Occupation and Employment Statistics), the number of Nurse Practitioners employed in Massachusetts increased from 4,700 in 2013 to 6,200 in 2018.
from manufacturers in the form of rebates in 2018, up from 12.9 percent in 2017 and 10.7 percent in 2016.2 Not accounting for rebates, gross pharmacy spending grew by 5.8 percent in 2018, up from 5.4 percent in 2017.2 Importantly, even though rebates may reduce payers’ expenses for prescription drugs, consumers typically pay their cost-sharing (deductibles and co-insurance) based on the list price of the drug and do not benefit directly from rebates.vi As a result of continued high spending and spending growth on prescription drugs that is not always commensurate with value, numerous state, federal, and commercial market initiatives have emerged in the last year to address affordability for patients and high drug prices overall (see Sidebar: Progress, Emerging Strategies, and New Challenges in Addressing Prescription Drug Spending).
vi Some payers and their PBMs are now offering point-of-sale (POS) rebates to reduce consumer out-of-pocket spending. A national survey found that about one in five large employers use POS rebates in their pharmacy benefit plans, and another 40 percent of large employers are considering POS rebates for 2021 and 2022. See Drug Channels,
“Employers slowly warm to point-of-sale rebates – but must move faster for insulin.” Sept. 19, 2019. Available at: https://www.drugchannels.net/2019/09/employers-slowly-warm-to-point-of-sale.html)
Hospital inpatient spending grew by 3.7 percent in 2018, despite continued
decline in inpatient utilization
Non-ClaimsOther Medical
PharmacyPhysicians
and Other
Professionals
Hospital
Outpatient
Hospital
Inpatient
1.0%
20.9% 19.6% 24.9% 14.4% 15.2% 5.0%
3.7%
4.9%
3.8%
1.5%
4.5%
3.7%3.6%
-3.1% -0.2% -2.8%
3.1%
2016-2017 growth
2017-2018 growth
Percent of Total
Expenditures
Non-ClaimsOther Medical
PharmacyPhysicians
and Other
Professionals
Hospital
Outpatient
Hospital
Inpatient
1.0%
20.9% 19.6% 24.9% 14.4% 15.2% 5.0%
3.7%
4.9%
3.8%
1.5%
4.5%
3.7%3.6%
-3.1% -0.2% -2.8%
3.1%
2016-2017 growth
2017-2018 growth
Percent of Total
Expenditures
Non-ClaimsOther Medical
PharmacyPhysicians
and Other
Professionals
Hospital
Outpatient
Hospital
Inpatient
1.0%
20.9% 19.6% 24.9% 14.4% 15.2% 5.0%
3.7%
4.9%
3.8%
1.5%
4.5%
3.7%3.6%
-3.1% -0.2% -2.8%
3.1%
2016-2017 growth
2017-2018 growth
Percent of Total
Expenditures
Non-ClaimsOther Medical
PharmacyPhysicians
and Other
Professionals
Hospital
Outpatient
Hospital
Inpatient
1.0%
20.9% 19.6% 24.9% 14.4% 15.2% 5.0%
3.7%
4.9%
3.8%
1.5%
4.5%
3.7%3.6%
-3.1% -0.2% -2.8%
3.1%
2016-2017 growth
2017-2018 growth
Percent of Total
Expenditures
Notes: Total expenditures exclude net cost of private health insurance, VA and Health Safety Net. Pharmacy spending is net of rebates. Other medical category includes long-term care, dental, and home health and community health. Non-claims spending represents capitation-based payments, care management, and incentive programs such as pay-for-performance payments.Sources: Payer-reported total medical expenditure data to Center for Health Infor-mation and Analysis and other public sources; HPC analysis of data from Center for Health Information and Analysis Annual Report, 2019
Exhibit 2�4 Rates of spending growth in Massachusetts in 2017 and 2018, by category

2019 COST TRENDS REPORTHEALTH POLICY COMMISSION - 11 -
SIDEBAR: PROGRESS, EMERGING STRATEGIES, AND NEW CHALLENGES IN ADDRESSING PRESCRIPTION DRUG SPENDING
Emerging legislative strategies to address prescription drug spendingThe past year has seen a proliferation of proposals for addressing prescription drug spending in Massachusetts and other states, as well as at the federal level. Activities have focused on increasing affordability for patients, reviewing drug launch prices, moder-ating the impact of drug price increases, and increasing pricing transparency.
In Massachusetts, the FY 2020 state budget gave authority to the Executive Office of Health and Human Services (specifically MassHealth) to negotiate directly with pharmaceutical manu-facturers for supplemental rebates and charged the HPC with responsibility to investigate the manufacturer’s pricing for those drugs if a rebate agreement cannot be reached. Based on the results of the investigation, the HPC may ultimately determine whether the manufacturer’s pricing of the drug is unreasonable or excessive in relation to the drug’s value.
Several bills have recently been filed that would complement this new process. The Baker-Polito Administration filed a bill that would 1) expand the HPC’s review to include drugs with a financial impact to the total market in Massachusetts over a defined threshold, 2) address price increases through imposing a penalty on manufacturers that increase the price of a drug above an inflation-based threshold level, 3) increase state oversight of PBMs, and 4) establish requirements for pharmacists to ensure consumers pay the lowest cost for a prescription, among other provisions.4 In November, the Massachusetts Senate passed a bill with many of the same provisions, while also limiting out-of-pocket spending on insulin for residents.5
Elsewhere in the U.S., 30 states passed at least 49 new laws regarding prescription drugs and affordability in 2019. Maine and Maryland created drug affordability review boards charged with recommending state action to address drugs that threaten patient affordability and state budgets. Both states passed laws with novel provisions: Maryland’s board is required to set upper payment limits, while Maine established a Canadian wholesale prescription drug importation program. Louisiana implemented a subscription model to treat hepatitis C in its Corrections Services and Medicaid program, in which the state will provide a specified budget to a single manufacturer to treat an unlimited number of cases. Innovative state financing models will become even
more critical as new very high-cost therapies enter the market, as described in the section below. A number of states have also focused on generics drug prices. In May 2019, Massachusetts Attorney General Maura Healey joined a suit with Attorneys Gen-eral from more than 40 states alleging a widespread conspiracy among 20 major drug makers to inflate and manipulate prices for more than 100 different generic medications that treat conditions including diabetes, cancer, multiple sclerosis, HIV/AIDS, and epi-lepsy.6 The complaint alleges that the companies drove up prices for certain drugs by more than 1,000 percent. Federally, both houses of Congress and the Trump Administration have proposed a range of strategies to address drug affordability for patients, high launch prices, and price increases for the Medicare program.7
New challenges in financing gene therapyPublic and private payers also face new financial challenges to cover extremely high cost innovations in gene therapies. Cell and gene therapies modify a patient’s genes to address the patient’s health condition; many of these therapies are potentially curative. In 2019, the U.S. Food and Drug Administration (FDA) approved a gene therapy for spinal muscular atrophy, a rare child-hood disorder. Zolgensma is a one-time potential cure; however, priced at $2.1 million per patient, it is also the most expensive treatment on the market, raising questions of whether that price is unreasonable, and how the health care system can finance innovations such as these even if the prices are justified. Novartis, the innovator, has proposed financing mechanisms to pay for the therapy over a period of time, and other new approaches to financing are being developed and tested, with some pioneered in Massachusetts. Cigna has created the Embarc Benefit Protec-tion program, in which employers and other payers can pay a fee under $1 per member per month to gain protection for coverage of Zolgensma and other available gene therapies.8 Other insurers are also developing outcomes-based contracting models that tie price to clinical results. MIT’s NEWDIGS initiative focuses on developing a range of financing strategies to assist payers.9 Based on the pipeline of active clinical trials, an estimated 80 to 100 cell and gene therapies could be on the market by 2031.10 In an era of potential cures with gene therapy, public and private payers will require innovative and sustainable approaches to financing.

HEALTH POLICY COMMISSION2019 COST TRENDS REPORT - 12 -
COMPARISON TO NATIONAL TRENDSIn 2018, the Massachusetts total health care spending growth rate of 3.1 percent per capita was below the U.S. rate of 3.5 percent, continuing a consecutive nine-year trend of spending growth below the national growth rate (see Exhibit 2.5).
In the commercial sector, per member spending growth rates also continued to be below the national average (see Exhibit 2.6). Cumulatively from 2013 to 2018, these lower growth rates amount to commercial spending that was $7.2 billion lower over this time period than would have been the case if growth rates matched the national average.
However, the measure of commercial spend-ing in Exhibit 2.6 is total medical expenditures (TME), which does not include the administrative costs of private health insurance (e.g., insurer overhead, staffing and personnel, profit margin). These administrative costs have grown somewhat faster in Massachusetts than in the rest of the U.S. For example, while per capita TME grew by 12.9 percent in total from 2013 to 2018 in Massachusetts compared to the national rate of 24.7 percent (see Exhibit 2.7), commercial premiums (which do include these administrative costs) grew by 16.5 percent, slightly closer to the U.S. growth rate of 26.1 percent. And limit-ing the comparison to only employer-sponsored insurance premiums (i.e. excluding the individual
In 2018, the Massachusetts total health care spending
growth rate of 3.1 percent per capita was below the U.S. rate
of 3.5 percent, continuing a consecutive nine-year trend of spending growth below the
national growth rate
0%
2%
4%
6%
8%
10%
12%
2018201720162015201420132012201120102009200820072006
MA
U.S.
$7.2 BILLION
MA
U.S.
0%
2%
4%
6%
8%
10%
20
18
20
17
20
16
20
15
20
14
20
13
20
12
20
11
20
10
20
09
20
08
20
07
20
06
20
05
20
04
20
03
20
02
20
01
20
00
Notes: U.S. data include Massachusetts. MA 2017-2018 spending growth estimate is preliminary.Sources: Centers for Medicare and Medicaid Services, National Health Expenditure Accounts Personal Health Care Expenditures, 2014-2018 and State Health Expendi-ture Accounts, 1999-2014; Center for Health Information and Analysis, Total Health Care Expenditures, 2014-2018
Notes: U.S. data include Massachusetts. MA 2017-2018 spending growth estimate is preliminary. Center for Health Information and Analysis data are based on full-claim commercial total medical expenditures (TME).Sources: Centers for Medicare and Medicaid Services, National Health Expenditure Accounts Personal Health Care Expenditures, 2014-2018 and State Health Expendi-ture Accounts, 2005-2014; Center for Health Information and Analysis, Total Health Care Expenditures, 2014-2018
Exhibit 2�5 Annual growth in total health care spending per capita in Massachusetts and the U.S.
Exhibit 2�6 Annual growth in per capita commercial health care spending, Massachusetts and the U.S.

2019 COST TRENDS REPORTHEALTH POLICY COMMISSION - 13 -
CH
APTER 2
market), the difference in premium growth between Massachu-setts and U.S. average is even narrower. From 2013 to 2018, employer-sponsored single premiums grew by 18.3 percent in Massachusetts, while increasing by 20.5 percent nation-ally. This difference is because individual market premiums in Massachusetts have grown more slowly than those in the employer-based market in Massachusetts, while the reverse is true in the rest of the US.
Exhibit 2�7 Cumulative growth in per capita TME, premiums, and employer-sponsored premiums in the Massachusetts commercial market compared to the U.S., 2013 – 2018
Notes: Fully-insured premiums are used for Massachusetts premium calcula-tion. Private health insurance spending (which includes medical expenditures and net costs of private health insurance) is used to calculate average U.S. premium. U.S. data include Massachusetts.Sources: Centers for Medicare and Medicaid Services, National Health Expenditure Accounts Personal Health Care Expenditures (national TME and premiums); Center for Health Information and Analysis annual reports (Massachusetts TME and premiums); Agency for Healthcare Research and Quality, Medical Expenditure Panel Survey (employer-sponsored premiums)
As shown in Exhibit 2.8, premiums for plans sold by the Mas-sachusetts Health Connector, which are available to individuals and small employers, are the second lowest in the U.S. in recent yearsvii, while employer-sponsored insurance premiums in Massa-chusetts ranked 4th highest in the country in 2018 and have not significantly narrowed the gap with the U.S. average since 2013.
vii Some of the reasons for the success of the Massachusetts Health Con-nector include its offering a choice of comparable plans, a program of fixed-dollar premium and cost-sharing subsidies that incentivizes low premiums from participating carriers and then concentrates enrollment in these low-cost plans, and a suite of policies that promote continuous coverage, such as an individual coverage mandate and streamlined special enrollment periods for individuals in need of coverage outside open enrollment. Some of these are discussed on p.69 of the HPC’s 2016 Annual Health Care Cost Trends Report.
Exhibit 2�8 Annual premium for single coverage in the employer market and average annual unsubsidized benchmark premium for a 40-year-old in the ACA Exchanges, Massachusetts and the U.S., 2013 – 2019
Notes: U.S. data include Massachusetts. Employer premiums are averages based on a large sample of employers within each state. Exchange data represent the weighted average annual premium for the second-lowest silver (Benchmark) plan based on county-level data in each state. From 2013 to 2017, the exchange premiums shown reflect a 70% actuarial value, less generous than the average employer plan shown (typically around 85%), which explains some of the difference between the two lines. In 2018, the cost of silver plans rose due to carriers having to incorporate the cost of cost sharing reductions for some silver tier enrollees which the federal government had been funding. Exchange and group market premiums do not differ for the same plan.Sources: Kaiser Family Foundation analysis of premium data from healthcare.gov (marketplace premiums 2014-2019); Agency for Healthcare Research and Quality, Medical Expenditure Panel Survey (commercial premiums 2013-2018)
If premium growth trends also included patient cost-sharing, the increase in health care spending would be even larger. While Massachusetts premiums grew 16.5 percent from 2013 to 2018, cost sharing grew by 30.4 percent and combined growth of the two was 17.7 percent.viii This is consistent with the continued rapid rise in the percentage of Massachusetts residents with high-deductible plans (from 24.5 percent in 2016 to 31.5 percent in 2018),2 which are often embraced by employers as a means to keep premium growth down. Thus, with relatively rapid increases in both premiums and deductibles, compared to modest increases in average wages and salaries, Massachusetts residents are increasingly facing health care affordability challenges.
viii Cost-sharing and premiums would be expected move in opposite directions; all else equal, increasing deductibles will reduce premiums.
Medical spending + insurer admin costs – OOP spending
Employer market
premiums
only
All Premiums
(Individual and Employer)
Medical Spending
(TME)
12.9%
24.7%
16.5%
26.1%
18.3%
20.5%
MA
U.S.
Medical spending + insurer admin costs – OOP spending
Employer market
premiums
only
All Premiums
(Individual and Employer)
Medical Spending
(TME)
12.9%
24.7%
16.5%
26.1%
18.3%
20.5%
MA
U.S.
Medical spending + insurer admin costs – OOP spending
Employer market
premiums
only
All Premiums
(Individual and Employer)
Medical Spending
(TME)
12.9%
24.7%
16.5%
26.1%
18.3%
20.5%
MA
U.S.
$0
$2,000
$4,000
$6,000
$8,000
2019201820172016201520142013
MA employers
U.S. employers
MA Connector
U.S. ACA Exchange
2ND LOWEST IN THE U.S.
4TH HIGHEST IN THE U.S.
$0
$2,000
$4,000
$6,000
$8,000
2019201820172016201520142013
MA employers
U.S. employers
MA Connector
U.S. ACA Exchange
2ND LOWEST IN THE U.S.
4TH HIGHEST IN THE U.S.
$0
$2,000
$4,000
$6,000
$8,000
2019201820172016201520142013
MA employers
U.S. employers
MA Connector
U.S. ACA Exchange
2ND LOWEST IN THE U.S.
4TH HIGHEST IN THE U.S.

HEALTH POLICY COMMISSION2019 COST TRENDS REPORT - 14 -
AFFORDABILITY OF CAREAs noted in CHIA’s 2019 Annual Report, health insurance premiums and cost-sharing in Massachusetts grew roughly twice as fast as worker wages and salaries and the rate of inflation between 2016 and 2018 – meaning an ever-larger share of the earnings of families with private health insurance are devoted to health care. For a typical family in Massachu-setts with coverage through an employer, total health care spending amounted to an average of $2,091 per month when including health insurance premiums (employer and employee contributions) and out-of-pocket health care spending.ix Some families spent much more – for approximately 10 percent of the population, spending exceeded $3,000 per month.x Much of this spending on health care is not readily visible – employ-ers pay for covered workers’ (and their families’) health care spending out of their total pool of compensation. When more compensation is paid in the form of health care spending, less is paid in worker wages and salaries.
ix This total is the sum of 1) $1,871 in average family health insurance premiums (including employer and employee contributions) as estimated by the Medical Expenditure Panel Survey – Insurance Component administered by the Agency for Healthcare Research and Quality, 2) $221 based on the ratio of cost-sharing to premium spending according to data from the CHIA 2019 Annual Report, and 3) $53, an estimate of over the counter and other sources of health care spending not covered by insurance from the Current Population Survey, Annual Supplement.
x This calculation is based on the ratio in the Medical Expenditure Panel Survey of the 90th percentile of premium spending in Massachusetts ($29,333) to the mean premium in Massachusetts ($20,603) over 2016 to 2018.
Including employer premium spending, the HPC estimates that nearly 40 cents of every additional dollar earned by Massa-chusetts families between 2016 and 2018 was spent on health care (see Exhibit 2.9).
Massachusetts’ median family income grew over this period (2016 to 2018) from $95,207 to $101,548. At the same time, premiums for employer-sponsored insurance grew almost $3,000 per year, from $18,955 to $21,801. In total, a median family was compensated an additional $712 monthly by their employers in 2018 versus 2016, yet of this total, $277 was absorbed by additional health care spending ($184 in the form of added employer contributions to health care, $53 in employee premium spending and $40 in additional out-of-pocket spending on health care). The $277 in additional health care spending exceeded the portion families took home as additional dispos-able income ($270) after paying state and federal taxes ($165). Given the fact that most employers are not able to offer multiple plans, many families with employer-sponsored coverage have little choice but to continue to see a growing share of their disposable income devoted to health care.xi, 2
xi Most employers do not offer employees a choice of plans (Massa-chusetts Health Policy Commission, Annual Cost Trends Report, 2016). Further, premiums do not tend to vary across insurers by a large amount, and when employers require employees to pay a set percentage of the premiums (say, 20 percent), then any employee savings from choosing lower-cost plans is drastically reduced. On the other hand, several plans available on the Massachusetts Connector cost more than one-third less than most employer-based plans and any enrollee subsidies are fixed (not dependent on the plan chosen) - thus, enrollees fully pocket any premium savings.
$270
FINAL INCREASE
IN TAKE�HOME
PAY
$40
COPAYS AND
DEDUCTIBLES
$53
EMPLOYEE
PREMIUM
CONTRIBUTION
$184
EMPLOYER
PREMIUM
SPENDING
$165
STATE AND
FEDERAL
TAXES
23 CENTS 39 CENTS 38 CENTS
Health careState and federal taxes Take home income
$277
Notes: Data represent Massachusetts families who obtain private health insurance through an employer. Massa-chusetts median family income grew from $95,207 to $101,548 over the period while mean family employ-er-sponsored insurance premiums grew from $18,955 to $21,801. Compensation is defined as employer premium contributions plus income as recorded in the American Community Survey and is considered earnings. All pre-mium payments are assumed to be non-taxable. Tax figures include income, payroll, and state income tax.Sources: HPC analysis of Agency for Healthcare Research and Quality, Medical Expenditure Panel Survey Insur-ance Component (premiums); Census Bureau, American Community Survey 1-year files (income), and Center for Health Information and Analysis 2019 Annual Report (cost-sharing)
Exhibit 2�9 Allocation of the increase in monthly compensation between 2016 and 2018 for a median Massachusetts family with health insurance through an employer

2019 COST TRENDS REPORTHEALTH POLICY COMMISSION - 15 -
CH
APTER 2
Recent changes in benefit design could also expose some consumers to additional costs. For example, employers are increasingly adopting spousal surcharges, a fee added to an employee’s premium for electing to insure a spouse who is eli-gible for coverage through their own employer. Almost one in four Massachusetts employees were subject to these surcharges in 2018, double the percentage in 2015 (see Exhibit 2.10).xii
Exhibit 2�10 Percent of employees who pay a higher premium contribution if their spouse is eligible for coverage through their own employer, 2015 and 2018
Sources: HPC analysis of Agency for Healthcare Research and Quality, Medical Expenditure Panel Survey
Finally, the growing financial burden of health care is felt particularly acutely by lower- and middle-income households with employer-based coverage.xiii This is partly because these families have less available income after paying for health care. Twenty three percent of middle class families in Massachusetts with employer coverage devote more than a quarter of all earnings to health care.xiv These families are more likely to be non-white (29.4 percent), lack a college degree (62.9 percent), be a single parent (50.1 percent), have a disability or activity
xii Data obtained via special table request from the Agency for Healthcare Research and Quality, November 5, 2019.
xiii This is also true for individual market enrollees not eligible for subsidies, though they enjoy a wider range of plan choices and savings opportuni-ties than most individuals who obtain coverage through their employers.
xiv HPC’s analysis of data from the CPS Annual Social and Economic Supplement (ASEC), 2016-2018 and Agency for Healthcare Research and Quality (AHRQ) Medical Expenditure Panel Survey (MEPS), 2016-2018. Estimates are based on a three-year average of middle class families from 2016-2018. Middle class definition is based on General Social Survey (GSS) occupational prestige scores.
limitation (14.7 percent) and have worse health in general (31.8 percent).xv Furthermore, these families often must pay a higher portion of the insurance premium than higher-income families. In recent years in Massachusetts, employees of lower-wage firms were charged significantly more for their portion of health insurance premiums than employees at other firms, on average.xvi This disparity reached almost 50 percent by 2018: required premium contributions averaged $683 per month for family coverage for employees of firms in the lowest average wage quartile versus $459 per month for employees at higher-wage firms. Though it is unclear why this trend has emerged, lower-wage firms may struggle more than other firms to afford the high cost of coverage for employ-ees, and particularly their families, and may therefore encourage those employees to seek other coverage options.
Overall, while health care spending growth in Massachusetts was at the benchmark level in 2018, commercial spending growth per enrollee and commercial premiums exceeded the benchmark as well as growth in earnings for Massachusetts residents, making health care increasingly unaffordable, partic-ularly for lower- and middle-income residents with insurance through their employers. The further analysis and discussion in this report and its recommendations are oriented toward improving the affordability of health care for all residents while maintaining high quality and accessibility of care.
xv “College degree” was defined as having a B.A. or higher degree in the family. Single-parent families are those in families who did not report being in a married couple family (male or female reference person). Disability or activity limitation was defined as difficulty walking or climbing stairs, dressing or bathing, hearing, seeing, or having a health problem or a disability which prevents work or limits the kind or amount of work they can perform. “Worse health” was defined as those reporting a health status “poor,” “fair” or “good.”
xvi Data from the Agency for HealthCare Research and Quality, Medical Expenditure Panel Survey – Insurance Component.
20182015
12.4%
20.7%
23.5%
26.9%
Massachusetts U.S.
20182015
12.4%
20.7%
23.5%
26.9%
Massachusetts U.S.
Twenty three percent of middle class families in Massachusetts with employer coverage devote more than a quarter of all
earnings to health care

HEALTH POLICY COMMISSION2019 COST TRENDS REPORT - 16 -
REFERENCES1 187th Masssachusetts Senate. Chapter 224 Of The Massachu-
setts Acts Of 2012: An Act Improving The Quality Of Health Care And Reducing Costs Through Increased Transparency, Efficiency And Innovation. Commonwealth of Massachusetts. 2012 July 30. Available at: https://malegislature.gov/Laws/SessionLaws/Acts/2012/Chapter224.
2 Center for Health Information and Analysis. Annual Report on the Performance of the Massachusetts Health Care System: 2019. Oct. 2019. Available at: http://www.chiamass.gov/assets/2019-annual-report/2019-Annual-Report.pdf.
3 Health Policy Commission. 2017 Cost Trends Report. Mar. 2018. Available at: https://www.mass.gov/files/docu-ments/2018/03/28/Cost%20Trends%20Report%202017.pdf
4 An Act to improve health care by investing in Value, H.B. 4134, 191st General Court (Mass. 2019)
5 An Act relative to pharmaceutical access, costs, and transpar-ency, S.B. 2409, 191st General Court (Mass. 2019)
6 Office of Attorney General Maura Healey. “Press release: AG Healey sues generic drug makers and executives for widespread conspiracy to raise prices.” May 13, 2019. Available at: https://www.mass.gov/news/ag-healey-sues-generic-drug-makers-and-executives-for-widespread-conspiracy-to-raise-prices
7 Sachs R. Prescription Drug Legislation in Congress: An Update. Health Affairs Blog. Dec. 12, 2019. Available at: https://www.healthaffairs.org/do/10.1377/hblog20191211.802562/full/?utm_source=Newsletter&utm_medium=email&utm_con-tent=%5BPresented+by+Harvard+Medical+School%5D+Pre-scription+Drug+Legislation+In+Congress%3B+Medic-aid+Recipient+Awareness+Of+Work+Requirements%-3B++Decline+In+Rural+Medical+Students&utm_cam-paign=HAT+12-11-19
8 Livingston S. “Cigna aims to expand affordable access to gene therapies.” Modern Healthcare. Sept 6, 2019. Avail-able at: https://www.modernhealthcare.com/payment/cigna-aims-expand-affordable-access-gene-therapies
9 FoCUS Project at MIT NEWDIGS. “Paying for Cures Toolkit.” Accessed Jan. 24, 2020. Available at: https://www.payingforcures.org/toolkit/?utm_source=NEWDIGSwebsite&utm_medi-um=website&utm_campaign=ToolkitAnnouncement
10 FoCUS Project at MIT NEWDIGS. “Durable therapies: Expected availability to 2031.” Accessed Jan. 24, 2020. Avail-able at: https://www.payingforcures.org/toolkit-overview/pipeline/

CHAPTER 3: HOSPITAL INPATIENT
SPENDING AND UTILIZATION
Hospital inpatient spending has continued to grow despite a constant or declining number of hospital stays; among commercially-insured patients, spending per inpatient stay grew 5.2 percent annually between 2013 and 2018, from $14,500 to $18,700.
5.2%
Factors such as population aging, changes in underlying disease prevalence or health status, or shifting of healthier patients out of hospital settings do not explain growing patient acuity or risk scores. Evidence suggests that a considerable portion of the change is due to hospital coding practices.
Commercial inpatient volume declined 9.3 percent between 2014 and 2018.
The decline in inpatient hospital stays was almost entirely due to fewer maternity-related discharges and fewer scheduled admissions, as opposed to admissions from the emergency department.
9.3%
One factor leading to higher spending per stay is increasing acuity among inpatient stays. Acuity grew by more than 10 percent from 2013 to 2018 for all hospitalized patients; patient risk scores grew by 11.7 percent over this period.

HEALTH POLICY COMMISSION2019 COST TRENDS REPORT - 18 -
CHAPTER 3: HOSPITAL INPATIENT SPENDING AND UTILIZATIONIn 2018, hospital spending accounted for 41 percent of total health care expenditures (THCE) in Massachusetts, with just over half of that spending originating from inpatient stays and the remainder from hospital outpatient departments. Both inpatient and outpatient care accounted for 47 percent of THCE growth between 2017 and 2018. The HPC has explored various aspects of hospital spending in previous Cost Trends Reports, including price variation in maternity episodes, the composition of hospital outpatient spending, and inpatient price growth. This chapter focuses on additional dynamics underlying hospital inpatient spending growth while Chapter 4 explores growth in commercial outpatient spending in detail, particularly focusing on trends in outpatient surgery.
HOSPITAL INPATIENT TRENDS: SECTIONS 3�1 AND 3�2Hospital inpatient spending grew 3.7 percent in Massachusetts from 2017 to 2018, despite a slight decline in the number of inpatient stays (see Chartpack) – indicating that spend-ing growth was driven by higher spending per stay, rather than more hospital stays. In seeking to understand growth in spending per inpatient stay, the HPC has identified three important concurrent trends in the commercial inpatient market in Massachusetts: 1) rising prices paid for a given stay, 2) rising reported severity of illness (acuity) of hospitalized patients, and 3) declining number (volume) of admissions.i,1 Section 3.1 explores the second trend in detail. Section 3.2 focuses on the third trend.
i The HPC’s 2018 Cost Trend Report also focused in detail on rising prices for a given admission.
SECTION 3�1: CHANGES IN INPATIENT SEVERITY OF ILLNESSSeverity of illness (patient acuity) refers to how sick a hospital-ized patient is, as reflected in hospital administrative data. The HPC has observed steadily rising patient acuity in a number of contexts. In a previous analysis of commercially-insured hospitalized patients observed in the Massachusetts All-Payer Claims Database (APCD), the HPC found the average acuity of such patients rose 4.2 percent between 2014 and 2016.1 Separately, the HPC found that the proportion of “high acuity” (as opposed to “community-appropriate”) discharges in the Commonwealth increased from 56 percent of all discharges to 62 percent of all discharges across all payers between 2010 and 2017.2 Finally, the HPC has observed a steady rise in patient risk scores over time, amounting to an 11.7 percent increase between 2013 and 2018 (see Sidebar: Increasing Risk Scores and Health-Status Adjusted TME). The HPC has found that only a small portion of this increase can be explained by demographic trends such as the age/sex mix of the population or changes in disease prevalence. This increase in acuity has important policy implications for the Commonwealth. This chapter explores in more detail the observed increase in acuity among hospital inpatients.

2019 COST TRENDS REPORTHEALTH POLICY COMMISSION - 19 -
SIDEBAR: INCREASING RISK SCORES AND HEALTH-STATUS ADJUSTED TME
The “risk score” is a measure designed to estimate an individual’s expected health care spending over the course of a year based on patient characteristics – most commonly age, sex, and diagno-ses. It is typically computed by health insurance companies and used throughout health care payment and quality measurement systems to ensure that providers and payers are neither inap-propriately penalized for having sicker and more costly patients, nor inappropriately motivated to avoid them. For example, the Affordable Care Act state-based marketplaces include a provision whereby insurers with a healthier mix of patients must transfer funds to insurers with a sicker mix of patients in order to balance costs and reduce incentives of plans to profit by enrolling dis-proportionately healthy individuals.3 Risk-based arrangements (employed by many alternative payment methods and Medicare Advantage), whereby providers care for a fixed set of patients over the course of a year and gain or lose bonus payments based on their total costs of care, also tend to include payment adjustments for patient risk scores – with the similar aim of compensating providers who may care for a patient population with greater needs. In these cases, payments received by providers or payers to care for these populations are typically directly proportional
to risk scores – a 10 percent higher risk score may translate to a 10 percent higher payment.4
Commonly reported quality measures such as readmissions rates and hospital mortality rates are also typically risk-adjusted using administrative claims data. Furthermore, the HPC’s consideration of whether to require a performance improvement plan, one of the key accountability provisions of Chapter 224, uses risk scores as part of the calculation of “health-status-adjusted total medical expenditures” to determine whether providers’ or plans’ spending growth exceeds the benchmark.
Risk scores are typically calculated via complex, proprietary software that combines data on observed patient spending with other patient data to estimate how much a patient with a given set of medical diagnoses, age, gender and other factors might be expected to incur in medical costs. For a full population, risk scores are expected to be relatively stable over time because the health of entire populations changes slowly. However, this has not been the case in Massachusetts in recent years (see Exhibit 3�1�1).
5%
10%
15%
20%
25%
201820172016201520142013
AETNA INC.
HARVARD PILGRIM HEALTH CARE
TUFTS HEALTH PLAN
HEALTH NEW ENGLAND
FALLON HEALTH
ALL
BLUE CROSS BLUE SHIELD
OF MASSACHUSETTS
Notes: Several payers are omitted from the graph due to data anomalies. The insurers shown represent more than 70 percent of the commercial market in Massachusetts. All risk scores are normalized to 1.0 in 2013.Sources: HPC analysis of Center for Health Information and Analysis Annual Reports: Total medical expenditures (TME) databooks, 2016-2019
Exhibit 3�1�1 Change in commercial member risk scores over time, by payer, 2013 – 2018

HEALTH POLICY COMMISSION2019 COST TRENDS REPORT - 20 -
Among the six insurers’ commercial populations, risk scores rose between 5 and 21 percent, with an overall average increase of 11.7 percent (2.2 percent per year). It is implausible that the health of the Massachusetts population has truly worsened to this extent. According to the Affordable Care Act’s risk adjustment system noted earlier, it would take an additional 428,000 commer-cially-insured Massachusetts residents with complex diabetes or 920,000 (more than 20 percent of the commercially-insured population) with cerebral palsy to generate a risk score increase of that magnitude.5
Though some have suggested the increase in risk scores could be due to population aging,6 the HPC found that, while the pop-ulation of Massachusetts is indeed aging (and older residents incur greater medical expenditures), aging has a minor impact on the growth in risk scores in the commercial population. Aging is modest within the commercially-insured population. For example, the percentage of commercially-insured Massachusetts residents who are between the ages of 55 and 64 (where expenditures are several times higher than for younger residents) grew from 17.8 percent to 18.2 percent between 2015 and 2018. In all, when combined with patterns of spending for various age and gender groups, the observed demographic changes between 2015 and 2018 among Massachusetts’ privately-insured population would be expected to increase commercial spending by 0.5 percent
in total – a small fraction of the growth in risk scores (which are proportional to expected spending) over this period.ii
The HPC also analyzed self-reported survey data regarding dis-ease prevalence in Massachusetts through 2016 (the most recent year available) from the Centers for Disease Control, which is less prone to changes in clinical or health care administrative practic-es.7 The HPC found that between 2013 and 2016, the prevalence of arthritis and diabetes increased by 0.8 and 0.4 percentage points, respectively, while the prevalence of asthma and chronic obstructive pulmonary disease (COPD) decreased by 1.2 and 0.4 percentage points. Life expectancy in Massachusetts did not change over this time period.8 And, while the opioid epidemic is indeed severe and impactful, it has not made an appreciable impact on overall commercial risk scores.
Insofar as changes in risk scores reflect true changes in the health of the population, they are a critical tool for fairly adjusting payment and quality measurement and to ensure that payers and providers under risk are not encouraged to avoid sicker patients. However, to the extent that increasing risk scores reflect other dynamics, such as changes in coding, the accuracy of risk-ad-justed quality or payment systems may be compromised.
ii While Exhibit 3.1.1 displays risk score growth from 2013 to 2018, data on the demographics of the commercially-insured population in Massachusetts were only available to the HPC from 2015 to 2018; thus, the aging trend was compared to the risk score trend from 2015 to 2018 only.

2019 COST TRENDS REPORTHEALTH POLICY COMMISSION - 21 -
CH
APTER 3
The acuity of hospitalized patients is a critical factor in hos-pital spending because of how hospitals are paid. The vast majority of hospital stays, including those covered by Medicare, MassHealth and commercial payers, are classified and paid for according to the diagnosis-related group (DRG) system.iii The system was developed by Medicare in 1983 in response to rising payments which had previously been based on hospitals’ own reported costs of care. The new model instituted a system of fixed payments for a given hospital stay and led to a dramatic reduction in annual hospital spending growth (from 5.6 percent from 1975-1983 to 2.1 percent from 1983-1997) in part due to this change in payment method.9,10 Today most insurers have adopted this system (Medicare Severity Diagnosis-Related Group, MS-DRG) or the related All Patient Refined Diagnosis-Related Group (APR-DRG). The APR-DRG system is similar to the MS-DRG system, but calibrated for a non-elderly population.
Both of these payment systems assign a diagnosis group (e.g. “pneumonia”) to a given hospital stay along with a severity level (e.g. “with major complications”) and assign a “weight” to the DRG/severity combinationiv that is intended to correspond with the expected resources needed to treat the patient (see Sidebar: DRG Systems, DRG Weights, and Prices).v Critically, this weight is applied as a direct multiplier to the payment the hospital receives for the stay. The average weight, which hospitals often refer to as the “case-mix index,” is the measure of acuity tracked in this chapter.
The assignment of a DRG and a severity level for a hospital stay is made via software algorithms based on patient diag-noses and clinical data entered into the patient’s record over the course of the stay by clinicians. These clinical data are typically adjusted or refined after the stay into medical billing language by hospital administrative staff (e.g. registered nurses or medical coding technicians), often in consultation with the clinicians who treated the patient.
This payment system was designed to reduce the degree to which payment depends on hospitals’ reported costs, which
iii There are some exceptions. Some insurers pay a fixed amount per inpatient day (“per-diem”) and payers sometimes make other adjust-ments, such as for very long stays. See Technical Appendix.
iv In the MS-DRG system, each DRG is itself a diagnostic group with or without complication/ major complications, while in the APR-DRG system each DRG has four severity levels.
v The original DRGs had two or one severity levels, but in 2007, these were expanded such that most DRGs now have three severity levels under the MS-DRG system or four under the APR-DRG system. See: https://www.cms.gov/Medicare/Medicare-Fee-for-Service-Payment/AcuteInpatientPPS/IPPS-Regulations-and-Notices-Items/CMS1228401.html
hospitals have some ability to control, in favor of standard measures of resources need to treat inpatients. Nevertheless, the current system is based on diagnoses, co-morbidities, and clinical indicators of severity, all of which can also be influenced by clinical judgment and hospital technology and processes. Each patient is unique, and, particularly for certain symptoms, physicians and other personnel exercise discretion as to the presence of certain co-morbidities, symptom severity, and appropriate classification of a given patient presentation.11,12
While there can be clinical benefits to more complete doc-umentation of patients’ health status and histories in their medical records, hospitals also have a financial interest in classifying a given patient into the highest-paying category and in understanding the algorithms at work that translate clinical data into DRG/severity classifications.vi Prior litera-ture has shown that hospitals are able to modify their coding practices to increase payments while the underlying severity of the patient population remains the same.13,14,15 Furthermore, advanced electronic health records systems such as EPIC can facilitate hospitals’ ability to increase payments (indeed, they often advertise this ability directly) by auto-populating the patients’ record with prior diagnoses, for example, which can enable coding of the DRG into a higher-severity category.16,17 Several research studies have found a link between adoption of advanced health IT in hospitals with higher reported patient acuity, although one study did not.18,19,20
Some increases in patient acuity could also arise from true changes in patient health status or a selective shifting of health-ier patients from inpatient to outpatient settings. Given the noted observations of increasing patient acuity, particularly in the inpatient setting, the HPC sought to characterize and understand changes in patient acuity, the underlying causes of those trends, and their implications for health care spending in the Commonwealth.
vi Additional efforts on the part of hospital clinicians and administrative staff directed toward maximizing reimbursements based on coding also represent time, effort and attention that could otherwise be spent more directly toward optimizing patient care and health outcomes.
Prior literature has shown that hospitals are able to modify their coding practices to increase
payments while the underlying severity of the patient population remains the same

HEALTH POLICY COMMISSION2019 COST TRENDS REPORT - 22 -
SIDEBAR: DRG SYSTEMS, DRG WEIGHTS, AND PRICES
Different DRG SystemsThere are two major diagnosis-related group (DRG) systems used by the U.S. health care system: Medicare Severity (MS) and All Patient Refined (APR). The MS-DRG system groups inpatient stays into 754 DRGs (for example, pneumonia), most of which (but not all) are further bi- or tri-furcated into different levels of severity
“without complications,” “with complications,” and “with major complications/comorbidities.” This system is used by Medicare and about 17 percent of the commercial market in Massachu-setts.vii The APR-DRG system groups all inpatient stays into 315 DRGs each having four severity levels, 1 through 4, with 4 being the most severe. The APR-DRG system is used by MassHealth and the majority of the commercial payers in Massachusetts. The analyses in this report use both DRG systems.viii
Payments are directly proportional to DRG weightsUnder either system, the resulting payment the hospital receives is produced by multiplying a base rate by the DRG weight, where the DRG weight is defined by the DRG and the severity level. For example, MassHealth payment for COPD admission in 2018 would be equal to its base rate ($12,472) multiplied by the weight for a given severity level (weights are shown in Exhibit 3�1�2).
Updates to classifications and weights can reduce the impact of coding intensityAll groups are updated annually to reflect changes in technology and resource use associated with treating certain conditions rela-tive to other conditions. To produce the updates, analysts examine patterns of resource use for a DRG/severity combination and adjust weights accordingly.ix For example, if COPD/severity level 4 becomes more costly to treat due to use of a new technology, the weight would be adjusted upward. Conversely, if increasingly healthy patients are being coded as COPD/severity 3 compared to prior years, with commensurately lower costs of treatment,
vii Based on the HPC analysis of data in Center for Health Information and Analysis. Payer-reported Relative Price. Aug. 2019.
viii Parts of this report were produced using proprietary computer software created, owned and licensed by the 3M Company. All copyrights in and to the 3M APR™ Software, and to the 3M APR™DRG classification system(s) (including the selection coordination and arrangement of all codes) are owned by 3M. All rights reserved.
ix To produce the updates for MS-DRG, CMS updates the DRG system based on multiple factors including: changes in medical practice, technology, and the variation in cases within a DRG. For more information see: https://oig.hhs.gov/oei/reports/oei-09-00-00200.pdf.
then the weight would be adjusted downward relative to other DRGs. For example, as shown in Exhibit 3�1�2, when MassHealth updated its weights in 2018, the weight for COPD/severity level 4 shifted downward. Although MassHealth adjusted its base rates such that total hospitals payments were unchanged, the payment differential between COPD level 3 and COPD level 4 was reduced from 114 percent to 82 percent.
Exhibit 3�1�2 COPD APR-DRG weights for each severity level; Mass-Health 3M APR™DRG versions 30 (2015 – 2017) and version 34 (introduced in 2018)
Notes: Version 30 was used between 2015 and 2017. In 2018 MassHealth adopted version 34.Sources: 3M APR™DRG classification system v30.0, v34.0; Acute Hospital MassHealth DRG Weights
Unlike MassHealth and Medicare which update DRG weights more frequently, many commercial payers use the same DRG versions and weights for many years, in part due to the administrative burden of making system changes. At the beginning of 2018, all large Massachusetts insurers continued to use an early APR-DRG system version (3M APR™DRG v30.0 or earlier versions), even though an updated version (version 34) had been available since 2016 and had been implemented by MassHealth.21
These weight updates, on average, tend to somewhat offset the effects of coding the same patients into higher severity levels; for example, the 7.9 percent weight increase the HPC observed for Medicare patients, which incorporates annual weight updates, would have been even higher if Medicare had not updated the weights between 2013 and 2018.
Severity 4Severity 3Severity 2Severity 1
0.44 0.40
0.550.48
0.74
1.58
1.13
0.62
Version 30 Version 34
Severity 4Severity 3Severity 2Severity 1
0.44 0.40
0.550.48
0.74
1.58
1.13
0.62
Version 30 Version 34

2019 COST TRENDS REPORTHEALTH POLICY COMMISSION - 23 -
CH
APTER 3
In order to analyze trends in inpatient acuity, the HPC compiled all inpatient discharges from the CHIA Hospital Inpatient Discharge Database from fiscal year 2013-2018. CHIA applies the same grouping algorithm used by payers to assign each inpatient discharge both an APR-DRG and MS-DRG category and severity level (see Technical Appendix for additional details). To gain insight into whether observed acuity changes were related to changes in underlying patient health, the HPC tracked several additional indicators of patient acuity simul-taneously present in the discharge data including information on the length of stay (LOS), number of days in the intensive care unit (ICU), cardiac care unit (CCU), or neonatal intensive care unit (NICU).x
TRENDS IN PATIENT ACUITY OVER TIMEInpatient acuity as measured by the DRG weight under both the APR-DRG and MS-DRG system increased dramatically between 2013 and 2018, by 13.7 percent and 10.8 percent, respectively (see Exhibit 3.1.3).xi At the same time, trends in patient length of stay and use of intensive care do not suggest
x This mirrors approaches taken by other researchers cited in this chapter.
an increase in underlying patient acuity. Use of all types of intensive care declined.xii The increase occurred across all hospital types and systems (not shown), though there was some variation in the extent of the increase across hospitals.
Increases in DRG weight as observed in Exhibit 3.1.3 can occur due to shifts from low- to high-severity classifications within a given DRG (e.g. from COPD without complications to COPD with complications) or from shifts in assignment from one DRG to another, related DRG. We find evidence for both types of shifts.
xi Analysis uses 3M APR™DRG classification system v30.0 using MassHealth weights. In a sensitivity analysis, the HPC used 3M APR™DRG v30.0 commercial weights, which had a similar trend to MassHealth weights over the time period.
xii As a further test, the HPC examined these same metrics by major diagnostic category. These trends remained similar across the vast majority of categories with few exceptions. The HPC also conducted a sensitivity test regarding the measure of intensive care days which included use of intermediate ICU days to the measure. They were excluded from the core measure because intermediate ICUs treat lower severity patients than regular ICUs. For example, see Sjoding, MW et al. Rising Billing for Intermediate Intensive Care, American Journal of Respiratory and Critical Care Medicine 2016. Even after incorporating intermediate ICU use, there was still a decline in all ICU, CCU, NICU, and intermediate ICU use over the study period.
-10%
-5%
0%
5%
10%
15%
201820172016201520142013
APR�DRG ACUITY
MS�DRG ACUITY
LENGTH OF STAY
ICU � CCU � NICU DAYS
13.7%
10.8%
1.5%
�9.8%
Notes: ICU = intensive care unit; CCU = cardiac care unit; NICU = neonatal intensive care unit. This curve represents days in any of these settings combined.Sources: HPC analysis of Center for Health Information and Analysis Hospital Inpatient Discharge Database, FY2013-FY2018; MS-DRG classification system for each year (weights updated each year), 3M APR™DRG clas-sification system v30.0 using MassHealth weights (weights held constant)
Exhibit 3�1�3 Percent increase in overall DRG weight, patient length of stay, and use of intensive care settings, 2013 – 2018

HEALTH POLICY COMMISSION2019 COST TRENDS REPORT - 24 -
INCREASES IN SEVERITY OF DRG LEVELSAcross inpatient stays for all payers in the Commonwealth, the HPC observed a substantial shift from low-severity to high-se-verity DRGs (see Exhibit 3.1.4). In the APR-DRG system, the number of severity level 4 (most severe) discharges grew 74 percent over this time period, the number of level 3 DRGs increased 26 percent, the number of level 2 discharges declined 5 percent, and the number of severity level 1 DRGs declined 20 percent. Under the MS-DRG system, the highest-severity DRGs increased 45 percent while the lowest-severity DRGs declined 14 percent. The coding of additional conditions (secondary diagnoses) that might be in patients’ records could explain some of the increases. For example, in 2018, 95 percent of inpatient discharges has 5 or more diagnosis codes, a sub-stantial increase from 77 percent in 2013.
One possible explanation for the rise in inpatient acuity is that low-acuity discharges are disproportionally being shifted to outpatient settings. If this were the case, one would expect to see fewer low-severity discharges and the same number of high-severity discharges. While this may be true for some diagnoses (shifting is explored further in Chapter 4) we find that overall, the number of discharges coded as high-severity (levels 3 or 4) has increased significantly, even more than the drop in low-acuity discharges. As shown below in Exhibit 3.1.4, from 2013 to 2018, the number of low-severity discharges dropped by 63,000 while the number of high-severity dis-charges increased by 66,000.
�63,000 DISCHARGES +66,000 DISCHARGES
With major
complications
With
complications
Without
complications Severity 4Severity 3Severity 2Severity 1
MS-DRG APR DRG
-14%
45%
-20%
-5%
26%
74%
-1%
�40,000 DISCHARGES +51,000 DISCHARGES
Notes: APR-DRG level 1 is the least severe and level 4 is most severe. The MS-DRG analysis only includes the subset of DRGs that have three complication levels as shown.Sources: HPC analysis of Center for Health Information and Analysis Hospital Inpatient Discharge Database, FY2013-FY2018; MS-DRG classification system (weights updated each year), 3M APR™DRG classification system v30.0 (weights held constant)
Exhibit 3�1�4 Change in number of hospital admissions at each severity/complication level for all payers, 2013 – 2018

2019 COST TRENDS REPORTHEALTH POLICY COMMISSION - 25 -
CH
APTER 3
The increase in high-severity coding for chronic obstructive pulmonary disease (COPD) illustrates this trend. COPD is an inflammatory lung disease that causes breathing difficulty, chest tightness, and a chronic cough among other symptoms. In 2013, two out of every five inpatient stays related to COPD were coded at one of the highest two severity levels (level 3 or 4). By 2018, that proportion had increased to two of every three (see Exhibit 3.1.5). Again, this increase is not due to lower-severity cases being treated outside of the hospital while only higher-severity cases remain – the absolute volume of the highest two severity levels increased by over 3,000 discharges over this period.xiii Overall, the increase in acuity (weight) for all patients with COPD DRGs over this time period was 17 percent, while length of stay for these patients declined by 3 percent and intensive care days fell sharply, by 15 percent. As noted in Exhibit 3.1.5, a shift from level 3 to level 4 results in almost a doubling of revenue to the hospital due to the difference in weights between 3 and 4.
xiii In 2013 there were 17,818 discharges with an APR-DRG for COPD; 7,157 of these discharges were severity level 3 or 4. In 2018 there were 16,017 discharges with an APR-DRG for COPD; 10,294 of these discharges were severity level 3 or 4.
INCREASES IN ACUITY DUE TO SWITCHING TO A MORE SEVERE DRG: SEPTICEMIA CASE STUDYAcuity may also be increasing due to shifts from one DRG to a different, but related DRG (for example, from asthma to COPD). One example is in the diagnosis of septicemia or sepsis, the body’s overwhelming response to an infection, which can become life-threatening if not treated promptly.xiv, 22 This disease can be underdiagnosed, leading to tissue damage, organ failure, and death. Recent sepsis awareness campaigns introduced nationally and locally seek to improve the public’s understanding of the disease, and CMS has implemented a national intervention protocol and quality measure aimed at improving early detection and treatment.23, 24 At the same time, some have raised concerns that over-labeling more minor or marginal cases as septicemia can lead to unnecessary overtreat-ment including overuse of antibiotics and unintended harm.25
xiv Sepsis is the body’s overwhelming response to infection while septice-mia refers to a bacterial infection that has entered the blood stream, also known as bacteremia. For administrative coding and billing purposes, the 3M APR™DRG is labelled as “septicemia and dissem-inated infections.” For this reason, in the remains of this section we will refer to “septicemia” since the primary focus is on coding with one exception (i.e., sepsis awareness campaigns).
201820172016201520142013
Distribution of severity level for COPD
admissions, 2013 - 2018MassHealth payment for COPD admission
by severity level, 2018
$4,976
$5,954
$7,691
$14,057
Severity 1
Severity 2
Severity 3
Severity 4
14%
45%
37%
3%
13%
43%
40%
4%
12%
40%
43%
5%
9%
36%
49%
6%
7%
29%
53%
12%
7%
29%
55%
10%
Notes: Distribution of severity level from 2013 to 2018 uses 3M APR™DRG v.30. The DRG payment example is from Mass-Health payments in 2018 based on v.34.Sources: HPC analysis of Center for Health Information and Analysis Hos-pital Inpatient Discharge Database, FY2013-FY2018; 3M APR™DRG clas-sification system v30.0; Acute Hospital MassHealth DRG Weights for 2018
Exhibit 3�1�5 Distribution of COPD severity levels, all-payer, 2013 – 2018, and payment for each severity level, 2018

HEALTH POLICY COMMISSION2019 COST TRENDS REPORT - 26 -
Septicemia shares some symptoms with and may develop from a number of other conditions, including pneumonia, urinary tract infection (UTI), and cellulitis. Patients in the hospital with some of these conditions should be monitored to ensure they do not develop septicemia. However, due to this overlap the same patient with the same symptoms could plausibly be coded as having either pneumonia or septicemia, depending on how the patient’s symptoms and diagnoses are recorded by clinicians and handled by medical coders.26, 27, 28 Financial incentives tend to encourage hospitals to code borderline cases as septicemia because of the higher weight, and hence, higher payment. In 2016, the average Massachusetts commercial payment for septicemia was $22,618, compared to $11,911 for pneumonia, $9,016 for cellulitis, and $9,193 for UTI (see Exhibit 3.1.6).xv
xv For example, one coding blog offers medical coders advice on how to increase revenue by coding sepsis rather than other similar conditions. https://www.aapc.com/blog/31689-sepsis-and-sirs-in-icd-10-cm/
As shown in Exhibit 3.1.6, the number of inpatient stays coded with the septicemia DRG increased by 22,806 cases from 2010 to 2018, while those with pneumonia, UTI, cellulitis, fever, respiratory, GI or post-operative infections combined declined by 12,353. Given the efforts to increase recognition of septicemia, this increase likely includes patients for whom the diagnosis of septicemia reflects receipt of appropriate treatment for this serious condition. The magnitude of the increase, however, suggests that coding of borderline cases as septicemia also contributes to the trend. Indeed, infectious disease doctors and researchers have urged adoption of a more stringent definition of septicemia instead of the current definition used in the CMS sepsis quality measure.xvi Adoption of a more targeted definition could both improve treatment and enable consistency in diagnosis.29
xvi The CMS sepsis quality measure uses the diagnosis criteria tool Sepsis-1, which was established in 1991. Sepsis-3 was proposed as an alternate definition in 2016, but not adopted as part of a CMS quality measure. Sepsis-3 has been adopted by the Surviving Sepsis campaign. See: https://acphospitalist.org/archives/2017/04/coding-sur-viving-sepsis-campaign.htm
Notes: Septicemia is 3M APR™DRG 720. Selection of conditions based on literature and clinical input and confirmed by examining secondary diagnosis codes in stays with septicemia DRG. Payment is the average payment for that DRG based on HPC’s analysis of claims in the Massachusetts All-Payer Claims Database v6.0 for 2016.Sources: HPC analysis of Center for Health Information and Analysis Hospital Inpatient Discharge Database, FY2010-FY2018 and All-Payer Claims Database v6.0; 3M APR™DRG classification system v26.0
Exhibit 3�1�6 Volume of inpatient stays for septicemia and select substitutable conditions for all payers, 2010 – 2018
5,000
10,000
15,000
20,000
25,000
30,000
35,000
40,000
201820172016201520142013201220112010
SEPTICEMIA �$22,618�
2010 – 2018
% Change
PNEUMONIA �$11,911�
UTI �$9,193�
CELLULITIS �$9,016�
180%
�17%
FEVER, RESPIRATORY,
GI AND POSTOPERATIVE
INFECTIONS
�15%
�19%
�14%
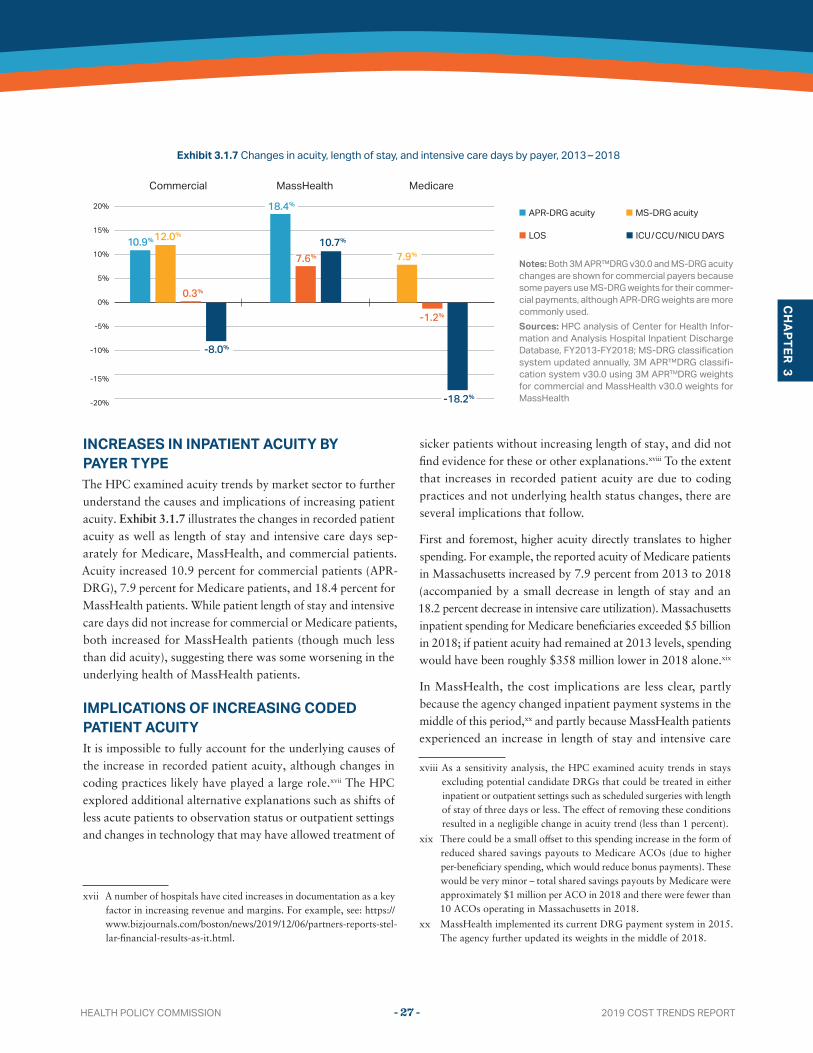
2019 COST TRENDS REPORTHEALTH POLICY COMMISSION - 27 -
CH
APTER 3
INCREASES IN INPATIENT ACUITY BY PAYER TYPEThe HPC examined acuity trends by market sector to further understand the causes and implications of increasing patient acuity. Exhibit 3.1.7 illustrates the changes in recorded patient acuity as well as length of stay and intensive care days sep-arately for Medicare, MassHealth, and commercial patients. Acuity increased 10.9 percent for commercial patients (APR-DRG), 7.9 percent for Medicare patients, and 18.4 percent for MassHealth patients. While patient length of stay and intensive care days did not increase for commercial or Medicare patients, both increased for MassHealth patients (though much less than did acuity), suggesting there was some worsening in the underlying health of MassHealth patients.
IMPLICATIONS OF INCREASING CODED PATIENT ACUITYIt is impossible to fully account for the underlying causes of the increase in recorded patient acuity, although changes in coding practices likely have played a large role.xvii The HPC explored additional alternative explanations such as shifts of less acute patients to observation status or outpatient settings and changes in technology that may have allowed treatment of
xvii A number of hospitals have cited increases in documentation as a key factor in increasing revenue and margins. For example, see: https://www.bizjournals.com/boston/news/2019/12/06/partners-reports-stel-lar-financial-results-as-it.html.
sicker patients without increasing length of stay, and did not find evidence for these or other explanations.xviii To the extent that increases in recorded patient acuity are due to coding practices and not underlying health status changes, there are several implications that follow.
First and foremost, higher acuity directly translates to higher spending. For example, the reported acuity of Medicare patients in Massachusetts increased by 7.9 percent from 2013 to 2018 (accompanied by a small decrease in length of stay and an 18.2 percent decrease in intensive care utilization). Massachusetts inpatient spending for Medicare beneficiaries exceeded $5 billion in 2018; if patient acuity had remained at 2013 levels, spending would have been roughly $358 million lower in 2018 alone.xix
In MassHealth, the cost implications are less clear, partly because the agency changed inpatient payment systems in the middle of this period,xx and partly because MassHealth patients experienced an increase in length of stay and intensive care
xviii As a sensitivity analysis, the HPC examined acuity trends in stays excluding potential candidate DRGs that could be treated in either inpatient or outpatient settings such as scheduled surgeries with length of stay of three days or less. The effect of removing these conditions resulted in a negligible change in acuity trend (less than 1 percent).
xix There could be a small offset to this spending increase in the form of reduced shared savings payouts to Medicare ACOs (due to higher per-beneficiary spending, which would reduce bonus payments). These would be very minor – total shared savings payouts by Medicare were approximately $1 million per ACO in 2018 and there were fewer than 10 ACOs operating in Massachusetts in 2018.
xx MassHealth implemented its current DRG payment system in 2015. The agency further updated its weights in the middle of 2018.
Notes: Both 3M APR™DRG v30.0 and MS-DRG acuity changes are shown for commercial payers because some payers use MS-DRG weights for their commer-cial payments, although APR-DRG weights are more commonly used.Sources: HPC analysis of Center for Health Infor-mation and Analysis Hospital Inpatient Discharge Database, FY2013-FY2018; MS-DRG classification system updated annually, 3M APR™DRG classifi-cation system v30.0 using 3M APRTMDRG weights for commercial and MassHealth v30.0 weights for MassHealth
Exhibit 3�1�7 Changes in acuity, length of stay, and intensive care days by payer, 2013 – 2018
APR-DRG acuity MS-DRG acuity LOS ICU / CCU / NICU DAYS
-20%
-15%
-10%
-5%
0%
5%
10%
15%
20%
MedicareMassHealthCommercial
10.9%12.0%
0.3%
7.6% 7.9%
-1.2%
-18.2%
18.4%
10.7%
-8.0%
APR-DRG acuity MS-DRG acuity LOS ICU / CCU / NICU DAYS
-20%
-15%
-10%
-5%
0%
5%
10%
15%
20%
MedicareMassHealthCommercial
10.9%12.0%
0.3%
7.6% 7.9%
-1.2%
-18.2%
18.4%
10.7%
-8.0%
APR-DRG acuity MS-DRG acuity LOS ICU / CCU / NICU DAYS
-20%
-15%
-10%
-5%
0%
5%
10%
15%
20%
MedicareMassHealthCommercial
10.9%12.0%
0.3%
7.6% 7.9%
-1.2%
-18.2%
18.4%
10.7%
-8.0%
APR-DRG acuity MS-DRG acuity LOS ICU / CCU / NICU DAYS
-20%
-15%
-10%
-5%
0%
5%
10%
15%
20%
MedicareMassHealthCommercial
10.9%12.0%
0.3%
7.6% 7.9%
-1.2%
-18.2%
18.4%
10.7%
-8.0%

HEALTH POLICY COMMISSION2019 COST TRENDS REPORT - 28 -
suggesting a true increase in acuity.xxi Thus, the HPC did not estimate a cost implication of increasing patient acuity among MassHealth patients.
Cost implications in the commercial sector are also difficult to estimate but are likely significant. Like Medicare patients, there was no observed increase in length of stay or intensive care use among commercial patients. However, some payers may have contract features with hospitals and providers whereby acuity increases are offset with payment reductions elsewhere. In addition, a few payers updated the weights they apply to a DRG/severity level in the middle of our period (see Sidebar: DRG Systems, DRG Weights, and Prices). These updates tend to offset somewhat the impact of coding the same patients into higher-severity DRGs and higher-severity levels. Nevertheless, based on data from CHIA regarding what DRG systems the commercial payers in Massachusetts have used for which years, we estimate a substantial implied commercial spending increase due to increased inpatient acuity of $280 million in 2018 alone.xxii
Second, as noted earlier, increases in patient acuity and risk scores that are not related to true changes in patient health status obscure performance measures that are health-status-ad-justed. A recent study of reported mortality rates of veterans with pneumonia or heart failure found those rates appeared to improve much more than they actually did due to changes in coding practices, which led to an over-adjustment for health status in the mortality measure.30 As another example critical to Massachusetts, the performance improvement plan (PIP) provision in Chapter 224 as currently implemented calls for providers or payers to be referred to the HPC for potential improvement plans if their health-status-adjusted spending growth exceeds the benchmark (currently 3.1 percent). If an entity increases its risk score through coding efforts by 2.2 percent (the average annual risk score growth between 2013 and 2018), for example, it can avoid referral even with actual spending growth among its patient population of
xxi Although behavioral health DRGs were removed from this analy-sis, the increase in markers of acuity may include a slight effect of increased secondary diagnoses related to opioid use.
xxii This estimate is based on the following assumptions: we assume that 60 percent of commercial inpatient stays were covered by payers that used the same APR-DRG weights in 2013 and 2018 and paid hospitals proportionally according to those updates, and that another 15 percent of stays were covered by payers using the MS-DRG system which is automatically updated annually. We also assume no financial impact of increasing acuity for 25 percent of commercial inpatient stays (see Technical Appendix).
xxiii Hospital volume increased among MassHealth patients, though much of this increase was due to an increase in opioid-related admissions.
5 percent, because risk-adjusted spending would be approx-imately 2.8 percent.
SECTION 3�2: CHANGES IN COMMERCIAL INPATIENT VOLUMEThe other key inpatient trend noted in the introduction to this chapter is a decline in total inpatient stays. Unlike patient acuity changes, which have occurred for all payers, declin-ing volume has been a phenomenon mainly observed among commercially-insured patients (see Chartpack), which are the focus of the remainder of this chapter.xxiii Increasing hospital inpatient spending (due to both rising patient acuity and rising prices) combined with flat or declining commercial volume has resulted in rapidly increasing spending per hospital stay (see Exhibit 3.2.1). Indeed, hospital spending for commercial hospital stays grew 5.2 percent per year from 2013 to 2018, from approximately $14,500 to $18,700.
The decline in inpatient admissions may reflect a true change in population health needs, changes in clinical practice, or shifts to other sites of care. Trends in volume have important
Change in spending since 2013
-15%
-10%
-5%
0%
5%
10%
15%
201820172016201520142013
Change in volume since 2013
248K
217K
$3.6B
$4.1B
Notes: Data points indicate percent growth from previous year (2013=0). Volume data correspond to fiscal years while spending data correspond to calendar years.Sources: HPC analysis of Center for Health Information and Analysis Hospital Inpatient Discharge Database, FY2013-FY2018 and commercial full-claims total medical expenditures from Center for Health Information and Analysis Annual Report Total Medical Expenditures Databooks: 2019 Annual report (for 2017-8 growth), 2018 Annual Report (for 2015-6 and 2016-7), 2017 annual report (for 2014-2015) and 2016 Annual Report (for 2013-4 growth)
Exhibit 3�2�1 Cumulative change in commercial inpatient hospital volume and commercial inpatient hospital spending, 2013 – 2018
Change in spending since 2013
-15%
-10%
-5%
0%
5%
10%
15%
201820172016201520142013
Change in volume since 2013
248K
217K
$3.6B
$4.1B

2019 COST TRENDS REPORTHEALTH POLICY COMMISSION - 29 -
CH
APTER 3
implications for hospital capacity and financing, and for overall spending in the Commonwealth. The HPC examined the trend in inpatient stays to understand the drivers behind the decline.
DECLINE IN INPATIENT ADMISSIONS BY TYPE OF ADMISSIONThe HPC divided all admissions into four categories: behavioral health-related (BH), maternity, admissions from the emergency department (ED), and scheduled (see Technical Appendix). BH admissions include all stays where the primary diagnosis was for a mental health or substance use disorder. Maternity stays are those directly related to childbirth, dilation and curettage surgeries, and conditions arising in the ante- and post-partum periods. Admissions from the emergency department (ED) were any stays that originated in an emergency department. The remaining admissions were labeled as scheduled. These are typically admissions where a provider has requested a bed to be reserved for the patient for surgery or other medical treatment.
From 2013 to 2018, the largest declines were for scheduled admissions and for maternity admissions (19.4 percent and 13.1 percent, respectively; see Exhibit 3.2.2). These two cate-gories accounted for nearly 90 percent of the overall decline
in commercial inpatient volume from 2014 to 2018.xxiv Admis-sions from the ED and BH-related stays were relatively flat during this period, accounting for only 12 percent of the decline in volume.xxv
DECLINE IN MATERNITY-RELATED ADMISSIONSThe drop in maternity-related admissions appears to be directly related to a change in population characteristics, namely a drop in birth rates. From 2011 to 2016, the most recent years available, Massachusetts Department of Public Health (DPH) vital records show a 3.9 percent decline in the rate of births to Massachusetts residents (from 54.1 to 52.0 per 1000 women aged 15-44), mirroring national trends.31, 32 During this same time period, the number of maternity-related commercial-ly-insured inpatient stays in Massachusetts fell by a similar 4.5 percent (similar to data in Exhibit 3.2.2, but over slightly different years to match the DPH data).
xxiv Admissions from the ED dropped between 2013 and 2014 according to the Hospital Discharge Data. Because this one-year change appears anomalous (and may be due to changes in data definitions), the remain-der of the chapter focuses primarily on the 2014 to 2018 period.
xxv The Center for Health Information and Analysis HIDD only captures admissions from acute-care hospitals. Behavioral health hospitals are not included in this data set. For more information see Technical Appendix: Data Sources.
Notes: Maternity includes all dis-charges with a maternity-related DRG. ED admissions include all discharges with an ED flag or ED-specific revenue code. Behavioral health (BH) discharges include all discharges with a BH diagnosis as the primary diagno-sis. Scheduled includes remaining discharges. All figures reflect rounding.Sources: HPC analysis of Center for Health Information and Analysis Hospital Inpatient Discharge Data-base, FY2013 – FY2018
201820172016201520142013
MATERNITY
ADMISSIONS FROM THE ED
SCHEDULED
BEHAVIORAL HEALTH
21.821.3
20.4
19.418.7 18.9
20.3
18.3 18.2 18.3 18.0 18.1
14.4 14.013.5
12.3 12.011.6
4.3 4.5 4.2 4.0 4.0 4.0
Maternity Scheduled Admissions
from the ED
44.6% 43.4% 8.9% 3.2%
CONTRIBUTION TO DECLINE, 2014 � 2018
INPATIENT DISCHARGES PER 1,000 COMMERCIAL POPULATION, 2013 � 2018
Behavioral
Health
Exhibit 3�2�2 Inpatient admissions per 1,000 commercial members by type of admission and contribution to volume decline, FY 2013 – FY 2018

HEALTH POLICY COMMISSION2019 COST TRENDS REPORT - 30 -
Not all Massachusetts hospitals have experienced this decline in births equally (see Exhibit 3.2.3). Community high public payer hospitals (HPP) experienced the largest decline among hospital types, with a 19.9 percent decline in the volume of births from 2014 to 2018. During this same four-year period, academic medical centers (AMC) and other teaching hospitals experienced a much smaller decline (7.6 percent and 2.5 percent, respectively). This differential loss of maternity-related admis-sions has resulted in a decline in the proportion of overall births occurring in all community hospitals–from a high of 50.1 percent in 2016 to 47.9 percent in 2018. Maternity-re-lated admissions are an essential source of revenue for many
community hospitals, but the trend in births shifting away from community hospitals coupled with a declining birth rate overall is likely related to some maternity services closing or proposing to be closed in the state.33 Lack of local maternity beds can be problematic from the perspective of women not having a choice to deliver closer to home, while more maternity stays occurring in more expensive settings is problematic from a cost containment perspective.
DECLINE IN SCHEDULED INPATIENT ADMISSIONS AND SHIFTS TO OUTPATIENT SETTINGSAs with maternity admissions, the decline in scheduled inpatient volume was much greater among community HPP hospitals; volume for these hospitals declined 32.3 percent, compared with 15.6 percent for AMCs. Though some of the declining volume could be related to changes in underlying population health needs and changes in clinical practice (see Sidebar: Appendectomy),34, 35, 36 shifts in care from inpatient to outpatient settings also likely account for some portion of the decline in the number of scheduled inpatient admissions observed in
Exhibit 3.2.2.xxvi
xxvi Between 2014 and 2018 the number of scheduled hip and knee proce-dures increased markedly, by roughly 1,000 commercial admissions. If this had not happened, the decline in scheduled admissions would have been larger.
Notes: Maternity includes all discharge with Major Diagnostic Category 14 (MDC 14 and 15). All figures reflect rounding.Sources: HPC analysis of Center for Health Information and Analysis Hospital Inpatient Discharge Database, FY2014 – FY2018
2014 2018
0
5,000
10,000
15,000
20,000
25,000
30,000
35,000
Teaching
Hospital
Community
Hospital
Community
High Public Payer
Hospital
Academic Medical
Center
-7.6%
-19.9%
-9.7%
-2.5%
2014 2018
0
5,000
10,000
15,000
20,000
25,000
30,000
35,000
Teaching
Hospital
Community
Hospital
Community
High Public Payer
Hospital
Academic Medical
Center
-7.6%
-19.9%
-9.7%
-2.5%
2014 2018
0
5,000
10,000
15,000
20,000
25,000
30,000
35,000
Teaching
Hospital
Community
Hospital
Community
High Public Payer
Hospital
Academic Medical
Center
-7.6%
-19.9%
-9.7%
-2.5%
Community high public payer hospitals (HPP) experienced the largest decline
among hospital types, with a 19.9 percent decline in the volume of births
from 2014 to 2018
Exhibit 3�2�3 Maternity discharges by hospital cohort, 2014 – 2018

2019 COST TRENDS REPORTHEALTH POLICY COMMISSION - 31 -
CH
APTER 3
SIDEBAR: APPENDECTOMYOne example of a clinical practice change leading to a decline in inpatient admissions is appendectomy. Appen-dectomy refers to the removal of an inflamed appendix to prevent rupture and further spread of infection. The procedure is relatively common, with about 300,000 per-formed in the U.S. annually.37 Yet the number of commercial inpatient stays in which appendectomies were performed in Massachusetts declined from 3,808 in 2011 to 1,579 in 2014 to 1,094 in 2018 (most inpatient stays where appen-dectomies are performed result from an ED visit, though some are also scheduled). Clinical practice for treating an inflamed appendix has been changing in recent years. First, clinicians have increased use of radiology to confirm the need for an appendectomy, preventing some unnecessary pre-operative procedures. Also, researchers have discov-ered non-surgical methods to treat an inflamed appendix, such as the increasing use of antibiotics. In a 2016 study, antibiotics (e.g. Ertapenem) were found to be just as effec-tive as surgery.38 Analysis of the APCD confirmed that the decline in inpatient appendectomy procedures was not due to a shift to outpatient settings; the share of appendecto-mies taking place in inpatient settings remained unchanged at approximately 37 percent between 2015 and 2017.
When we examine the individual APR-DRGs responsible for the largest decline in the volume of commercial scheduled admissions between 2014 and 2018, those that stand out are admissions involving female oncology and reproductive system procedures (e.g., mastectomy, hysterectomy, ovarian cyst removal), musculoskeletal procedures such as disc removal and spinal fusion, and surgical bowel procedures. Many of these have been examined previously. In both the 2015 and 2017 Cost Trends Reports, the HPC highlighted trends in a particular set of “cross-over” procedures (mostly surgeries) that were commonly performed in either inpatient settings or on an outpatient basis.39, 40 These cases demonstrated a gradual shift from inpatient to outpatient settings, consistent with overall U.S. trends. Nationally, the share of all hospital-based surgeries performed in inpatient settings dropped from 36.8 percent in 2008 to 33.0 percent in 2016.41
Here, we revisit these cross-over procedures as well as addi-tional surgical procedures with the potential to shift settings (see Exhibit 3.2.4). From FY2013 to FY2018, these 11 surgical case studies, defined by major procedure performed rather than by DRG (so they can be identified in both inpatient and outpatient settings), collectively accounted for 21.3 percent of the overall decline in commercial inpatient admissions and 39.1 percent of scheduled admissions.
Description 2013 2018 Difference Percent change
Hysterectomy, abdominal and vaginal 2,748 1,035 1,713 -62%
Appendectomy 2,174 1,094 1,080 -50%
Cholecystectomy and common duct exploration 2,252 1,539 713 -32%
Percutaneous transluminal coronary angioplasty 2,495 1,926 569 -23%
Other vascular catheterization, not heart 2,310 1,795 515 -22%
Other hernia repair 897 391 506 -56%
Thyroidectomy, partial or complete 636 171 465 -73%
Spinal fusion 2,885 2,628 257 -9%
Diagnostic cardiac catheterization, coronary arteriography 1,850 1,658 192 -10%
Mastectomy 666 506 160 -24%
Inguinal and femoral hernia repair 154 93 61 -40%
Notes: Procedures are identified and grouped according to the Clinical Classification System (see Technical Appendix for more detail). All figures reflect rounding. Each procedure identified in the table was the main procedure performed during an inpatient admission.Sources: HPC analysis of Center for Health Information and Analysis Hospital Inpatient Discharge Database, FY2013 – FY2018
Exhibit 3�2�4 Number of selected commercial inpatient discharges in Massachusetts, according to major surgical procedure, 2013 and 2018

HEALTH POLICY COMMISSION2019 COST TRENDS REPORT - 32 -
In order to determine whether these declines represent further shifts to outpatient settings, the HPC selected three cases from Exhibit 3.2.4 for further study (hysterectomy, spinal fusion, and mastectomy) among commercial patients in the APCD, where these surgeries can be identified in both inpatient and outpatient settings.xxvii Exhibit 3.2.5 shows that for these three case studies, and for all cases identified in Exhibit 3.2.4, there was indeed a significant shift from inpatient to outpatient set-tings. For example, of all abdominal and vaginal hysterectomies performed in 2015, 43 percent took place in inpatient settings while 57 percent took place in outpatient settings. Just two years later, these proportions had shifted to 32 percent and 68 percent, respectively.
xxvii The data in Exhibit 3.2.4 represent all payers and originate from inpatient discharge data, which does not include surgeries performed in outpatient settings.
As noted earlier, declining volume in scheduled inpatient pro-cedures has not been uniform across types of hospitals, with a loss of volume being experienced in particular by community HPP hospitals. With respect to cases that may be shifting from inpatient to outpatient settings, if those hospitals were retaining that lost volume in their outpatient facilities, then the financial impact on their systems and on the market as a whole might be relatively minor. However, this does not appear to be the case.
20172015201720152017201520172015
47.1%
52.9%
45.3%
54.7%
91.2%
8.8%
86.0%
14.0%
60.0%
40.0%
54.3%
45.7%
42.6%
57.4%
32.2%
67.8%
ALL CASE STUDY PROCEDURES SPINAL FUSION MASTECTOMYHYSTERECTOMY,
ABDOMINAL AND VAGINAL
Outpatient Inpatient
100%
0%
100%
0%
Notes: Procedures are identified and grouped according to the Clinical Classification System (see Technical Appendix). All figures reflect rounding. Each procedure identified in the figure was the main procedure performed during an inpatient admission.Sources: HPC analysis of Center for Health Information and Analysis All-Payer Claims Database v7.0
Exhibit 3�2�5 Percent of surgeries taking place in inpatient and outpatient settings for select case studies, 2015 – 2017

2019 COST TRENDS REPORTHEALTH POLICY COMMISSION - 33 -
CH
APTER 3
Exhibit 3.2.6 shows the change in the inpatient and outpa-tient volume by hospital system for hysterectomy. The figure also shows the net change in volume, combining changes in inpatient and outpatient volume; hospital systems are sorted top to bottom by the highest net growth in volume. While most systems experienced declines in inpatient volume for these procedures, some were better able to make up for the loss with increases in their outpatient settings. Overall, the
systems losing net volume tended to include more lower-priced community hospitals while those gaining were more likely to include higher-priced AMCs.
These cross-provider system shifts in outpatient care have implications for changes in overall spending which are explored further in the next chapter.
xxviii In November 2019 Partners HealthCare announced it was changing its system name to Mass General Brigham. Since this report uses 2017 data that does not include all the hospitals within the Mass General Brigham hospital system, the report uses the Partners name.
All others
Steward
Southcoast
Wellforce
Cape Cod
Baystate Health
South Shore
Lahey
UMass
Beth Israel
Partners
Net change in volume Outpatient change in volume Inpatient change in volume
GA
INE
D V
OL
UM
EL
OS
T V
OL
UM
E
68
48
50
110
-42
-2
8
3
5
17
-16
-6
1
-3
-4
-9
6
-14
-23
-13
-3
-10
-15
-27
12
-10
10
13
7
1
-60
20
-80
Notes: The analysis only includes codes for hysterectomies that might reasonably be performed in an outpatient setting. These cases excluded complicated hysterectomy, maternity-related hysterectomy, and hysterectomies that involved cervical, uterine, or ovarian cancer. Hospital systems as shown include ownership as of 2017. Outpatient surgeries taking place at off-campus hospital sites for these hospitals are included. Partnersxxviii includes: Massachusetts General, Brigham & Women’s, Brigham & Women’s Faulkner, Cooley Dickinson, Martha’s Vineyard, Nantucket Cottage, Newton-Wellesley, and North Shore Medical Center. Beth Israel includes: Beth Israel Deaconess Medical Center, BID-Milton, BID-Needham, and BID-Plymouth. UMass Memorial includes: UMass Memorial Medical Center, Clinton, HealthAlliance, and Marlborough. Lahey includes: Lahey Hospital & Medical Center, Northeast, and Winchester. Baystate Health includes: Baystate Medical Center, Baystate Franklin Medical Center, Baystate Noble, and Baystate Wing. Cape Cod includes: Cape Cod and Falmouth. Wellforce includes: Tufts Medical Center, Lowell General, and Hallmark. Steward includes: St. Elizabeth’s Medical Center, Carney, Good Samaritan Medical Center, Holy Family, Morton, Nashoba Valley Medical Center, Norwood, and Saint Anne’s. South Shore and Southcoast were independent in 2017.Sources: HPC analysis of Center for Health Information and Analysis All-Payer Claims Database v7.0
Exhibit 3�2�6 Change in volume of hysterectomy procedures by hospital system, 2015 – 2017

HEALTH POLICY COMMISSION2019 COST TRENDS REPORT - 34 -
REFERENCES1 Health Policy Commission. 2018 Cost Trends Report.
Feb. 2019 Available at: https://www.mass.gov/doc/2018-report-on-health-care-cost-trends.
2 Health Policy Commission Board meeting Sept. 11, 2019. Available at: https://www.mass.gov/doc/presentation-board-meeting-september-11-2019/download.
3 Cox, C, Semanskee A, Claxton G, Levitt L. Explaining Health Care Reform: Risk Adjustment Reinsurance, and Risk Corridors. Kaiser Family Foundation. Aug. 17, 2016. Available at: https://www.kff.org/health-reform/issue-brief/explaining-health-care-reform-risk-adjustment-re-insurance-and-risk-corridors/.
4 Landon BE, Mechanic RE. The Paradox of Coding: Policy Concerns in the Move to Risk-Based Provider Contracts. The New England journal of medicine. 2017 Sep 28;377(13):1211.
5 Federal Register. Volume 78. Number 47. March 11, 2013. Patient Protection and Affordable Care Act; HHS Notice of Benefit and Payment Parameters for 2014. Available at: https://www.govinfo.gov/content/pkg/FR-2013-03-11/html/2013-04902.htm.
6 Health Policy Commission. Pre-f i led test i -mony for 2019 Cost Trends Hearing. Oct, 2019. Available at: https://www.mass.gov/info-details/testimony-for-the-2019-health-care-cost-trends-hearing.
7 Centers for Disease Control, National Center for Chronic Disease Prevention and Health Promotion, Division of Pop-ulation Health, Behavioral Risk Factor Surveillance System data. Page last updated Sept. 13, 2017. Available at: https://www.cdc.gov/brfss/.
8 Massachusetts Department of Public Health. Life expectancy rises in Massachusetts, breaking with national trend. Dec. 26, 2018. Available at: https://www.mass.gov/news/life-expectan-cy-rises-in-massachusetts-breaking-with-national-trend.
9 Chilingerian, J. Origins of DRGs in the United States: A technical, political and cultural story. In J. Kimberly, G. De Pouvourville, & T. D’Aunno (Eds.), The Globalization of Managerial Innovation in Health Care (pp. 4-33). Cambridge: Cambridge University Press. 2008.
10 White C. Why did Medicare spending growth slow down?. Health Affairs. 2008 May;27(3):793-802.
11 Rhee C, Kadri SS, Danner RL, Suffredini AF, Massaro AF, Kitch BT, Lee G, Klompas M. Diagnosing sepsis is subjective and highly variable: a survey of intensivists using case vignettes. Critical Care. 2016 Dec 1;20(1):89.
12 Hale, D. Respiratory failure in COPD patients [Blog post]. Apr. 2010. Available at: https://acphospitalist.org/archives/2010/04/coding.htm.
13 Silverman E, Skinner J. Medicare upcoding and hospital own-ership. Journal of health economics. 2004 Mar 1;23(2):369-89.
14 Dafny LS. How do hospitals respond to price changes?. Amer-ican Economic Review. 2005 Dec;95(5):1525-47.
15 Geruso M, Layton T. Upcoding or selection? Evidence from Medicare on squishy risk adjustment. NBER Working Paper. 2015 Oct 21;21222.
16 RevenueXL. Does an Electronic Medical Record/Electronic Health record Software system increase revenues?. Accessed Jan. 23, 2020. Available at: https://www.revenuexl.com/does-emr-ehr-increase-revenues.
17 Landon BE, Mechanic RE. The Paradox of Coding: Policy Concerns in the Move to Risk-Based Provider Contracts. The New England journal of medicine. 2017 Sep 28;377(13):1211.
18 Gowrisankaran G, Joiner KA, Lin J. How do Hospitals Respond to Payment Incentives?. National Bureau of Eco-nomic Research; 2019 Nov 14.
19 Li B. Cracking the codes: do electronic medical records facil-itate hospital revenue enhancement. Evanston (IL): Kellogg School of Management, Northwestern University. 2014 Jan 18.
20 Adler-Milstein J, Jha AK. No evidence found that hospitals are using new electronic health records to increase Medicare reimbursements. Health Affairs. 2014 Jul 1;33(7):1271-7.
21 Center for Health Information & Analysis. Payer-reported Relative Price. Aug. 2019.
22 Sepsis Alliance. What is Sepsis. Accessed: Jan. 2020. Available at: https://www.sepsis.org/sepsis-basics/what-is-sepsis/.
23 CDC. Get Ahead of Sepsis. Accessed Jan. 2020. Available at:https://www.cdc.gov/sepsis/index.html.
24 Betsy Lehman Center for Patient Safety. Sepsis Smart. Available at: https://www.mass.gov/info-details/sepsis-smart.
25 Klompas M, Calandra T, and Singer M. “Antibiotics for sepsis—finding the equilibrium.” JAMA 320.14 (2018): 1433-1434.
26 Rhee C, Kadri S, Huang SS, Murphy MV, Li L, Platt R, Klompas M. Objective sepsis surveillance using electronic clinical data. infection control & hospital epidemiology. 2016 Feb;37(2):163-71.
27 Rhee C, Dantes RB, Epstein L, Klompas M. Using objective clinical data to track progress on preventing and treating sepsis: CDC’s new ‘Adult Sepsis Event’ surveillance strategy. BMJ Quality and Safety. 2019 Apr 1;28(4):305-9.

2019 COST TRENDS REPORTHEALTH POLICY COMMISSION - 35 -
CH
APTER 3
28 Rhee C, Dantes R, Epstein L, Murphy DJ, Seymour CW, Iwashyna TJ, Kadri SS, Angus DC, Danner RL, Fiore AE, Jernigan JA. Incidence and trends of sepsis in US hospitals using clinical vs claims data, 2009-2014. JAMA. 2017 Oct. 3;318(13):1241-9.
29 Singer M, Deutschman CS, Seymour CW, et al. The Third International Consensus Definitions for Sepsis and Septic Shock (Sepsis-3). JAMA. 2016;315(8):801–810. doi:10.1001/jama.2016.0287.
30 Silva GC, Jiang L, Gutman R, Wu WC, Mor V, Fine MJ, Kressin NR, Trivedi AN. Mortality trends for veterans hospitalized with heart failure and pneumonia using claims-based vs clinical risk-adjustment variables. JAMA Internal Medicine. 2019 Dec. 20.
31 Massachusetts DPH. Massachusetts Births 2016. May 2018. Available at: https://www.mass.gov/doc/2016-birth-report/download.
32 CDC NCHS NVSS. Births: Provisional Data for 2018. Report No. 007. May 2019. Available at: https://www.cdc.gov/nchs/data/vsrr/vsrr-007-508.pdf.
33 Barnes, J. State Says It Can’t Stop Tobey Maternity Clo-sure. SouthCoast Today. Oct. 28, 2019. Available at: https://www.southcoasttoday.com/news/20191028/state-says-it—cant-stop-tobey-maternity-closure.
34 Altman KW, Prufer N, Vaezi MF. A review of clinical prac-tice guidelines for reflux disease: toward creating a clinical protocol for the otolaryngologist. The Laryngoscope. 2011 Apr.;121(4):717-23.
35 Amin AP, Pinto D, House JA, Rao SV, Spertus JA, Cohen MG, Pancholy S, Salisbury AC, Mamas MA, Frogge N, Singh J. Association of same-day discharge after elective percutaneous coronary intervention in the United States with costs and outcomes. JAMA Cardiology. 2018 Nov. 1;3(11):1041-9.
36 Salminen P, Paajanen H, Rautio T, Nordström P, Aarnio M, Rantanen T, Tuominen R, Hurme S, Virtanen J, Mecklin JP, Sand J. Antibiotic therapy vs appendectomy for treatment of uncomplicated acute appendicitis: the APPAC randomized clinical trial. Jama. 2015 Jun. 16;313(23):2340-8.
37 Livingston EH, Fomby TB, Woodward WA, Haley RW. Epide-miological similarities between appendicitis and diverticulitis suggesting a common underlying pathogenesis. Archives of Surgery. Mar. 1 2011;146(3):308-14.
38 Salminen P, Paajanen H, Rautio T, Nordström P, Aarnio M, Rantanen T, Tuominen R, Hurme S, Virtanen J, Mecklin JP, Sand J. Antibiotic therapy vs appendectomy for treatment of uncomplicated acute appendicitis: the APPAC randomized clinical trial. Jama. 2015 Jun. 16;313(23):2340-8.
39 Health Policy Commission. 2015 Cost Trends Report. Jan. 2016. Available at: https://www.mass.gov/doc/2015-cost-trends-report-1.
40 Health Policy Commission. 2017 Cost Trends Report. Mar. 2018. Available at: https://www.mass.gov/doc/2017-health-care-cost-trends-report.
41 American Hospital Association (2018). Trendwatch Chartbook 2018: Trends affecting Hospitals and Health Systems; special data request.

$
CHAPTER 4: HOSPITAL OUTPATIENT SPENDING GROWTH
Shifting of hysterectomy from inpatient to outpatient settings would save money, yet savings are eroded by price increases in both settings and a shifting of surgery cases from low-cost hospitals to high-cost hospitals.
Hospital outpatient spending accounts for 60 percent of hospital spending for commercially-insured residents, with outpatient surgery accounting for more than a third of total hospital outpatient spending. Spending in this subcategory grew 11 percent from 2015 to 2017.
Among outpatient surgery episodes, spending on major surgery grew 9.5 percent from 2015 to 2017, driven by a 10.2 percent increase in hospital payments per episode.
Among the six highest-volume hospitals, payments per major outpatient surgery episode were nearly twice as high at Massachusetts General Hospital and Brigham and Women’s Hospital as the lowest-paid high-volume hospital.
2x

2019 COST TRENDS REPORTHEALTH POLICY COMMISSION - 37 -
CH
APTER 4
CHAPTER 4: HOSPITAL OUTPATIENT SPENDING GROWTHIn 2018, hospital outpatient spending accounted for nearly 20 percent of all health care spending in Massachusetts.i In the commercial sector, hospital outpatient spending is even more prominent, accounting for 25 percent of all spending and exceeding hospital inpatient spending (17 percent of all spending).ii Hospital outpatient spending has also been grow-ing relatively quickly, particularly in the commercial market. Spending increased $700 million (from $5.1 billion to $5.8 billion) between 2015 and 2018 and accounted for 31 percent of all commercial spending growth over that time period. As noted in Chapter 3, some of this growth can be attributed to moving certain procedures from an inpatient setting to an out-patient setting, although these shifts cannot explain the majority of the growth.iii This chapter focuses on drivers of commercial
i When CHIA reports total medical expenditures, hospital outpatient (and inpatient) spending only includes the facility component (the portion paid directly to the hospital) of a patient’s encounter, not any of the professional spending.
ii Community hospitals, on average, derive roughly two-thirds of their commercial revenue from outpatient services.
hospital outpatient spending and growth. Hospital outpatient includes services that are performed either within the hospital’s main campus or at an off-campus satellite hospital site (see Exhibit 4.1 and Sidebar: Hospital Outpatient Departments).
iii For example, the number of commercial inpatient stays declined by 13,000 between 2015 and 2018, including a decline of 6,500 scheduled admissions. Even if most of those admissions were treated in outpatient settings, they would account for only a small fraction of outpatient spending growth between 2015 and 2018.
iv All of the surgeries studied had to have a billing NPI listed on the facility bill for an in-state acute care hospital in Massachusetts.
INPATIENT OUTPATIENT
OUTPATIENT
Hospital main campus Hospital o�-campus satellite
Exhibit 4�1 Hospital outpatient departments
HOSPITAL OUTPATIENT DEPARTMENTSThe focus of this chapter is the spending and services that take place in the hospital outpatient departments of acute care hospitals in Massachusetts (a very small fraction – less than 5 percent – of surgeries included in some of the topline figures occur in ambulatory surgery centers, urgent care centers, or other settings that have a facility compo-nent). Hospital outpatient departments provide a range of medical services including regular doctor visits, emergency department visits, surgeries, imaging, and labs. These services could be performed either within the hospital’s
main campus or at an off-campus satellite hospital site, which could be far from the hospital. For this work the HPC does not distinguish between these two types of settings if both were billed by the same acute care facility.iv Most reporting of hospital outpatient spending only includes payments that go directly to the hospital and excludes payments to physicians and other professionals involved in the encounter. In some instances in this chapter, as noted, the HPC includes these professional payments as well as those received by the hospital (see Technical Appendix).

HEALTH POLICY COMMISSION2019 COST TRENDS REPORT - 38 -
In order to understand better what services have driven growth in commercial hospital outpatient spending, the HPC first grouped all claims in this category in the All-Payer Claims Data-base (APCD) into seven service sub-categories (see Technical Appendix).v Surgery comprised the largest share of commercial outpatient spending in 2017 at 34 percent (see Exhibit 4.2). Other major components of commercial hospital outpatient spending include radiology (17 percent), emergency room spending (12 percent), and administered drugs (13 percent). Of these spending categories, administered drugs grew fastest
v Data include claims from members insured by Blue Cross Blue Shield of Massachusetts, Tufts Health Plan, Harvard Pilgrim Health Care, Neighborhood Health Plan (now AllWays Health Partners), or Anthem BCBS. These payers represent roughly 71 percent of the commercial market in Massachusetts. Due to the Gobeille v. Liberty Mutual Insur-ance ruling (2016), most claims from self-insured employers are no longer included in the APCD and thus, the APCD’s representation of the commercial market is less than it would otherwise be. Since total members represented by these payers fluctuated between 2015 and 2017, all results are reported on a per-member or per-encounter basis.
(44 percent between 2015 and 2017). Growth in outpatient surgery accounted for over one-third of hospital outpatient spending growth during the period. Due to its large contribu-tion to growth and total spending, as well as its relationship to trends occurring throughout the health care system (including shifts from inpatient settings), the remainder of this chapter focuses on outpatient surgery.vi
PATTERNS IN SPENDING, PAYMENTS, AND UTILIZATION FOR MAJOR AND MINOR SURGERIESTo analyze trends in outpatient surgery, the HPC created outpatient surgery encounters from the APCD and subdi-vided these encounters into “major,” “minor,” and “other” based on the main surgical procedure taking place in each
vi Nevertheless, the other categories of spending growth are important and may indicate inefficient use of resources. They may be explored in greater depth in future reports.
Notes: Percent in grey above bars represents percent growth in spending between 2015 and 2017. Methodology based on Health Care Cost Institute’s (HCCI) 2017 Health Care Cost and Utilization Report.Sources: HPC analysis of Center for Health Information and Analysis All-Payer Claims Database v7.0
2015
2017
$0
$100
$200
$300
$400
$500
OtherObservationLab/pathologyEmergency
room
Administered
drug
RadiologyOP surgery
34.1%16.6
%12.9
%
12.1
%
9.3
%13.0
%1.9%
10.7%
12.4%
43.8%12.3%
10.5%
-3.2%
-2.7%
HOSPITAL OUTPATIENT SPENDING IN 2017
2015
2017
$0
$100
$200
$300
$400
$500
OtherObservationLab/pathologyEmergency
room
Administered
drug
RadiologyOP surgery
34.1%16.6
%12.9
%
12.1
%
9.3
%
13.0
%1.9%
10.7%
12.4%
43.8%12.3%
10.5%
-3.2%
-2.7%
HOSPITAL OUTPATIENT SPENDING IN 2017
2015
2017
$0
$100
$200
$300
$400
$500
OtherObservationLab/pathologyEmergency
room
Administered
drug
RadiologyOP surgery
34.1%16.6
%12.9
%
12.1
%
9.3
%
13.0
%1.9%
10.7%
12.4%
43.8%12.3%
10.5%
-3.2%
-2.7%
HOSPITAL OUTPATIENT SPENDING IN 2017
Exhibit 4�2 Hospital outpatient spending per member-year by HCCI outpatient service category, 2015 – 2017

2019 COST TRENDS REPORTHEALTH POLICY COMMISSION - 39 -
CH
APTER 4
encounter.vii, 1 For purposes of this study, major outpatient surgeries included invasive therapeutic surgeries that typically involve an operating room, anesthesia, and incisions or other manipulation that penetrates the skin (e.g., knee replace-ments, hysterectomy). Minor outpatient surgeries are defined as therapeutic or diagnostic surgeries that are not classified as major outpatient surgeries, but may include percutaneous and endoscopic procedures (e.g., colonoscopies, biopsies).
“Other” encounters included various minor procedures such as an intrauterine device (IUD) placement and ear wax removal. Under this classification system, major outpatient surgical episodes comprised just under half of outpatient surgery spend-ing (49 percent), minor episodes accounted for 27 percent of spending, and “other” represented 24 percent.
Surgery payments included a hospital component that reflects fees for overhead (such as operating room use, equipment, and nursing staff), as well as a professional component that
vii Each outpatient surgery encounter was anchored with a facility claim indicating surgery, and then included all claims (facility and profes-sional) for the same member occurring at same site on the same day as the anchoring facility claim. Pre-operative testing that took place outside this window as well as any follow-up care related to the surgery was not included in the surgery encounter for this analysis. For more details on the HPC’s outpatient surgery encounter methodology, see Technical Appendix.
reflects fees for surgeon and anesthesiology services. Most spending for hospital outpatient surgical encounters was for the hospital component (71 percent, compared to 29 percent for professional fees).
Total spending for major outpatient surgery episodes grew 9.5 percent from 2015 to 2017 (see Exhibit 4.3). This growth was driven primarily by growth in payment per episode (8.6 percent, from $8,246 to $8,955), which in turn was driven more by growth in payment for the hospital component (10.2 percent) than growth in payment for the professional component (4.8 percent).viii Only a small portion of spending growth was driven by an increase in the number of major outpatient surgeries, which grew just under 1 percent over this period.
Minor surgeries showed the opposite dynamic. Total spending increased 6.8 percent between 2015 and 2017 but was pri-marily driven by an increase in volume (5.6 percent). Growth in payment per surgery was minimal ($3,157 in 2015 and $3,192 in 2017).ix
viii Increasing complexity is an unlikely explanation for the rising pay-ments; the average relative value unit (RVU) of the main procedure in the encounter, a measure of complexity, only increased by 1 percent over the period.
ix As with major surgeries, the complexity (RVUs) of an average proce-dure remained virtually unchanged (-0.2 percent).
Professional
payment
Facility
payment
Total
payment
Total
volume
Total
spending
PER ENCOUNTERPER MEMBER
9.5%
0.8%
8.6%
10.2%
4.8%
Professional
payment
Facility
payment
Total
payment
Total
volume
Total
spending
PER ENCOUNTERPER MEMBER
6.8%
5.6%
1.1%
0.8%
2.0%
MAJOR SURGERY MINOR SURGERY
Notes: Total spending and payments include all facility and professional claim lines associated with an encounter. N is total number of distinct surgery encounters with at least one surgery facility fee. Results adjusted for member months.Sources: HPC analysis of Center for Health Information and Analysis All-Payer Claims Database v7.0; AHRQ surgery flags
Exhibit 4�3 Growth in spending, volume, and payments for major and minor outpatient surgeries, 2015 – 2017

HEALTH POLICY COMMISSION2019 COST TRENDS REPORT - 40 -
MAJOR OUTPATIENT SURGERIESA more in-depth examination of the top subcategories of major outpatient surgeries reveals a number of additional important trends. Exhibit 4.4 displays the top 12 types of major out-patient surgery in terms of total spending, ordered from top to bottom by volume. Together, these procedure categories represent 39 percent of volume and 34 percent of spending on major outpatient surgeries in 2017.
Consistent with Exhibit 4.3, payments rose for all of the top surgical categories, typically between 5 percent and 10 percent from 2015 to 2017. For most categories, relative value units (RVUs) did not change appreciably, suggesting that the payment increases were not capturing increases in complexity or medical need.2 One exception was “other hernia repair,” for which the average RVU for the encounter increased by 6 percent. This category was also noted in the previous chapter (Exhibit 3.2.4) as a procedure with declining inpatient volume. It is possible that, as more hernia repair surgeries are done in outpatient
rather than inpatient settings, the cases that shift from inpatient settings are somewhat more complex than those that had been performed in outpatient settings previously. If so, this could potentially explain some of the increase in complexity across all hospital outpatient “other hernia repairs.”
Changes in volume were more mixed. Several procedures declined in volume over the study period, including some knee and joint procedures, lumpectomy, and decompression of peripheral nerve. Reductions in volume could be due to a shift from hospital outpatient to physician office settings and/or changes in technology and clinical practice. Other procedures, such as myringotomy (placement of ear tubes), tonsillectomy/adenoidectomy, and hysterecomy, saw large increases in volume. See Sidebar: Growth in Children’s Surgery: Myringotomy and Tonsillectomy/Adenoidectomy.
Hysterectomy was highlighted in Chapter 3 as an example of a procedure that has shifted from inpatient to outpatient set-tings, and Exhibit 4.4 is consistent with that finding, showing
MAJOR SURGERIES 2017 PERCENT CHANGE 2015 TO 2017
N Payment per surgery
N per member
Payment per surgery
Complexity (RVU)
Excision of the knee cartilage 3065 $ 6,171 -14% 4% 1%
Tonsillectomy and/or adenoidectomy 2498 $ 6,456 8% 7% 1%
Lumpectomy, quadrantectomy of breast 2354 $ 9,212 -8% 12% 3%
Inguinal and femoral hernia repair 2182 $ 8,765 -3% 9% -1%
Decompression of peripheral nerve 1926 $ 4,818 -8% 6% 1%
Lens and cataract procedures 1922 $ 4,804 4% 8% 0%
Other hernia repair 1755 $ 8,745 4% 6% 6%
Myringotomy 1695 $ 4,964 11% 10% 0%
Cholecystectomy and common duct exploration 1683 $ 8,542 -4% 4% 0%
Hysterectomy, abdominal and vaginal 1353 $ 13,737 29% 8% 2%
Plastic procedures on nose 1211 $ 11,668 -2% 12% 3%
Bunionectomy or repair of toe deformities 1124 $ 7,748 -7% 7% 0%
Notes: Categories of major outpatient surgeries shown in table are among the top 15 in overall spending, have at least 1,000 surgeries in 2017, and represent at least 1 percent of total major outpatient surgery spending. Several categories in the top 15 were removed due to non-specific collections of surgeries and heterogeneity within the category. These included: “other intraocular procedures”, “other OR procedures on joints,” “other OR procedures on skin,” and “other therapeutic procedures on musculoskeletal system.” Changes from 2015 to 2017 are reported on a per-member-month basis.Sources: HPC analysis of Center for Health Information and Analysis All-Payer Claims Database v7.0; AHRQ surgery flags
Exhibit 4�4 Change in volume, payment, and severity for twelve major outpatient surgery categories, 2015 – 2017

2019 COST TRENDS REPORTHEALTH POLICY COMMISSION - 41 -
CH
APTER 4
a 29 percent increase in outpatient volume for the procedure from 2015 to 2017. The average hospital outpatient payment for hys-terectomy was, on average, 28 percent lower than a similar inpatient surgery in 2017, sug-gesting the shift should be cost-saving. Instead, there was a 9.5 percent increase in average payment for uncomplicated hysterectomies in both the inpatient and outpatient settings combined. When examined in more detail, this paradox appears to be explained by both price increases for a given procedure over the two years, and by a shift from hospitals with lower-priced inpatient surgeries to hospitals with higher-priced outpatient surgeries (see Exhibit 4.5).
For example, the average payment for an inpa-tient hysterectomy at Steward Good Samaritan Medical Center in Brockton (the hospital that lost the most inpatient volume from 2015 to 2017) in 2017 was $14,683, and the average payment for an outpatient hysterectomy was $10,852. At Brigham and Women’s Hospital (the hospital that gained the most outpatient volume over the period), the average inpatient payment was $25,767 and the average outpa-tient payment was $20,144. For each of these hospitals, shifting a patient within the hospital from the inpatient setting to the outpatient setting would result in roughly 25 percent lower spending; however, shifting a hypothet-ical patient from the inpatient setting at Good Samaritan to an outpatient setting affiliated with Brigham and Women’s Hospital would result in a spending increase of 37 percent (note: we are unable to observe actual patient shifts, that is, where a patient receiving an outpatient hysterectomy procedure at Brigham and Women’s Hospital in 2017 might have otherwise gone).x
Across the Commonwealth, the average inpa-tient hysterectomy payment was $5,300 higher than the average outpatient hysterectomy
x There are numerous factors that could explain such shifts, including patient choice, provider referrals, and hospital capacity.
Notes: The hospitals shown had the largest loss in inpatient hysterectomy volume (Good Samaritan) and the largest gain in outpatient hysterectomy volume (Brigham and Women’s Hospital). These data do not imply that any specific patient chose Brigham and Women’s Hospital instead of Good Samaritan, but rather are an example to highlight the potential associated spending impact. Cases included in the figure exclude complicated hysterectomies as well as hysterectomies related to ovarian cancer or maternity admissions.Sources: HPC analysis of Center for Health Information and Analysis All-Payer Claims Database v7.0
Exhibit 4�5 Average payment for inpatient and outpatient hysterectomy at selected hospitals
SIDEBAR: GROWTH IN CHILDREN’S SURGERY: MYRINGOTOMY AND TONSILLECTOMY/ADENOIDECTOMYMyringotomies (ear tube placement) and tonsillectomies/adenoidectomies (removal of the tonsils and/or adenoids) are major outpatient surgeries performed mostly in children age 16 or younger (94 percent and 69 percent of all myringot-omies and tonsillectomies /adenoidectomies, respectively, are performed on this age group). Between 2015 and 2017, the number of these surgeries performed on children increased by 18.5 percent. Almost all are performed in hospital out-patient departments or hospital-owned surgery centers, and in 2017, 65 percent of myringotomies and 63 percent of tonsillectomies/adenoidectomies were performed in just two hospitals: Boston Children’s Hospital and Mass. Eye and Ear. This finding is consistent with broad trends nationally in regard to low-risk, high-volume pediatric procedures and a general concentration of pediatric care into a small number of settings in Massachusetts.3, 4 While it is not unusual for children’s surgeries to concentrate into a small number of settings, it remains unclear why there is an additional overall volume increase in these surgeries. A review of the current clinical guidelines does not indicate a shift in practice; some guidelines suggest that these procedures should be occurring less often, in favor of more medical management.5 Further research is needed to understand what these trends suggest about utilization of these services in Massachusetts.
$0
$5,000
$10,000
$15,000
$20,000
$25,000
$30,000
OutpatientInpatientOutpatientInpatient
Good Samaritan Brigham & Women’s
-21
CHANGE IN
INPATIENT
VOLUME
-10
CHANGE IN
INPATIENT
VOLUME
4
CHANGE IN
OUTPATIENT
VOLUME
48
CHANGE IN
OUTPATIENT
VOLUME
�26% LOWER PAYMENT
�22% LOWER PAYMENT
+37% HIGHER PAYMENT

HEALTH POLICY COMMISSION2019 COST TRENDS REPORT - 42 -
payment.xi But as in the example shown in Exhibit 4.5, the predominant pattern of net inpatient to outpatient shifts for these procedures, as shown in Chapter 3, was not within hospitals, but from lower-cost to higher-cost hospitals which resulted in increased spending. Although overall spending impacts are more moderate than in Exhibit 4.5, the average payment for a hysterectomy at hospitals that lost volume from 2015 to 2017 was $14,300, while the average payment for a hysterectomy at hospitals that gained volume was $15,100.xii
MINOR SURGERIESAs noted in Exhibit 4.3, spending increased for minor surgeries as well as major outpatient surgeries, but that spending increase was driven more by volume growth than payment growth overall. Exhibit 4.6 lists the top categories of minor surgeries by total spending, sorted by volume. In 2017, three minor sur-gery categories accounted for about half of all minor surgery
xi Average inpatient hysterectomy payment was calculated for DRGs that could potentially be shifted to outpatient settings. However, hysterectomies that remained in inpatient settings in 2017 might still be more complex on average than outpatient hysterectomies, so the difference between inpatient and outpatient payment may overstate the cost savings from an inpatient to outpatient shift.
xii These figures represent the average payment at hospitals that had hysterectomy volume gains or losses of 5 cases or more between 2015 and 2017, weighted by their corresponding gain or loss. See Technical Appendix.
spending in hospital outpatient departments: colonoscopies with excision or biopsy (29.5 percent of spending), endoscopies with biopsy (15.4 percent), and breast biopsies (5.1 percent).xiii
The overall increase in volume and lack of a significant payment increase for minor surgeries as a group was primarily driven by the rise in volume and decrease in average payment for colo-noscopies with biopsy. The number of colonoscopy procedures increased by 7.7 percent in hospital outpatient departments, while payments per procedure declined 5 percent between 2015 and 2017. A significant number of these procedures occur in phy-sician-owned ambulatory (non-hospital) settings (29 percent of all volume), and competition from these settings may be leading to a reduction in hospital prices for the procedure. Spending on the procedure is 36 percent lower when performed in physician office settings. While volume increased between 2015 and 2017 in both settings, the increase was greater in physician office settings (19.5 percent) than in hospital settings (7.7 percent). The greater volume increase in physician office settings may be due to a lower price point in these settings.
Five of the other seven high-spend minor procedure catego-ries in Exhibit 4.6 saw an increase in payment per procedure. Breast biopsies, lithotripsies, and dilation and curettage (D&C)
xiii Further references to colonoscopy in this chapter use the shorthand “colonoscopy” but refer only to cases where a biopsy was performed, as opposed to a screening colonoscopy that does not include a biopsy.
Exhibit 4�6 Change in volume, payment, and severity for minor surgery categories taking place in hospital outpatient by spending, 2015 – 2017
MINOR SURGERIES 2017 PERCENT CHANGE 2015 TO 2017
N Payment per surgery N per member Payment per surgery Complexity (RVU)
Colonoscopy and biopsy 31111 $ 2,873 8% -5% 0%
Upper gastrointestinal endoscopy, biopsy 15976 $ 2,907 3% 4% 1%
Breast biopsy 6251 $ 2,466 7% 12% 2%
Debridement of wound, infection or burn 4391 $ 710 12% -13% 1%
Excision of skin lesion 3526 $ 3,019 -7% 5% 9%
Suture of skin and subcutaneous tissue 1643 $ 1,490 19% -12% -6%
Abdominal paracentesis 1225 $ 1,942 34% 1% 0%
Extracorporeal lithotripsy, urinary 1046 $ 8,971 15% 13% 0%
Esophageal dilatation 1021 $ 3,386 19% 8% -1%
Dilatation and curettage (D&C) 1000 $ 4,898 4% 10% 0%
Notes: Categories of minor surgeries shown in the table had at least 1,000 surgeries and represented more than 1 percent of total spending for minor surgeries in 2017.Sources: HPC analysis of Center for Health Information and Analysis All-Payer Claims Database v7.0; AHRQ surgery flags

2019 COST TRENDS REPORTHEALTH POLICY COMMISSION - 43 -
CH
APTER 4
procedures had payment increases of at least 10 percent. These procedures were rarely performed in physician offices (17 percent, 5 percent, and 19 percent, respectively) and thus may face less price competition from those settings. Only excisions of skin lesions had a significant increase in RVUs, suggesting that the payment increase in that category might be related to increasing complexity of the procedures.
CONCENTRATION OF SURGERY VOLUME AND SPENDING ACROSS HOSPITAL SYSTEMSBoth major and minor hospital outpatient surgeries are highly concentrated in a few hospital systems, and this concentration con-tinues to grow. In 2017, 28 percent of all major outpatient surgeries occurred at either Partners HealthCare or Beth Israel hospitals (see Exhibit 4.7). Since 2017, these systems have grown (Partners HealthCare acquired Mass. Eye and Ear in 2018 and Beth Israel merged with Lahey and several other hospitals in 2019). Based on their current affiliations, Partners HealthCare and Beth Israel-Lahey Health account for 52 percent of volume.xiv Because of higher payment levels per surgery, Partners HealthCare hospitals account for an even higher share of spending. Partners Health-Care performed one in five major surgeries in 2017, but accounted for 27.2 percent of spending for these surgeries.
xiv In 2018, Partners HealthCare acquired Mass. Eye and Ear Infirmary (MEEI) and all of its subsidiaries. In 2019, Lahey Health System; Caregroup and its component parts (Beth Israel Deaconess Medical Center, New England Baptist Hospital, and Mount Auburn Hospital); Seacoast Regional Health Sys-tems; and all of their corporate subsidiaries merged to form Beth Israel Lahey Health (BILH). BILH also acquired Beth Israel Deaconess Care Orga-nization and established a contracting affiliation with Mount Auburn Cambridge Independent Prac-tice Association. For more information on these transactions, please refer to the HPC’s final Cost and Market Impact Review reports: MEEI (https://www.mass.gov/doc/final-cmir-report-phs-mee-0/download); BILH (https://www.mass.gov/doc/final-cmir-report-beth-israel-lahey-health/download).
Exhibit 4�7 Share of spending and volume of major outpatient surgeries by hospital system, 2017; including both prior and current hospital system affiliations
Oth
er
So
uth
Sho
re
UM
ass M
em
ori
al
Bo
sto
n C
hild
ren's
Wellf
orc
e
Ste
ward
Lahey
Beth
Isra
el
Mass. E
ye a
nd
Ear
Part
ners
Volume Spending
19
.7%
27
.2%
9.7
%
6.3
% 8.3
%
7.6
%
8.0
%
6.5
%
7.4
%
7.1
%
6.3
%
5.4
%
5.9
% 8.1
% 4.6
%
4.4
%
3.7
%
3.6
%
26
.5%
23
.9%
Volume Spending
3.7
%
3.6
%
Oth
er
So
uth
Sho
re
UM
ass M
em
ori
al
Bo
sto
n C
hild
ren's
Wellf
orc
e
Ste
ward
Beth
Isra
el-
Lahey
Part
ners
29
.4% 3
3.5
%
22
.6%
19
.6%
7.4
%
7.1
%
6.3
%
5.4
%
5.9
% 8.1
% 4.6
%
4.4
%
20
.2%
18
.4%
Notes: Outpatient surgeries taking place at off-campus hospital sites for these hospitals are included. In the top graph, hospital systems as shown represent affiliation as of 2017. Partners includes: MGH, Brigham and Women’s, Brigham and Women’s Faulkner, Cooley Dickinson, Martha’s Vineyard, Nan-tucket Cottage, Newton-Wellesley, and North Shore Medical Center. Beth Israel includes: Beth Israel Deaconess Medical Center, BID-Milton, BID-Needham, and BID-Plymouth. Lahey includes: Lahey Hospital and Medical Center, Northeast, and Winchester. Steward includes: St. Elizabeth’s Medical Center, Carney, Good Samaritan Medical Center, Holy Family, Morton, Nashoba Valley, Norwood, and Saint Anne’s. Wellforce includes: Tufts Medical Center, Lowell General, and Hallmark. UMass Memorial includes: UMass Memorial Medical Center, Clinton, HealthAlliance, and Marlborough. Mass. Eye and Ear, Boston Children’s, and South Shore were independent in 2017. The bottom graph shows hospital systems with affiliations as of 2019 (with the same 2017 data). Partners now also includes: Mass. Eye and Ear. Beth Israel-Lahey includes: all the hospitals under Beth Israel in 2017, all the hospitals under Lahey in 2017, Anna Jaques, Mount Auburn, and New England Baptist. All other hospital systems remain the same.Sources: HPC analysis of Center for Health Information and Analysis All-Payer Claims Database v7.0; AHRQ surgery flags
AFFILIATIONS AS OF 2017
AFFILIATIONS AS OF 2019
Both major and minor hospital outpatient surgeries are highly concentrated in a few hospital systems, and
this concentration continues to grow

HEALTH POLICY COMMISSION2019 COST TRENDS REPORT - 44 -
An even larger share of minor outpatient surgeries took place in the Partners HealthCare and Beth Israel systems (37 percent of volume and 41 percent of spending) in 2017.xv These two systems performed 39 percent of all hospital-based outpatient colonoscopies and 38 percent of breast biopsies in 2017. This high and growing concentration of surgeries in several high-priced AMC-anchored systems is similar to trends found in inpatient care (see Chartpack).
It is also important to understand whether this concentration is increasing over time. For example, hospital systems often note plans to move procedures from AMC hubs to community hospitals outside the Boston area, particularly when these hospitals are closer to patients’ homes and are lower-cost.xvi Although this data only allows observation of changes in the concentration of surgeries across hospitals from 2015 to 2017, there was no evidence of either major or minor surgeries shifting away from AMCs and toward community hospitals during this time. Between 2015 and 2017, the share of major outpatient surgeries taking place at community hospitals fell; the share at high public payer community hospitals fell by 2 percentage points (from 24.8 percent to 22.9 percent) and the share at other community hospitals fell by 0.1 percentage points from 21.4 down to 21.3 percent. Notably, as described above, the share of hysterectomies occurring at AMCs increased from 31.6 percent to 37.5 percent from 2015 to 2017. At the same time, the combined AMC share of volume of three minor diagnostic surgeries examined increased slightly: colonoscopies with biopsy (1.4 percent), upper gastrointestinal endoscopies with biopsy (1.2 percent), and breast biopsies (2 percent).
xv If this was examined after recent acquisition and merger activity (Partners Healthcare with Mass. Eye and Ear and the creation of Beth Israel-Lahey), these two systems combined would represent 52 percent of volume and 53 percent of spending for minor hospital outpatient surgeries.
xvi Several Notices of Material Change fall into this category, including the following: https://www.mass.gov/doc/beth-israel-deaconess-med-ical-center-4/download, https://www.mass.gov/doc/mcn-notices-lhs/download, and https://www.mass.gov/doc/tufts-medical-center-0/download.
PAYMENT VARIATION IN MAJOR AND MINOR OUTPATIENT SURGERIESAs implied by Exhibit 4.7 and several previous examples, there is considerable variation in average payments for hospital outpatient surgeries, with payments per surgery varying by roughly a factor of two, even among the six highest-volume hospitals (see Exhibit 4.8). Exhibit 4.8 shows an example of three major surgeries for the six highest-volume hospitals for each procedure.
In particular, average payments at Massachusetts General Hos-pital were 43 percent higher than the median for knee surgery and 45 percent higher for cholecystectomy, while the average RVUs per procedure were about the same as other hospitals, indicating that complexity of surgeries was comparable. The average payment for hysterectomy was 77 percent to 78 percent above the median hospital in both Partners HealthCare’s AMCs. RVUs per procedure at Massachusetts General Hospital (but not Brigham and Women’s) were six percent higher than for outpatient hysterectomies at other hospitals, indicating that they performed slightly more complex procedures. Minor outpatient surgeries exhibited a similar pattern (see Exhibit 4.9).
As with major outpatient surgery, although payments vary somewhat less overall, Partners Healthcare’s AMCs receive payments roughly 40 percent above the median hospital.
The share of hysterectomies occurring at AMCs increased from 31.6 percent to
37.5 percent from 2015 to 2017

2019 COST TRENDS REPORTHEALTH POLICY COMMISSION - 45 -
CH
APTER 4
CHOLECYSTECTOMY EXCISION OF KNEE MENISCUS HYSTERECTOMY
Bri
gh
am
an
d W
om
en
's- F
au
lkn
er
So
uth
Sh
ore
Ho
sp
ita
l
Ne
wto
n-W
ell
es
ley
Ho
sp
ita
l
Be
th I
sra
el
De
co
ne
ss
Me
dic
al
Ce
nte
r
Ma
ss
ac
hu
se
tts
Ge
ne
ral
Ho
sp
ita
l
Bri
gh
am
an
d W
om
en
's H
os
pit
al
Win
ch
es
ter
Ho
sp
ita
l
Lo
we
ll G
en
era
l H
os
pit
al
So
uth
Sh
ore
Ho
sp
ita
l
Ne
wto
n-W
ell
es
ley
Ho
sp
ita
l
Ma
ss
ac
hu
se
tts
Ge
ne
ral
Ho
sp
ita
l
Ne
w E
ng
lan
d B
ap
tis
t
Win
ch
es
ter
Ho
sp
ita
l
So
uth
co
as
t H
os
pit
al
La
he
y -
No
rth
ea
st
Ho
sp
ita
l
Lo
we
ll G
en
era
l H
os
pit
al
Be
th I
sra
el
De
co
ne
ss
Me
dic
al
Ce
nte
r
Ma
ss
ac
hu
se
tts
Ge
ne
ral
Ho
sp
ita
l$
11
,54
1
$9
,11
2
$7
,97
9
$7
,27
1
$6
,98
8
$6
,31
5
$2
0,1
44
$2
0,0
66
$1
3,6
20
$1
3,0
52
$1
2,5
68
$1
1,5
18
$6
,22
7
$6
,19
2
$5
,98
1
$5
,48
7
$4
,92
1
$7,972
$5,779
$11,343
HOSPITAL MEDIAN
$8
,27
4
BREAST BIOPSY COLONOSCOPY WITH BIOPSY GASTROINTESTINAL ENDOSCOPY, BIOPSY
UM
as
s M
em
ori
al
Me
dic
al
Ce
nte
r
Ne
wto
n-W
ell
es
ley
Ho
sp
ita
l
La
he
y H
os
pit
al
an
d M
ed
ica
l C
en
ter
Bri
gh
am
an
d W
om
en
's H
os
pit
al
Be
th I
sra
el
De
co
ne
ss
Me
dic
al
Ce
nte
r
Ma
ss
ac
hu
se
tts
Ge
ne
ral
Ho
sp
ita
l
Ha
llm
ark
He
alt
h
La
he
y H
os
pit
al
an
d M
ed
ica
l C
en
ter
Ne
wto
n-W
ell
es
ley
Ho
sp
ita
l
Bri
gh
am
an
d W
om
en
's H
os
pit
al
Be
th I
sra
el
De
co
ne
ss
Me
dic
al
Ce
nte
r
Ma
ss
ac
hu
se
tts
Ge
ne
ral
Ho
sp
ita
l
Bri
gh
am
an
d W
om
en
's- F
au
lkn
er
Be
th I
sra
el
De
co
ne
ss
Me
dic
al
Ce
nte
r
Ne
wto
n-W
ell
es
ley
Ho
sp
ita
l
Ma
ss
ac
hu
se
tts
Ge
ne
ral
Ho
sp
ita
l
Win
ch
es
ter
Ho
sp
ita
l
Bri
gh
am
an
d W
om
en
's H
os
pit
al
$3
,17
1
$3
,14
6
$2
,36
9
$2
,24
3
$2
,22
6
$1
,99
8
$3
,70
3
$3
,49
2
$3
,38
3
$2
,73
8
$2
,72
6
$2
,61
7
$2
,35
0
$3
,46
9
$2
,77
4
$2
,68
6
$2
,62
2$2,254
$2,571
$2,467
HOSPITAL MEDIAN
$2
,83
6
Notes: Hospitals shown in each category are the six highest-volume hospitals for each procedure. Median is the median for all hospitals with at least 10 surgeries. Payments include both hospital and professional fees.Sources: HPC analysis of Center for Health Information and Analysis All-Payer Claims Database v7.0; AHRQ surgery flags
Exhibit 4�9 Average payment by hospital for three minor outpatient surgeries: upper gastrointestinal endoscopy and biopsy, colonoscopy and biopsy, and breast biopsy and other diagnostic procedures, 2017
Exhibit 4�8 Average payment by hospital for three major outpatient surgeries: hysterectomy, knee repair, and cholecystectomy, 2017

HEALTH POLICY COMMISSION2019 COST TRENDS REPORT - 46 -
SHIFTS FROM LOWER-PRICED TO HIGHER-PRICED PROVIDERSFinally, in addition to volume and price increases for a given surgery, hospital outpatient spending can increase if outpatient procedures shift from lower-priced hospitals to higher-priced hospitals.xvii For most of the major and minor outpatient sur-geries included in the analysis, the HPC observed such shifts from lower-priced hospital outpatient facilities to higher-priced ones, leading to increased average payments (see Exhibit 4.10).
In Exhibit 4.10, a positive percentage (to the right) indicates that the shift across hospitals from 2015 to 2017 in which the procedures were performed increased average payment for the procedure. For example, if distribution of outpatient surgeries across hospitals stayed the same between 2015 and 2017, the payment increased for myringotomies, knee car-tilage excisions, and plastic procedures on the nose would have been at least three percent lower than they were. Eight of the top eleven major outpatient surgeries experienced such a shift (minor surgeries not shown).xviii However, there were some outpatient surgeries where there was a shift away from highest-cost providers. For example, the average payment increase for lumpectomies was 12 percent over this period, but would have been 14.8 percent had the volume of procedures by hospital stayed the same in 2017 as it was in 2015.
CONCLUSIONA deeper analysis of outpatient surgery as a main component of hospital outpatient spending and spending growth has revealed a number of factors underlying the spending growth. Among major outpatient surgeries, average payments for surgery grew 10 percent from 2015 to 2017 while volume increased for some procedures (sometimes due to shifts from inpatient care) and declined for others. Among minor outpatient surgeries, such as colonoscopy with biopsy, volume grew while payments were relatively unchanged from 2015 to 2017, possibly due to competition from non-hospital settings.xix In both cases, procedure volume shifted from lower-cost community hospitals to higher-cost AMCs, also driving spending growth.
xvii This section considers only shifts within the category of hospital outpatient spending, in contrast to Exhibit 4.5, which considered shifting from hospital inpatient settings to hospital outpatient settings.
xviii “Other hernia repair,” the 12th major surgery category shown in Exhibit 4.4, was not included in Exhibit 4.10 because of the large increase in work RVUs from 2015 to 2017. It may be that any shifting between hospitals that occurred for this surgery was warranted by the complexity of the procedure.
Generally, as clinical practice and population health needs lead to less care requiring intensive inpatient settings, the Commonwealth would benefit from net savings to employers, governments, and consumers. Yet, such savings have not been realized for several reasons as discussed in this chapter, namely: (1) increases in prices for the same inpatient admissions and procedures; (2) changes in coding practices leading to the same inpatient care being billed at higher rates; and (3) shifting from lower-cost inpatient and hospital outpatient sites of care to more expensive outpatient settings. In the recommendations section, the HPC discusses provisions stemming from these findings that would help Massachusetts residents gain potential savings and improve the affordability and value of health care.
xix While some net increases in volume for minor surgeries were observed, it is difficult to determine, for the most part, whether this increase represents appropriate, high-value care for additional patients or poten-tially low-value procedures on patients who only benefit marginally.
-3% -2% -1% 0% 1% 2% 3% 4%
Lumpectomy of the breast
Cholecystectomy
Bunionectomy
Tonsillectomy adenoidectomy
Inguinal and femoral hernia
Decompression of peripheral nerve
Lens and cataract
Hysterectomy
Myringotomy
Excision of knee cartilage
Plastic procedures on the nose
SHIFT TO LOWER COST FACILITIES SHIFT TO HIGHER COST FACILITIES
3.9%
3.7%
3.6%
2.9%
2.7%
1.7%
1.5%
1.4%
�1.5%
�0.2%
�2.8%
Notes: This graphic is based on a hypothetical counterfactual scenario in which the distribution in volume of these procedures across hospitals remained the same from 2015 to 2017. The percent change in payment due to shifts across facilities was calculated by taking the percent change in actual payments per surgery minus the percent increase in hypothetical payments (if volume did not shift between hospitals).Sources: HPC analysis of Center for Health Information and Analysis All-Payer Claims Database v7.0
Exhibit 4�10 Percent increase in payments due to movement across hospital outpatient facilities, 2015 – 2017

2019 COST TRENDS REPORTHEALTH POLICY COMMISSION - 47 -
CH
APTER 4
REFERENCES1 Surgery Flag for Services and Procedures. Healthcare Cost
and Utilization Project (HCUP). August 2019. Agency for Healthcare Research and Quality, Rockville, MD. Available at: www.hcup-us.ahrq.gov/toolssoftware/surgeryflags_svcproc/surgeryflagssvc_proc.jsp.
2 Coberly, Sally, Relative Value Units (RVUs). 2015. National Health Policy Forum. Paper 281. Available at: https://hsrc.himmelfarb.gwu.edu/sphhs_centers_nhpf/281.
3 França UL, McManus ML. Trends in regionalization of hospital care for common pediatric conditions. Pediatrics. 2018 Jan. 1;141(1):e20171940.
4 França UL, McManus ML. Availability of definitive hospital care for children. JAMA pediatrics. 2017 Sep. 1;171(9):e171096-.
5 Rosenfeld RM, Schwartz SR, Pynnonen MA, Tunkel DE, Hussey HM, Fichera JS, Grimes AM, Hackell JM, Harrison MF, Haskell H, Haynes DS. Clinical practice guideline: tym-panostomy tubes in children. Otolaryngology—Head and Neck Surgery. Jul. 2013;149(1_suppl):S1-35.

CHAPTER 5: POLICY
RECOMMENDATIONS

2019 COST TRENDS REPORTHEALTH POLICY COMMISSION - 49 -
CH
APTER 5
CHAPTER 5: POLICY RECOMMENDATIONS
In light of the findings presented in this report, as well as the HPC’s research, policy, and program endeavors over the past seven years, the HPC has developed policy recommenda-tions for market participants, policymakers, and government agencies. These include NEW recommendations for 2019, designated in blue, and revised recommendations from previous years. For the renewed recommendations, continued action, effort, and attention are required by the Commonwealth to address the policy issues. Notably, many of these recom-mendations align with the principles and goals contained in recently filed comprehensive legislation by the Baker-Polito Administration, as well as recent legislative initiatives. The HPC stands ready to support these efforts with data insights and independent policy leadership.
Throughout these recommendations, the term “The Commonwealth” is intended to be broadly inclusive of all relevant stakeholders, both public and private, that influence the delivery and payment of health care in Massachusetts and whose commitment to action is necessary for advancing the recommended policy changes.
In the coming year, the HPC will pursue and support the activities outlined below to advance the goal of a more trans-parent, accountable, and innovative health care system in Massachusetts.
2019 POLICY RECOMMENDATIONS NEW 1� PRIMARY AND BEHAVIORAL HEALTH CARE� The Commonwealth should take action to increase spending in primary and behavioral health care. There is considerable evidence that health care delivery systems oriented toward primary care tend to have lower costs, higher quality, and a more equitable distribution of health care resources. Better management of behavioral health conditions has also been found to lower overall health care spending and improve quality of life. Specific areas of focus should include:
a. Focused investment in primary and behavioral health care: Payers and providers should increase spending (both direct spending on services and indirect investments such as care management infrastructure) devoted to primary care and behavioral health, while adhering to the Commonwealth’s total health care spending benchmark. Center for Health
RECOMMENDATIONS BY TOPIC:
PRIMARY AND BEHAVIORAL HEALTH CARE
AMBULATORY CARE
CODING INTENSITY
PHARMACEUTICAL SPENDING
ACCOUNTABILITY UNDER THE COST GROWTH BENCHMARK
EMPLOYER ENGAGEMENT AND CONSUMER CHOICE
ADMINISTRATIVE COMPLEXITY
FACILITY FEES
OUT-OF-NETWORK BILLING
ALTERNATIVE PAYMENT METHODS
HEALTH DISPARITIES
INVESTING IN INNOVATION, LEARNING, AND DISSEMINATION
LOW VALUE CARE
PROVIDER PRICE VARIATION
AFFORDABILITY
1 NEW
2 NEW
3 NEW
4 NEW
5 NEW
6 NEW
7
8
9
10
11
12
13
14
15

HEALTH POLICY COMMISSION2019 COST TRENDS REPORT - 50 -
Information Analysis (CHIA) and the HPC should track and report on primary care and behavioral health care spending trends annually and hold entities accountable for meeting improvement targets if they fall short of benchmark spending.
b. Improve access to primary and behavioral health care: Policymakers, payers, and providers should support advancements in technology that improve access to and use of primary and behavioral health care, such as telehealth services, by creating the infrastructure necessary to deploy this intervention across the Commonwealth and approving payment for tele-visits and consultations. Lawmakers should amend scope of practice laws that are restrictive and not evidence-based, including for Advanced Practice Registered Nurses (APRNs), and continue to support and strengthen the health care workforce with roles designed to meet the unique needs of the communities and patient populations they serve (e.g., community health workers, patient navi-gators, peer support specialists, recovery coaches).
NEW 2� AMBULATORY CARE� The Commonwealth should closely scrutinize how care is delivered and paid for in ambu-latory settings. Given the importance of outpatient care in driving spending and utilization trends, the Commonwealth should analyze ambulatory care across different sites and settings, including urgent care and hospital main campus and off-campus sites. Regulators, payers, and other stake-holders should also examine provider plans for outpatient service expansions and consider critically how new projects are likely to impact cost, quality, access, and competition in the provider market.
NEW 3� CODING INTENSITY� The Commonwealth should take action to mitigate impacts of clinical documentation on spending and performance measurement. The HPC has found evidence that increases in patient risk scores and acuity in recent years are better explained by changes in payer and provider documentation and coding practice than by changes in actual patient health status. While there are benefits to more complete and accurate coding, increased coding intensity also impairs accurate performance measurement and has resulted in millions in additional spending for Massachusetts residents. Specific areas of action should include:
a. Program update frequency: Public and private payers should update the software programs that define and categorize inpatient hospital stays, severity levels, and weights more frequently to better align payments with actual resource use.
b. Offsets to increases: Public and private payers should implement mechanisms to offset the spending impact of cod-ing-related acuity increases and help to redirect administrative efforts away from aggressive coding toward activities with greater patient benefit.
c. Alternative risk adjustment and performance measures: Public and private payers, policymakers, and third par-ties should continue to develop alternative risk adjustment methods and performance measures that are less sensitive to coding-based acuity. Importantly, as discussed in Recom-mendation #5, given the influence of coding activity on health status adjustment, measurement of performance under the benchmark should not be triggered exclusively by growth in health status adjusted total medical expenses.
4� PHARMACEUTICAL SPENDING� The Commonwealth should take action to reduce drug spending growth. Pharmaceutical spending growth in Massachusetts continues to outpace most other categories of health care services and exceed the health care cost growth benchmark. Massachusetts should build on its current initiatives with further innovative approaches. Specific areas of focus should include:
a. NEW Enhanced oversight and transparency: Policymakers should take action to increase oversight and transparency for the full drug distribution chain, including: (1) autho-rizing the expansion of the HPC’s review to drugs with a financial impact to the commercial market in Massachusetts; (2) imposing a penalty on manufacturers that increase the price of a drug above an inflation-based threshold level; (3) increasing state oversight of pharmacy benefit managers’ (PBM) pricing practices; and (4) requiring manufacturers and PBMs to participate in the HPC’s annual cost trends hearing and report data for inclusion in CHIA’s and the HPC’s annual reports on health care cost drivers. The phar-maceutical industry, including manufacturers and PBMs, should contribute to the health care industry assessment that supports state market oversight activities.
b. Payer and provider strategies to maximize value and enhance access: Payers and providers should pursue a range of strate-gies to maximize value in drug spending, including: (1) use of risk-based contracting with manufacturers and value-based benchmarks when negotiating prices; (2) development, in collaboration with patient groups, of treatment protocols and guidelines for use of high-cost drugs; (3) distribution of clinical decision-making tools; (4) monitoring of prescribing

2019 COST TRENDS REPORTHEALTH POLICY COMMISSION - 51 -
CH
APTER 5
patterns to ensure compliance with value-based and evi-dence-based guidelines; and (5) development of plan designs that minimize financial barriers to high-value drugs
NEW 5� ACCOUNTABILITY UNDER THE COST GROWTH BENCHMARK� The Commonwealth should strengthen its abil-ity to hold health care entities, including hospitals, responsible for their spending growth. To improve the annual performance improvement plan (PIP) process, policymakers should: (1) address current limitations of the data the CHIA is required to use in identifying health care entity spending performance by expanding the metrics used to identify health care entities for review; and (2) strengthen the HPC’s ability to hold health plans and providers accountable for spending that impacts the health care cost growth benchmark by enhancing financial pen-alties for above benchmark performance and noncompliance.
NEW 6� EMPLOYER ENGAGEMENT AND CONSUMER CHOICE� The Massachusetts business community should increase its level of coordinated engagement to drive improvements or positive changes in health care. As major purchasers of health insurance and health care services, employers have a powerful voice to demand higher value from both payers and providers. Employ-ers are uniquely positioned to encourage value-based choices not only through purchasing decisions, but also by continu-ous engagement of employees and their families. By working collaboratively with payers, providers, and other stakeholders through efforts such as the Massachusetts Employer Health Coalition, employers can use their influence to drive changes in spending and affordability, care delivery, and the promo-tion of a value-based market. Specific levers include lowering premium contributions when employees choose plans favoring efficient providers, contracting with payers and providers using two-sided risk contracts, and offering group coverage through Health Connector for Business if eligible. To further support these strategies, policymakers should take action to broaden employer access to a wide range of insurance products for their employees and to ensure that payers make affordable, high-value products available.
7� ADMINISTRATIVE COMPLEXITY� The Commonwealth should act to address areas of administrative complexity that add cost to the health care system without improving the value of care. Administrative complexity is endemic in the U.S. health care system. It is one of the principal reasons that U.S. health care spending exceeds that of other high-income countries and is a source of significant pain – both financial and non-financial
– to patients and providers alike. The Commonwealth should
be a national leader by requiring greater standardization of common administrative tasks across payers, particularly those that affect patients (e.g., prior authorization) and should facili-tate efforts among government, payers, providers, and patients to identify and reduce other drivers of valueless administrative complexity.
8� FACILITY FEES� The Commonwealth should limit certain facility fees. In many cases, the same services can be provided at both hospital outpatient departments and physician offices, but rates and patient cost-sharing are often substantially higher at hospital outpatient departments due to the addition of hos-pital “facility fees.” In order to enhance market functioning and consumer protections, policymakers should take action to require site-neutral payments for common ambulatory ser-vices (e.g., basic office visits) and limit the cases in which both newly licensed and existing sites can bill as hospital outpatient departments. Additionally, outpatient sites that charge facility fees should be required to conspicuously and clearly disclose this fact to patients, prior to delivering care.
9. OUT-OF-NETWORK BILLING. The Commonwealth should enhance protections for consumers from out-of-network bills. The Commonwealth should protect consumers and improve health care market functioning by enacting a comprehensive law to address out-of-network billing. Specific provisions should include requiring advance patient notification when a provider may be out-of-network, protecting consumers from out-of-network bills in emergency and “surprise” billing sce-narios, and setting a reasonable and fair reimbursement rate for out-of-network services through a statutory or regula-tory process. To ensure that such measures do not increase total spending, any such process should avoid using provider charges or list prices as benchmarks in determining payment.
10� ALTERNATIVE PAYMENT METHODS� The Commonwealth should continue to promote the increased adoption and effec-tiveness of alternative payment methods (APMs), especially in the commercial market where APM expansion has stalled. Specific areas of focus should include:
a. Increase use of APMs for Preferred Provider Organization (PPO) populations: Payers should universally use the Mas-sachusetts consensus guidelines for patient attribution for PPO members and support the training and infrastructure necessary to manage total cost of care for a PPO population.
b. Align and improve APM effectiveness: Payers should align and improve APM features, including: (1) using the

HEALTH POLICY COMMISSION2019 COST TRENDS REPORT - 52 -
consensus quality measure set developed by the Executive Office of Health and Human Services Quality Alignment taskforce; (2) providing consistent, timely, actionable data for population health management; and (3) for experienced providers, shifting to two-sided risk models to maximize the impact of the incentives to improve health outcomes and value. Payers should move away from historical spending as the basis of global budgets and establish stricter targets for spending growth for highly paid providers in order to lessen unwarranted disparities in global budgets.
c. Encourage targeted risk: Payers and providers should adopt bundled payments for common and costly episodes of care such as joint replacement, cardiac procedures, and labor and delivery.
11� HEALTH DISPARITIES� The Commonwealth should seek to understand and address inequities in the opportunities and resources available to enable health and well-being for all citizens. Persistent disparities in health outcomes remain among low-income communities, people of color, LGBTQ+ individuals, and other populations in the Commonwealth, despite Massachusetts’ long-standing commitment to increase access to care and investments in public health initiatives. To address these disparities, specific areas of focus should include:
a. Health-related social needs (HRSN): Policymakers should encourage downstream collaborations between health care providers and social service organizations to identify and HRSN of patients, including but not limited to housing instability, food insecurity, transportation challenges, and income instability.
b. Social determinants of health (SDOH): The Commonwealth should promote upstream collaborations among government agencies, health care providers, payers, and communi-ty-based organizations to understand the root causes of health inequity in communities – the social determinants of health (SDOH) – and leverage their combined expertise, resources, and influence to address those inequities through strategic investments, policy advocacy and alignment, and authentic engagement with community members.
12� INVESTING IN INNOVATION, LEARNING, AND DISSEM-INATION� The Commonwealth should continue to support targeted investments to promote innovation, learning, and dissemination of promising care models. Specific opportunities for investment include: (1) longitudinal care models to support individuals and families experiencing the direct and indirect
effects of substance use disorder; (2) alternatives to traditional hospital-based clinical care (e.g., “hospital at home”); (3) tele-health as a strategy to increase access to high- need services, particularly behavioral health; (4) care models that promote coordination and integration of inpatient and ambulatory medical and behavioral health, and social services; and (5) maternal health, particularly among populations for which there are significant disparities in outcomes.
13. LOW VALUE CARE. The Commonwealth should act to reduce the provision of health care that does not provide value to patients. Payers, providers, and purchasers should collaborate on strategies to reduce low value care through measurement, reporting, education, and appropriate financial incentives and support for incorporating evidence-based guidelines into practice. The Commonwealth should encourage information campaigns like Choosing Wisely® that disseminate research findings about low value care to engage patients in their care and ensure they are informed about clinical value before they seek services. Consistent with Recommendation #6, employers can also play a role in assisting employees and their families in accessing information useful in making high-value treatment decisions.
14� PROVIDER PRICE VARIATION� The Commonwealth should take action to reduce unwarranted variation in provider prices. Extensive variation in prices paid to health care providers for the same medical services and medical drugs due to differences in negotiating leverage is a persistent issue in the Commonwealth, driving increased health care spending and perpetuating inequi-ties in the distribution of health care resources across different communities. Policymakers should advance specific, data-driven interventions to address the pressing issue of persistent provider price variation, particularly given new findings indicating that savings from shifts from inpatient to outpatient care may be lost due to hospital price differentials.
15� AFFORDABILITY� Health care affordability must remain a central focus of the Commonwealth’s health care agenda. While the Commonwealth successfully met the benchmark for total health care spending growth in 2018, health care continues to consume an ever greater share of families’ disposable income. These growth trends, combined with already high premium levels, are making health care increasingly unaffordable for many residents and businesses in Massachusetts. The Com-monwealth should continue to examine and address the factors impacting premium and out-of-pocket cost growth and their disproportionate impact on lower-to-middle income residents and small businesses.

2019 COST TRENDS REPORTHEALTH POLICY COMMISSION - 53 -
CH
APTER 5
MASSACHUSETTS TIME TREND U� S� COMPARISON
Previous Most Recent
Perf
orm
ance
Most Recent
Com
paris
on
AFFO
RDAB
ILIT
Y 1 Individuals with high out-of-pocket spending relative to income
7% (2013 - 2014)
8% (2016 - 2017)
10% (2016 - 2017)
2 Family premium contribution for low-wage employers $6,976 (2017) $8,196 (2018) $6,059 (2018)
3 Adults who went without care because of cost in the past year 9% (2013) 9% (2017) 14% (2017)
ALTE
RNAT
IVE
PAYM
ENT
MET
HO
DS 4 Percentage of Original Medicare beneficiaries covered
by APMs 48.1% (2017) 43.6% (2018) 29.2% (2018)
5 Percentage of commercial HMO patients in APMs 54.8% (2017) 54.7% (2018) N/A N/A
6 Percentage of commercial PPO patients in APMs 22.8% (2017) 23.0% (2018) N/A N/A
7 MassHealth managed care member months under APMs 37.8% (2017) 67.7% (2018) N/A N/A
BEN
CHM
ARK
AND
SPE
ND
ING
8 Growth of THCE per capita (performance assessed relative to 3�1% benchmark) 2.8% (2017) 3.1% (2018) 3.5% (2018)
9 Growth in commercial health care spending per capita (performance assessed relative to 3�1% benchmark) 1.4% (2017) 3.0% (2018) 5.3% (2018)
10 Employer-based health insurance premiums, single coverage $7,031 (2017) $7,443 (2018) $6,715 (2018)
11 Growth in employer-based health insurance premiums, single coverage 6.2% (2017) 5.9% (2018) 5.4% (2018)
12 Benchmark premium for second-lowest-cost exchange plan, single coverage $3,000 (2017) $3,792 (2018) N/A* $5,772 (2018)
13 Growth in the benchmark premium for second-lowest-cost exchange plan, single coverage -2.7% (2017) 26.4% (2018) N/A* 34.0% (2018)
EFFI
CIEN
T, H
IGH
-QUA
LITY
CA
RE D
ELIV
ERY
14 Readmission rate (Medicare) 18.2% (2016) 18.3% (2017) 16.7% (2017)
15 Readmission rate (all payer) 15.4% (2017) 15.4% (2018) N/A N/A
16 ED utilization (per 1,000 persons) 357 (2017) 356 (2018) MA = 485 U.S. = 445 (2017)
17 BH-related ED utilization (per 1,000 persons) 28 (2017) 28 (2018) N/A N/A
18 Avoidable ED Utilization 141 (2017) 140 (2018) N/A N/A
19 Percentage of inpatient discharges to institutional PAC 18.5% (2017) 17.8% (2018) MA = 17.9% U.S. = 15.3% (2016)
VALU
E-BA
SED
M
ARKE
TS
20 Enrollment in tiered network products 18.8% (2017) 20.0% (2018) N/A N/A
21 Enrollment in limited network products 5.1% (2017) 5.3% (2018) N/A N/A
22 Percentage of discharges in top five networks 53.9% (2017) 53.2% (2018) N/A N/A
23 Share of newborns in community hospitals 51.6% (2017) 50.3% (2018) N/A N/A
Better performance
Similar performance
Worse performance
*Due to the elimination of Cost Sharing Reduction payments in 2018, performance in 2018 is not comparable to earlier years.
Exhibit 5�1 Dashboard of HPC system performance metrics

HEALTH POLICY COMMISSION2019 COST TRENDS REPORT - 54 -
Exhibit 5�2 Dashboard of HPC improvement targets
METRIC CURRENT HPC TARGET PERFORMANCE
Growth of total health care expenditures per capita 3.1% (2018) 3.1% (2018)
All-payer readmission rate (The rate at which patients who have been discharged are admitted again within 30 days for all payers)
15.4% (2018) 13.0% (2019)
Percentage of commercial HMO patients in APMs 54.7% (2018) 80.0% (2017)
Percentage of commercial PPO patients in APMs 23.0% (2018) 33.0% (2017)
Percentage of inpatient discharges to institutional PAC 17.8% (2018) 17.1% (2020)
Notes: APM = alternative payment method; BH = behavioral health; ED = emergency department; HMO = health mainte-nance organization; PAC = post-acute care; PPO = preferred provider organization; THCE = total health care expenditures. For additional notes and sources, see Technical Appendix.
Better performance
Projected to meet target
Similar performance
Worse performance
Projected to not meet target

LIST OF TECHNICAL APPENDICES &
ACKNOWLEDGMENTS

HEALTH POLICY COMMISSION2019 COST TRENDS REPORT - 56 -
LIST OF TECHNICAL APPENDICES
A Acute Care Hospitals in Massachusetts by Type of Hospital
B1 Trends in Spending and Care Delivery
B2 Changes in Inpatient Severity of Illness
B3 Changes in Commercial Inpatient Volume
B4 Hospital Outpatient Spending
B5 Dashboard
C1 Hospital Utilization
C2 Post-Acute Care
C3 Alternative Payment Methods
C4 Provider Organization Performance Variation
D Data Sources

2019 COST TRENDS REPORTHEALTH POLICY COMMISSION - 57 -
ACKNOWLEDGMENTS
COMMISSIONERSDr. Stuart Altman Chair
Mr. Martin Cohen Vice Chair
Dr. Donald Berwick
Ms. Barbara Blakeney
Dr. David Cutler
Mr. Tim Foley
Mr. Michael Heffernan Secretary of Administration and Finance
Dr. John Christian Kryder
Mr. Rick Lord
Mr. Ron Mastrogiovanni
Ms. Marylou Sudders Secretary of Health and Human Services
EXECUTIVE DIRECTORMr. David Seltz
The HPC’s Research and Cost Trends department, led by Dr. David Auerbach, conducted the analysis and prepared the annual cost trends report: Dr. Kateryna Fonkych, Sweya Gaddam, Yue Huang, Hannah James, Lyden Marcellot, Dr. Laura Nasuti, and Sara Sadownik.
Ashley Johnston designed the report. Many additional HPC staff contributed significantly to the preparation of this report from each of the HPC’s departments: Executive/Chief of Staff (led by Coleen Elstermeyer), Legal (led by Lois H. Johnson), Health Care Transformation and Innovation (led by Kelly Hall), and Market Oversight and Transparency (led by Kate Scarborough Mills). The HPC would also like to thank the research fellows, Akiff Premjee and Karen Smith. The HPC received input and guidance from a number of clinical experts, including Michael Barnett MD, MS, Assistant Professor, Department of Health Policy and Management at Harvard T.H. Chan School of Public Health; Audrey Marshall, MD; David Meyers, MPH; Chanu Rhee MD, MPH, Assistant Pro-fessor, Department of Population Medicine at Harvard Medical School; Sheila Richmeier, MS, RN, FACMPE, President of Remedy Healthcare Consulting; and Zirui Song, MD, PhD, Assistant Professor, Department of Health Care Policy at Harvard Medical School.
The HPC acknowledges the significant contributions of other government agencies in the development of this report, includ-ing the Betsy Lehman Center for Patient Safety (BLC) and the Center for Health Information and Analysis (CHIA); the Office of MassHealth and the Commonwealth’s Executive Office of Health and Human Services (EOHHS); the Massachusetts Health Connector Authority; the Massachusetts Attorney General’s Office (AGO); and the federal Centers for Medicare and Medicaid Services (CMS).
The HPC received valuable assistance from many others in government, industry, and the research community. The HPC would like to thank its Advisory Council and other market participants and stakeholders for insightful input and com-ments, and Mathematica Policy Research for assistance with the All-Payer Claims Database (APCD).


MASSACHUSETTS HEALTH POLICY COMMISSION
50 MILK STREET, 8TH FLOOR
BOSTON, MA 02109
WWW.MASS.GOV/HPC