2017 RIN Basis of Preparation Category Analysis
131
2017 RIN Basis of Preparation Category Analysis Document No: 2017 [CP] [CA] RIN BOP Revision: 1.0
Transcript of 2017 RIN Basis of Preparation Category Analysis
2017 RIN
Basis of Preparation
Category Analysis
Document No: 2017 [CP] [CA] RIN BOP
Revision: 1.0
Citipower – Basis of Preparation – CA 2
Overview
CitiPower is required to prepare a Basis of Preparation document which must,
a) demonstrate how the information provided is consistent with the requirements of the Notice;
b) explain the source from which CitiPower obtained the information provided;
c) explain the methodology CitiPower applied to provide the required information, including any assumptions CitiPower made;
d) advise if the information is actual or estimate;
e) explain circumstances where CitiPower cannot provide input for a variable using actual information, and therefore must provide estimated information:
i. why an estimate was required, including why it was not possible for CitiPower to use actual information;
ii. the basis for the estimate, including the approach used, assumptions made and reasons why the estimate is CitiPower’s best estimate, given the information
sought in the Notice.
In accordance with the requirements above, this document provides details to support the information provided by CitiPower in the Microsoft Excel workbooks titled:
2017 [CP] [CA] RIN Template Export - Actual
2017 [CP] [CA] RIN Template Export - Estimated
2017 [CP] [CA] RIN Template Export - Consolidated
To satisfy the requirements of the Notice, the following information has been provided for each RIN table:
classification of actual or estimated information;
if estimated, appropriate justification provided;
data source;
methodology and assumptions adopted to prepare the information;
any additional comments to support the basis of preparation.
Where estimates have been provided, CitiPower is currently considering the feasibility of improvement opportunities to allow actual information to be provided in the
future.
Citipower – Basis of Preparation – CA 3
BOP ID Tab ID Tab Name Table and Rule Allocation Estimated / Actual
Data Source Why Estimated? Methodology Assumptions Additional Comments
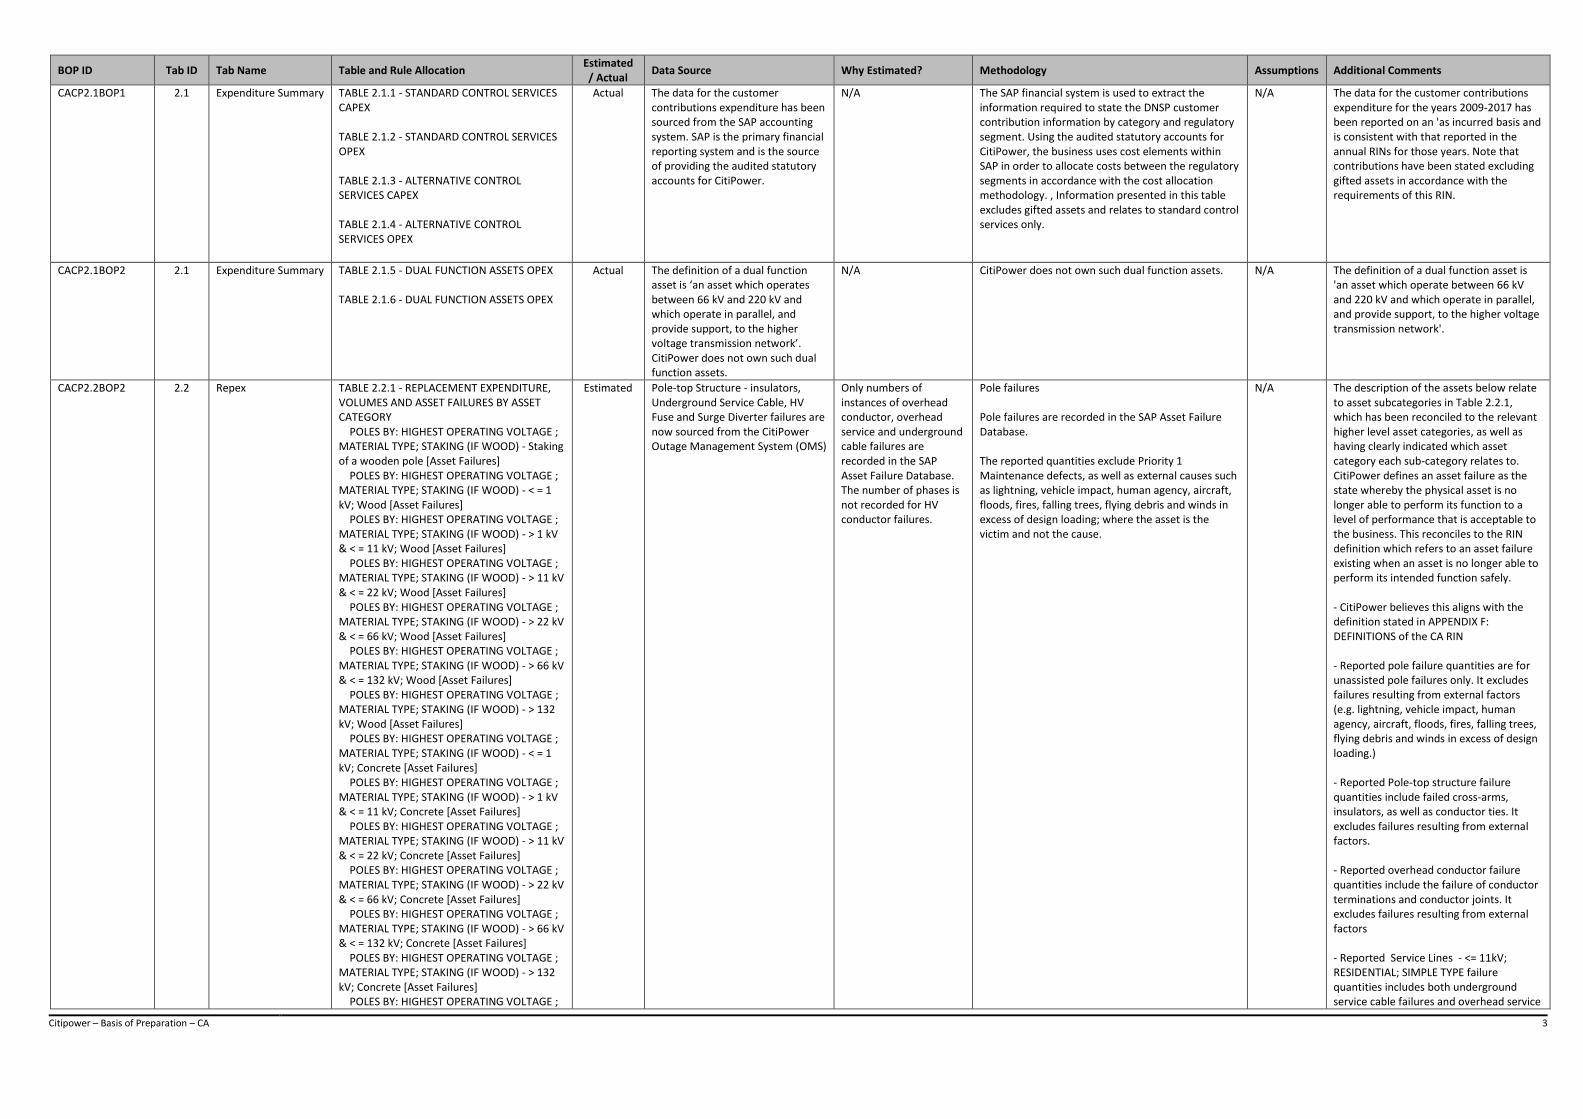
CACP2.1BOP1 2.1 Expenditure Summary TABLE 2.1.1 - STANDARD CONTROL SERVICES CAPEX TABLE 2.1.2 - STANDARD CONTROL SERVICES OPEX TABLE 2.1.3 - ALTERNATIVE CONTROL SERVICES CAPEX TABLE 2.1.4 - ALTERNATIVE CONTROL SERVICES OPEX
Actual The data for the customer contributions expenditure has been sourced from the SAP accounting system. SAP is the primary financial reporting system and is the source of providing the audited statutory accounts for CitiPower.
N/A The SAP financial system is used to extract the information required to state the DNSP customer contribution information by category and regulatory segment. Using the audited statutory accounts for CitiPower, the business uses cost elements within SAP in order to allocate costs between the regulatory segments in accordance with the cost allocation methodology. , Information presented in this table excludes gifted assets and relates to standard control services only.
N/A The data for the customer contributions expenditure for the years 2009-2017 has been reported on an 'as incurred basis and is consistent with that reported in the annual RINs for those years. Note that contributions have been stated excluding gifted assets in accordance with the requirements of this RIN.
CACP2.1BOP2 2.1 Expenditure Summary TABLE 2.1.5 - DUAL FUNCTION ASSETS OPEX TABLE 2.1.6 - DUAL FUNCTION ASSETS OPEX
Actual The definition of a dual function asset is ‘an asset which operates between 66 kV and 220 kV and which operate in parallel, and provide support, to the higher voltage transmission network’. CitiPower does not own such dual function assets.
N/A CitiPower does not own such dual function assets. N/A The definition of a dual function asset is 'an asset which operate between 66 kV and 220 kV and which operate in parallel, and provide support, to the higher voltage transmission network'.
CACP2.2BOP2 2.2 Repex TABLE 2.2.1 - REPLACEMENT EXPENDITURE, VOLUMES AND ASSET FAILURES BY ASSET CATEGORY POLES BY: HIGHEST OPERATING VOLTAGE ; MATERIAL TYPE; STAKING (IF WOOD) - Staking of a wooden pole [Asset Failures] POLES BY: HIGHEST OPERATING VOLTAGE ; MATERIAL TYPE; STAKING (IF WOOD) - < = 1 kV; Wood [Asset Failures] POLES BY: HIGHEST OPERATING VOLTAGE ; MATERIAL TYPE; STAKING (IF WOOD) - > 1 kV & < = 11 kV; Wood [Asset Failures] POLES BY: HIGHEST OPERATING VOLTAGE ; MATERIAL TYPE; STAKING (IF WOOD) - > 11 kV & < = 22 kV; Wood [Asset Failures] POLES BY: HIGHEST OPERATING VOLTAGE ; MATERIAL TYPE; STAKING (IF WOOD) - > 22 kV & < = 66 kV; Wood [Asset Failures] POLES BY: HIGHEST OPERATING VOLTAGE ; MATERIAL TYPE; STAKING (IF WOOD) - > 66 kV & < = 132 kV; Wood [Asset Failures] POLES BY: HIGHEST OPERATING VOLTAGE ; MATERIAL TYPE; STAKING (IF WOOD) - > 132 kV; Wood [Asset Failures] POLES BY: HIGHEST OPERATING VOLTAGE ; MATERIAL TYPE; STAKING (IF WOOD) - < = 1 kV; Concrete [Asset Failures] POLES BY: HIGHEST OPERATING VOLTAGE ; MATERIAL TYPE; STAKING (IF WOOD) - > 1 kV & < = 11 kV; Concrete [Asset Failures] POLES BY: HIGHEST OPERATING VOLTAGE ; MATERIAL TYPE; STAKING (IF WOOD) - > 11 kV & < = 22 kV; Concrete [Asset Failures] POLES BY: HIGHEST OPERATING VOLTAGE ; MATERIAL TYPE; STAKING (IF WOOD) - > 22 kV & < = 66 kV; Concrete [Asset Failures] POLES BY: HIGHEST OPERATING VOLTAGE ; MATERIAL TYPE; STAKING (IF WOOD) - > 66 kV & < = 132 kV; Concrete [Asset Failures] POLES BY: HIGHEST OPERATING VOLTAGE ; MATERIAL TYPE; STAKING (IF WOOD) - > 132 kV; Concrete [Asset Failures] POLES BY: HIGHEST OPERATING VOLTAGE ;
Estimated Pole-top Structure - insulators, Underground Service Cable, HV Fuse and Surge Diverter failures are now sourced from the CitiPower Outage Management System (OMS)
Only numbers of instances of overhead conductor, overhead service and underground cable failures are recorded in the SAP Asset Failure Database. The number of phases is not recorded for HV conductor failures.
Pole failures Pole failures are recorded in the SAP Asset Failure Database. The reported quantities exclude Priority 1 Maintenance defects, as well as external causes such as lightning, vehicle impact, human agency, aircraft, floods, fires, falling trees, flying debris and winds in excess of design loading; where the asset is the victim and not the cause.
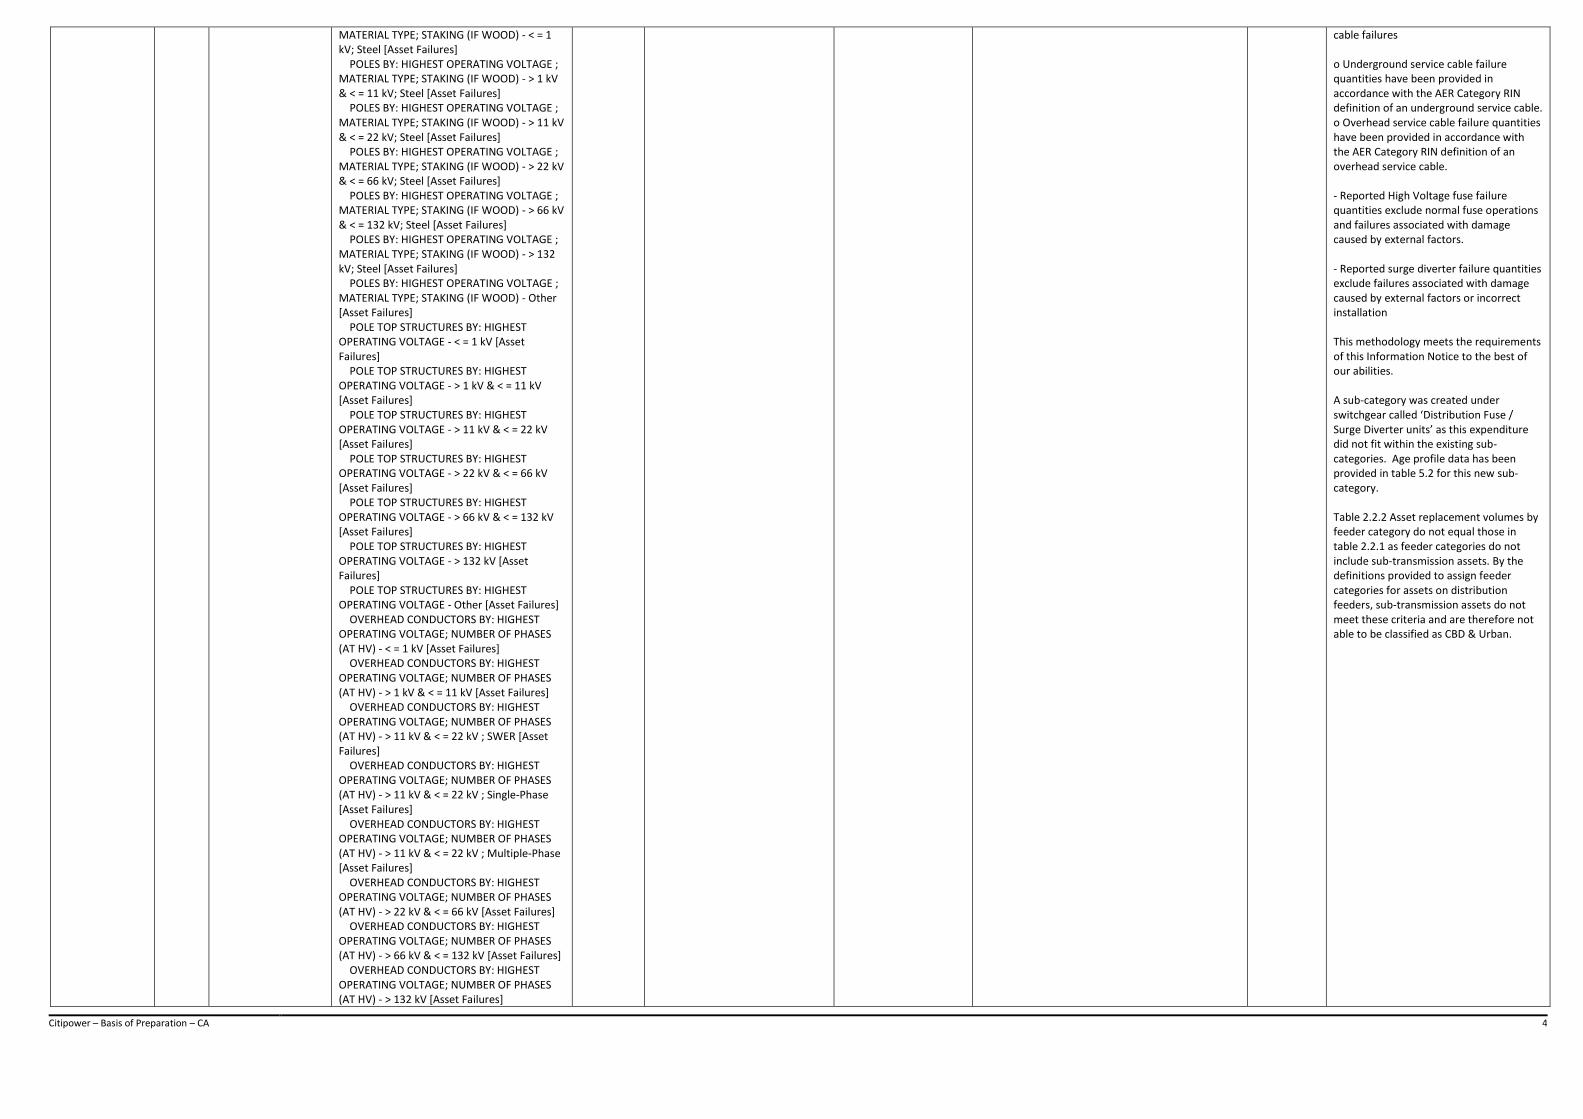
N/A The description of the assets below relate to asset subcategories in Table 2.2.1, which has been reconciled to the relevant higher level asset categories, as well as having clearly indicated which asset category each sub-category relates to. CitiPower defines an asset failure as the state whereby the physical asset is no longer able to perform its function to a level of performance that is acceptable to the business. This reconciles to the RIN definition which refers to an asset failure existing when an asset is no longer able to perform its intended function safely. - CitiPower believes this aligns with the definition stated in APPENDIX F: DEFINITIONS of the CA RIN - Reported pole failure quantities are for unassisted pole failures only. It excludes failures resulting from external factors (e.g. lightning, vehicle impact, human agency, aircraft, floods, fires, falling trees, flying debris and winds in excess of design loading.) - Reported Pole-top structure failure quantities include failed cross-arms, insulators, as well as conductor ties. It excludes failures resulting from external factors. - Reported overhead conductor failure quantities include the failure of conductor terminations and conductor joints. It excludes failures resulting from external factors - Reported Service Lines - <= 11kV; RESIDENTIAL; SIMPLE TYPE failure quantities includes both underground service cable failures and overhead service
Citipower – Basis of Preparation – CA 4
MATERIAL TYPE; STAKING (IF WOOD) - < = 1 kV; Steel [Asset Failures] POLES BY: HIGHEST OPERATING VOLTAGE ; MATERIAL TYPE; STAKING (IF WOOD) - > 1 kV & < = 11 kV; Steel [Asset Failures] POLES BY: HIGHEST OPERATING VOLTAGE ; MATERIAL TYPE; STAKING (IF WOOD) - > 11 kV & < = 22 kV; Steel [Asset Failures] POLES BY: HIGHEST OPERATING VOLTAGE ; MATERIAL TYPE; STAKING (IF WOOD) - > 22 kV & < = 66 kV; Steel [Asset Failures] POLES BY: HIGHEST OPERATING VOLTAGE ; MATERIAL TYPE; STAKING (IF WOOD) - > 66 kV & < = 132 kV; Steel [Asset Failures] POLES BY: HIGHEST OPERATING VOLTAGE ; MATERIAL TYPE; STAKING (IF WOOD) - > 132 kV; Steel [Asset Failures] POLES BY: HIGHEST OPERATING VOLTAGE ; MATERIAL TYPE; STAKING (IF WOOD) - Other [Asset Failures] POLE TOP STRUCTURES BY: HIGHEST OPERATING VOLTAGE - < = 1 kV [Asset Failures] POLE TOP STRUCTURES BY: HIGHEST OPERATING VOLTAGE - > 1 kV & < = 11 kV [Asset Failures] POLE TOP STRUCTURES BY: HIGHEST OPERATING VOLTAGE - > 11 kV & < = 22 kV [Asset Failures] POLE TOP STRUCTURES BY: HIGHEST OPERATING VOLTAGE - > 22 kV & < = 66 kV [Asset Failures] POLE TOP STRUCTURES BY: HIGHEST OPERATING VOLTAGE - > 66 kV & < = 132 kV [Asset Failures] POLE TOP STRUCTURES BY: HIGHEST OPERATING VOLTAGE - > 132 kV [Asset Failures] POLE TOP STRUCTURES BY: HIGHEST OPERATING VOLTAGE - Other [Asset Failures] OVERHEAD CONDUCTORS BY: HIGHEST OPERATING VOLTAGE; NUMBER OF PHASES (AT HV) - < = 1 kV [Asset Failures] OVERHEAD CONDUCTORS BY: HIGHEST OPERATING VOLTAGE; NUMBER OF PHASES (AT HV) - > 1 kV & < = 11 kV [Asset Failures] OVERHEAD CONDUCTORS BY: HIGHEST OPERATING VOLTAGE; NUMBER OF PHASES (AT HV) - > 11 kV & < = 22 kV ; SWER [Asset Failures] OVERHEAD CONDUCTORS BY: HIGHEST OPERATING VOLTAGE; NUMBER OF PHASES (AT HV) - > 11 kV & < = 22 kV ; Single-Phase [Asset Failures] OVERHEAD CONDUCTORS BY: HIGHEST OPERATING VOLTAGE; NUMBER OF PHASES (AT HV) - > 11 kV & < = 22 kV ; Multiple-Phase [Asset Failures] OVERHEAD CONDUCTORS BY: HIGHEST OPERATING VOLTAGE; NUMBER OF PHASES (AT HV) - > 22 kV & < = 66 kV [Asset Failures] OVERHEAD CONDUCTORS BY: HIGHEST OPERATING VOLTAGE; NUMBER OF PHASES (AT HV) - > 66 kV & < = 132 kV [Asset Failures] OVERHEAD CONDUCTORS BY: HIGHEST OPERATING VOLTAGE; NUMBER OF PHASES (AT HV) - > 132 kV [Asset Failures]
cable failures o Underground service cable failure quantities have been provided in accordance with the AER Category RIN definition of an underground service cable. o Overhead service cable failure quantities have been provided in accordance with the AER Category RIN definition of an overhead service cable. - Reported High Voltage fuse failure quantities exclude normal fuse operations and failures associated with damage caused by external factors. - Reported surge diverter failure quantities exclude failures associated with damage caused by external factors or incorrect installation This methodology meets the requirements of this Information Notice to the best of our abilities. A sub-category was created under switchgear called ‘Distribution Fuse / Surge Diverter units’ as this expenditure did not fit within the existing sub-categories. Age profile data has been provided in table 5.2 for this new sub-category. Table 2.2.2 Asset replacement volumes by feeder category do not equal those in table 2.2.1 as feeder categories do not include sub-transmission assets. By the definitions provided to assign feeder categories for assets on distribution feeders, sub-transmission assets do not meet these criteria and are therefore not able to be classified as CBD & Urban.
Citipower – Basis of Preparation – CA 5
OVERHEAD CONDUCTORS BY: HIGHEST OPERATING VOLTAGE; NUMBER OF PHASES (AT HV) - Other [Asset Failures] UNDERGROUND CABLES BY: HIGHEST OPERATING VOLTAGE - < = 1 kV [Asset Failures] UNDERGROUND CABLES BY: HIGHEST OPERATING VOLTAGE - > 1 kV & < = 11 kV [Asset Failures] UNDERGROUND CABLES BY: HIGHEST OPERATING VOLTAGE - > 11 kV & < = 22 kV [Asset Failures] UNDERGROUND CABLES BY: HIGHEST OPERATING VOLTAGE - > 22 kV & < = 33 kV [Asset Failures] UNDERGROUND CABLES BY: HIGHEST OPERATING VOLTAGE - > 33 kV & < = 66 kV [Asset Failures] UNDERGROUND CABLES BY: HIGHEST OPERATING VOLTAGE - > 66 kV & < = 132 kV [Asset Failures] UNDERGROUND CABLES BY: HIGHEST OPERATING VOLTAGE - > 132 kV [Asset Failures] UNDERGROUND CABLES BY: HIGHEST OPERATING VOLTAGE - Other [Asset Failures] SERVICE LINES BY: CONNECTION VOLTAGE; CUSTOMER TYPE; CONNECTION COMPLEXITY - < = 11 kV ; Residential ; Simple Type [Asset Failures] TRANSFORMERS BY: MOUNTING TYPE; HIGHEST OPERATING VOLTAGE ; AMPERE RATING; NUMBER OF PHASES (AT LV) - Pole Mounted ; < = 22kV ; < = 60 kVA ; Single Phase [Asset Failures] TRANSFORMERS BY: MOUNTING TYPE; HIGHEST OPERATING VOLTAGE ; AMPERE RATING; NUMBER OF PHASES (AT LV) - Pole Mounted ; < = 22kV ; > 60 kVA and < = 600 kVA ; Single Phase [Asset Failures] TRANSFORMERS BY: MOUNTING TYPE; HIGHEST OPERATING VOLTAGE ; AMPERE RATING; NUMBER OF PHASES (AT LV) - Pole Mounted ; < = 22kV ; > 600 kVA ; Single Phase [Asset Failures] TRANSFORMERS BY: MOUNTING TYPE; HIGHEST OPERATING VOLTAGE ; AMPERE RATING; NUMBER OF PHASES (AT LV) - Pole Mounted ; < = 22kV ; < = 60 kVA ; Multiple Phase [Asset Failures] TRANSFORMERS BY: MOUNTING TYPE; HIGHEST OPERATING VOLTAGE ; AMPERE RATING; NUMBER OF PHASES (AT LV) - Pole Mounted ; < = 22kV ; > 60 kVA and < = 600 kVA ; Multiple Phase [Asset Failures] TRANSFORMERS BY: MOUNTING TYPE; HIGHEST OPERATING VOLTAGE ; AMPERE RATING; NUMBER OF PHASES (AT LV) - Pole Mounted ; < = 22kV ; > 600 kVA ; Multiple Phase [Asset Failures] TRANSFORMERS BY: MOUNTING TYPE; HIGHEST OPERATING VOLTAGE ; AMPERE RATING; NUMBER OF PHASES (AT LV) - Kiosk Mounted ; < = 22kV ; < = 60 kVA ; Single Phase [Asset Failures] TRANSFORMERS BY: MOUNTING TYPE; HIGHEST OPERATING VOLTAGE ; AMPERE
Citipower – Basis of Preparation – CA 6
RATING; NUMBER OF PHASES (AT LV) - Kiosk Mounted ; < = 22kV ; > 60 kVA and < = 600 kVA ; Single Phase [Asset Failures] TRANSFORMERS BY: MOUNTING TYPE; HIGHEST OPERATING VOLTAGE ; AMPERE RATING; NUMBER OF PHASES (AT LV) - Kiosk Mounted ; < = 22kV ; > 600 kVA ; Single Phase [Asset Failures] TRANSFORMERS BY: MOUNTING TYPE; HIGHEST OPERATING VOLTAGE ; AMPERE RATING; NUMBER OF PHASES (AT LV) - Kiosk Mounted ; < = 22kV ; < = 60 kVA ; Multiple Phase [Asset Failures] TRANSFORMERS BY: MOUNTING TYPE; HIGHEST OPERATING VOLTAGE ; AMPERE RATING; NUMBER OF PHASES (AT LV) - Kiosk Mounted ; < = 22kV ; > 60 kVA and < = 600 kVA ; Multiple Phase [Asset Failures] TRANSFORMERS BY: MOUNTING TYPE; HIGHEST OPERATING VOLTAGE ; AMPERE RATING; NUMBER OF PHASES (AT LV) - Kiosk Mounted ; < = 22kV ; > 600 kVA ; Multiple Phase [Asset Failures] SWITCHGEAR BY: HIGHEST OPERATING VOLTAGE ; SWITCH FUNCTION - Other [Asset Failures]
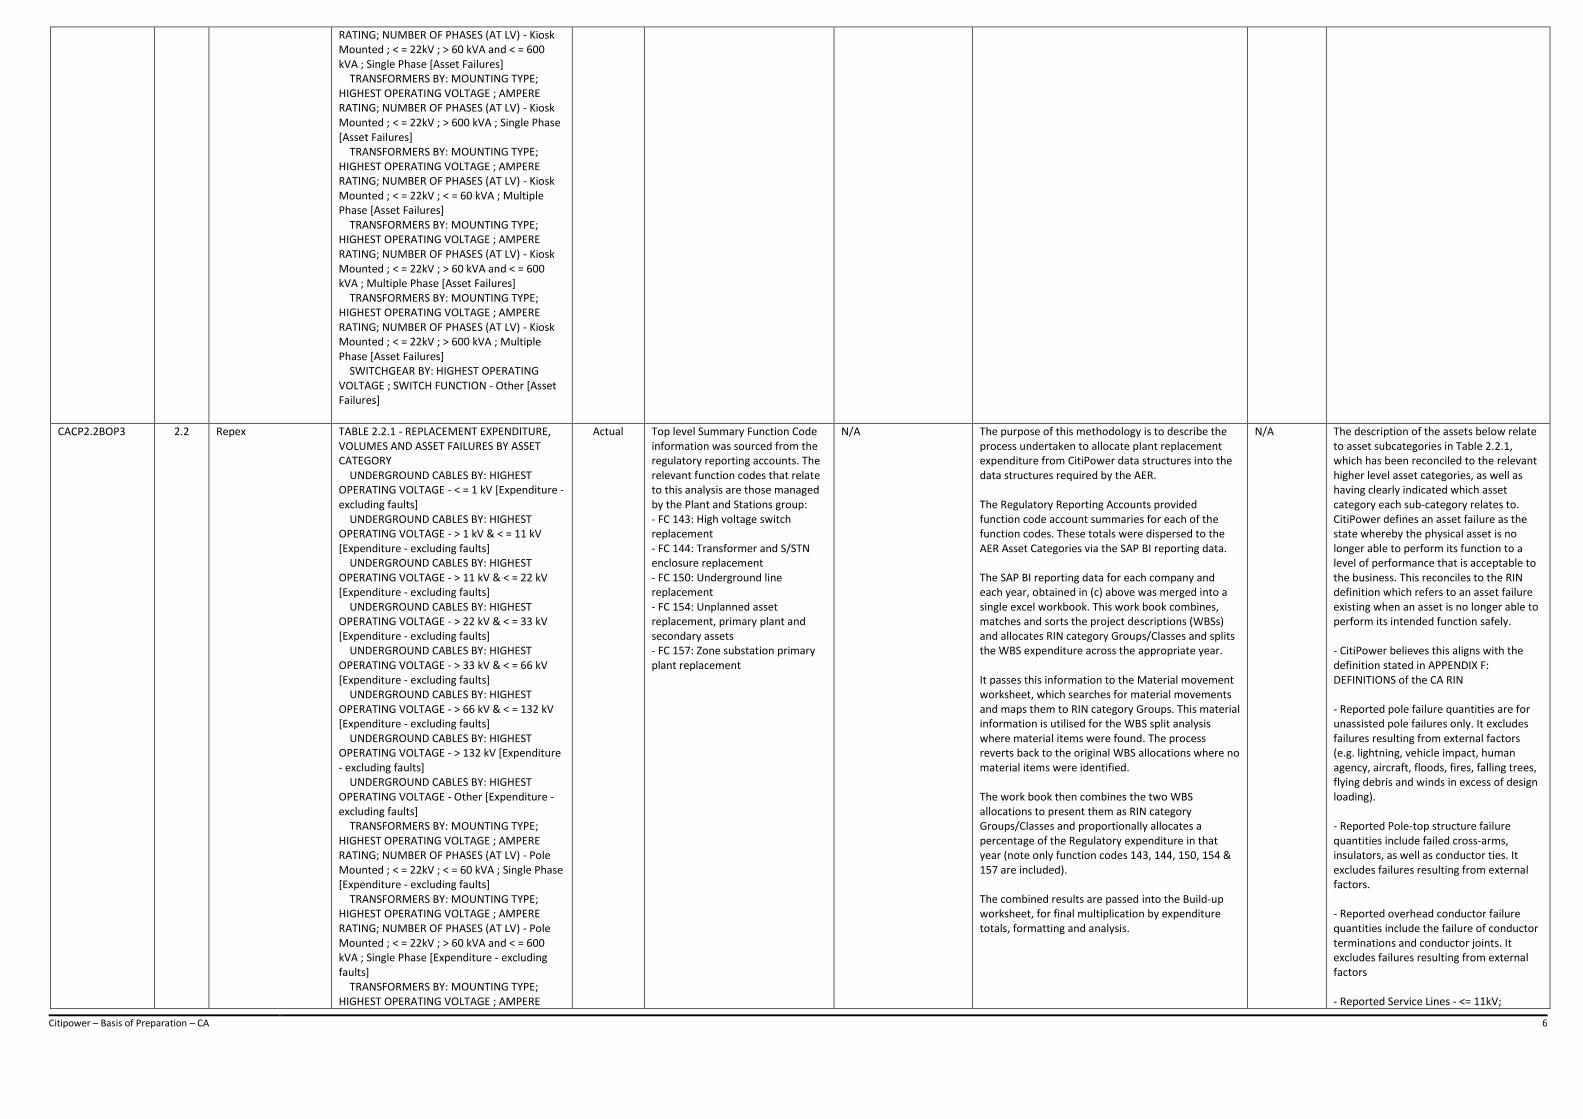
CACP2.2BOP3 2.2 Repex TABLE 2.2.1 - REPLACEMENT EXPENDITURE, VOLUMES AND ASSET FAILURES BY ASSET CATEGORY UNDERGROUND CABLES BY: HIGHEST OPERATING VOLTAGE - < = 1 kV [Expenditure - excluding faults] UNDERGROUND CABLES BY: HIGHEST OPERATING VOLTAGE - > 1 kV & < = 11 kV [Expenditure - excluding faults] UNDERGROUND CABLES BY: HIGHEST OPERATING VOLTAGE - > 11 kV & < = 22 kV [Expenditure - excluding faults] UNDERGROUND CABLES BY: HIGHEST OPERATING VOLTAGE - > 22 kV & < = 33 kV [Expenditure - excluding faults] UNDERGROUND CABLES BY: HIGHEST OPERATING VOLTAGE - > 33 kV & < = 66 kV [Expenditure - excluding faults] UNDERGROUND CABLES BY: HIGHEST OPERATING VOLTAGE - > 66 kV & < = 132 kV [Expenditure - excluding faults] UNDERGROUND CABLES BY: HIGHEST OPERATING VOLTAGE - > 132 kV [Expenditure - excluding faults] UNDERGROUND CABLES BY: HIGHEST OPERATING VOLTAGE - Other [Expenditure - excluding faults] TRANSFORMERS BY: MOUNTING TYPE; HIGHEST OPERATING VOLTAGE ; AMPERE RATING; NUMBER OF PHASES (AT LV) - Pole Mounted ; < = 22kV ; < = 60 kVA ; Single Phase [Expenditure - excluding faults] TRANSFORMERS BY: MOUNTING TYPE; HIGHEST OPERATING VOLTAGE ; AMPERE RATING; NUMBER OF PHASES (AT LV) - Pole Mounted ; < = 22kV ; > 60 kVA and < = 600 kVA ; Single Phase [Expenditure - excluding faults] TRANSFORMERS BY: MOUNTING TYPE; HIGHEST OPERATING VOLTAGE ; AMPERE
Actual Top level Summary Function Code information was sourced from the regulatory reporting accounts. The relevant function codes that relate to this analysis are those managed by the Plant and Stations group: - FC 143: High voltage switch replacement - FC 144: Transformer and S/STN enclosure replacement - FC 150: Underground line replacement - FC 154: Unplanned asset replacement, primary plant and secondary assets - FC 157: Zone substation primary plant replacement
N/A The purpose of this methodology is to describe the process undertaken to allocate plant replacement expenditure from CitiPower data structures into the data structures required by the AER. The Regulatory Reporting Accounts provided function code account summaries for each of the function codes. These totals were dispersed to the AER Asset Categories via the SAP BI reporting data. The SAP BI reporting data for each company and each year, obtained in (c) above was merged into a single excel workbook. This work book combines, matches and sorts the project descriptions (WBSs) and allocates RIN category Groups/Classes and splits the WBS expenditure across the appropriate year. It passes this information to the Material movement worksheet, which searches for material movements and maps them to RIN category Groups. This material information is utilised for the WBS split analysis where material items were found. The process reverts back to the original WBS allocations where no material items were identified. The work book then combines the two WBS allocations to present them as RIN category Groups/Classes and proportionally allocates a percentage of the Regulatory expenditure in that year (note only function codes 143, 144, 150, 154 & 157 are included). The combined results are passed into the Build-up worksheet, for final multiplication by expenditure totals, formatting and analysis.
N/A The description of the assets below relate to asset subcategories in Table 2.2.1, which has been reconciled to the relevant higher level asset categories, as well as having clearly indicated which asset category each sub-category relates to. CitiPower defines an asset failure as the state whereby the physical asset is no longer able to perform its function to a level of performance that is acceptable to the business. This reconciles to the RIN definition which refers to an asset failure existing when an asset is no longer able to perform its intended function safely. - CitiPower believes this aligns with the definition stated in APPENDIX F: DEFINITIONS of the CA RIN - Reported pole failure quantities are for unassisted pole failures only. It excludes failures resulting from external factors (e.g. lightning, vehicle impact, human agency, aircraft, floods, fires, falling trees, flying debris and winds in excess of design loading). - Reported Pole-top structure failure quantities include failed cross-arms, insulators, as well as conductor ties. It excludes failures resulting from external factors. - Reported overhead conductor failure quantities include the failure of conductor terminations and conductor joints. It excludes failures resulting from external factors - Reported Service Lines - <= 11kV;
Citipower – Basis of Preparation – CA 7
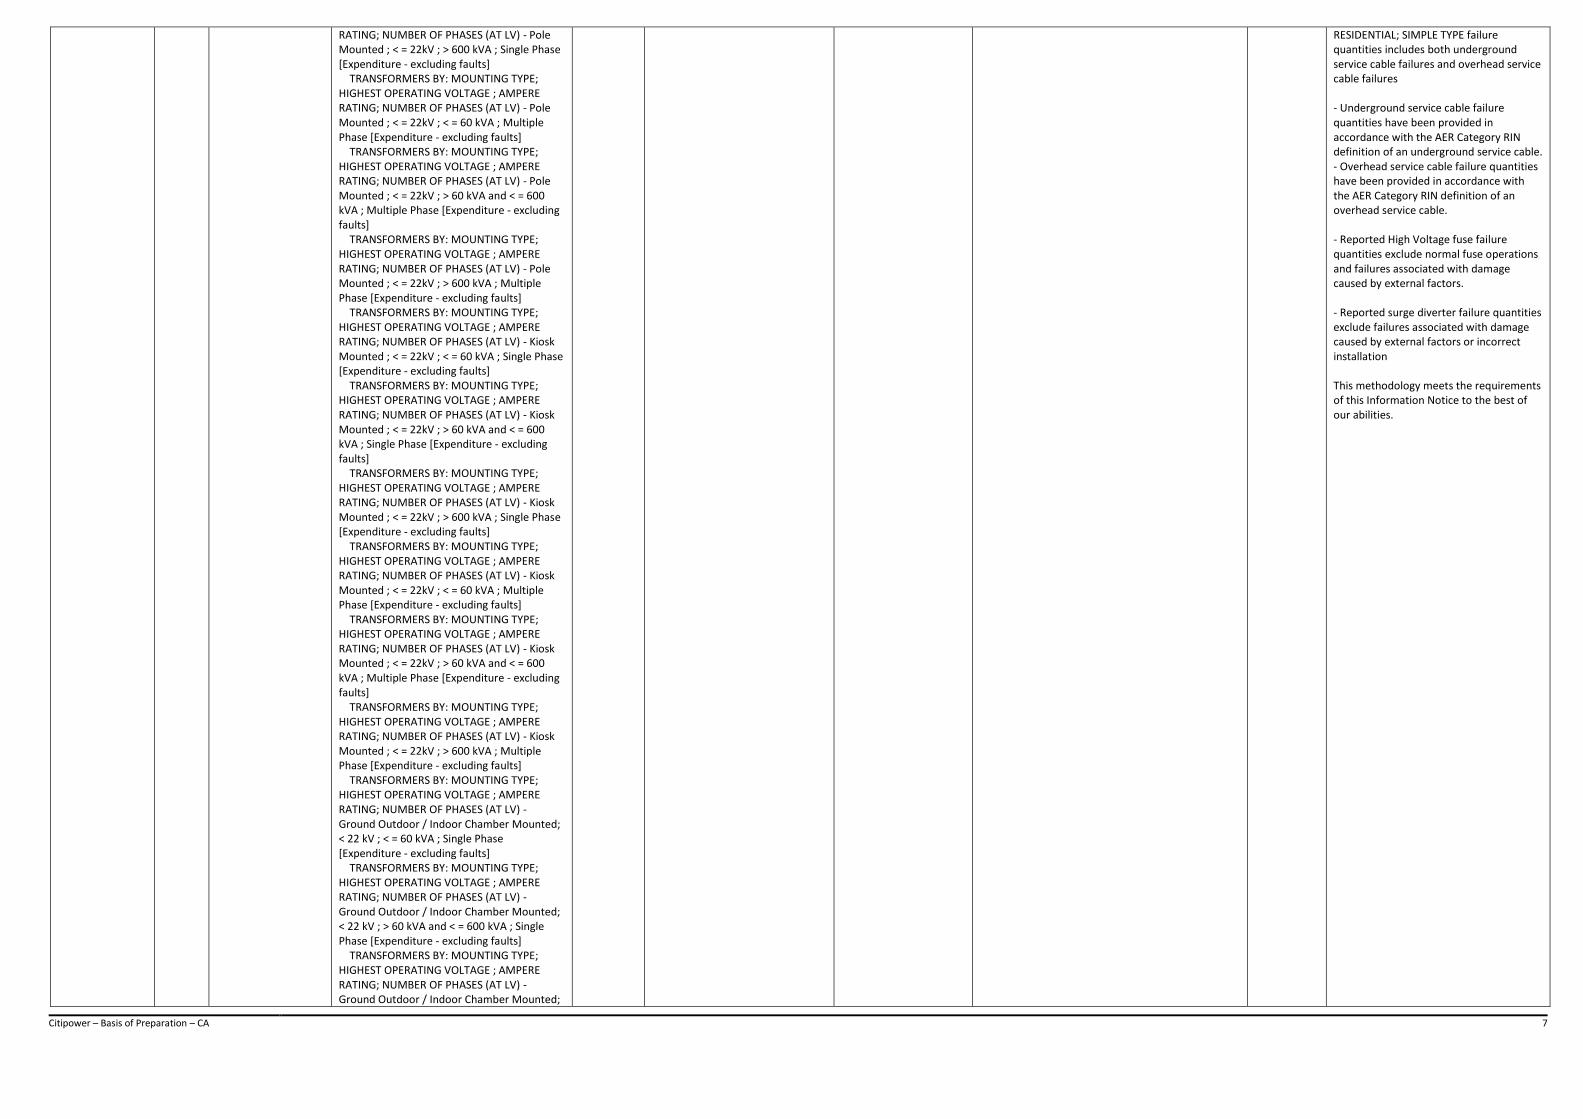
RATING; NUMBER OF PHASES (AT LV) - Pole Mounted ; < = 22kV ; > 600 kVA ; Single Phase [Expenditure - excluding faults] TRANSFORMERS BY: MOUNTING TYPE; HIGHEST OPERATING VOLTAGE ; AMPERE RATING; NUMBER OF PHASES (AT LV) - Pole Mounted ; < = 22kV ; < = 60 kVA ; Multiple Phase [Expenditure - excluding faults] TRANSFORMERS BY: MOUNTING TYPE; HIGHEST OPERATING VOLTAGE ; AMPERE RATING; NUMBER OF PHASES (AT LV) - Pole Mounted ; < = 22kV ; > 60 kVA and < = 600 kVA ; Multiple Phase [Expenditure - excluding faults] TRANSFORMERS BY: MOUNTING TYPE; HIGHEST OPERATING VOLTAGE ; AMPERE RATING; NUMBER OF PHASES (AT LV) - Pole Mounted ; < = 22kV ; > 600 kVA ; Multiple Phase [Expenditure - excluding faults] TRANSFORMERS BY: MOUNTING TYPE; HIGHEST OPERATING VOLTAGE ; AMPERE RATING; NUMBER OF PHASES (AT LV) - Kiosk Mounted ; < = 22kV ; < = 60 kVA ; Single Phase [Expenditure - excluding faults] TRANSFORMERS BY: MOUNTING TYPE; HIGHEST OPERATING VOLTAGE ; AMPERE RATING; NUMBER OF PHASES (AT LV) - Kiosk Mounted ; < = 22kV ; > 60 kVA and < = 600 kVA ; Single Phase [Expenditure - excluding faults] TRANSFORMERS BY: MOUNTING TYPE; HIGHEST OPERATING VOLTAGE ; AMPERE RATING; NUMBER OF PHASES (AT LV) - Kiosk Mounted ; < = 22kV ; > 600 kVA ; Single Phase [Expenditure - excluding faults] TRANSFORMERS BY: MOUNTING TYPE; HIGHEST OPERATING VOLTAGE ; AMPERE RATING; NUMBER OF PHASES (AT LV) - Kiosk Mounted ; < = 22kV ; < = 60 kVA ; Multiple Phase [Expenditure - excluding faults] TRANSFORMERS BY: MOUNTING TYPE; HIGHEST OPERATING VOLTAGE ; AMPERE RATING; NUMBER OF PHASES (AT LV) - Kiosk Mounted ; < = 22kV ; > 60 kVA and < = 600 kVA ; Multiple Phase [Expenditure - excluding faults] TRANSFORMERS BY: MOUNTING TYPE; HIGHEST OPERATING VOLTAGE ; AMPERE RATING; NUMBER OF PHASES (AT LV) - Kiosk Mounted ; < = 22kV ; > 600 kVA ; Multiple Phase [Expenditure - excluding faults] TRANSFORMERS BY: MOUNTING TYPE; HIGHEST OPERATING VOLTAGE ; AMPERE RATING; NUMBER OF PHASES (AT LV) - Ground Outdoor / Indoor Chamber Mounted; < 22 kV ; < = 60 kVA ; Single Phase [Expenditure - excluding faults] TRANSFORMERS BY: MOUNTING TYPE; HIGHEST OPERATING VOLTAGE ; AMPERE RATING; NUMBER OF PHASES (AT LV) - Ground Outdoor / Indoor Chamber Mounted; < 22 kV ; > 60 kVA and < = 600 kVA ; Single Phase [Expenditure - excluding faults] TRANSFORMERS BY: MOUNTING TYPE; HIGHEST OPERATING VOLTAGE ; AMPERE RATING; NUMBER OF PHASES (AT LV) - Ground Outdoor / Indoor Chamber Mounted;
RESIDENTIAL; SIMPLE TYPE failure quantities includes both underground service cable failures and overhead service cable failures - Underground service cable failure quantities have been provided in accordance with the AER Category RIN definition of an underground service cable. - Overhead service cable failure quantities have been provided in accordance with the AER Category RIN definition of an overhead service cable. - Reported High Voltage fuse failure quantities exclude normal fuse operations and failures associated with damage caused by external factors. - Reported surge diverter failure quantities exclude failures associated with damage caused by external factors or incorrect installation This methodology meets the requirements of this Information Notice to the best of our abilities.

Citipower – Basis of Preparation – CA 8
< 22 kV ; > 600 kVA ; Single Phase [Expenditure - excluding faults] TRANSFORMERS BY: MOUNTING TYPE; HIGHEST OPERATING VOLTAGE ; AMPERE RATING; NUMBER OF PHASES (AT LV) - Ground Outdoor / Indoor Chamber Mounted; < 22 kV ; < = 60 kVA ; Multiple Phase [Expenditure - excluding faults] TRANSFORMERS BY: MOUNTING TYPE; HIGHEST OPERATING VOLTAGE ; AMPERE RATING; NUMBER OF PHASES (AT LV) - Ground Outdoor / Indoor Chamber Mounted; < 22 kV ; > 60 kVA and < = 600 kVA ; Multiple Phase [Expenditure - excluding faults] TRANSFORMERS BY: MOUNTING TYPE; HIGHEST OPERATING VOLTAGE ; AMPERE RATING; NUMBER OF PHASES (AT LV) - Ground Outdoor / Indoor Chamber Mounted; < 22 kV ; > 600 kVA ; Multiple Phase [Expenditure - excluding faults] TRANSFORMERS BY: MOUNTING TYPE; HIGHEST OPERATING VOLTAGE ; AMPERE RATING; NUMBER OF PHASES (AT LV) - Ground Outdoor / Indoor Chamber Mounted; > = 22 kV & < = 33 kV ; < = 15 MVA [Expenditure - excluding faults] TRANSFORMERS BY: MOUNTING TYPE; HIGHEST OPERATING VOLTAGE ; AMPERE RATING; NUMBER OF PHASES (AT LV) - Ground Outdoor / Indoor Chamber Mounted; > = 22 kV & < = 33 kV ; > 15 MVA and < = 40 MVA [Expenditure - excluding faults] TRANSFORMERS BY: MOUNTING TYPE; HIGHEST OPERATING VOLTAGE ; AMPERE RATING; NUMBER OF PHASES (AT LV) - Ground Outdoor / Indoor Chamber Mounted; > = 22 kV & < = 33 kV ; > 40 MVA [Expenditure - excluding faults] TRANSFORMERS BY: MOUNTING TYPE; HIGHEST OPERATING VOLTAGE ; AMPERE RATING; NUMBER OF PHASES (AT LV) - Ground Outdoor / Indoor Chamber Mounted; > 33 kV & < = 66 kV ; < = 15 MVA [Expenditure - excluding faults] TRANSFORMERS BY: MOUNTING TYPE; HIGHEST OPERATING VOLTAGE ; AMPERE RATING; NUMBER OF PHASES (AT LV) - Ground Outdoor / Indoor Chamber Mounted; > 33 kV & < = 66 kV ; > 15 MVA and < = 40 MVA [Expenditure - excluding faults] TRANSFORMERS BY: MOUNTING TYPE; HIGHEST OPERATING VOLTAGE ; AMPERE RATING; NUMBER OF PHASES (AT LV) - Ground Outdoor / Indoor Chamber Mounted; > 33 kV & < = 66 kV ; > 40 MVA [Expenditure - excluding faults] TRANSFORMERS BY: MOUNTING TYPE; HIGHEST OPERATING VOLTAGE ; AMPERE RATING; NUMBER OF PHASES (AT LV) - Ground Outdoor / Indoor Chamber Mounted; > 66 kV & < = 132 kV ; < = 100 MVA [Expenditure - excluding faults] TRANSFORMERS BY: MOUNTING TYPE; HIGHEST OPERATING VOLTAGE ; AMPERE RATING; NUMBER OF PHASES (AT LV) - Ground Outdoor / Indoor Chamber Mounted; > 66 kV & < = 132 kV ; > 100 MVA

Citipower – Basis of Preparation – CA 9
[Expenditure - excluding faults] TRANSFORMERS BY: MOUNTING TYPE; HIGHEST OPERATING VOLTAGE ; AMPERE RATING; NUMBER OF PHASES (AT LV) - Ground Outdoor / Indoor Chamber Mounted; > 132 kV ; < = 100 MVA [Expenditure - excluding faults] TRANSFORMERS BY: MOUNTING TYPE; HIGHEST OPERATING VOLTAGE ; AMPERE RATING; NUMBER OF PHASES (AT LV) - Ground Outdoor / Indoor Chamber Mounted; > 132 kV ; > 100 MVA [Expenditure - excluding faults] TRANSFORMERS BY: MOUNTING TYPE; HIGHEST OPERATING VOLTAGE ; AMPERE RATING; NUMBER OF PHASES (AT LV) - Other [Expenditure - excluding faults] SWITCHGEAR BY: HIGHEST OPERATING VOLTAGE ; SWITCH FUNCTION - < = 11 kV ; FUSE [Expenditure - excluding faults] SWITCHGEAR BY: HIGHEST OPERATING VOLTAGE ; SWITCH FUNCTION - < = 11 kV ; Switch [Expenditure - excluding faults] SWITCHGEAR BY: HIGHEST OPERATING VOLTAGE ; SWITCH FUNCTION - < = 11 kV ; Circuit Breaker [Expenditure - excluding faults] SWITCHGEAR BY: HIGHEST OPERATING VOLTAGE ; SWITCH FUNCTION - > 11 kV & < = 22 kV ; Switch [Expenditure - excluding faults] SWITCHGEAR BY: HIGHEST OPERATING VOLTAGE ; SWITCH FUNCTION - > 11 kV & < = 22 kV ; Circuit Breaker [Expenditure - excluding faults] SWITCHGEAR BY: HIGHEST OPERATING VOLTAGE ; SWITCH FUNCTION - > 22 kV & < = 33 kV ; Switch [Expenditure - excluding faults] SWITCHGEAR BY: HIGHEST OPERATING VOLTAGE ; SWITCH FUNCTION - > 22 kV & < = 33 kV ; Circuit Breaker [Expenditure - excluding faults] SWITCHGEAR BY: HIGHEST OPERATING VOLTAGE ; SWITCH FUNCTION - > 33 kV & < = 66 kV ; Switch [Expenditure - excluding faults] SWITCHGEAR BY: HIGHEST OPERATING VOLTAGE ; SWITCH FUNCTION - > 33 kV & < = 66 kV ; Circuit Breaker [Expenditure - excluding faults] SWITCHGEAR BY: HIGHEST OPERATING VOLTAGE ; SWITCH FUNCTION - > 66 kV & < = 132 kV ; Switch [Expenditure - excluding faults] SWITCHGEAR BY: HIGHEST OPERATING VOLTAGE ; SWITCH FUNCTION - > 66 kV & < = 132 kV ; Circuit Breaker [Expenditure - excluding faults] SWITCHGEAR BY: HIGHEST OPERATING VOLTAGE ; SWITCH FUNCTION - > 132 kV ; Switch [Expenditure - excluding faults] SWITCHGEAR BY: HIGHEST OPERATING VOLTAGE ; SWITCH FUNCTION - > 132 kV ; Circuit Breaker [Expenditure - excluding faults] MAJOR ZONE SUBSTATION REPLACEMENT WORKS [ASSET CATEGORY] MAJOR ZONE SUBSTATION REPLACEMENT WORKS [Expenditure - excluding faults] PLANT AND STATIONS MISCELLANEOUS [ASSET CATEGORY]

Citipower – Basis of Preparation – CA 10
PLANT AND STATIONS MISCELLANEOUS [Expenditure - excluding faults]
CACP2.2BOP4 2.2 Repex TABLE 2.2.1 - REPLACEMENT EXPENDITURE, VOLUMES AND ASSET FAILURES BY ASSET CATEGORY UNDERGROUND CABLES BY: HIGHEST OPERATING VOLTAGE - < = 1 kV [Asset Replacements - excluding faults] UNDERGROUND CABLES BY: HIGHEST OPERATING VOLTAGE - > 1 kV & < = 11 kV [Asset Replacements - excluding faults] UNDERGROUND CABLES BY: HIGHEST OPERATING VOLTAGE - > 11 kV & < = 22 kV [Asset Replacements - excluding faults] UNDERGROUND CABLES BY: HIGHEST OPERATING VOLTAGE - > 22 kV & < = 33 kV [Asset Replacements - excluding faults] UNDERGROUND CABLES BY: HIGHEST OPERATING VOLTAGE - > 33 kV & < = 66 kV [Asset Replacements - excluding faults] UNDERGROUND CABLES BY: HIGHEST OPERATING VOLTAGE - > 66 kV & < = 132 kV [Asset Replacements - excluding faults] UNDERGROUND CABLES BY: HIGHEST OPERATING VOLTAGE - > 132 kV [Asset Replacements - excluding faults] UNDERGROUND CABLES BY: HIGHEST OPERATING VOLTAGE - Other [Asset Replacements - excluding faults] TRANSFORMERS BY: MOUNTING TYPE; HIGHEST OPERATING VOLTAGE ; AMPERE RATING; NUMBER OF PHASES (AT LV) - Pole Mounted ; < = 22kV ; < = 60 kVA ; Single Phase [Asset Replacements - excluding faults] TRANSFORMERS BY: MOUNTING TYPE; HIGHEST OPERATING VOLTAGE ; AMPERE RATING; NUMBER OF PHASES (AT LV) - Pole Mounted ; < = 22kV ; > 60 kVA and < = 600 kVA ; Single Phase [Asset Replacements - excluding faults] TRANSFORMERS BY: MOUNTING TYPE; HIGHEST OPERATING VOLTAGE ; AMPERE RATING; NUMBER OF PHASES (AT LV) - Pole Mounted ; < = 22kV ; > 600 kVA ; Single Phase [Asset Replacements - excluding faults] TRANSFORMERS BY: MOUNTING TYPE; HIGHEST OPERATING VOLTAGE ; AMPERE RATING; NUMBER OF PHASES (AT LV) - Pole Mounted ; < = 22kV ; < = 60 kVA ; Multiple Phase [Asset Replacements - excluding faults] TRANSFORMERS BY: MOUNTING TYPE; HIGHEST OPERATING VOLTAGE ; AMPERE RATING; NUMBER OF PHASES (AT LV) - Pole Mounted ; < = 22kV ; > 60 kVA and < = 600 kVA ; Multiple Phase [Asset Replacements - excluding faults] TRANSFORMERS BY: MOUNTING TYPE; HIGHEST OPERATING VOLTAGE ; AMPERE RATING; NUMBER OF PHASES (AT LV) - Pole Mounted ; < = 22kV ; > 600 kVA ; Multiple Phase [Asset Replacements - excluding faults] TRANSFORMERS BY: MOUNTING TYPE; HIGHEST OPERATING VOLTAGE ; AMPERE RATING; NUMBER OF PHASES (AT LV) - Kiosk Mounted ; < = 22kV ; < = 60 kVA ; Single Phase [Asset Replacements - excluding faults]
Actual The list of project work breakdown structures(WBS) was obtained from SAP Business Intelligence (BI) reports for the function codes managed by the Plant and stations group: - FC 143: High voltage switch replacement - FC 144: Transformer and S/STN enclosure replacement - FC 150: Underground line replacement - FC 154: Unplanned asset replacement primary plant and secondary assets - FC 157: Zone substation primary plant replacement Financial accounting CAPEX Report, F264 CAP CP Netw Direct CAPEX
N/A The purpose of this methodology is to describe the process undertaken to allocate plant replacement physicals from CitiPower data structures into the data structures required by the AER. The SAP BI Financial Reporting Accounts provided function code account summaries for each of the function codes. This included project WBS's which could be used to identify the SAP PM Orders used by those projects. In turn the material movement transactions within those PM Orders could be obtained. The Material movement worksheet, searches for material movements and maps them to RIN category Groups. It achieves this by two methods, the first utilises a mapping of the SAP material library to the relevant RIN Category Groups/Classes. The second delves into material purchase orders that do not use a material number transaction to further identify and define material purchases. This second method particularly applies to major plant purchases which are contract based. For WBSs that obtain a material match the WBS (project) relative expenditure is split based on the proportionality of the material costs within that project and the year it occurred. This information is passed back to BI Function code/WBS calculator workbook. The BI Function code/WBS calculator worksheet workbook also identifies and ignores material transactions that has a negating return in a following year. This is required as these transactions can have major consequences on WBS proportionality particularly if the movement cost is large in comparison to the final (net) WBS expenditure. Lastly, the replacement numbers for the RIN Category Groups/Classes are also passed to the Build-up workbook, for formatting, analysis and summation.
N/A Table 2.2.1: (a) No sub categories were used. (b) Expenditure associated with asset refurbishments/life extension capex has been included in a row at the bottom of the table. Corresponding age profile data has been provided in regulatory template 5.2 (c) Additional rows have been added where required to describe a specific asset category (d) Replacement volumes by asset group is equal to the applicable replacement volume data provided in table 2.2.2. (e) The sum of the asset group replacement expenditure is equal to the total replacement expenditure contained in regulatory template 2.1. (f) The categories covered by this BOP do not cross asset categories.
Citipower – Basis of Preparation – CA 11
TRANSFORMERS BY: MOUNTING TYPE; HIGHEST OPERATING VOLTAGE ; AMPERE RATING; NUMBER OF PHASES (AT LV) - Kiosk Mounted ; < = 22kV ; > 60 kVA and < = 600 kVA ; Single Phase [Asset Replacements - excluding faults] TRANSFORMERS BY: MOUNTING TYPE; HIGHEST OPERATING VOLTAGE ; AMPERE RATING; NUMBER OF PHASES (AT LV) - Kiosk Mounted ; < = 22kV ; > 600 kVA ; Single Phase [Asset Replacements - excluding faults] TRANSFORMERS BY: MOUNTING TYPE; HIGHEST OPERATING VOLTAGE ; AMPERE RATING; NUMBER OF PHASES (AT LV) - Kiosk Mounted ; < = 22kV ; < = 60 kVA ; Multiple Phase [Asset Replacements - excluding faults] TRANSFORMERS BY: MOUNTING TYPE; HIGHEST OPERATING VOLTAGE ; AMPERE RATING; NUMBER OF PHASES (AT LV) - Kiosk Mounted ; < = 22kV ; > 60 kVA and < = 600 kVA ; Multiple Phase [Asset Replacements - excluding faults] TRANSFORMERS BY: MOUNTING TYPE; HIGHEST OPERATING VOLTAGE ; AMPERE RATING; NUMBER OF PHASES (AT LV) - Kiosk Mounted ; < = 22kV ; > 600 kVA ; Multiple Phase [Asset Replacements - excluding faults] TRANSFORMERS BY: MOUNTING TYPE; HIGHEST OPERATING VOLTAGE ; AMPERE RATING; NUMBER OF PHASES (AT LV) - Ground Outdoor / Indoor Chamber Mounted; < 22 kV ; < = 60 kVA ; Single Phase [Asset Replacements - excluding faults] TRANSFORMERS BY: MOUNTING TYPE; HIGHEST OPERATING VOLTAGE ; AMPERE RATING; NUMBER OF PHASES (AT LV) - Ground Outdoor / Indoor Chamber Mounted; < 22 kV ; > 60 kVA and < = 600 kVA ; Single Phase [Asset Replacements - excluding faults] TRANSFORMERS BY: MOUNTING TYPE; HIGHEST OPERATING VOLTAGE ; AMPERE RATING; NUMBER OF PHASES (AT LV) - Ground Outdoor / Indoor Chamber Mounted; < 22 kV ; > 600 kVA ; Single Phase [Asset Replacements - excluding faults] TRANSFORMERS BY: MOUNTING TYPE; HIGHEST OPERATING VOLTAGE ; AMPERE RATING; NUMBER OF PHASES (AT LV) - Ground Outdoor / Indoor Chamber Mounted; < 22 kV ; < = 60 kVA ; Multiple Phase [Asset Replacements - excluding faults] TRANSFORMERS BY: MOUNTING TYPE; HIGHEST OPERATING VOLTAGE ; AMPERE RATING; NUMBER OF PHASES (AT LV) - Ground Outdoor / Indoor Chamber Mounted; < 22 kV ; > 60 kVA and < = 600 kVA ; Multiple Phase [Asset Replacements - excluding faults] TRANSFORMERS BY: MOUNTING TYPE; HIGHEST OPERATING VOLTAGE ; AMPERE RATING; NUMBER OF PHASES (AT LV) - Ground Outdoor / Indoor Chamber Mounted; < 22 kV ; > 600 kVA ; Multiple Phase [Asset Replacements - excluding faults] TRANSFORMERS BY: MOUNTING TYPE; HIGHEST OPERATING VOLTAGE ; AMPERE RATING; NUMBER OF PHASES (AT LV) - Ground Outdoor / Indoor Chamber Mounted;

Citipower – Basis of Preparation – CA 12
> = 22 kV & < = 33 kV ; < = 15 MVA [Asset Replacements - excluding faults] TRANSFORMERS BY: MOUNTING TYPE; HIGHEST OPERATING VOLTAGE ; AMPERE RATING; NUMBER OF PHASES (AT LV) - Ground Outdoor / Indoor Chamber Mounted; > = 22 kV & < = 33 kV ; > 15 MVA and < = 40 MVA [Asset Replacements - excluding faults] TRANSFORMERS BY: MOUNTING TYPE; HIGHEST OPERATING VOLTAGE ; AMPERE RATING; NUMBER OF PHASES (AT LV) - Ground Outdoor / Indoor Chamber Mounted; > = 22 kV & < = 33 kV ; > 40 MVA [Asset Replacements - excluding faults] TRANSFORMERS BY: MOUNTING TYPE; HIGHEST OPERATING VOLTAGE ; AMPERE RATING; NUMBER OF PHASES (AT LV) - Ground Outdoor / Indoor Chamber Mounted; > 33 kV & < = 66 kV ; < = 15 MVA [Asset Replacements - excluding faults] TRANSFORMERS BY: MOUNTING TYPE; HIGHEST OPERATING VOLTAGE ; AMPERE RATING; NUMBER OF PHASES (AT LV) - Ground Outdoor / Indoor Chamber Mounted; > 33 kV & < = 66 kV ; > 15 MVA and < = 40 MVA [Asset Replacements - excluding faults] TRANSFORMERS BY: MOUNTING TYPE; HIGHEST OPERATING VOLTAGE ; AMPERE RATING; NUMBER OF PHASES (AT LV) - Ground Outdoor / Indoor Chamber Mounted; > 33 kV & < = 66 kV ; > 40 MVA [Asset Replacements - excluding faults] TRANSFORMERS BY: MOUNTING TYPE; HIGHEST OPERATING VOLTAGE ; AMPERE RATING; NUMBER OF PHASES (AT LV) - Ground Outdoor / Indoor Chamber Mounted; > 66 kV & < = 132 kV ; < = 100 MVA [Asset Replacements - excluding faults] TRANSFORMERS BY: MOUNTING TYPE; HIGHEST OPERATING VOLTAGE ; AMPERE RATING; NUMBER OF PHASES (AT LV) - Ground Outdoor / Indoor Chamber Mounted; > 66 kV & < = 132 kV ; > 100 MVA [Asset Replacements - excluding faults] TRANSFORMERS BY: MOUNTING TYPE; HIGHEST OPERATING VOLTAGE ; AMPERE RATING; NUMBER OF PHASES (AT LV) - Ground Outdoor / Indoor Chamber Mounted; > 132 kV ; < = 100 MVA [Asset Replacements - excluding faults] TRANSFORMERS BY: MOUNTING TYPE; HIGHEST OPERATING VOLTAGE ; AMPERE RATING; NUMBER OF PHASES (AT LV) - Ground Outdoor / Indoor Chamber Mounted; > 132 kV ; > 100 MVA [Asset Replacements - excluding faults] TRANSFORMERS BY: MOUNTING TYPE; HIGHEST OPERATING VOLTAGE ; AMPERE RATING; NUMBER OF PHASES (AT LV) - Other [Asset Replacements - excluding faults] SWITCHGEAR BY: HIGHEST OPERATING VOLTAGE ; SWITCH FUNCTION - < = 11 kV ; FUSE [Asset Replacements - excluding faults] SWITCHGEAR BY: HIGHEST OPERATING VOLTAGE ; SWITCH FUNCTION - < = 11 kV ; Switch [Asset Replacements - excluding faults] SWITCHGEAR BY: HIGHEST OPERATING
Citipower – Basis of Preparation – CA 13
VOLTAGE ; SWITCH FUNCTION - < = 11 kV ; Circuit Breaker [Asset Replacements - excluding faults] SWITCHGEAR BY: HIGHEST OPERATING VOLTAGE ; SWITCH FUNCTION - > 11 kV & < = 22 kV ; Switch [Asset Replacements - excluding faults] SWITCHGEAR BY: HIGHEST OPERATING VOLTAGE ; SWITCH FUNCTION - > 11 kV & < = 22 kV ; Circuit Breaker [Asset Replacements - excluding faults] SWITCHGEAR BY: HIGHEST OPERATING VOLTAGE ; SWITCH FUNCTION - > 22 kV & < = 33 kV ; Switch [Asset Replacements - excluding faults] SWITCHGEAR BY: HIGHEST OPERATING VOLTAGE ; SWITCH FUNCTION - > 22 kV & < = 33 kV ; Circuit Breaker [Asset Replacements - excluding faults] SWITCHGEAR BY: HIGHEST OPERATING VOLTAGE ; SWITCH FUNCTION - > 33 kV & < = 66 kV ; Switch [Asset Replacements - excluding faults] SWITCHGEAR BY: HIGHEST OPERATING VOLTAGE ; SWITCH FUNCTION - > 33 kV & < = 66 kV ; Circuit Breaker [Asset Replacements - excluding faults] SWITCHGEAR BY: HIGHEST OPERATING VOLTAGE ; SWITCH FUNCTION - > 66 kV & < = 132 kV ; Switch [Asset Replacements - excluding faults] SWITCHGEAR BY: HIGHEST OPERATING VOLTAGE ; SWITCH FUNCTION - > 66 kV & < = 132 kV ; Circuit Breaker [Asset Replacements - excluding faults] SWITCHGEAR BY: HIGHEST OPERATING VOLTAGE ; SWITCH FUNCTION - > 132 kV ; Switch [Asset Replacements - excluding faults] MAJOR ZONE SUBSTATION REPLACEMENT WORKS [Asset Replacements - excluding faults] PLANT AND STATIONS MISCELLANEOUS [Asset Replacements - excluding faults]
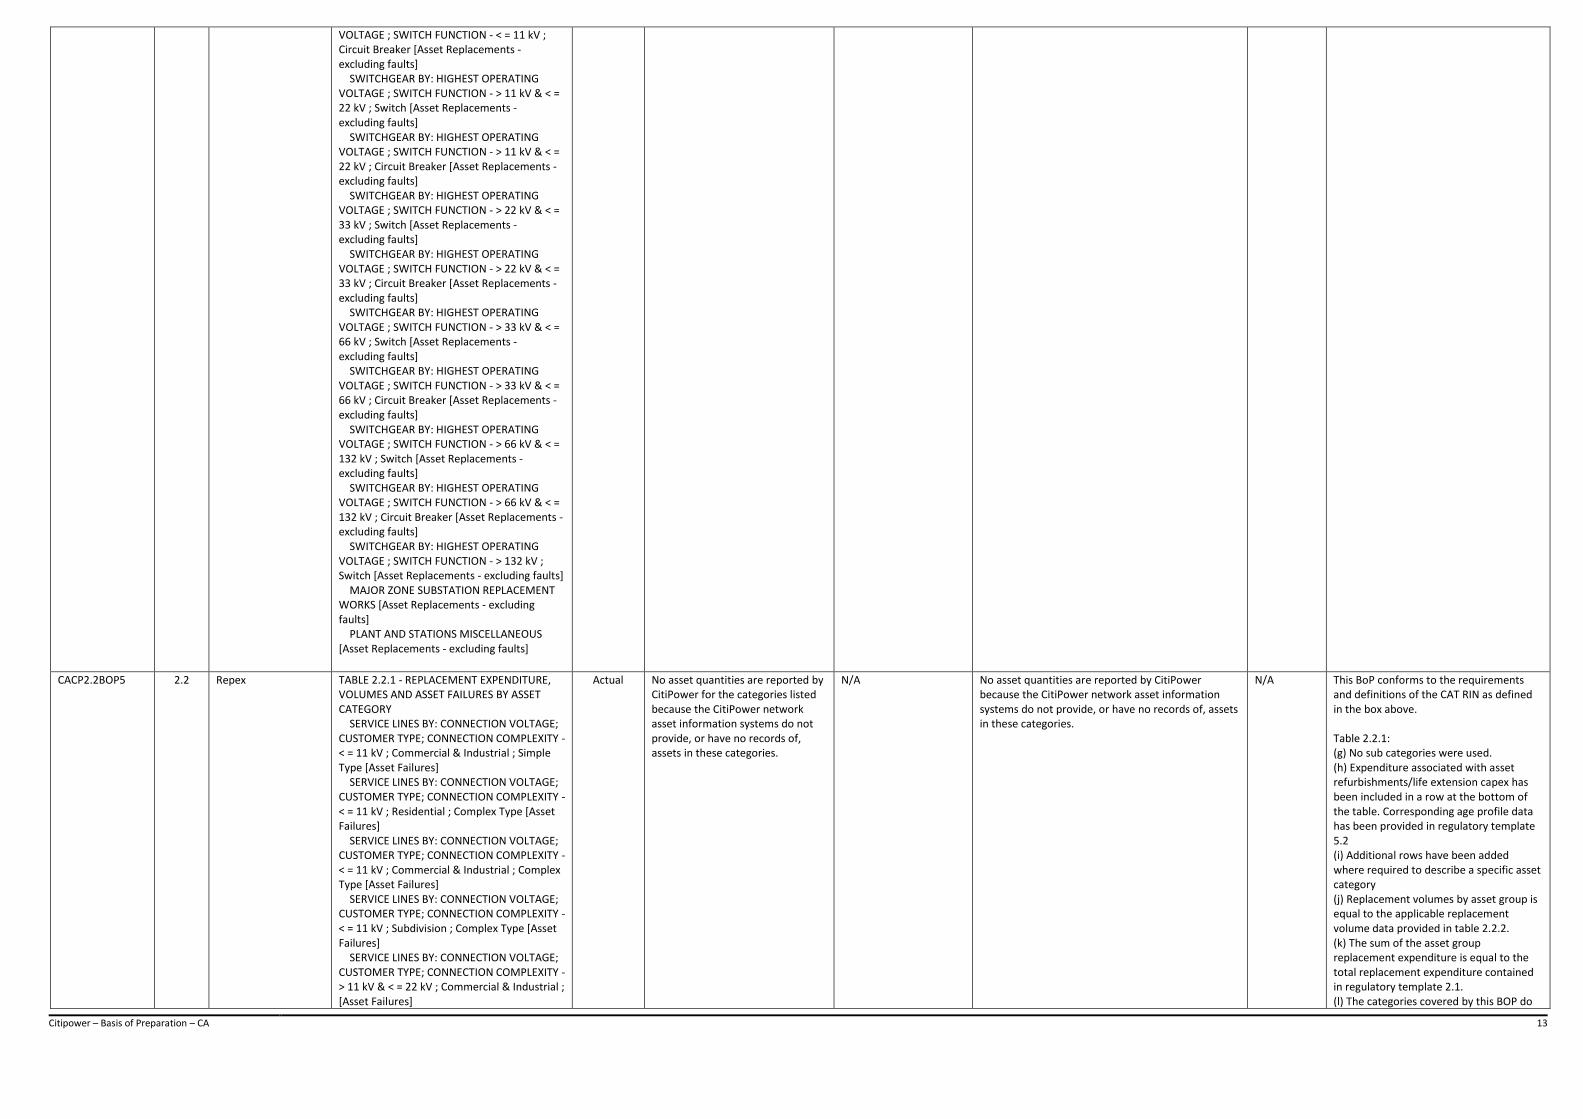
CACP2.2BOP5 2.2 Repex TABLE 2.2.1 - REPLACEMENT EXPENDITURE, VOLUMES AND ASSET FAILURES BY ASSET CATEGORY SERVICE LINES BY: CONNECTION VOLTAGE; CUSTOMER TYPE; CONNECTION COMPLEXITY - < = 11 kV ; Commercial & Industrial ; Simple Type [Asset Failures] SERVICE LINES BY: CONNECTION VOLTAGE; CUSTOMER TYPE; CONNECTION COMPLEXITY - < = 11 kV ; Residential ; Complex Type [Asset Failures] SERVICE LINES BY: CONNECTION VOLTAGE; CUSTOMER TYPE; CONNECTION COMPLEXITY - < = 11 kV ; Commercial & Industrial ; Complex Type [Asset Failures] SERVICE LINES BY: CONNECTION VOLTAGE; CUSTOMER TYPE; CONNECTION COMPLEXITY - < = 11 kV ; Subdivision ; Complex Type [Asset Failures] SERVICE LINES BY: CONNECTION VOLTAGE; CUSTOMER TYPE; CONNECTION COMPLEXITY - > 11 kV & < = 22 kV ; Commercial & Industrial ; [Asset Failures]
Actual No asset quantities are reported by CitiPower for the categories listed because the CitiPower network asset information systems do not provide, or have no records of, assets in these categories.
N/A No asset quantities are reported by CitiPower because the CitiPower network asset information systems do not provide, or have no records of, assets in these categories.
N/A This BoP conforms to the requirements and definitions of the CAT RIN as defined in the box above. Table 2.2.1: (g) No sub categories were used. (h) Expenditure associated with asset refurbishments/life extension capex has been included in a row at the bottom of the table. Corresponding age profile data has been provided in regulatory template 5.2 (i) Additional rows have been added where required to describe a specific asset category (j) Replacement volumes by asset group is equal to the applicable replacement volume data provided in table 2.2.2. (k) The sum of the asset group replacement expenditure is equal to the total replacement expenditure contained in regulatory template 2.1. (l) The categories covered by this BOP do
Citipower – Basis of Preparation – CA 14
SERVICE LINES BY: CONNECTION VOLTAGE; CUSTOMER TYPE; CONNECTION COMPLEXITY - > 11 kV & < = 22 kV ; Subdivision ; [Asset Failures] SERVICE LINES BY: CONNECTION VOLTAGE; CUSTOMER TYPE; CONNECTION COMPLEXITY - > 22 kV & < = 33 kV ; Commercial & Industrial ; [Asset Failures] SERVICE LINES BY: CONNECTION VOLTAGE; CUSTOMER TYPE; CONNECTION COMPLEXITY - > 22 kV & < = 33 kV ; Subdivision ; [Asset Failures] SERVICE LINES BY: CONNECTION VOLTAGE; CUSTOMER TYPE; CONNECTION COMPLEXITY - > 33 kV & < = 66 kV ; Commercial & Industrial ; [Asset Failures] SERVICE LINES BY: CONNECTION VOLTAGE; CUSTOMER TYPE; CONNECTION COMPLEXITY - > 33 kV & < = 66 kV ; Subdivision ; [Asset Failures] SERVICE LINES BY: CONNECTION VOLTAGE; CUSTOMER TYPE; CONNECTION COMPLEXITY - > 66 kV & < = 132 kV ; Commercial & Industrial ; [Asset Failures] SERVICE LINES BY: CONNECTION VOLTAGE; CUSTOMER TYPE; CONNECTION COMPLEXITY - > 66 kV & < = 132 kV ; Subdivision ; [Asset Failures] SERVICE LINES BY: CONNECTION VOLTAGE; CUSTOMER TYPE; CONNECTION COMPLEXITY - > 132 kV ; Commercial & Industrial ; [Asset Failures] SERVICE LINES BY: CONNECTION VOLTAGE; CUSTOMER TYPE; CONNECTION COMPLEXITY - > 132 kV ; Subdivision ; [Asset Failures] SERVICE LINES BY: CONNECTION VOLTAGE; CUSTOMER TYPE; CONNECTION COMPLEXITY - Other [Asset Failures]
not cross asset categories.
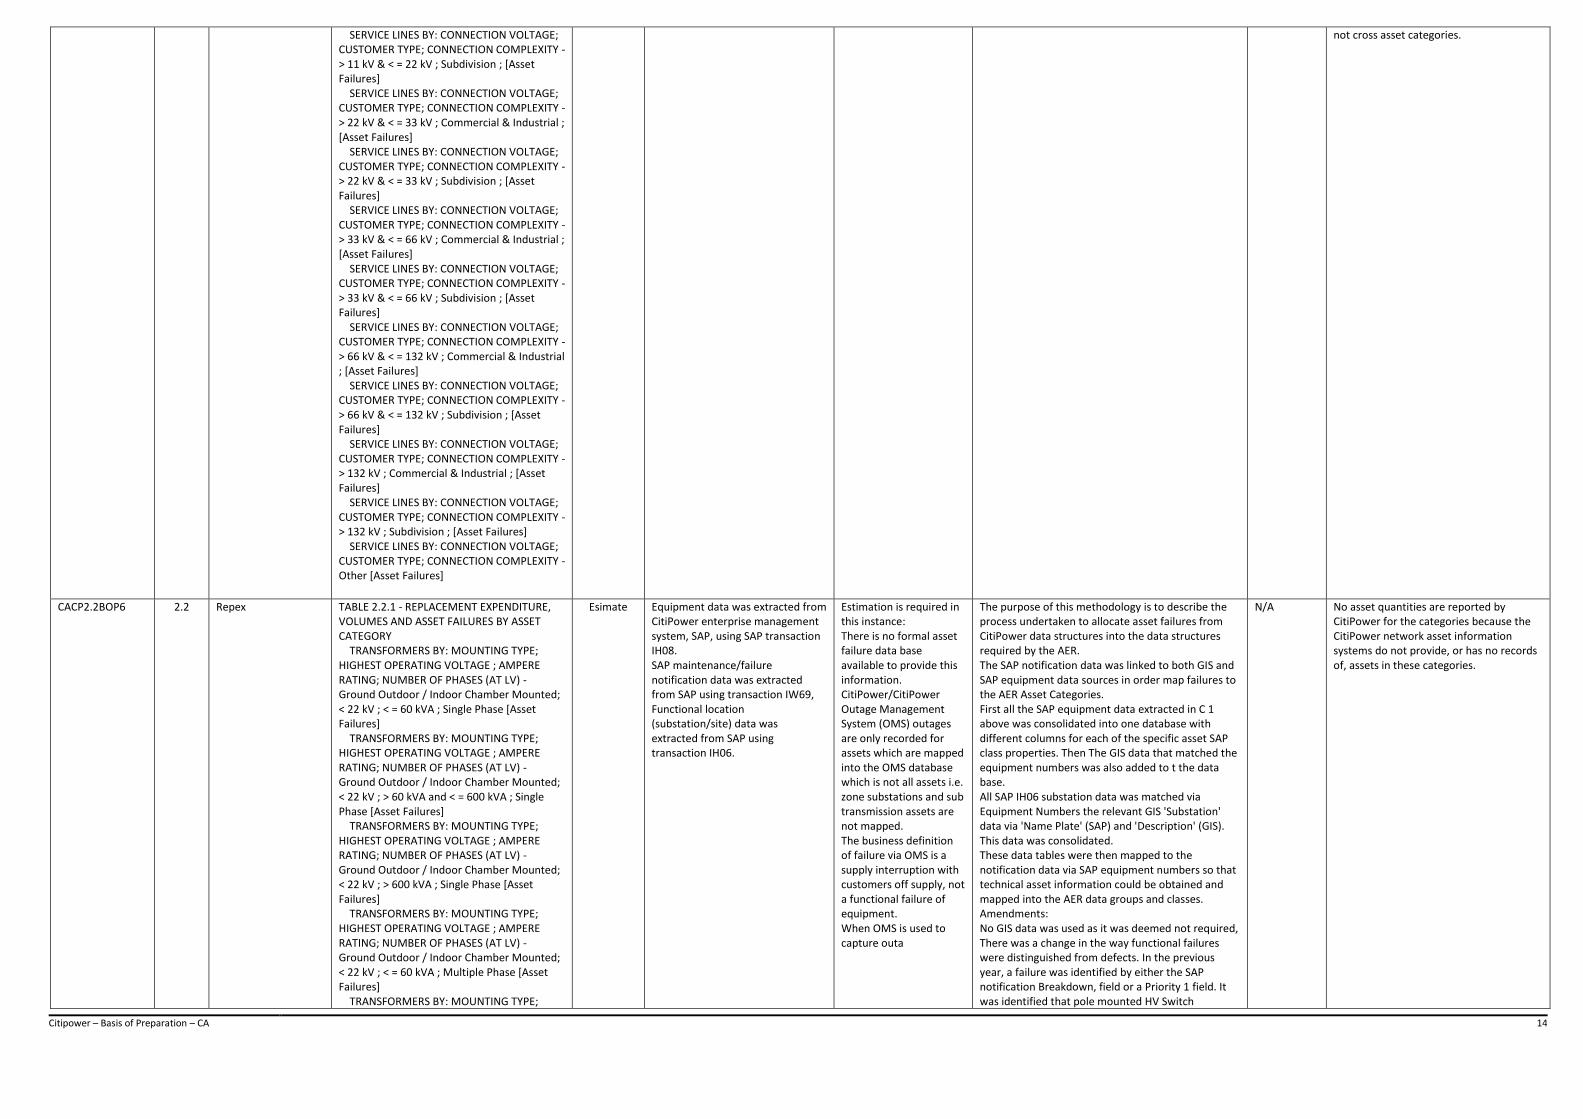
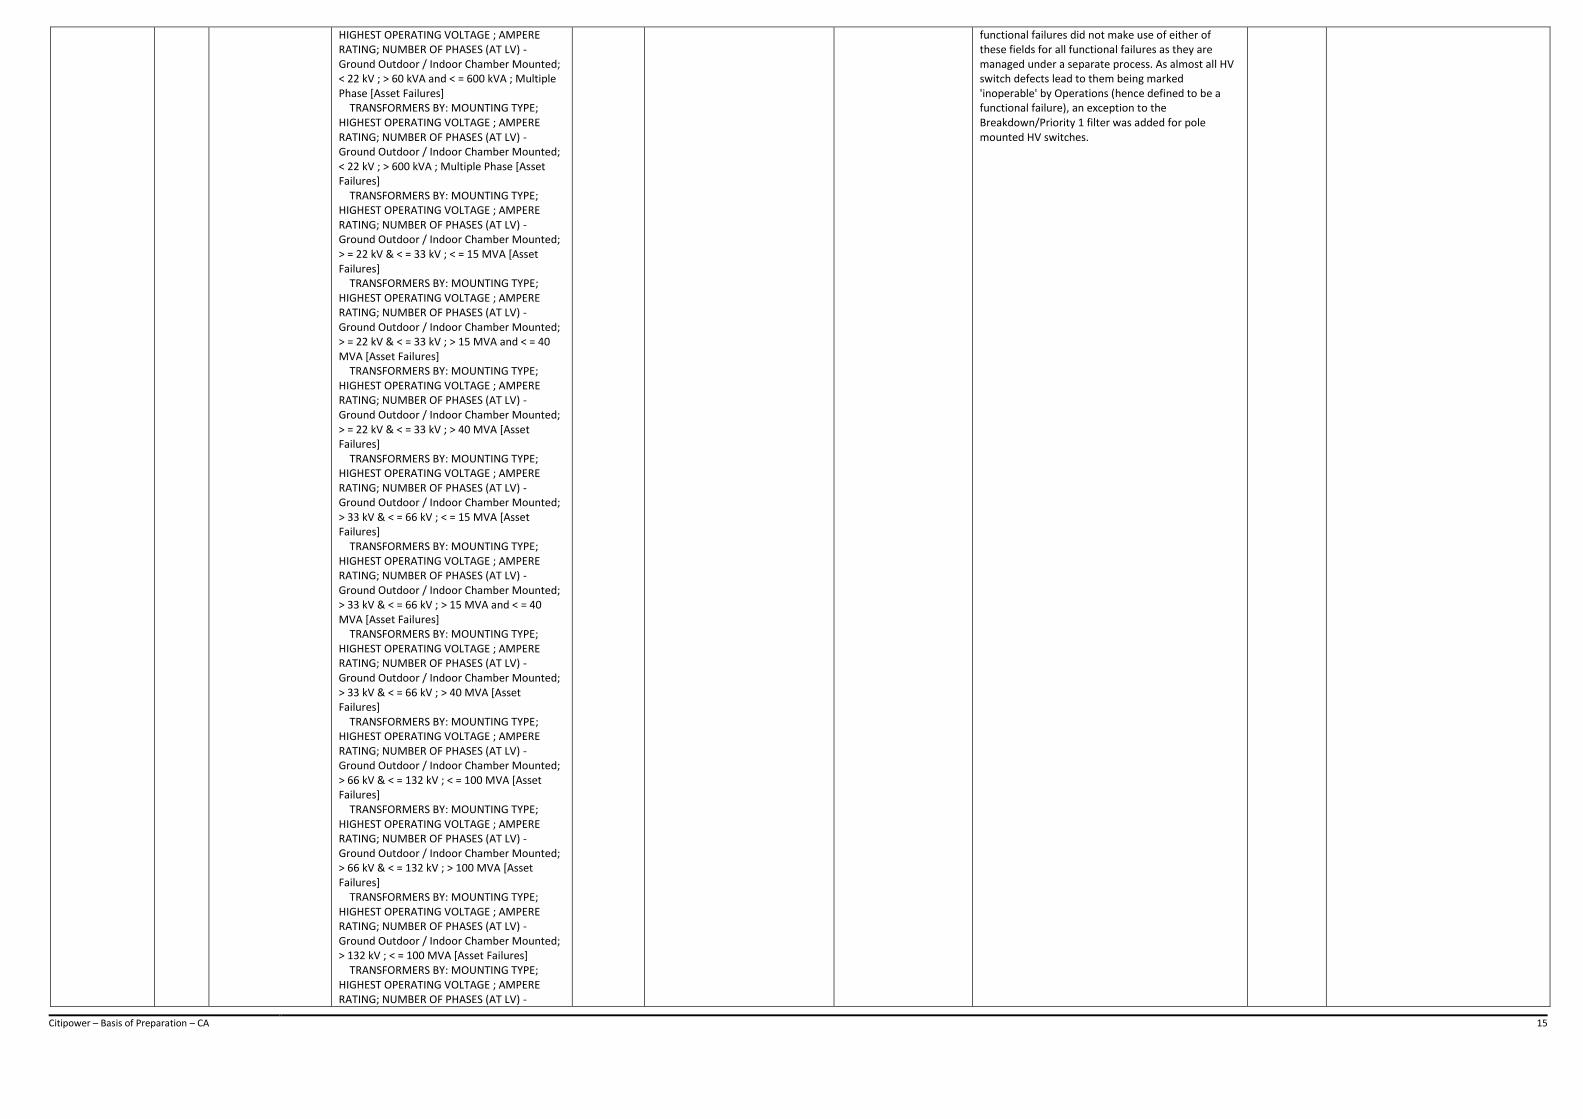
CACP2.2BOP6 2.2 Repex TABLE 2.2.1 - REPLACEMENT EXPENDITURE, VOLUMES AND ASSET FAILURES BY ASSET CATEGORY TRANSFORMERS BY: MOUNTING TYPE; HIGHEST OPERATING VOLTAGE ; AMPERE RATING; NUMBER OF PHASES (AT LV) - Ground Outdoor / Indoor Chamber Mounted; < 22 kV ; < = 60 kVA ; Single Phase [Asset Failures] TRANSFORMERS BY: MOUNTING TYPE; HIGHEST OPERATING VOLTAGE ; AMPERE RATING; NUMBER OF PHASES (AT LV) - Ground Outdoor / Indoor Chamber Mounted; < 22 kV ; > 60 kVA and < = 600 kVA ; Single Phase [Asset Failures] TRANSFORMERS BY: MOUNTING TYPE; HIGHEST OPERATING VOLTAGE ; AMPERE RATING; NUMBER OF PHASES (AT LV) - Ground Outdoor / Indoor Chamber Mounted; < 22 kV ; > 600 kVA ; Single Phase [Asset Failures] TRANSFORMERS BY: MOUNTING TYPE; HIGHEST OPERATING VOLTAGE ; AMPERE RATING; NUMBER OF PHASES (AT LV) - Ground Outdoor / Indoor Chamber Mounted; < 22 kV ; < = 60 kVA ; Multiple Phase [Asset Failures] TRANSFORMERS BY: MOUNTING TYPE;
Esimate Equipment data was extracted from CitiPower enterprise management system, SAP, using SAP transaction IH08. SAP maintenance/failure notification data was extracted from SAP using transaction IW69, Functional location (substation/site) data was extracted from SAP using transaction IH06.
Estimation is required in this instance: There is no formal asset failure data base available to provide this information. CitiPower/CitiPower Outage Management System (OMS) outages are only recorded for assets which are mapped into the OMS database which is not all assets i.e. zone substations and sub transmission assets are not mapped. The business definition of failure via OMS is a supply interruption with customers off supply, not a functional failure of equipment. When OMS is used to capture outa
The purpose of this methodology is to describe the process undertaken to allocate asset failures from CitiPower data structures into the data structures required by the AER. The SAP notification data was linked to both GIS and SAP equipment data sources in order map failures to the AER Asset Categories. First all the SAP equipment data extracted in C 1 above was consolidated into one database with different columns for each of the specific asset SAP class properties. Then The GIS data that matched the equipment numbers was also added to t the data base. All SAP IH06 substation data was matched via Equipment Numbers the relevant GIS 'Substation' data via 'Name Plate' (SAP) and 'Description' (GIS). This data was consolidated. These data tables were then mapped to the notification data via SAP equipment numbers so that technical asset information could be obtained and mapped into the AER data groups and classes. Amendments: No GIS data was used as it was deemed not required, There was a change in the way functional failures were distinguished from defects. In the previous year, a failure was identified by either the SAP notification Breakdown, field or a Priority 1 field. It was identified that pole mounted HV Switch
N/A No asset quantities are reported by CitiPower for the categories because the CitiPower network asset information systems do not provide, or has no records of, assets in these categories.
Citipower – Basis of Preparation – CA 15
HIGHEST OPERATING VOLTAGE ; AMPERE RATING; NUMBER OF PHASES (AT LV) - Ground Outdoor / Indoor Chamber Mounted; < 22 kV ; > 60 kVA and < = 600 kVA ; Multiple Phase [Asset Failures] TRANSFORMERS BY: MOUNTING TYPE; HIGHEST OPERATING VOLTAGE ; AMPERE RATING; NUMBER OF PHASES (AT LV) - Ground Outdoor / Indoor Chamber Mounted; < 22 kV ; > 600 kVA ; Multiple Phase [Asset Failures] TRANSFORMERS BY: MOUNTING TYPE; HIGHEST OPERATING VOLTAGE ; AMPERE RATING; NUMBER OF PHASES (AT LV) - Ground Outdoor / Indoor Chamber Mounted; > = 22 kV & < = 33 kV ; < = 15 MVA [Asset Failures] TRANSFORMERS BY: MOUNTING TYPE; HIGHEST OPERATING VOLTAGE ; AMPERE RATING; NUMBER OF PHASES (AT LV) - Ground Outdoor / Indoor Chamber Mounted; > = 22 kV & < = 33 kV ; > 15 MVA and < = 40 MVA [Asset Failures] TRANSFORMERS BY: MOUNTING TYPE; HIGHEST OPERATING VOLTAGE ; AMPERE RATING; NUMBER OF PHASES (AT LV) - Ground Outdoor / Indoor Chamber Mounted; > = 22 kV & < = 33 kV ; > 40 MVA [Asset Failures] TRANSFORMERS BY: MOUNTING TYPE; HIGHEST OPERATING VOLTAGE ; AMPERE RATING; NUMBER OF PHASES (AT LV) - Ground Outdoor / Indoor Chamber Mounted; > 33 kV & < = 66 kV ; < = 15 MVA [Asset Failures] TRANSFORMERS BY: MOUNTING TYPE; HIGHEST OPERATING VOLTAGE ; AMPERE RATING; NUMBER OF PHASES (AT LV) - Ground Outdoor / Indoor Chamber Mounted; > 33 kV & < = 66 kV ; > 15 MVA and < = 40 MVA [Asset Failures] TRANSFORMERS BY: MOUNTING TYPE; HIGHEST OPERATING VOLTAGE ; AMPERE RATING; NUMBER OF PHASES (AT LV) - Ground Outdoor / Indoor Chamber Mounted; > 33 kV & < = 66 kV ; > 40 MVA [Asset Failures] TRANSFORMERS BY: MOUNTING TYPE; HIGHEST OPERATING VOLTAGE ; AMPERE RATING; NUMBER OF PHASES (AT LV) - Ground Outdoor / Indoor Chamber Mounted; > 66 kV & < = 132 kV ; < = 100 MVA [Asset Failures] TRANSFORMERS BY: MOUNTING TYPE; HIGHEST OPERATING VOLTAGE ; AMPERE RATING; NUMBER OF PHASES (AT LV) - Ground Outdoor / Indoor Chamber Mounted; > 66 kV & < = 132 kV ; > 100 MVA [Asset Failures] TRANSFORMERS BY: MOUNTING TYPE; HIGHEST OPERATING VOLTAGE ; AMPERE RATING; NUMBER OF PHASES (AT LV) - Ground Outdoor / Indoor Chamber Mounted; > 132 kV ; < = 100 MVA [Asset Failures] TRANSFORMERS BY: MOUNTING TYPE; HIGHEST OPERATING VOLTAGE ; AMPERE RATING; NUMBER OF PHASES (AT LV) -
functional failures did not make use of either of these fields for all functional failures as they are managed under a separate process. As almost all HV switch defects lead to them being marked 'inoperable' by Operations (hence defined to be a functional failure), an exception to the Breakdown/Priority 1 filter was added for pole mounted HV switches.
Citipower – Basis of Preparation – CA 16
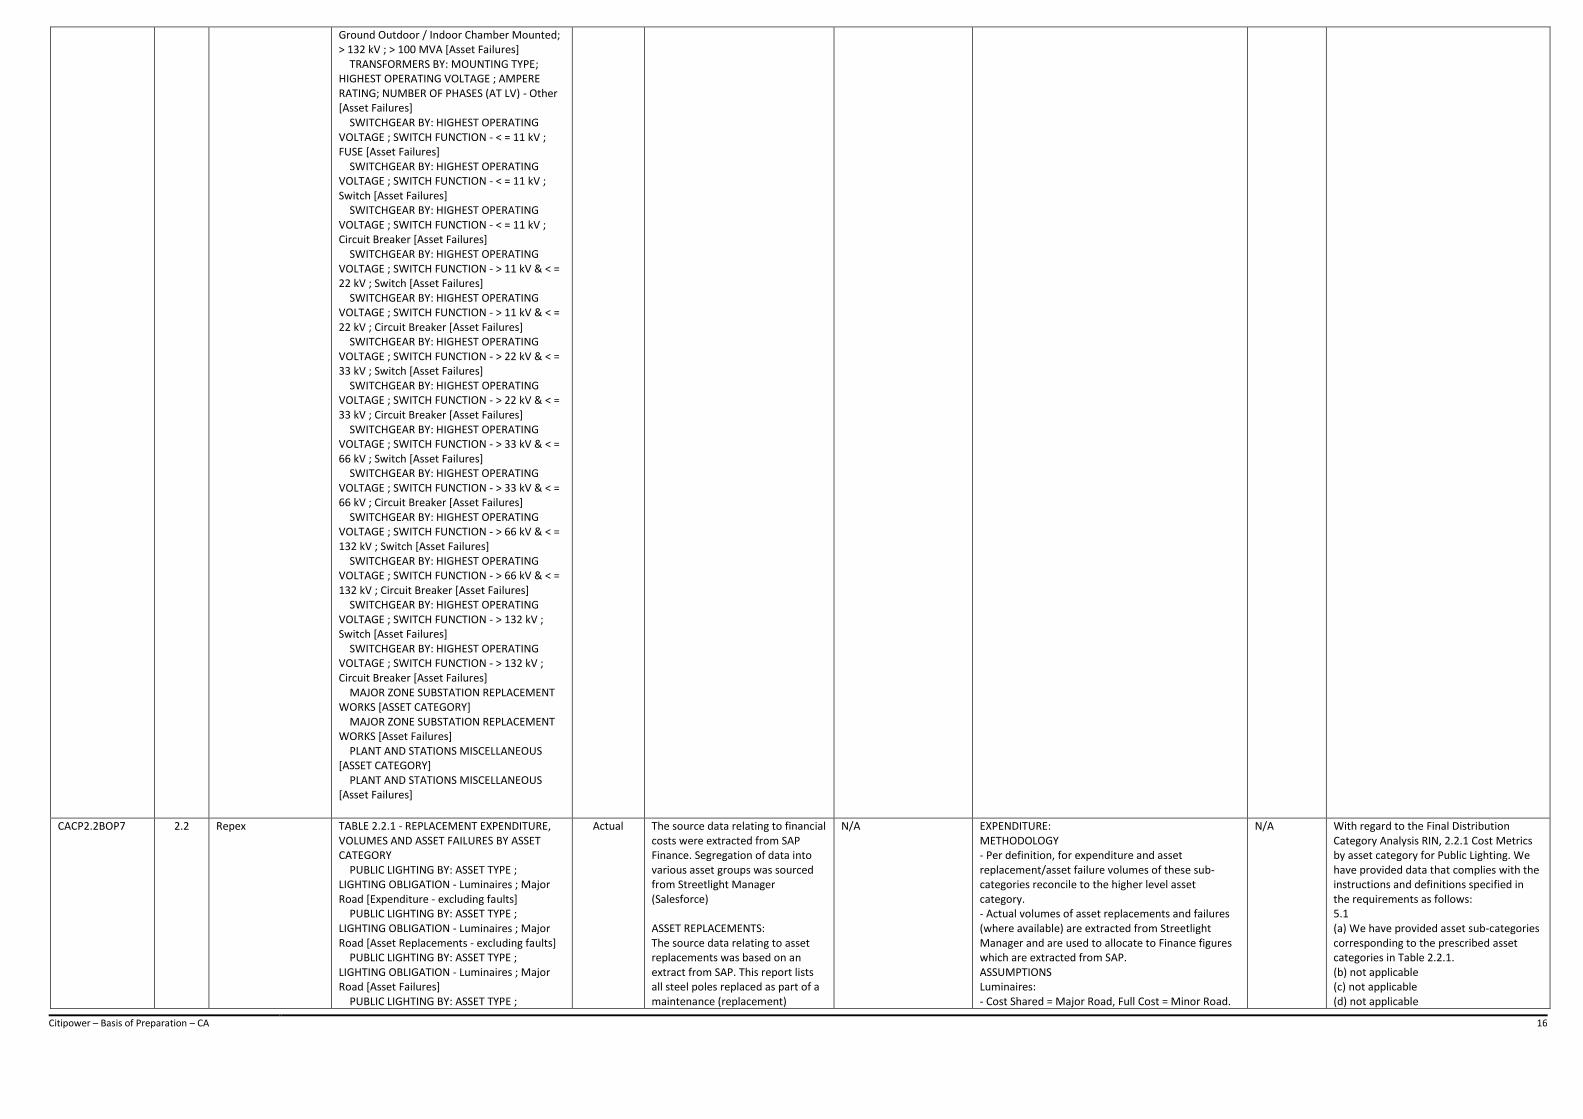
Ground Outdoor / Indoor Chamber Mounted; > 132 kV ; > 100 MVA [Asset Failures] TRANSFORMERS BY: MOUNTING TYPE; HIGHEST OPERATING VOLTAGE ; AMPERE RATING; NUMBER OF PHASES (AT LV) - Other [Asset Failures] SWITCHGEAR BY: HIGHEST OPERATING VOLTAGE ; SWITCH FUNCTION - < = 11 kV ; FUSE [Asset Failures] SWITCHGEAR BY: HIGHEST OPERATING VOLTAGE ; SWITCH FUNCTION - < = 11 kV ; Switch [Asset Failures] SWITCHGEAR BY: HIGHEST OPERATING VOLTAGE ; SWITCH FUNCTION - < = 11 kV ; Circuit Breaker [Asset Failures] SWITCHGEAR BY: HIGHEST OPERATING VOLTAGE ; SWITCH FUNCTION - > 11 kV & < = 22 kV ; Switch [Asset Failures] SWITCHGEAR BY: HIGHEST OPERATING VOLTAGE ; SWITCH FUNCTION - > 11 kV & < = 22 kV ; Circuit Breaker [Asset Failures] SWITCHGEAR BY: HIGHEST OPERATING VOLTAGE ; SWITCH FUNCTION - > 22 kV & < = 33 kV ; Switch [Asset Failures] SWITCHGEAR BY: HIGHEST OPERATING VOLTAGE ; SWITCH FUNCTION - > 22 kV & < = 33 kV ; Circuit Breaker [Asset Failures] SWITCHGEAR BY: HIGHEST OPERATING VOLTAGE ; SWITCH FUNCTION - > 33 kV & < = 66 kV ; Switch [Asset Failures] SWITCHGEAR BY: HIGHEST OPERATING VOLTAGE ; SWITCH FUNCTION - > 33 kV & < = 66 kV ; Circuit Breaker [Asset Failures] SWITCHGEAR BY: HIGHEST OPERATING VOLTAGE ; SWITCH FUNCTION - > 66 kV & < = 132 kV ; Switch [Asset Failures] SWITCHGEAR BY: HIGHEST OPERATING VOLTAGE ; SWITCH FUNCTION - > 66 kV & < = 132 kV ; Circuit Breaker [Asset Failures] SWITCHGEAR BY: HIGHEST OPERATING VOLTAGE ; SWITCH FUNCTION - > 132 kV ; Switch [Asset Failures] SWITCHGEAR BY: HIGHEST OPERATING VOLTAGE ; SWITCH FUNCTION - > 132 kV ; Circuit Breaker [Asset Failures] MAJOR ZONE SUBSTATION REPLACEMENT WORKS [ASSET CATEGORY] MAJOR ZONE SUBSTATION REPLACEMENT WORKS [Asset Failures] PLANT AND STATIONS MISCELLANEOUS [ASSET CATEGORY] PLANT AND STATIONS MISCELLANEOUS [Asset Failures]
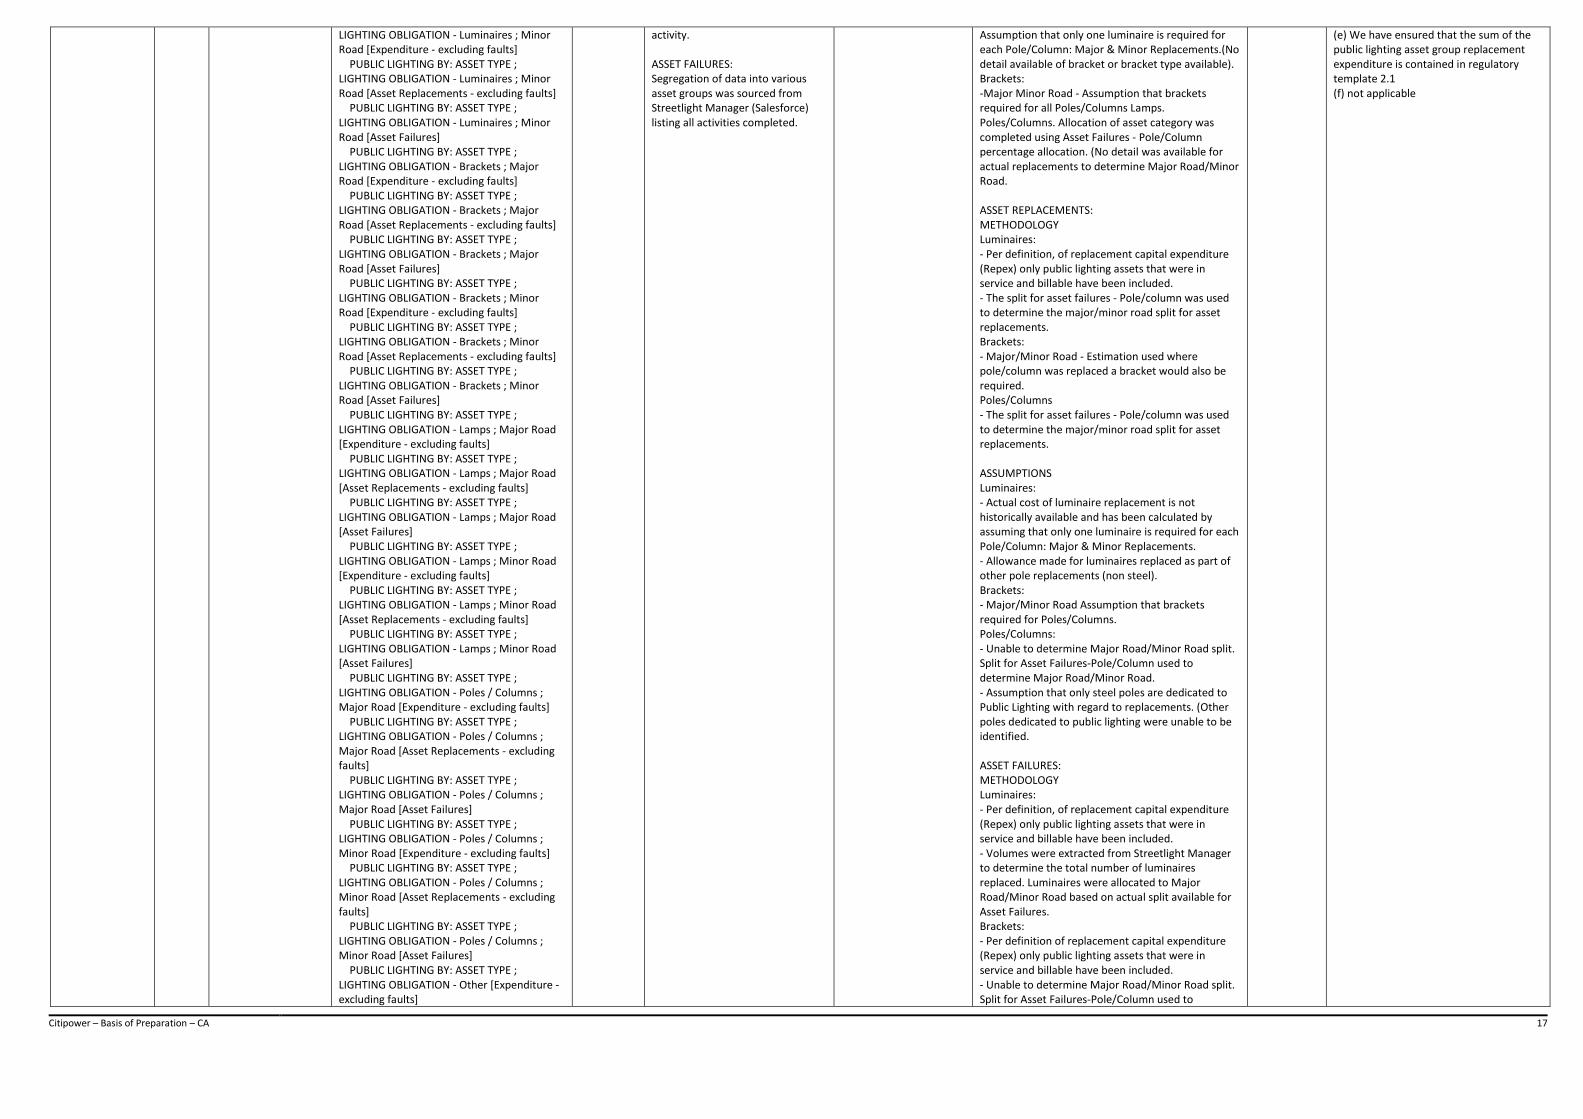
CACP2.2BOP7 2.2 Repex TABLE 2.2.1 - REPLACEMENT EXPENDITURE, VOLUMES AND ASSET FAILURES BY ASSET CATEGORY PUBLIC LIGHTING BY: ASSET TYPE ; LIGHTING OBLIGATION - Luminaires ; Major Road [Expenditure - excluding faults] PUBLIC LIGHTING BY: ASSET TYPE ; LIGHTING OBLIGATION - Luminaires ; Major Road [Asset Replacements - excluding faults] PUBLIC LIGHTING BY: ASSET TYPE ; LIGHTING OBLIGATION - Luminaires ; Major Road [Asset Failures] PUBLIC LIGHTING BY: ASSET TYPE ;
Actual The source data relating to financial costs were extracted from SAP Finance. Segregation of data into various asset groups was sourced from Streetlight Manager (Salesforce) ASSET REPLACEMENTS: The source data relating to asset replacements was based on an extract from SAP. This report lists all steel poles replaced as part of a maintenance (replacement)
N/A EXPENDITURE: METHODOLOGY - Per definition, for expenditure and asset replacement/asset failure volumes of these sub-categories reconcile to the higher level asset category. - Actual volumes of asset replacements and failures (where available) are extracted from Streetlight Manager and are used to allocate to Finance figures which are extracted from SAP. ASSUMPTIONS Luminaires: - Cost Shared = Major Road, Full Cost = Minor Road.
N/A With regard to the Final Distribution Category Analysis RIN, 2.2.1 Cost Metrics by asset category for Public Lighting. We have provided data that complies with the instructions and definitions specified in the requirements as follows: 5.1 (a) We have provided asset sub-categories corresponding to the prescribed asset categories in Table 2.2.1. (b) not applicable (c) not applicable (d) not applicable
Citipower – Basis of Preparation – CA 17
LIGHTING OBLIGATION - Luminaires ; Minor Road [Expenditure - excluding faults] PUBLIC LIGHTING BY: ASSET TYPE ; LIGHTING OBLIGATION - Luminaires ; Minor Road [Asset Replacements - excluding faults] PUBLIC LIGHTING BY: ASSET TYPE ; LIGHTING OBLIGATION - Luminaires ; Minor Road [Asset Failures] PUBLIC LIGHTING BY: ASSET TYPE ; LIGHTING OBLIGATION - Brackets ; Major Road [Expenditure - excluding faults] PUBLIC LIGHTING BY: ASSET TYPE ; LIGHTING OBLIGATION - Brackets ; Major Road [Asset Replacements - excluding faults] PUBLIC LIGHTING BY: ASSET TYPE ; LIGHTING OBLIGATION - Brackets ; Major Road [Asset Failures] PUBLIC LIGHTING BY: ASSET TYPE ; LIGHTING OBLIGATION - Brackets ; Minor Road [Expenditure - excluding faults] PUBLIC LIGHTING BY: ASSET TYPE ; LIGHTING OBLIGATION - Brackets ; Minor Road [Asset Replacements - excluding faults] PUBLIC LIGHTING BY: ASSET TYPE ; LIGHTING OBLIGATION - Brackets ; Minor Road [Asset Failures] PUBLIC LIGHTING BY: ASSET TYPE ; LIGHTING OBLIGATION - Lamps ; Major Road [Expenditure - excluding faults] PUBLIC LIGHTING BY: ASSET TYPE ; LIGHTING OBLIGATION - Lamps ; Major Road [Asset Replacements - excluding faults] PUBLIC LIGHTING BY: ASSET TYPE ; LIGHTING OBLIGATION - Lamps ; Major Road [Asset Failures] PUBLIC LIGHTING BY: ASSET TYPE ; LIGHTING OBLIGATION - Lamps ; Minor Road [Expenditure - excluding faults] PUBLIC LIGHTING BY: ASSET TYPE ; LIGHTING OBLIGATION - Lamps ; Minor Road [Asset Replacements - excluding faults] PUBLIC LIGHTING BY: ASSET TYPE ; LIGHTING OBLIGATION - Lamps ; Minor Road [Asset Failures] PUBLIC LIGHTING BY: ASSET TYPE ; LIGHTING OBLIGATION - Poles / Columns ; Major Road [Expenditure - excluding faults] PUBLIC LIGHTING BY: ASSET TYPE ; LIGHTING OBLIGATION - Poles / Columns ; Major Road [Asset Replacements - excluding faults] PUBLIC LIGHTING BY: ASSET TYPE ; LIGHTING OBLIGATION - Poles / Columns ; Major Road [Asset Failures] PUBLIC LIGHTING BY: ASSET TYPE ; LIGHTING OBLIGATION - Poles / Columns ; Minor Road [Expenditure - excluding faults] PUBLIC LIGHTING BY: ASSET TYPE ; LIGHTING OBLIGATION - Poles / Columns ; Minor Road [Asset Replacements - excluding faults] PUBLIC LIGHTING BY: ASSET TYPE ; LIGHTING OBLIGATION - Poles / Columns ; Minor Road [Asset Failures] PUBLIC LIGHTING BY: ASSET TYPE ; LIGHTING OBLIGATION - Other [Expenditure - excluding faults]
activity. ASSET FAILURES: Segregation of data into various asset groups was sourced from Streetlight Manager (Salesforce) listing all activities completed.
Assumption that only one luminaire is required for each Pole/Column: Major & Minor Replacements.(No detail available of bracket or bracket type available). Brackets: -Major Minor Road - Assumption that brackets required for all Poles/Columns Lamps. Poles/Columns. Allocation of asset category was completed using Asset Failures - Pole/Column percentage allocation. (No detail was available for actual replacements to determine Major Road/Minor Road. ASSET REPLACEMENTS: METHODOLOGY Luminaires: - Per definition, of replacement capital expenditure (Repex) only public lighting assets that were in service and billable have been included. - The split for asset failures - Pole/column was used to determine the major/minor road split for asset replacements. Brackets: - Major/Minor Road - Estimation used where pole/column was replaced a bracket would also be required. Poles/Columns - The split for asset failures - Pole/column was used to determine the major/minor road split for asset replacements. ASSUMPTIONS Luminaires: - Actual cost of luminaire replacement is not historically available and has been calculated by assuming that only one luminaire is required for each Pole/Column: Major & Minor Replacements. - Allowance made for luminaires replaced as part of other pole replacements (non steel). Brackets: - Major/Minor Road Assumption that brackets required for Poles/Columns. Poles/Columns: - Unable to determine Major Road/Minor Road split. Split for Asset Failures-Pole/Column used to determine Major Road/Minor Road. - Assumption that only steel poles are dedicated to Public Lighting with regard to replacements. (Other poles dedicated to public lighting were unable to be identified. ASSET FAILURES: METHODOLOGY Luminaires: - Per definition, of replacement capital expenditure (Repex) only public lighting assets that were in service and billable have been included. - Volumes were extracted from Streetlight Manager to determine the total number of luminaires replaced. Luminaires were allocated to Major Road/Minor Road based on actual split available for Asset Failures. Brackets: - Per definition of replacement capital expenditure (Repex) only public lighting assets that were in service and billable have been included. - Unable to determine Major Road/Minor Road split. Split for Asset Failures-Pole/Column used to
(e) We have ensured that the sum of the public lighting asset group replacement expenditure is contained in regulatory template 2.1 (f) not applicable
Citipower – Basis of Preparation – CA 18
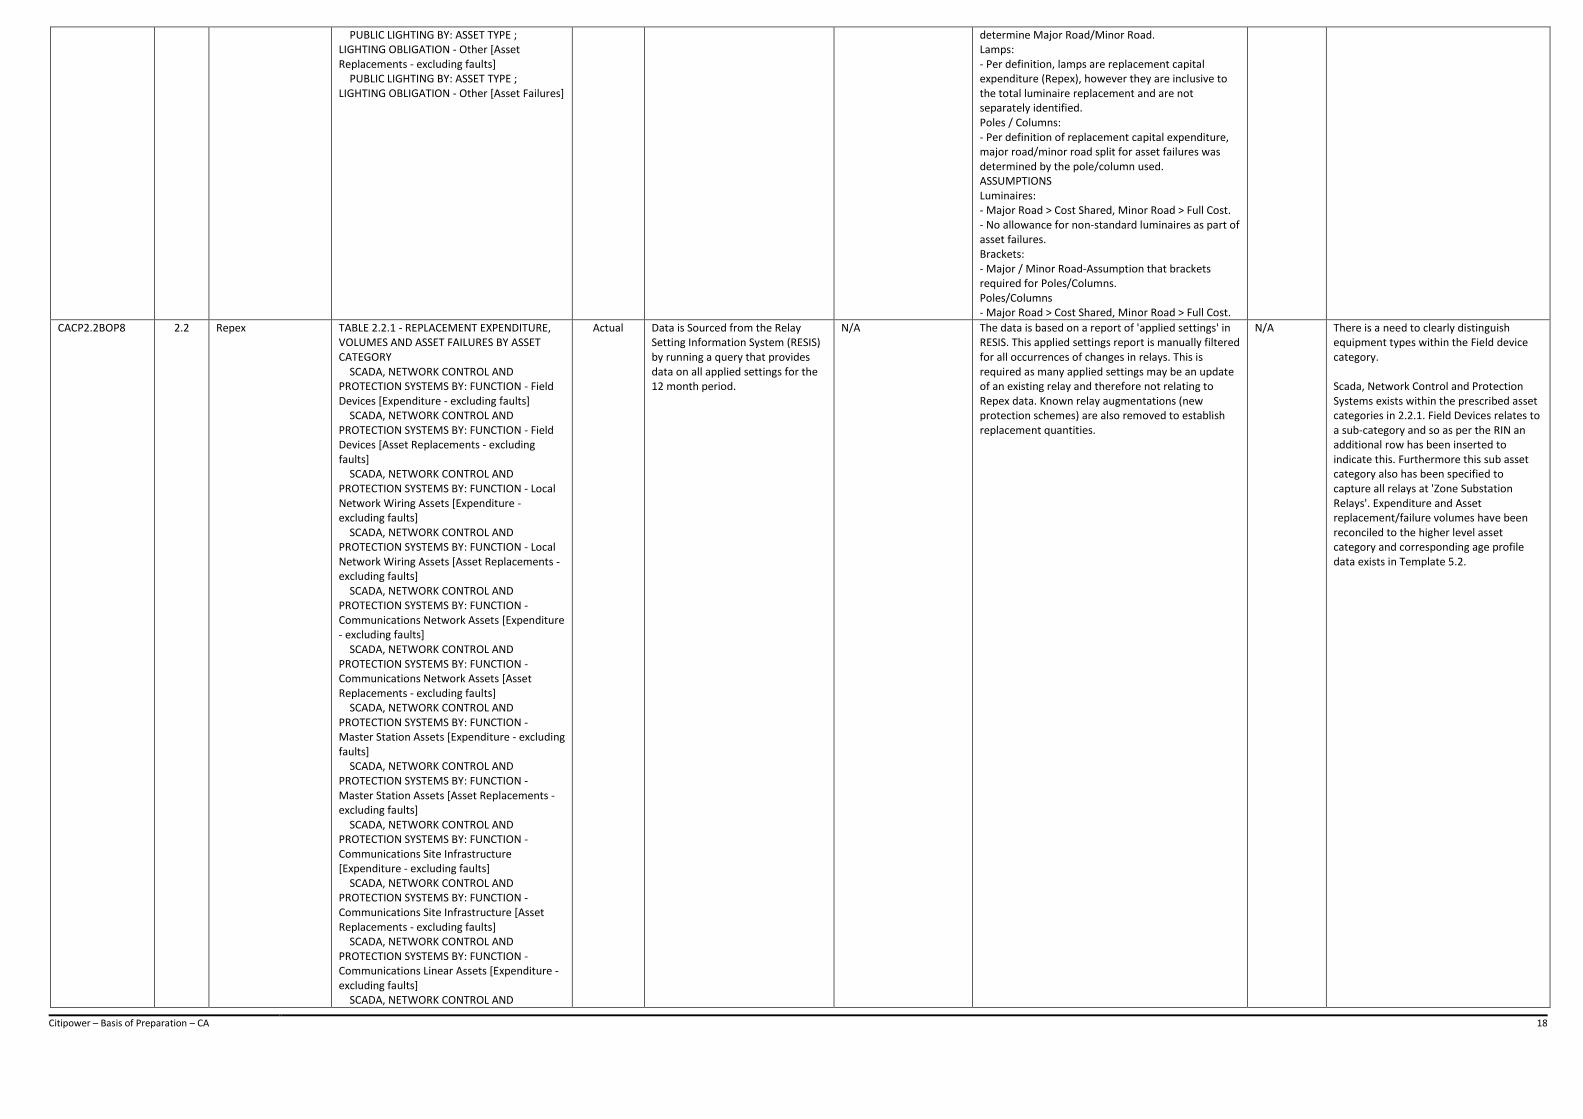
PUBLIC LIGHTING BY: ASSET TYPE ; LIGHTING OBLIGATION - Other [Asset Replacements - excluding faults] PUBLIC LIGHTING BY: ASSET TYPE ; LIGHTING OBLIGATION - Other [Asset Failures]
determine Major Road/Minor Road. Lamps: - Per definition, lamps are replacement capital expenditure (Repex), however they are inclusive to the total luminaire replacement and are not separately identified. Poles / Columns: - Per definition of replacement capital expenditure, major road/minor road split for asset failures was determined by the pole/column used. ASSUMPTIONS Luminaires: - Major Road > Cost Shared, Minor Road > Full Cost. - No allowance for non-standard luminaires as part of asset failures. Brackets: - Major / Minor Road-Assumption that brackets required for Poles/Columns. Poles/Columns - Major Road > Cost Shared, Minor Road > Full Cost.
CACP2.2BOP8 2.2 Repex TABLE 2.2.1 - REPLACEMENT EXPENDITURE, VOLUMES AND ASSET FAILURES BY ASSET CATEGORY SCADA, NETWORK CONTROL AND PROTECTION SYSTEMS BY: FUNCTION - Field Devices [Expenditure - excluding faults] SCADA, NETWORK CONTROL AND PROTECTION SYSTEMS BY: FUNCTION - Field Devices [Asset Replacements - excluding faults] SCADA, NETWORK CONTROL AND PROTECTION SYSTEMS BY: FUNCTION - Local Network Wiring Assets [Expenditure - excluding faults] SCADA, NETWORK CONTROL AND PROTECTION SYSTEMS BY: FUNCTION - Local Network Wiring Assets [Asset Replacements - excluding faults] SCADA, NETWORK CONTROL AND PROTECTION SYSTEMS BY: FUNCTION - Communications Network Assets [Expenditure - excluding faults] SCADA, NETWORK CONTROL AND PROTECTION SYSTEMS BY: FUNCTION - Communications Network Assets [Asset Replacements - excluding faults] SCADA, NETWORK CONTROL AND PROTECTION SYSTEMS BY: FUNCTION - Master Station Assets [Expenditure - excluding faults] SCADA, NETWORK CONTROL AND PROTECTION SYSTEMS BY: FUNCTION - Master Station Assets [Asset Replacements - excluding faults] SCADA, NETWORK CONTROL AND PROTECTION SYSTEMS BY: FUNCTION - Communications Site Infrastructure [Expenditure - excluding faults] SCADA, NETWORK CONTROL AND PROTECTION SYSTEMS BY: FUNCTION - Communications Site Infrastructure [Asset Replacements - excluding faults] SCADA, NETWORK CONTROL AND PROTECTION SYSTEMS BY: FUNCTION - Communications Linear Assets [Expenditure - excluding faults] SCADA, NETWORK CONTROL AND
Actual Data is Sourced from the Relay Setting Information System (RESIS) by running a query that provides data on all applied settings for the 12 month period.
N/A The data is based on a report of 'applied settings' in RESIS. This applied settings report is manually filtered for all occurrences of changes in relays. This is required as many applied settings may be an update of an existing relay and therefore not relating to Repex data. Known relay augmentations (new protection schemes) are also removed to establish replacement quantities.
N/A There is a need to clearly distinguish equipment types within the Field device category. Scada, Network Control and Protection Systems exists within the prescribed asset categories in 2.2.1. Field Devices relates to a sub-category and so as per the RIN an additional row has been inserted to indicate this. Furthermore this sub asset category also has been specified to capture all relays at 'Zone Substation Relays'. Expenditure and Asset replacement/failure volumes have been reconciled to the higher level asset category and corresponding age profile data exists in Template 5.2.
Citipower – Basis of Preparation – CA 19
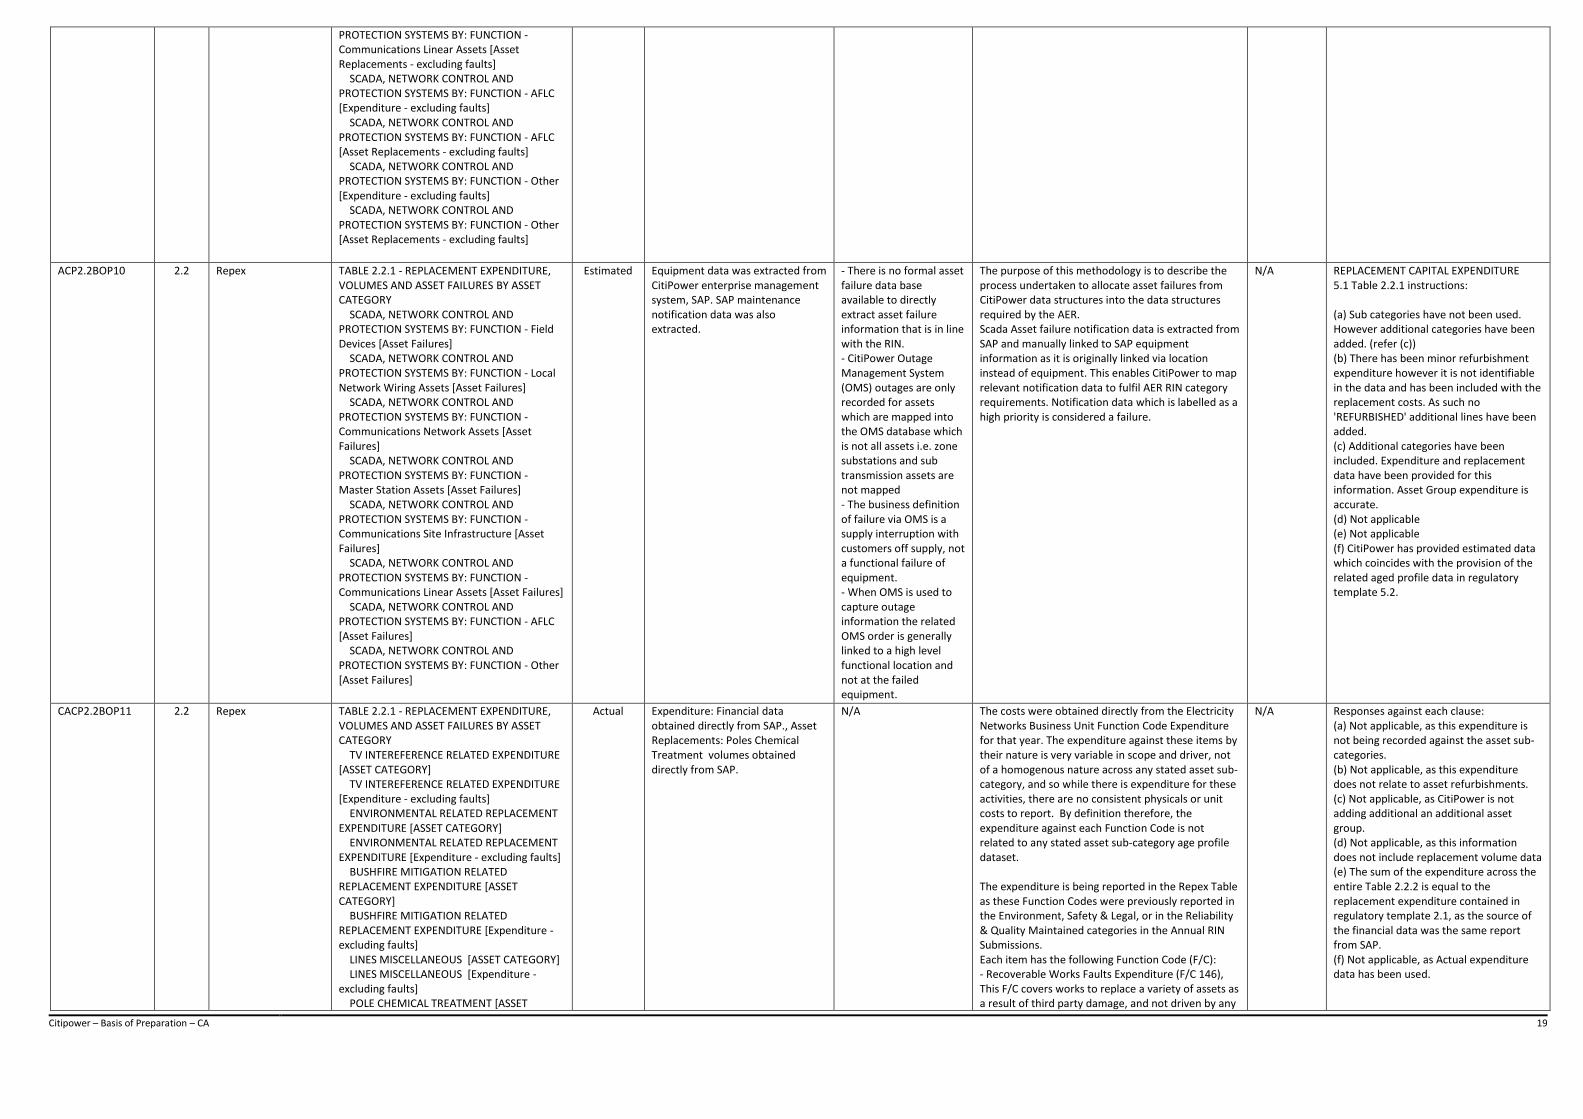
PROTECTION SYSTEMS BY: FUNCTION - Communications Linear Assets [Asset Replacements - excluding faults] SCADA, NETWORK CONTROL AND PROTECTION SYSTEMS BY: FUNCTION - AFLC [Expenditure - excluding faults] SCADA, NETWORK CONTROL AND PROTECTION SYSTEMS BY: FUNCTION - AFLC [Asset Replacements - excluding faults] SCADA, NETWORK CONTROL AND PROTECTION SYSTEMS BY: FUNCTION - Other [Expenditure - excluding faults] SCADA, NETWORK CONTROL AND PROTECTION SYSTEMS BY: FUNCTION - Other [Asset Replacements - excluding faults]
ACP2.2BOP10 2.2 Repex TABLE 2.2.1 - REPLACEMENT EXPENDITURE, VOLUMES AND ASSET FAILURES BY ASSET CATEGORY SCADA, NETWORK CONTROL AND PROTECTION SYSTEMS BY: FUNCTION - Field Devices [Asset Failures] SCADA, NETWORK CONTROL AND PROTECTION SYSTEMS BY: FUNCTION - Local Network Wiring Assets [Asset Failures] SCADA, NETWORK CONTROL AND PROTECTION SYSTEMS BY: FUNCTION - Communications Network Assets [Asset Failures] SCADA, NETWORK CONTROL AND PROTECTION SYSTEMS BY: FUNCTION - Master Station Assets [Asset Failures] SCADA, NETWORK CONTROL AND PROTECTION SYSTEMS BY: FUNCTION - Communications Site Infrastructure [Asset Failures] SCADA, NETWORK CONTROL AND PROTECTION SYSTEMS BY: FUNCTION - Communications Linear Assets [Asset Failures] SCADA, NETWORK CONTROL AND PROTECTION SYSTEMS BY: FUNCTION - AFLC [Asset Failures] SCADA, NETWORK CONTROL AND PROTECTION SYSTEMS BY: FUNCTION - Other [Asset Failures]
Estimated Equipment data was extracted from CitiPower enterprise management system, SAP. SAP maintenance notification data was also extracted.
- There is no formal asset failure data base available to directly extract asset failure information that is in line with the RIN. - CitiPower Outage Management System (OMS) outages are only recorded for assets which are mapped into the OMS database which is not all assets i.e. zone substations and sub transmission assets are not mapped - The business definition of failure via OMS is a supply interruption with customers off supply, not a functional failure of equipment. - When OMS is used to capture outage information the related OMS order is generally linked to a high level functional location and not at the failed equipment.
The purpose of this methodology is to describe the process undertaken to allocate asset failures from CitiPower data structures into the data structures required by the AER. Scada Asset failure notification data is extracted from SAP and manually linked to SAP equipment information as it is originally linked via location instead of equipment. This enables CitiPower to map relevant notification data to fulfil AER RIN category requirements. Notification data which is labelled as a high priority is considered a failure.
N/A REPLACEMENT CAPITAL EXPENDITURE 5.1 Table 2.2.1 instructions: (a) Sub categories have not been used. However additional categories have been added. (refer (c)) (b) There has been minor refurbishment expenditure however it is not identifiable in the data and has been included with the replacement costs. As such no 'REFURBISHED' additional lines have been added. (c) Additional categories have been included. Expenditure and replacement data have been provided for this information. Asset Group expenditure is accurate. (d) Not applicable (e) Not applicable (f) CitiPower has provided estimated data which coincides with the provision of the related aged profile data in regulatory template 5.2.
CACP2.2BOP11 2.2 Repex TABLE 2.2.1 - REPLACEMENT EXPENDITURE, VOLUMES AND ASSET FAILURES BY ASSET CATEGORY TV INTEREFERENCE RELATED EXPENDITURE [ASSET CATEGORY] TV INTEREFERENCE RELATED EXPENDITURE [Expenditure - excluding faults] ENVIRONMENTAL RELATED REPLACEMENT EXPENDITURE [ASSET CATEGORY] ENVIRONMENTAL RELATED REPLACEMENT EXPENDITURE [Expenditure - excluding faults] BUSHFIRE MITIGATION RELATED REPLACEMENT EXPENDITURE [ASSET CATEGORY] BUSHFIRE MITIGATION RELATED REPLACEMENT EXPENDITURE [Expenditure - excluding faults] LINES MISCELLANEOUS [ASSET CATEGORY] LINES MISCELLANEOUS [Expenditure - excluding faults] POLE CHEMICAL TREATMENT [ASSET
Actual Expenditure: Financial data obtained directly from SAP., Asset Replacements: Poles Chemical Treatment volumes obtained directly from SAP.
N/A The costs were obtained directly from the Electricity Networks Business Unit Function Code Expenditure for that year. The expenditure against these items by their nature is very variable in scope and driver, not of a homogenous nature across any stated asset sub-category, and so while there is expenditure for these activities, there are no consistent physicals or unit costs to report. By definition therefore, the expenditure against each Function Code is not related to any stated asset sub-category age profile dataset. The expenditure is being reported in the Repex Table as these Function Codes were previously reported in the Environment, Safety & Legal, or in the Reliability & Quality Maintained categories in the Annual RIN Submissions. Each item has the following Function Code (F/C): - Recoverable Works Faults Expenditure (F/C 146), This F/C covers works to replace a variety of assets as a result of third party damage, and not driven by any
N/A Responses against each clause: (a) Not applicable, as this expenditure is not being recorded against the asset sub-categories. (b) Not applicable, as this expenditure does not relate to asset refurbishments. (c) Not applicable, as CitiPower is not adding additional an additional asset group. (d) Not applicable, as this information does not include replacement volume data (e) The sum of the expenditure across the entire Table 2.2.2 is equal to the replacement expenditure contained in regulatory template 2.1, as the source of the financial data was the same report from SAP. (f) Not applicable, as Actual expenditure data has been used.
Citipower – Basis of Preparation – CA 20
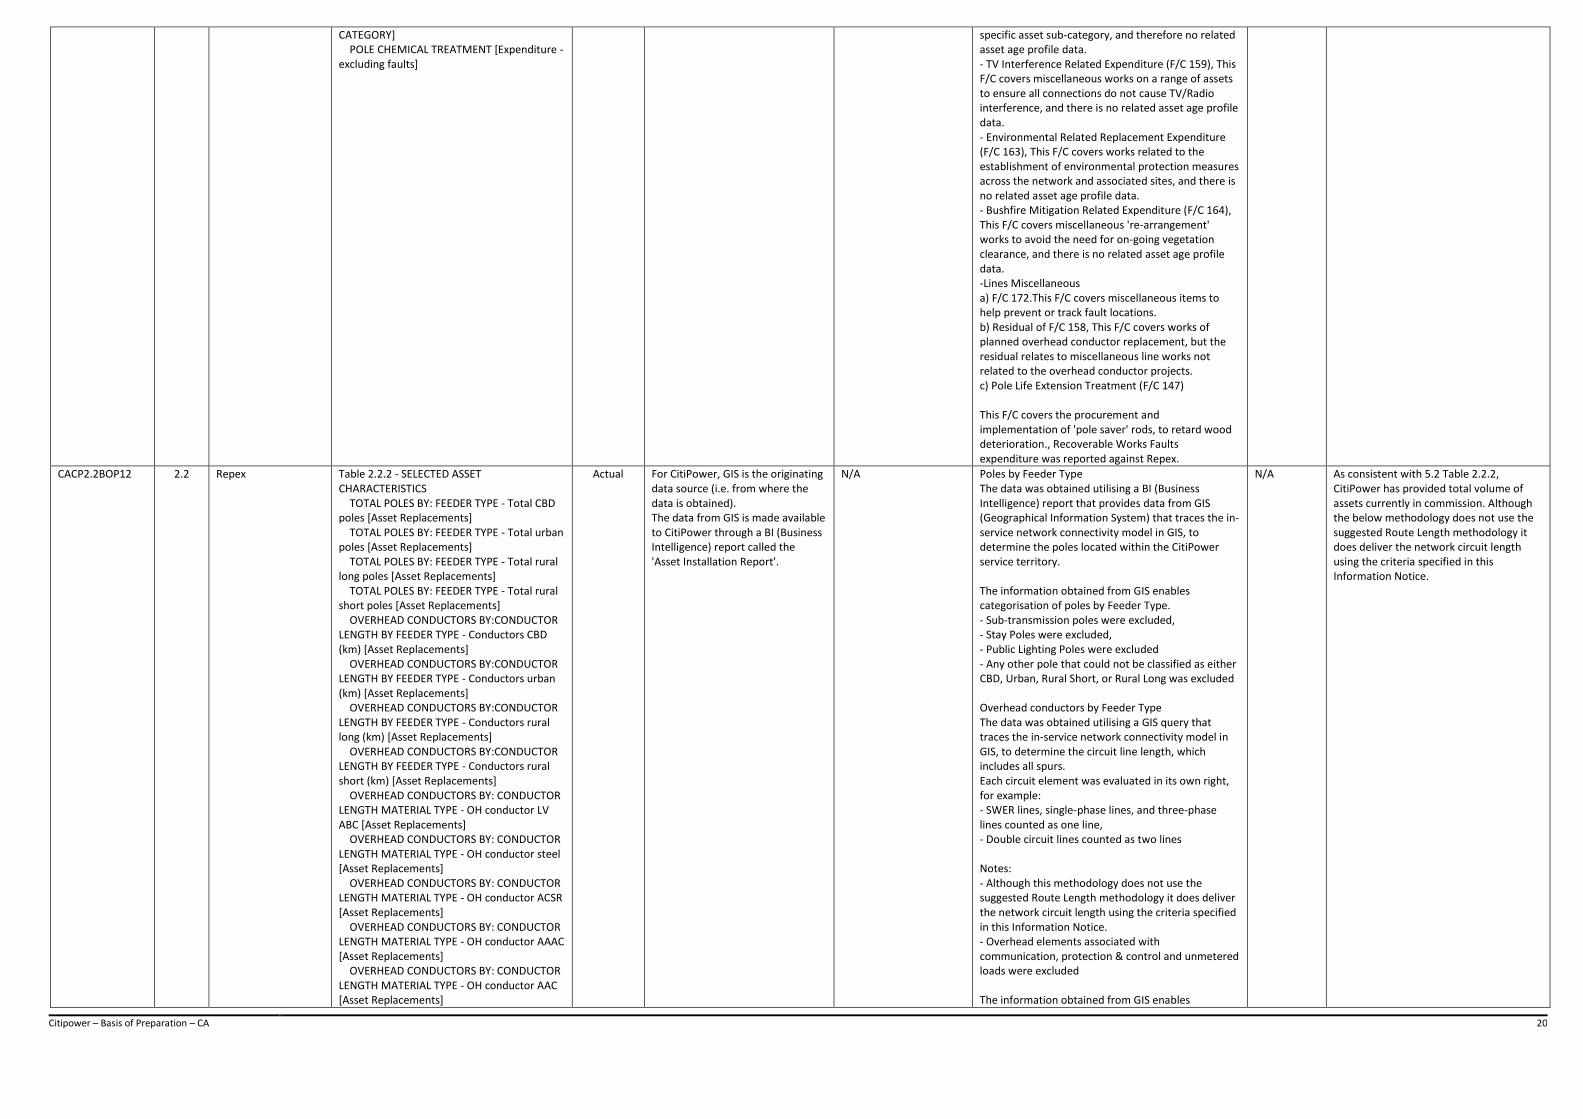
CATEGORY] POLE CHEMICAL TREATMENT [Expenditure - excluding faults]
specific asset sub-category, and therefore no related asset age profile data. - TV Interference Related Expenditure (F/C 159), This F/C covers miscellaneous works on a range of assets to ensure all connections do not cause TV/Radio interference, and there is no related asset age profile data. - Environmental Related Replacement Expenditure (F/C 163), This F/C covers works related to the establishment of environmental protection measures across the network and associated sites, and there is no related asset age profile data. - Bushfire Mitigation Related Expenditure (F/C 164), This F/C covers miscellaneous 're-arrangement' works to avoid the need for on-going vegetation clearance, and there is no related asset age profile data. -Lines Miscellaneous a) F/C 172.This F/C covers miscellaneous items to help prevent or track fault locations. b) Residual of F/C 158, This F/C covers works of planned overhead conductor replacement, but the residual relates to miscellaneous line works not related to the overhead conductor projects. c) Pole Life Extension Treatment (F/C 147) This F/C covers the procurement and implementation of 'pole saver' rods, to retard wood deterioration., Recoverable Works Faults expenditure was reported against Repex.
CACP2.2BOP12 2.2 Repex Table 2.2.2 - SELECTED ASSET CHARACTERISTICS TOTAL POLES BY: FEEDER TYPE - Total CBD poles [Asset Replacements] TOTAL POLES BY: FEEDER TYPE - Total urban poles [Asset Replacements] TOTAL POLES BY: FEEDER TYPE - Total rural long poles [Asset Replacements] TOTAL POLES BY: FEEDER TYPE - Total rural short poles [Asset Replacements] OVERHEAD CONDUCTORS BY:CONDUCTOR LENGTH BY FEEDER TYPE - Conductors CBD (km) [Asset Replacements] OVERHEAD CONDUCTORS BY:CONDUCTOR LENGTH BY FEEDER TYPE - Conductors urban (km) [Asset Replacements] OVERHEAD CONDUCTORS BY:CONDUCTOR LENGTH BY FEEDER TYPE - Conductors rural long (km) [Asset Replacements] OVERHEAD CONDUCTORS BY:CONDUCTOR LENGTH BY FEEDER TYPE - Conductors rural short (km) [Asset Replacements] OVERHEAD CONDUCTORS BY: CONDUCTOR LENGTH MATERIAL TYPE - OH conductor LV ABC [Asset Replacements] OVERHEAD CONDUCTORS BY: CONDUCTOR LENGTH MATERIAL TYPE - OH conductor steel [Asset Replacements] OVERHEAD CONDUCTORS BY: CONDUCTOR LENGTH MATERIAL TYPE - OH conductor ACSR [Asset Replacements] OVERHEAD CONDUCTORS BY: CONDUCTOR LENGTH MATERIAL TYPE - OH conductor AAAC [Asset Replacements] OVERHEAD CONDUCTORS BY: CONDUCTOR LENGTH MATERIAL TYPE - OH conductor AAC [Asset Replacements]
Actual For CitiPower, GIS is the originating data source (i.e. from where the data is obtained). The data from GIS is made available to CitiPower through a BI (Business Intelligence) report called the 'Asset Installation Report'.
N/A Poles by Feeder Type The data was obtained utilising a BI (Business Intelligence) report that provides data from GIS (Geographical Information System) that traces the in-service network connectivity model in GIS, to determine the poles located within the CitiPower service territory. The information obtained from GIS enables categorisation of poles by Feeder Type. - Sub-transmission poles were excluded, - Stay Poles were excluded, - Public Lighting Poles were excluded - Any other pole that could not be classified as either CBD, Urban, Rural Short, or Rural Long was excluded Overhead conductors by Feeder Type The data was obtained utilising a GIS query that traces the in-service network connectivity model in GIS, to determine the circuit line length, which includes all spurs. Each circuit element was evaluated in its own right, for example: - SWER lines, single-phase lines, and three-phase lines counted as one line, - Double circuit lines counted as two lines Notes: - Although this methodology does not use the suggested Route Length methodology it does deliver the network circuit length using the criteria specified in this Information Notice. - Overhead elements associated with communication, protection & control and unmetered loads were excluded The information obtained from GIS enables
N/A As consistent with 5.2 Table 2.2.2, CitiPower has provided total volume of assets currently in commission. Although the below methodology does not use the suggested Route Length methodology it does deliver the network circuit length using the criteria specified in this Information Notice.
Citipower – Basis of Preparation – CA 21
OVERHEAD CONDUCTORS BY: CONDUCTOR LENGTH MATERIAL TYPE - OH conductor HDBC [Asset Replacements] OVERHEAD CONDUCTORS BY: CONDUCTOR LENGTH MATERIAL TYPE - Other [Asset Replacements]
categorisation of overhead conductors by Feeder Type. - Sub-transmission conductors were excluded - LV Overhead Service conductors were excluded - Overhead Public Lighting conductors were excluded - Any other conductor that could not be classified as either CBD, Urban, Rural Short, or Rural Long was excluded, Overhead conductors by Material, the data was obtained utilising the same GIS query used for Overhead conductors by Feeder Type. The information obtained from GIS enables categorisation of overhead conductors by Material. - LV Overhead Service conductors of all materials/types were excluded
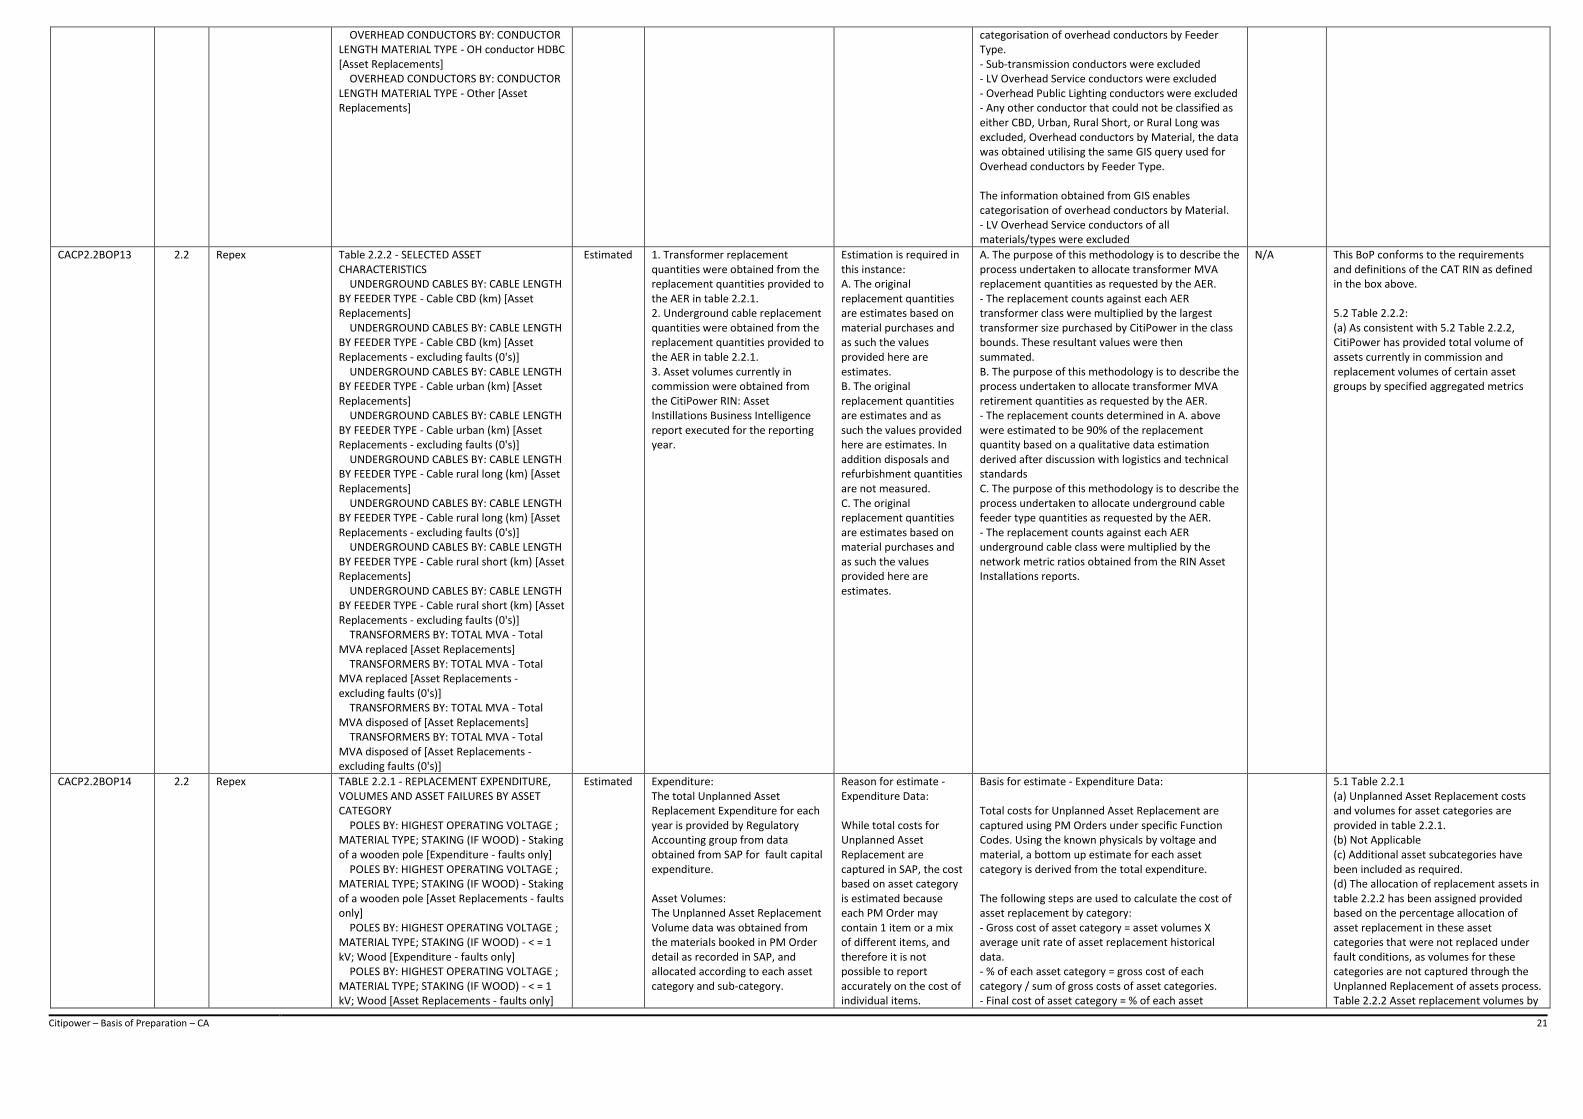
CACP2.2BOP13 2.2 Repex Table 2.2.2 - SELECTED ASSET CHARACTERISTICS UNDERGROUND CABLES BY: CABLE LENGTH BY FEEDER TYPE - Cable CBD (km) [Asset Replacements] UNDERGROUND CABLES BY: CABLE LENGTH BY FEEDER TYPE - Cable CBD (km) [Asset Replacements - excluding faults (0's)] UNDERGROUND CABLES BY: CABLE LENGTH BY FEEDER TYPE - Cable urban (km) [Asset Replacements] UNDERGROUND CABLES BY: CABLE LENGTH BY FEEDER TYPE - Cable urban (km) [Asset Replacements - excluding faults (0's)] UNDERGROUND CABLES BY: CABLE LENGTH BY FEEDER TYPE - Cable rural long (km) [Asset Replacements] UNDERGROUND CABLES BY: CABLE LENGTH BY FEEDER TYPE - Cable rural long (km) [Asset Replacements - excluding faults (0's)] UNDERGROUND CABLES BY: CABLE LENGTH BY FEEDER TYPE - Cable rural short (km) [Asset Replacements] UNDERGROUND CABLES BY: CABLE LENGTH BY FEEDER TYPE - Cable rural short (km) [Asset Replacements - excluding faults (0's)] TRANSFORMERS BY: TOTAL MVA - Total MVA replaced [Asset Replacements] TRANSFORMERS BY: TOTAL MVA - Total MVA replaced [Asset Replacements - excluding faults (0's)] TRANSFORMERS BY: TOTAL MVA - Total MVA disposed of [Asset Replacements] TRANSFORMERS BY: TOTAL MVA - Total MVA disposed of [Asset Replacements - excluding faults (0's)]
Estimated 1. Transformer replacement quantities were obtained from the replacement quantities provided to the AER in table 2.2.1. 2. Underground cable replacement quantities were obtained from the replacement quantities provided to the AER in table 2.2.1. 3. Asset volumes currently in commission were obtained from the CitiPower RIN: Asset Instillations Business Intelligence report executed for the reporting year.
Estimation is required in this instance: A. The original replacement quantities are estimates based on material purchases and as such the values provided here are estimates. B. The original replacement quantities are estimates and as such the values provided here are estimates. In addition disposals and refurbishment quantities are not measured. C. The original replacement quantities are estimates based on material purchases and as such the values provided here are estimates.
A. The purpose of this methodology is to describe the process undertaken to allocate transformer MVA replacement quantities as requested by the AER. - The replacement counts against each AER transformer class were multiplied by the largest transformer size purchased by CitiPower in the class bounds. These resultant values were then summated. B. The purpose of this methodology is to describe the process undertaken to allocate transformer MVA retirement quantities as requested by the AER. - The replacement counts determined in A. above were estimated to be 90% of the replacement quantity based on a qualitative data estimation derived after discussion with logistics and technical standards C. The purpose of this methodology is to describe the process undertaken to allocate underground cable feeder type quantities as requested by the AER. - The replacement counts against each AER underground cable class were multiplied by the network metric ratios obtained from the RIN Asset Installations reports.
N/A This BoP conforms to the requirements and definitions of the CAT RIN as defined in the box above. 5.2 Table 2.2.2: (a) As consistent with 5.2 Table 2.2.2, CitiPower has provided total volume of assets currently in commission and replacement volumes of certain asset groups by specified aggregated metrics
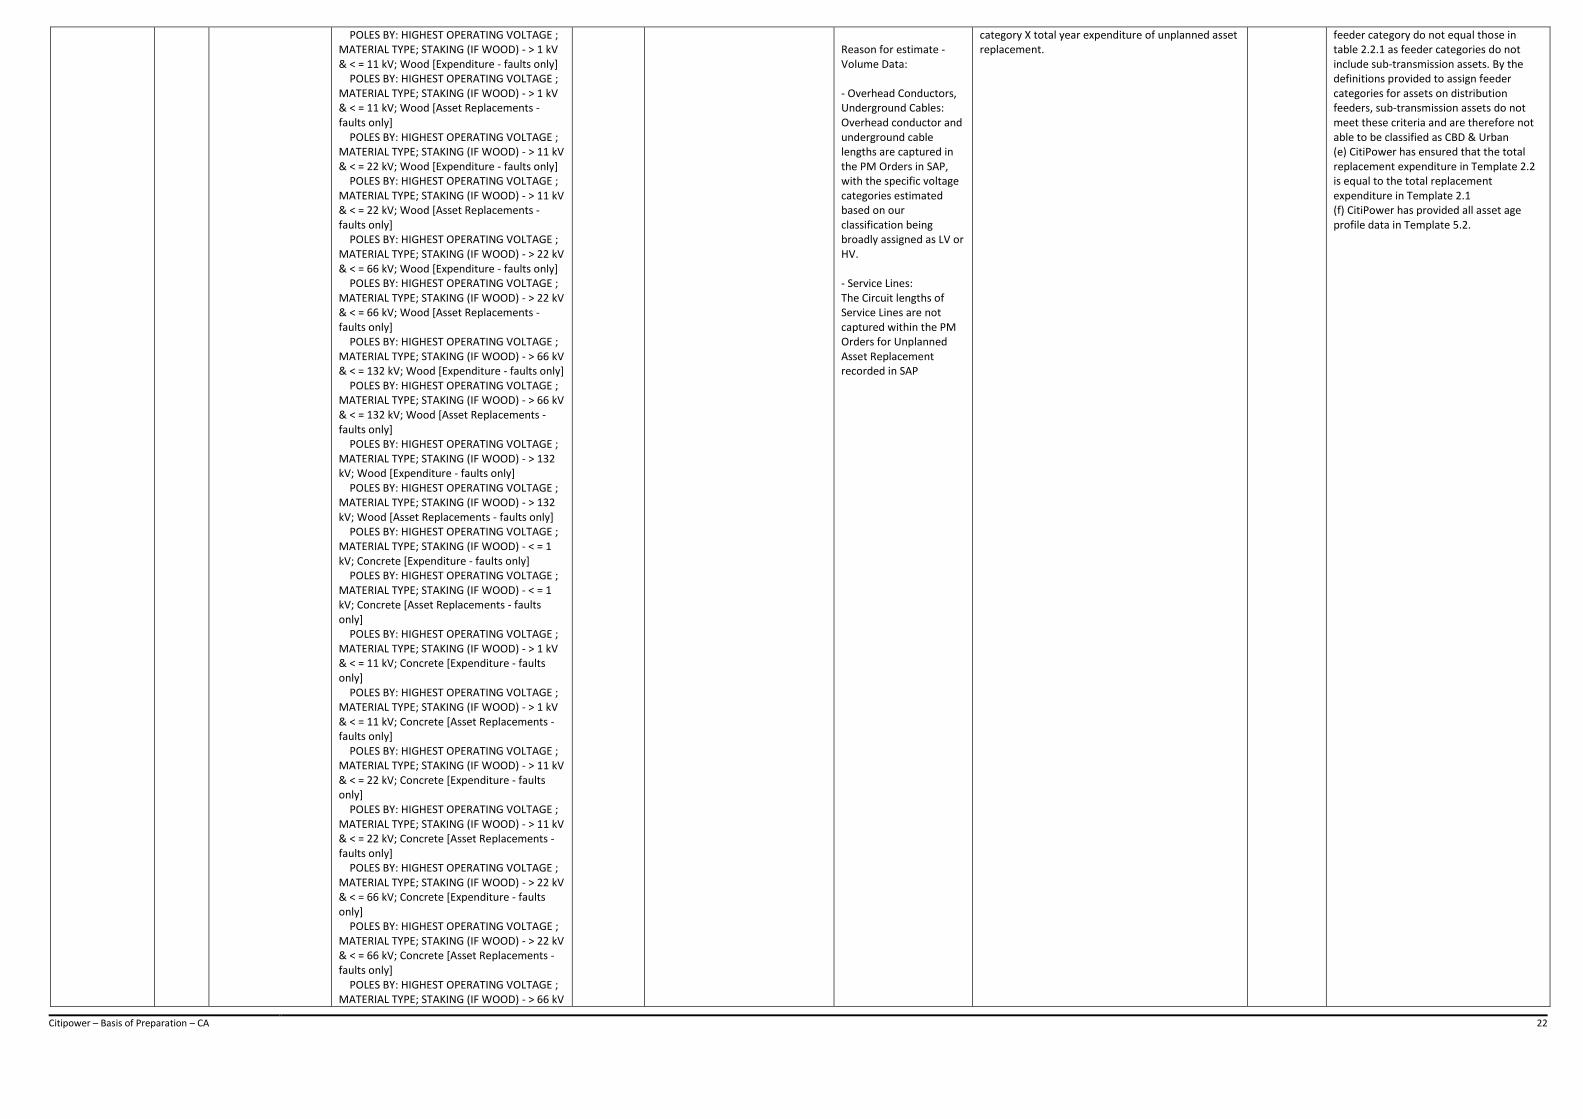
CACP2.2BOP14 2.2 Repex TABLE 2.2.1 - REPLACEMENT EXPENDITURE, VOLUMES AND ASSET FAILURES BY ASSET CATEGORY POLES BY: HIGHEST OPERATING VOLTAGE ; MATERIAL TYPE; STAKING (IF WOOD) - Staking of a wooden pole [Expenditure - faults only] POLES BY: HIGHEST OPERATING VOLTAGE ; MATERIAL TYPE; STAKING (IF WOOD) - Staking of a wooden pole [Asset Replacements - faults only] POLES BY: HIGHEST OPERATING VOLTAGE ; MATERIAL TYPE; STAKING (IF WOOD) - < = 1 kV; Wood [Expenditure - faults only] POLES BY: HIGHEST OPERATING VOLTAGE ; MATERIAL TYPE; STAKING (IF WOOD) - < = 1 kV; Wood [Asset Replacements - faults only]
Estimated Expenditure: The total Unplanned Asset Replacement Expenditure for each year is provided by Regulatory Accounting group from data obtained from SAP for fault capital expenditure. Asset Volumes: The Unplanned Asset Replacement Volume data was obtained from the materials booked in PM Order detail as recorded in SAP, and allocated according to each asset category and sub-category.
Reason for estimate - Expenditure Data: While total costs for Unplanned Asset Replacement are captured in SAP, the cost based on asset category is estimated because each PM Order may contain 1 item or a mix of different items, and therefore it is not possible to report accurately on the cost of individual items.
Basis for estimate - Expenditure Data: Total costs for Unplanned Asset Replacement are captured using PM Orders under specific Function Codes. Using the known physicals by voltage and material, a bottom up estimate for each asset category is derived from the total expenditure. The following steps are used to calculate the cost of asset replacement by category: - Gross cost of asset category = asset volumes X average unit rate of asset replacement historical data. - % of each asset category = gross cost of each category / sum of gross costs of asset categories. - Final cost of asset category = % of each asset
5.1 Table 2.2.1 (a) Unplanned Asset Replacement costs and volumes for asset categories are provided in table 2.2.1. (b) Not Applicable (c) Additional asset subcategories have been included as required. (d) The allocation of replacement assets in table 2.2.2 has been assigned provided based on the percentage allocation of asset replacement in these asset categories that were not replaced under fault conditions, as volumes for these categories are not captured through the Unplanned Replacement of assets process. Table 2.2.2 Asset replacement volumes by
Citipower – Basis of Preparation – CA 22
POLES BY: HIGHEST OPERATING VOLTAGE ; MATERIAL TYPE; STAKING (IF WOOD) - > 1 kV & < = 11 kV; Wood [Expenditure - faults only] POLES BY: HIGHEST OPERATING VOLTAGE ; MATERIAL TYPE; STAKING (IF WOOD) - > 1 kV & < = 11 kV; Wood [Asset Replacements - faults only] POLES BY: HIGHEST OPERATING VOLTAGE ; MATERIAL TYPE; STAKING (IF WOOD) - > 11 kV & < = 22 kV; Wood [Expenditure - faults only] POLES BY: HIGHEST OPERATING VOLTAGE ; MATERIAL TYPE; STAKING (IF WOOD) - > 11 kV & < = 22 kV; Wood [Asset Replacements - faults only] POLES BY: HIGHEST OPERATING VOLTAGE ; MATERIAL TYPE; STAKING (IF WOOD) - > 22 kV & < = 66 kV; Wood [Expenditure - faults only] POLES BY: HIGHEST OPERATING VOLTAGE ; MATERIAL TYPE; STAKING (IF WOOD) - > 22 kV & < = 66 kV; Wood [Asset Replacements - faults only] POLES BY: HIGHEST OPERATING VOLTAGE ; MATERIAL TYPE; STAKING (IF WOOD) - > 66 kV & < = 132 kV; Wood [Expenditure - faults only] POLES BY: HIGHEST OPERATING VOLTAGE ; MATERIAL TYPE; STAKING (IF WOOD) - > 66 kV & < = 132 kV; Wood [Asset Replacements - faults only] POLES BY: HIGHEST OPERATING VOLTAGE ; MATERIAL TYPE; STAKING (IF WOOD) - > 132 kV; Wood [Expenditure - faults only] POLES BY: HIGHEST OPERATING VOLTAGE ; MATERIAL TYPE; STAKING (IF WOOD) - > 132 kV; Wood [Asset Replacements - faults only] POLES BY: HIGHEST OPERATING VOLTAGE ; MATERIAL TYPE; STAKING (IF WOOD) - < = 1 kV; Concrete [Expenditure - faults only] POLES BY: HIGHEST OPERATING VOLTAGE ; MATERIAL TYPE; STAKING (IF WOOD) - < = 1 kV; Concrete [Asset Replacements - faults only] POLES BY: HIGHEST OPERATING VOLTAGE ; MATERIAL TYPE; STAKING (IF WOOD) - > 1 kV & < = 11 kV; Concrete [Expenditure - faults only] POLES BY: HIGHEST OPERATING VOLTAGE ; MATERIAL TYPE; STAKING (IF WOOD) - > 1 kV & < = 11 kV; Concrete [Asset Replacements - faults only] POLES BY: HIGHEST OPERATING VOLTAGE ; MATERIAL TYPE; STAKING (IF WOOD) - > 11 kV & < = 22 kV; Concrete [Expenditure - faults only] POLES BY: HIGHEST OPERATING VOLTAGE ; MATERIAL TYPE; STAKING (IF WOOD) - > 11 kV & < = 22 kV; Concrete [Asset Replacements - faults only] POLES BY: HIGHEST OPERATING VOLTAGE ; MATERIAL TYPE; STAKING (IF WOOD) - > 22 kV & < = 66 kV; Concrete [Expenditure - faults only] POLES BY: HIGHEST OPERATING VOLTAGE ; MATERIAL TYPE; STAKING (IF WOOD) - > 22 kV & < = 66 kV; Concrete [Asset Replacements - faults only] POLES BY: HIGHEST OPERATING VOLTAGE ; MATERIAL TYPE; STAKING (IF WOOD) - > 66 kV
Reason for estimate - Volume Data: - Overhead Conductors, Underground Cables: Overhead conductor and underground cable lengths are captured in the PM Orders in SAP, with the specific voltage categories estimated based on our classification being broadly assigned as LV or HV. - Service Lines: The Circuit lengths of Service Lines are not captured within the PM Orders for Unplanned Asset Replacement recorded in SAP
category X total year expenditure of unplanned asset replacement.
feeder category do not equal those in table 2.2.1 as feeder categories do not include sub-transmission assets. By the definitions provided to assign feeder categories for assets on distribution feeders, sub-transmission assets do not meet these criteria and are therefore not able to be classified as CBD & Urban (e) CitiPower has ensured that the total replacement expenditure in Template 2.2 is equal to the total replacement expenditure in Template 2.1 (f) CitiPower has provided all asset age profile data in Template 5.2.
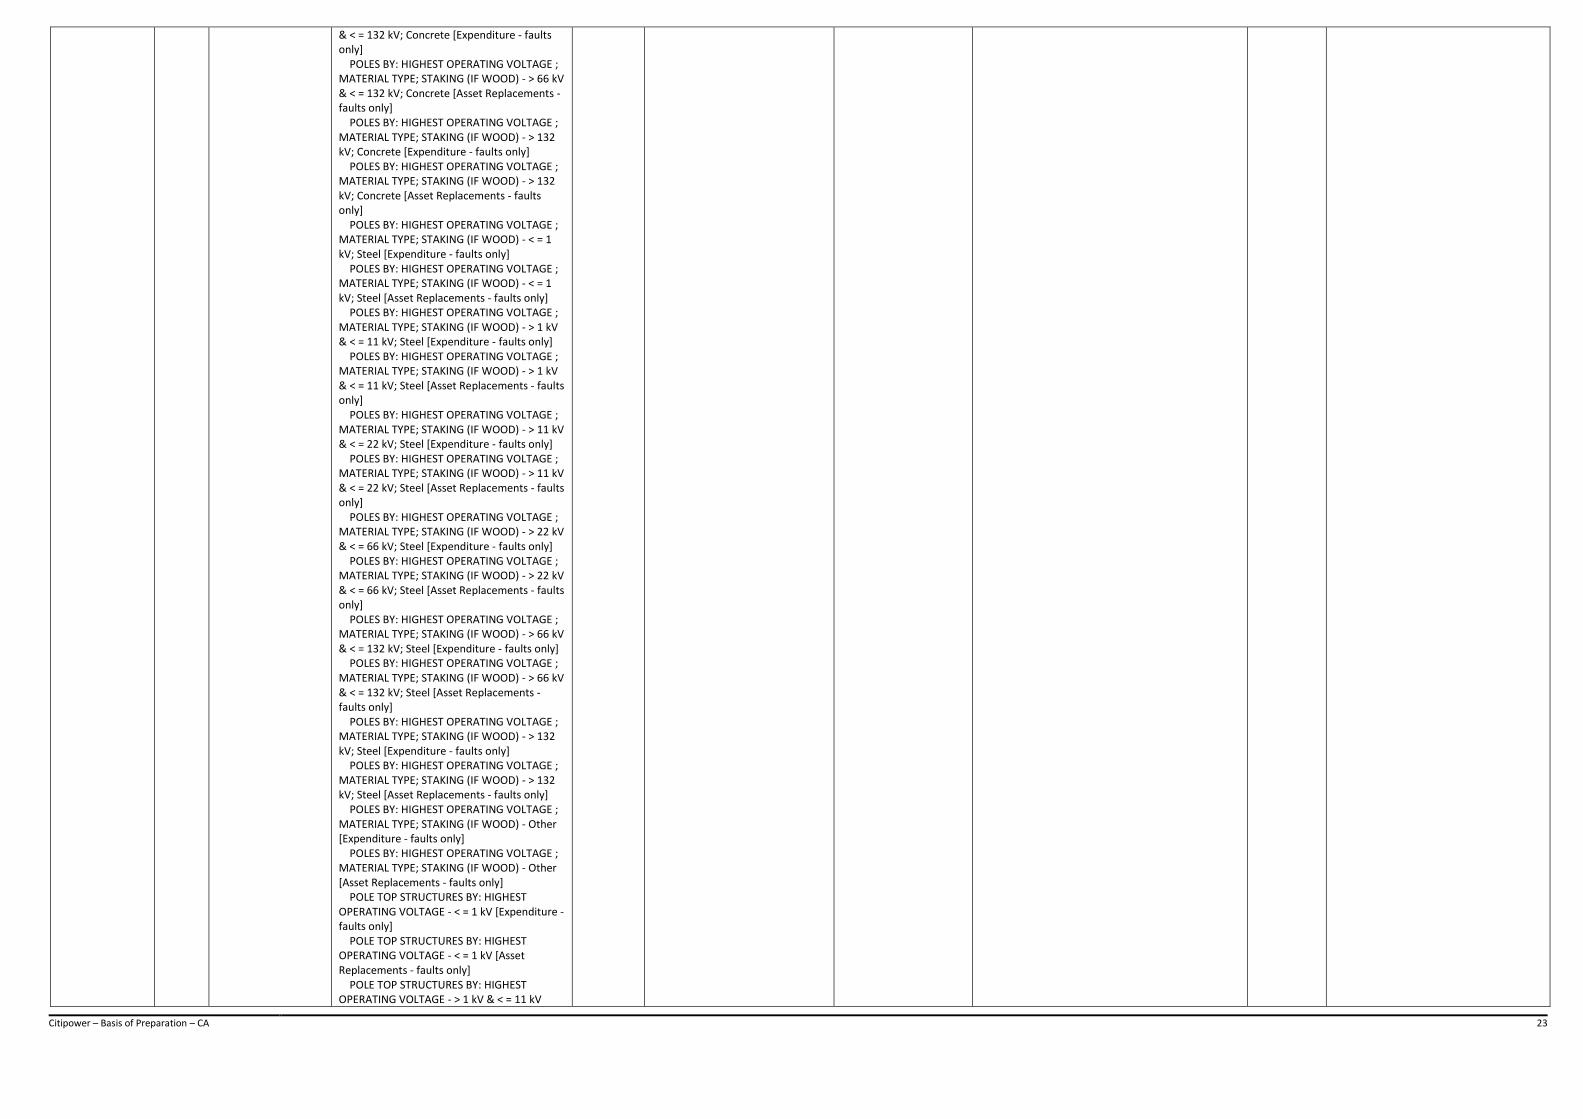
Citipower – Basis of Preparation – CA 23
& < = 132 kV; Concrete [Expenditure - faults only] POLES BY: HIGHEST OPERATING VOLTAGE ; MATERIAL TYPE; STAKING (IF WOOD) - > 66 kV & < = 132 kV; Concrete [Asset Replacements - faults only] POLES BY: HIGHEST OPERATING VOLTAGE ; MATERIAL TYPE; STAKING (IF WOOD) - > 132 kV; Concrete [Expenditure - faults only] POLES BY: HIGHEST OPERATING VOLTAGE ; MATERIAL TYPE; STAKING (IF WOOD) - > 132 kV; Concrete [Asset Replacements - faults only] POLES BY: HIGHEST OPERATING VOLTAGE ; MATERIAL TYPE; STAKING (IF WOOD) - < = 1 kV; Steel [Expenditure - faults only] POLES BY: HIGHEST OPERATING VOLTAGE ; MATERIAL TYPE; STAKING (IF WOOD) - < = 1 kV; Steel [Asset Replacements - faults only] POLES BY: HIGHEST OPERATING VOLTAGE ; MATERIAL TYPE; STAKING (IF WOOD) - > 1 kV & < = 11 kV; Steel [Expenditure - faults only] POLES BY: HIGHEST OPERATING VOLTAGE ; MATERIAL TYPE; STAKING (IF WOOD) - > 1 kV & < = 11 kV; Steel [Asset Replacements - faults only] POLES BY: HIGHEST OPERATING VOLTAGE ; MATERIAL TYPE; STAKING (IF WOOD) - > 11 kV & < = 22 kV; Steel [Expenditure - faults only] POLES BY: HIGHEST OPERATING VOLTAGE ; MATERIAL TYPE; STAKING (IF WOOD) - > 11 kV & < = 22 kV; Steel [Asset Replacements - faults only] POLES BY: HIGHEST OPERATING VOLTAGE ; MATERIAL TYPE; STAKING (IF WOOD) - > 22 kV & < = 66 kV; Steel [Expenditure - faults only] POLES BY: HIGHEST OPERATING VOLTAGE ; MATERIAL TYPE; STAKING (IF WOOD) - > 22 kV & < = 66 kV; Steel [Asset Replacements - faults only] POLES BY: HIGHEST OPERATING VOLTAGE ; MATERIAL TYPE; STAKING (IF WOOD) - > 66 kV & < = 132 kV; Steel [Expenditure - faults only] POLES BY: HIGHEST OPERATING VOLTAGE ; MATERIAL TYPE; STAKING (IF WOOD) - > 66 kV & < = 132 kV; Steel [Asset Replacements - faults only] POLES BY: HIGHEST OPERATING VOLTAGE ; MATERIAL TYPE; STAKING (IF WOOD) - > 132 kV; Steel [Expenditure - faults only] POLES BY: HIGHEST OPERATING VOLTAGE ; MATERIAL TYPE; STAKING (IF WOOD) - > 132 kV; Steel [Asset Replacements - faults only] POLES BY: HIGHEST OPERATING VOLTAGE ; MATERIAL TYPE; STAKING (IF WOOD) - Other [Expenditure - faults only] POLES BY: HIGHEST OPERATING VOLTAGE ; MATERIAL TYPE; STAKING (IF WOOD) - Other [Asset Replacements - faults only] POLE TOP STRUCTURES BY: HIGHEST OPERATING VOLTAGE - < = 1 kV [Expenditure - faults only] POLE TOP STRUCTURES BY: HIGHEST OPERATING VOLTAGE - < = 1 kV [Asset Replacements - faults only] POLE TOP STRUCTURES BY: HIGHEST OPERATING VOLTAGE - > 1 kV & < = 11 kV

Citipower – Basis of Preparation – CA 24
[Expenditure - faults only] POLE TOP STRUCTURES BY: HIGHEST OPERATING VOLTAGE - > 1 kV & < = 11 kV [Asset Replacements - faults only] POLE TOP STRUCTURES BY: HIGHEST OPERATING VOLTAGE - > 11 kV & < = 22 kV [Expenditure - faults only] POLE TOP STRUCTURES BY: HIGHEST OPERATING VOLTAGE - > 11 kV & < = 22 kV [Asset Replacements - faults only] POLE TOP STRUCTURES BY: HIGHEST OPERATING VOLTAGE - > 22 kV & < = 66 kV [Expenditure - faults only] POLE TOP STRUCTURES BY: HIGHEST OPERATING VOLTAGE - > 22 kV & < = 66 kV [Asset Replacements - faults only] POLE TOP STRUCTURES BY: HIGHEST OPERATING VOLTAGE - > 66 kV & < = 132 kV [Expenditure - faults only] POLE TOP STRUCTURES BY: HIGHEST OPERATING VOLTAGE - > 66 kV & < = 132 kV [Asset Replacements - faults only] POLE TOP STRUCTURES BY: HIGHEST OPERATING VOLTAGE - > 132 kV [Expenditure - faults only] POLE TOP STRUCTURES BY: HIGHEST OPERATING VOLTAGE - > 132 kV [Asset Replacements - faults only] POLE TOP STRUCTURES BY: HIGHEST OPERATING VOLTAGE - Other [Expenditure - faults only] POLE TOP STRUCTURES BY: HIGHEST OPERATING VOLTAGE - Other [Asset Replacements - faults only] OVERHEAD CONDUCTORS BY: HIGHEST OPERATING VOLTAGE; NUMBER OF PHASES (AT HV) - < = 1 kV [Expenditure - faults only] OVERHEAD CONDUCTORS BY: HIGHEST OPERATING VOLTAGE; NUMBER OF PHASES (AT HV) - < = 1 kV [Asset Replacements - faults only] OVERHEAD CONDUCTORS BY: HIGHEST OPERATING VOLTAGE; NUMBER OF PHASES (AT HV) - > 1 kV & < = 11 kV [Expenditure - faults only] OVERHEAD CONDUCTORS BY: HIGHEST OPERATING VOLTAGE; NUMBER OF PHASES (AT HV) - > 1 kV & < = 11 kV [Asset Replacements - faults only] OVERHEAD CONDUCTORS BY: HIGHEST OPERATING VOLTAGE; NUMBER OF PHASES (AT HV) - > 11 kV & < = 22 kV ; SWER [Expenditure - faults only] OVERHEAD CONDUCTORS BY: HIGHEST OPERATING VOLTAGE; NUMBER OF PHASES (AT HV) - > 11 kV & < = 22 kV ; SWER [Asset Replacements - faults only] OVERHEAD CONDUCTORS BY: HIGHEST OPERATING VOLTAGE; NUMBER OF PHASES (AT HV) - > 11 kV & < = 22 kV ; Single-Phase [Expenditure - faults only] OVERHEAD CONDUCTORS BY: HIGHEST OPERATING VOLTAGE; NUMBER OF PHASES (AT HV) - > 11 kV & < = 22 kV ; Single-Phase [Asset Replacements - faults only] OVERHEAD CONDUCTORS BY: HIGHEST OPERATING VOLTAGE; NUMBER OF PHASES
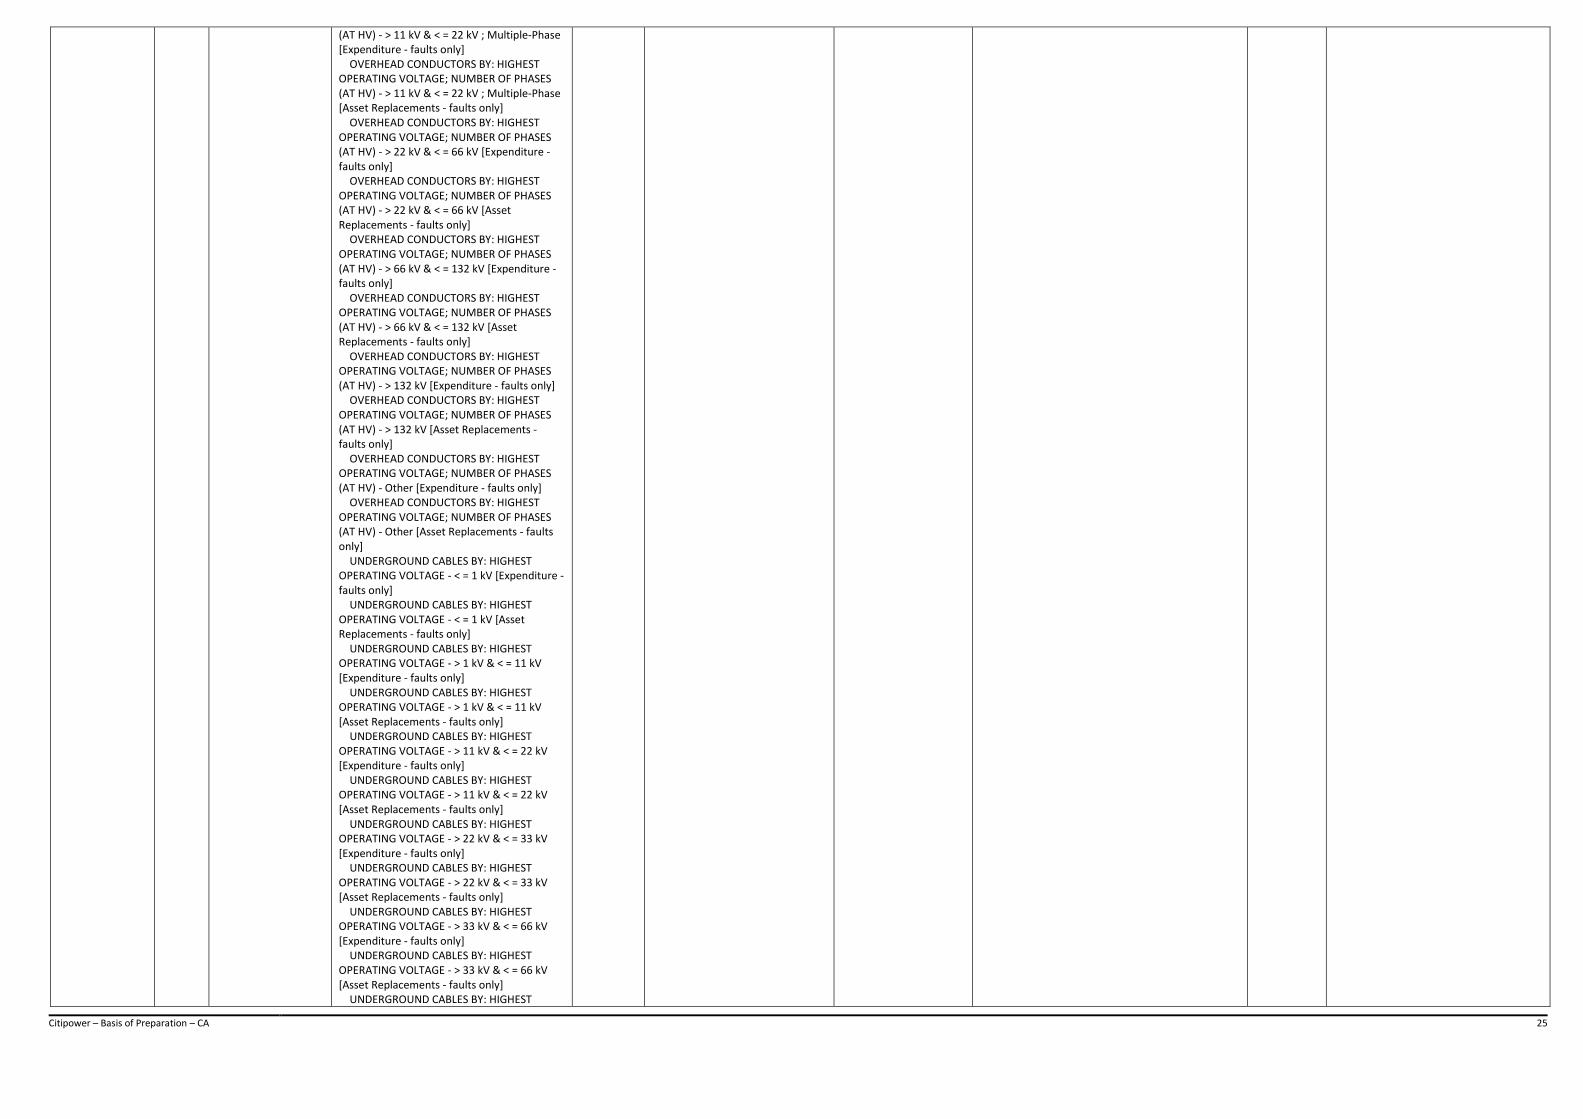
Citipower – Basis of Preparation – CA 25
(AT HV) - > 11 kV & < = 22 kV ; Multiple-Phase [Expenditure - faults only] OVERHEAD CONDUCTORS BY: HIGHEST OPERATING VOLTAGE; NUMBER OF PHASES (AT HV) - > 11 kV & < = 22 kV ; Multiple-Phase [Asset Replacements - faults only] OVERHEAD CONDUCTORS BY: HIGHEST OPERATING VOLTAGE; NUMBER OF PHASES (AT HV) - > 22 kV & < = 66 kV [Expenditure - faults only] OVERHEAD CONDUCTORS BY: HIGHEST OPERATING VOLTAGE; NUMBER OF PHASES (AT HV) - > 22 kV & < = 66 kV [Asset Replacements - faults only] OVERHEAD CONDUCTORS BY: HIGHEST OPERATING VOLTAGE; NUMBER OF PHASES (AT HV) - > 66 kV & < = 132 kV [Expenditure - faults only] OVERHEAD CONDUCTORS BY: HIGHEST OPERATING VOLTAGE; NUMBER OF PHASES (AT HV) - > 66 kV & < = 132 kV [Asset Replacements - faults only] OVERHEAD CONDUCTORS BY: HIGHEST OPERATING VOLTAGE; NUMBER OF PHASES (AT HV) - > 132 kV [Expenditure - faults only] OVERHEAD CONDUCTORS BY: HIGHEST OPERATING VOLTAGE; NUMBER OF PHASES (AT HV) - > 132 kV [Asset Replacements - faults only] OVERHEAD CONDUCTORS BY: HIGHEST OPERATING VOLTAGE; NUMBER OF PHASES (AT HV) - Other [Expenditure - faults only] OVERHEAD CONDUCTORS BY: HIGHEST OPERATING VOLTAGE; NUMBER OF PHASES (AT HV) - Other [Asset Replacements - faults only] UNDERGROUND CABLES BY: HIGHEST OPERATING VOLTAGE - < = 1 kV [Expenditure - faults only] UNDERGROUND CABLES BY: HIGHEST OPERATING VOLTAGE - < = 1 kV [Asset Replacements - faults only] UNDERGROUND CABLES BY: HIGHEST OPERATING VOLTAGE - > 1 kV & < = 11 kV [Expenditure - faults only] UNDERGROUND CABLES BY: HIGHEST OPERATING VOLTAGE - > 1 kV & < = 11 kV [Asset Replacements - faults only] UNDERGROUND CABLES BY: HIGHEST OPERATING VOLTAGE - > 11 kV & < = 22 kV [Expenditure - faults only] UNDERGROUND CABLES BY: HIGHEST OPERATING VOLTAGE - > 11 kV & < = 22 kV [Asset Replacements - faults only] UNDERGROUND CABLES BY: HIGHEST OPERATING VOLTAGE - > 22 kV & < = 33 kV [Expenditure - faults only] UNDERGROUND CABLES BY: HIGHEST OPERATING VOLTAGE - > 22 kV & < = 33 kV [Asset Replacements - faults only] UNDERGROUND CABLES BY: HIGHEST OPERATING VOLTAGE - > 33 kV & < = 66 kV [Expenditure - faults only] UNDERGROUND CABLES BY: HIGHEST OPERATING VOLTAGE - > 33 kV & < = 66 kV [Asset Replacements - faults only] UNDERGROUND CABLES BY: HIGHEST
Citipower – Basis of Preparation – CA 26
OPERATING VOLTAGE - > 66 kV & < = 132 kV [Expenditure - faults only] UNDERGROUND CABLES BY: HIGHEST OPERATING VOLTAGE - > 66 kV & < = 132 kV [Asset Replacements - faults only] UNDERGROUND CABLES BY: HIGHEST OPERATING VOLTAGE - > 132 kV [Expenditure - faults only] UNDERGROUND CABLES BY: HIGHEST OPERATING VOLTAGE - > 132 kV [Asset Replacements - faults only] UNDERGROUND CABLES BY: HIGHEST OPERATING VOLTAGE - Other [Expenditure - faults only] UNDERGROUND CABLES BY: HIGHEST OPERATING VOLTAGE - Other [Asset Replacements - faults only] SERVICE LINES BY: CONNECTION VOLTAGE; CUSTOMER TYPE; CONNECTION COMPLEXITY - < = 11 kV ; Residential ; Simple Type [Expenditure - faults only] SERVICE LINES BY: CONNECTION VOLTAGE; CUSTOMER TYPE; CONNECTION COMPLEXITY - < = 11 kV ; Residential ; Simple Type [Asset Replacements - faults only] SERVICE LINES BY: CONNECTION VOLTAGE; CUSTOMER TYPE; CONNECTION COMPLEXITY - < = 11 kV ; Commercial & Industrial ; Simple Type [Expenditure - faults only] SERVICE LINES BY: CONNECTION VOLTAGE; CUSTOMER TYPE; CONNECTION COMPLEXITY - < = 11 kV ; Commercial & Industrial ; Simple Type [Asset Replacements - faults only] SERVICE LINES BY: CONNECTION VOLTAGE; CUSTOMER TYPE; CONNECTION COMPLEXITY - < = 11 kV ; Residential ; Complex Type [Expenditure - faults only] SERVICE LINES BY: CONNECTION VOLTAGE; CUSTOMER TYPE; CONNECTION COMPLEXITY - < = 11 kV ; Residential ; Complex Type [Asset Replacements - faults only] SERVICE LINES BY: CONNECTION VOLTAGE; CUSTOMER TYPE; CONNECTION COMPLEXITY - < = 11 kV ; Commercial & Industrial ; Complex Type [Expenditure - faults only] SERVICE LINES BY: CONNECTION VOLTAGE; CUSTOMER TYPE; CONNECTION COMPLEXITY - < = 11 kV ; Commercial & Industrial ; Complex Type [Asset Replacements - faults only] SERVICE LINES BY: CONNECTION VOLTAGE; CUSTOMER TYPE; CONNECTION COMPLEXITY - < = 11 kV ; Subdivision ; Complex Type [Expenditure - faults only] SERVICE LINES BY: CONNECTION VOLTAGE; CUSTOMER TYPE; CONNECTION COMPLEXITY - < = 11 kV ; Subdivision ; Complex Type [Asset Replacements - faults only] SERVICE LINES BY: CONNECTION VOLTAGE; CUSTOMER TYPE; CONNECTION COMPLEXITY - > 11 kV & < = 22 kV ; Commercial & Industrial ; [Expenditure - faults only] SERVICE LINES BY: CONNECTION VOLTAGE; CUSTOMER TYPE; CONNECTION COMPLEXITY - > 11 kV & < = 22 kV ; Commercial & Industrial ; [Asset Replacements - faults only] SERVICE LINES BY: CONNECTION VOLTAGE; CUSTOMER TYPE; CONNECTION COMPLEXITY -
Citipower – Basis of Preparation – CA 27
> 11 kV & < = 22 kV ; Subdivision ; [Expenditure - faults only] SERVICE LINES BY: CONNECTION VOLTAGE; CUSTOMER TYPE; CONNECTION COMPLEXITY - > 11 kV & < = 22 kV ; Subdivision ; [Asset Replacements - faults only] SERVICE LINES BY: CONNECTION VOLTAGE; CUSTOMER TYPE; CONNECTION COMPLEXITY - > 22 kV & < = 33 kV ; Commercial & Industrial ; [Expenditure - faults only] SERVICE LINES BY: CONNECTION VOLTAGE; CUSTOMER TYPE; CONNECTION COMPLEXITY - > 22 kV & < = 33 kV ; Commercial & Industrial ; [Asset Replacements - faults only] SERVICE LINES BY: CONNECTION VOLTAGE; CUSTOMER TYPE; CONNECTION COMPLEXITY - > 22 kV & < = 33 kV ; Subdivision ; [Expenditure - faults only] SERVICE LINES BY: CONNECTION VOLTAGE; CUSTOMER TYPE; CONNECTION COMPLEXITY - > 22 kV & < = 33 kV ; Subdivision ; [Asset Replacements - faults only] SERVICE LINES BY: CONNECTION VOLTAGE; CUSTOMER TYPE; CONNECTION COMPLEXITY - > 33 kV & < = 66 kV ; Commercial & Industrial ; [Expenditure - faults only] SERVICE LINES BY: CONNECTION VOLTAGE; CUSTOMER TYPE; CONNECTION COMPLEXITY - > 33 kV & < = 66 kV ; Commercial & Industrial ; [Asset Replacements - faults only] SERVICE LINES BY: CONNECTION VOLTAGE; CUSTOMER TYPE; CONNECTION COMPLEXITY - > 33 kV & < = 66 kV ; Subdivision ; [Expenditure - faults only] SERVICE LINES BY: CONNECTION VOLTAGE; CUSTOMER TYPE; CONNECTION COMPLEXITY - > 33 kV & < = 66 kV ; Subdivision ; [Asset Replacements - faults only] SERVICE LINES BY: CONNECTION VOLTAGE; CUSTOMER TYPE; CONNECTION COMPLEXITY - > 66 kV & < = 132 kV ; Commercial & Industrial ; [Expenditure - faults only] SERVICE LINES BY: CONNECTION VOLTAGE; CUSTOMER TYPE; CONNECTION COMPLEXITY - > 66 kV & < = 132 kV ; Commercial & Industrial ; [Asset Replacements - faults only] SERVICE LINES BY: CONNECTION VOLTAGE; CUSTOMER TYPE; CONNECTION COMPLEXITY - > 66 kV & < = 132 kV ; Subdivision ; [Expenditure - faults only] SERVICE LINES BY: CONNECTION VOLTAGE; CUSTOMER TYPE; CONNECTION COMPLEXITY - > 66 kV & < = 132 kV ; Subdivision ; [Asset Replacements - faults only] SERVICE LINES BY: CONNECTION VOLTAGE; CUSTOMER TYPE; CONNECTION COMPLEXITY - > 132 kV ; Commercial & Industrial ; [Expenditure - faults only] SERVICE LINES BY: CONNECTION VOLTAGE; CUSTOMER TYPE; CONNECTION COMPLEXITY - > 132 kV ; Commercial & Industrial ; [Asset Replacements - faults only] SERVICE LINES BY: CONNECTION VOLTAGE; CUSTOMER TYPE; CONNECTION COMPLEXITY - > 132 kV ; Subdivision ; [Expenditure - faults only] SERVICE LINES BY: CONNECTION VOLTAGE;

Citipower – Basis of Preparation – CA 28
CUSTOMER TYPE; CONNECTION COMPLEXITY - > 132 kV ; Subdivision ; [Asset Replacements - faults only] SERVICE LINES BY: CONNECTION VOLTAGE; CUSTOMER TYPE; CONNECTION COMPLEXITY - Other [Expenditure - faults only] SERVICE LINES BY: CONNECTION VOLTAGE; CUSTOMER TYPE; CONNECTION COMPLEXITY - Other [Asset Replacements - faults only] TRANSFORMERS BY: MOUNTING TYPE; HIGHEST OPERATING VOLTAGE ; AMPERE RATING; NUMBER OF PHASES (AT LV) - Pole Mounted ; < = 22kV ; < = 60 kVA ; Single Phase [Expenditure - faults only] TRANSFORMERS BY: MOUNTING TYPE; HIGHEST OPERATING VOLTAGE ; AMPERE RATING; NUMBER OF PHASES (AT LV) - Pole Mounted ; < = 22kV ; < = 60 kVA ; Single Phase [Asset Replacements - faults only] TRANSFORMERS BY: MOUNTING TYPE; HIGHEST OPERATING VOLTAGE ; AMPERE RATING; NUMBER OF PHASES (AT LV) - Pole Mounted ; < = 22kV ; > 60 kVA and < = 600 kVA ; Single Phase [Expenditure - faults only] TRANSFORMERS BY: MOUNTING TYPE; HIGHEST OPERATING VOLTAGE ; AMPERE RATING; NUMBER OF PHASES (AT LV) - Pole Mounted ; < = 22kV ; > 60 kVA and < = 600 kVA ; Single Phase [Asset Replacements - faults only] TRANSFORMERS BY: MOUNTING TYPE; HIGHEST OPERATING VOLTAGE ; AMPERE RATING; NUMBER OF PHASES (AT LV) - Pole Mounted ; < = 22kV ; > 600 kVA ; Single Phase [Expenditure - faults only] TRANSFORMERS BY: MOUNTING TYPE; HIGHEST OPERATING VOLTAGE ; AMPERE RATING; NUMBER OF PHASES (AT LV) - Pole Mounted ; < = 22kV ; > 600 kVA ; Single Phase [Asset Replacements - faults only] TRANSFORMERS BY: MOUNTING TYPE; HIGHEST OPERATING VOLTAGE ; AMPERE RATING; NUMBER OF PHASES (AT LV) - Pole Mounted ; < = 22kV ; < = 60 kVA ; Multiple Phase [Expenditure - faults only] TRANSFORMERS BY: MOUNTING TYPE; HIGHEST OPERATING VOLTAGE ; AMPERE RATING; NUMBER OF PHASES (AT LV) - Pole Mounted ; < = 22kV ; < = 60 kVA ; Multiple Phase [Asset Replacements - faults only] TRANSFORMERS BY: MOUNTING TYPE; HIGHEST OPERATING VOLTAGE ; AMPERE RATING; NUMBER OF PHASES (AT LV) - Pole Mounted ; < = 22kV ; > 60 kVA and < = 600 kVA ; Multiple Phase [Expenditure - faults only] TRANSFORMERS BY: MOUNTING TYPE; HIGHEST OPERATING VOLTAGE ; AMPERE RATING; NUMBER OF PHASES (AT LV) - Pole Mounted ; < = 22kV ; > 60 kVA and < = 600 kVA ; Multiple Phase [Asset Replacements - faults only] TRANSFORMERS BY: MOUNTING TYPE; HIGHEST OPERATING VOLTAGE ; AMPERE RATING; NUMBER OF PHASES (AT LV) - Pole Mounted ; < = 22kV ; > 600 kVA ; Multiple Phase [Expenditure - faults only]

Citipower – Basis of Preparation – CA 29
TRANSFORMERS BY: MOUNTING TYPE; HIGHEST OPERATING VOLTAGE ; AMPERE RATING; NUMBER OF PHASES (AT LV) - Pole Mounted ; < = 22kV ; > 600 kVA ; Multiple Phase [Asset Replacements - faults only] TRANSFORMERS BY: MOUNTING TYPE; HIGHEST OPERATING VOLTAGE ; AMPERE RATING; NUMBER OF PHASES (AT LV) - Kiosk Mounted ; < = 22kV ; < = 60 kVA ; Single Phase [Expenditure - faults only] TRANSFORMERS BY: MOUNTING TYPE; HIGHEST OPERATING VOLTAGE ; AMPERE RATING; NUMBER OF PHASES (AT LV) - Kiosk Mounted ; < = 22kV ; < = 60 kVA ; Single Phase [Asset Replacements - faults only] TRANSFORMERS BY: MOUNTING TYPE; HIGHEST OPERATING VOLTAGE ; AMPERE RATING; NUMBER OF PHASES (AT LV) - Kiosk Mounted ; < = 22kV ; > 60 kVA and < = 600 kVA ; Single Phase [Expenditure - faults only] TRANSFORMERS BY: MOUNTING TYPE; HIGHEST OPERATING VOLTAGE ; AMPERE RATING; NUMBER OF PHASES (AT LV) - Kiosk Mounted ; < = 22kV ; > 60 kVA and < = 600 kVA ; Single Phase [Asset Replacements - faults only] TRANSFORMERS BY: MOUNTING TYPE; HIGHEST OPERATING VOLTAGE ; AMPERE RATING; NUMBER OF PHASES (AT LV) - Kiosk Mounted ; < = 22kV ; > 600 kVA ; Single Phase [Expenditure - faults only] TRANSFORMERS BY: MOUNTING TYPE; HIGHEST OPERATING VOLTAGE ; AMPERE RATING; NUMBER OF PHASES (AT LV) - Kiosk Mounted ; < = 22kV ; > 600 kVA ; Single Phase [Asset Replacements - faults only] TRANSFORMERS BY: MOUNTING TYPE; HIGHEST OPERATING VOLTAGE ; AMPERE RATING; NUMBER OF PHASES (AT LV) - Kiosk Mounted ; < = 22kV ; < = 60 kVA ; Multiple Phase [Expenditure - faults only] TRANSFORMERS BY: MOUNTING TYPE; HIGHEST OPERATING VOLTAGE ; AMPERE RATING; NUMBER OF PHASES (AT LV) - Kiosk Mounted ; < = 22kV ; < = 60 kVA ; Multiple Phase [Asset Replacements - faults only] TRANSFORMERS BY: MOUNTING TYPE; HIGHEST OPERATING VOLTAGE ; AMPERE RATING; NUMBER OF PHASES (AT LV) - Kiosk Mounted ; < = 22kV ; > 60 kVA and < = 600 kVA ; Multiple Phase [Expenditure - faults only] TRANSFORMERS BY: MOUNTING TYPE; HIGHEST OPERATING VOLTAGE ; AMPERE RATING; NUMBER OF PHASES (AT LV) - Kiosk Mounted ; < = 22kV ; > 60 kVA and < = 600 kVA ; Multiple Phase [Asset Replacements - faults only] TRANSFORMERS BY: MOUNTING TYPE; HIGHEST OPERATING VOLTAGE ; AMPERE RATING; NUMBER OF PHASES (AT LV) - Kiosk Mounted ; < = 22kV ; > 600 kVA ; Multiple Phase [Expenditure - faults only] TRANSFORMERS BY: MOUNTING TYPE; HIGHEST OPERATING VOLTAGE ; AMPERE RATING; NUMBER OF PHASES (AT LV) - Kiosk Mounted ; < = 22kV ; > 600 kVA ; Multiple

Citipower – Basis of Preparation – CA 30
Phase [Asset Replacements - faults only] TRANSFORMERS BY: MOUNTING TYPE; HIGHEST OPERATING VOLTAGE ; AMPERE RATING; NUMBER OF PHASES (AT LV) - Ground Outdoor / Indoor Chamber Mounted; < 22 kV ; < = 60 kVA ; Single Phase [Expenditure - faults only] TRANSFORMERS BY: MOUNTING TYPE; HIGHEST OPERATING VOLTAGE ; AMPERE RATING; NUMBER OF PHASES (AT LV) - Ground Outdoor / Indoor Chamber Mounted; < 22 kV ; < = 60 kVA ; Single Phase [Asset Replacements - faults only] TRANSFORMERS BY: MOUNTING TYPE; HIGHEST OPERATING VOLTAGE ; AMPERE RATING; NUMBER OF PHASES (AT LV) - Ground Outdoor / Indoor Chamber Mounted; < 22 kV ; > 60 kVA and < = 600 kVA ; Single Phase [Expenditure - faults only] TRANSFORMERS BY: MOUNTING TYPE; HIGHEST OPERATING VOLTAGE ; AMPERE RATING; NUMBER OF PHASES (AT LV) - Ground Outdoor / Indoor Chamber Mounted; < 22 kV ; > 60 kVA and < = 600 kVA ; Single Phase [Asset Replacements - faults only] TRANSFORMERS BY: MOUNTING TYPE; HIGHEST OPERATING VOLTAGE ; AMPERE RATING; NUMBER OF PHASES (AT LV) - Ground Outdoor / Indoor Chamber Mounted; < 22 kV ; > 600 kVA ; Single Phase [Expenditure - faults only] TRANSFORMERS BY: MOUNTING TYPE; HIGHEST OPERATING VOLTAGE ; AMPERE RATING; NUMBER OF PHASES (AT LV) - Ground Outdoor / Indoor Chamber Mounted; < 22 kV ; > 600 kVA ; Single Phase [Asset Replacements - faults only] TRANSFORMERS BY: MOUNTING TYPE; HIGHEST OPERATING VOLTAGE ; AMPERE RATING; NUMBER OF PHASES (AT LV) - Ground Outdoor / Indoor Chamber Mounted; < 22 kV ; < = 60 kVA ; Multiple Phase [Expenditure - faults only] TRANSFORMERS BY: MOUNTING TYPE; HIGHEST OPERATING VOLTAGE ; AMPERE RATING; NUMBER OF PHASES (AT LV) - Ground Outdoor / Indoor Chamber Mounted; < 22 kV ; < = 60 kVA ; Multiple Phase [Asset Replacements - faults only] TRANSFORMERS BY: MOUNTING TYPE; HIGHEST OPERATING VOLTAGE ; AMPERE RATING; NUMBER OF PHASES (AT LV) - Ground Outdoor / Indoor Chamber Mounted; < 22 kV ; > 60 kVA and < = 600 kVA ; Multiple Phase [Expenditure - faults only] TRANSFORMERS BY: MOUNTING TYPE; HIGHEST OPERATING VOLTAGE ; AMPERE RATING; NUMBER OF PHASES (AT LV) - Ground Outdoor / Indoor Chamber Mounted; < 22 kV ; > 60 kVA and < = 600 kVA ; Multiple Phase [Asset Replacements - faults only] TRANSFORMERS BY: MOUNTING TYPE; HIGHEST OPERATING VOLTAGE ; AMPERE RATING; NUMBER OF PHASES (AT LV) - Ground Outdoor / Indoor Chamber Mounted; < 22 kV ; > 600 kVA ; Multiple Phase [Expenditure - faults only]

Citipower – Basis of Preparation – CA 31
TRANSFORMERS BY: MOUNTING TYPE; HIGHEST OPERATING VOLTAGE ; AMPERE RATING; NUMBER OF PHASES (AT LV) - Ground Outdoor / Indoor Chamber Mounted; < 22 kV ; > 600 kVA ; Multiple Phase [Asset Replacements - faults only] TRANSFORMERS BY: MOUNTING TYPE; HIGHEST OPERATING VOLTAGE ; AMPERE RATING; NUMBER OF PHASES (AT LV) - Ground Outdoor / Indoor Chamber Mounted; > = 22 kV & < = 33 kV ; < = 15 MVA [Expenditure - faults only] TRANSFORMERS BY: MOUNTING TYPE; HIGHEST OPERATING VOLTAGE ; AMPERE RATING; NUMBER OF PHASES (AT LV) - Ground Outdoor / Indoor Chamber Mounted; > = 22 kV & < = 33 kV ; < = 15 MVA [Asset Replacements - faults only] TRANSFORMERS BY: MOUNTING TYPE; HIGHEST OPERATING VOLTAGE ; AMPERE RATING; NUMBER OF PHASES (AT LV) - Ground Outdoor / Indoor Chamber Mounted; > = 22 kV & < = 33 kV ; > 15 MVA and < = 40 MVA [Expenditure - faults only] TRANSFORMERS BY: MOUNTING TYPE; HIGHEST OPERATING VOLTAGE ; AMPERE RATING; NUMBER OF PHASES (AT LV) - Ground Outdoor / Indoor Chamber Mounted; > = 22 kV & < = 33 kV ; > 15 MVA and < = 40 MVA [Asset Replacements - faults only] TRANSFORMERS BY: MOUNTING TYPE; HIGHEST OPERATING VOLTAGE ; AMPERE RATING; NUMBER OF PHASES (AT LV) - Ground Outdoor / Indoor Chamber Mounted; > = 22 kV & < = 33 kV ; > 40 MVA [Expenditure - faults only] TRANSFORMERS BY: MOUNTING TYPE; HIGHEST OPERATING VOLTAGE ; AMPERE RATING; NUMBER OF PHASES (AT LV) - Ground Outdoor / Indoor Chamber Mounted; > = 22 kV & < = 33 kV ; > 40 MVA [Asset Replacements - faults only] TRANSFORMERS BY: MOUNTING TYPE; HIGHEST OPERATING VOLTAGE ; AMPERE RATING; NUMBER OF PHASES (AT LV) - Ground Outdoor / Indoor Chamber Mounted; > 33 kV & < = 66 kV ; < = 15 MVA [Expenditure - faults only] TRANSFORMERS BY: MOUNTING TYPE; HIGHEST OPERATING VOLTAGE ; AMPERE RATING; NUMBER OF PHASES (AT LV) - Ground Outdoor / Indoor Chamber Mounted; > 33 kV & < = 66 kV ; < = 15 MVA [Asset Replacements - faults only] TRANSFORMERS BY: MOUNTING TYPE; HIGHEST OPERATING VOLTAGE ; AMPERE RATING; NUMBER OF PHASES (AT LV) - Ground Outdoor / Indoor Chamber Mounted; > 33 kV & < = 66 kV ; > 15 MVA and < = 40 MVA [Expenditure - faults only] TRANSFORMERS BY: MOUNTING TYPE; HIGHEST OPERATING VOLTAGE ; AMPERE RATING; NUMBER OF PHASES (AT LV) - Ground Outdoor / Indoor Chamber Mounted; > 33 kV & < = 66 kV ; > 15 MVA and < = 40 MVA [Asset Replacements - faults only] TRANSFORMERS BY: MOUNTING TYPE;

Citipower – Basis of Preparation – CA 32
HIGHEST OPERATING VOLTAGE ; AMPERE RATING; NUMBER OF PHASES (AT LV) - Ground Outdoor / Indoor Chamber Mounted; > 33 kV & < = 66 kV ; > 40 MVA [Expenditure - faults only] TRANSFORMERS BY: MOUNTING TYPE; HIGHEST OPERATING VOLTAGE ; AMPERE RATING; NUMBER OF PHASES (AT LV) - Ground Outdoor / Indoor Chamber Mounted; > 33 kV & < = 66 kV ; > 40 MVA [Asset Replacements - faults only] TRANSFORMERS BY: MOUNTING TYPE; HIGHEST OPERATING VOLTAGE ; AMPERE RATING; NUMBER OF PHASES (AT LV) - Ground Outdoor / Indoor Chamber Mounted; > 66 kV & < = 132 kV ; < = 100 MVA [Expenditure - faults only] TRANSFORMERS BY: MOUNTING TYPE; HIGHEST OPERATING VOLTAGE ; AMPERE RATING; NUMBER OF PHASES (AT LV) - Ground Outdoor / Indoor Chamber Mounted; > 66 kV & < = 132 kV ; < = 100 MVA [Asset Replacements - faults only] TRANSFORMERS BY: MOUNTING TYPE; HIGHEST OPERATING VOLTAGE ; AMPERE RATING; NUMBER OF PHASES (AT LV) - Ground Outdoor / Indoor Chamber Mounted; > 66 kV & < = 132 kV ; > 100 MVA [Expenditure - faults only] TRANSFORMERS BY: MOUNTING TYPE; HIGHEST OPERATING VOLTAGE ; AMPERE RATING; NUMBER OF PHASES (AT LV) - Ground Outdoor / Indoor Chamber Mounted; > 66 kV & < = 132 kV ; > 100 MVA [Asset Replacements - faults only] TRANSFORMERS BY: MOUNTING TYPE; HIGHEST OPERATING VOLTAGE ; AMPERE RATING; NUMBER OF PHASES (AT LV) - Ground Outdoor / Indoor Chamber Mounted; > 132 kV ; < = 100 MVA [Expenditure - faults only] TRANSFORMERS BY: MOUNTING TYPE; HIGHEST OPERATING VOLTAGE ; AMPERE RATING; NUMBER OF PHASES (AT LV) - Ground Outdoor / Indoor Chamber Mounted; > 132 kV ; < = 100 MVA [Asset Replacements - faults only] TRANSFORMERS BY: MOUNTING TYPE; HIGHEST OPERATING VOLTAGE ; AMPERE RATING; NUMBER OF PHASES (AT LV) - Ground Outdoor / Indoor Chamber Mounted; > 132 kV ; > 100 MVA [Expenditure - faults only] TRANSFORMERS BY: MOUNTING TYPE; HIGHEST OPERATING VOLTAGE ; AMPERE RATING; NUMBER OF PHASES (AT LV) - Ground Outdoor / Indoor Chamber Mounted; > 132 kV ; > 100 MVA [Asset Replacements - faults only] TRANSFORMERS BY: MOUNTING TYPE; HIGHEST OPERATING VOLTAGE ; AMPERE RATING; NUMBER OF PHASES (AT LV) - Other [Expenditure - faults only] TRANSFORMERS BY: MOUNTING TYPE; HIGHEST OPERATING VOLTAGE ; AMPERE RATING; NUMBER OF PHASES (AT LV) - Other [Asset Replacements - faults only]
Citipower – Basis of Preparation – CA 33
SWITCHGEAR BY: HIGHEST OPERATING VOLTAGE ; SWITCH FUNCTION - < = 11 kV ; FUSE [Expenditure - faults only] SWITCHGEAR BY: HIGHEST OPERATING VOLTAGE ; SWITCH FUNCTION - < = 11 kV ; FUSE [Asset Replacements - faults only] SWITCHGEAR BY: HIGHEST OPERATING VOLTAGE ; SWITCH FUNCTION - < = 11 kV ; Switch [Expenditure - faults only] SWITCHGEAR BY: HIGHEST OPERATING VOLTAGE ; SWITCH FUNCTION - < = 11 kV ; Switch [Asset Replacements - faults only] SWITCHGEAR BY: HIGHEST OPERATING VOLTAGE ; SWITCH FUNCTION - < = 11 kV ; Circuit Breaker [Expenditure - faults only] SWITCHGEAR BY: HIGHEST OPERATING VOLTAGE ; SWITCH FUNCTION - < = 11 kV ; Circuit Breaker [Asset Replacements - faults only] SWITCHGEAR BY: HIGHEST OPERATING VOLTAGE ; SWITCH FUNCTION - > 11 kV & < = 22 kV ; Switch [Expenditure - faults only] SWITCHGEAR BY: HIGHEST OPERATING VOLTAGE ; SWITCH FUNCTION - > 11 kV & < = 22 kV ; Switch [Asset Replacements - faults only] SWITCHGEAR BY: HIGHEST OPERATING VOLTAGE ; SWITCH FUNCTION - > 11 kV & < = 22 kV ; Circuit Breaker [Expenditure - faults only] SWITCHGEAR BY: HIGHEST OPERATING VOLTAGE ; SWITCH FUNCTION - > 11 kV & < = 22 kV ; Circuit Breaker [Asset Replacements - faults only] SWITCHGEAR BY: HIGHEST OPERATING VOLTAGE ; SWITCH FUNCTION - > 22 kV & < = 33 kV ; Switch [Expenditure - faults only] SWITCHGEAR BY: HIGHEST OPERATING VOLTAGE ; SWITCH FUNCTION - > 22 kV & < = 33 kV ; Switch [Asset Replacements - faults only] SWITCHGEAR BY: HIGHEST OPERATING VOLTAGE ; SWITCH FUNCTION - > 22 kV & < = 33 kV ; Circuit Breaker [Expenditure - faults only] SWITCHGEAR BY: HIGHEST OPERATING VOLTAGE ; SWITCH FUNCTION - > 22 kV & < = 33 kV ; Circuit Breaker [Asset Replacements - faults only] SWITCHGEAR BY: HIGHEST OPERATING VOLTAGE ; SWITCH FUNCTION - > 33 kV & < = 66 kV ; Switch [Expenditure - faults only] SWITCHGEAR BY: HIGHEST OPERATING VOLTAGE ; SWITCH FUNCTION - > 33 kV & < = 66 kV ; Switch [Asset Replacements - faults only] SWITCHGEAR BY: HIGHEST OPERATING VOLTAGE ; SWITCH FUNCTION - > 33 kV & < = 66 kV ; Circuit Breaker [Expenditure - faults only] SWITCHGEAR BY: HIGHEST OPERATING VOLTAGE ; SWITCH FUNCTION - > 33 kV & < = 66 kV ; Circuit Breaker [Asset Replacements - faults only] SWITCHGEAR BY: HIGHEST OPERATING VOLTAGE ; SWITCH FUNCTION - > 66 kV & < = 132 kV ; Switch [Expenditure - faults only]
Citipower – Basis of Preparation – CA 34
SWITCHGEAR BY: HIGHEST OPERATING VOLTAGE ; SWITCH FUNCTION - > 66 kV & < = 132 kV ; Switch [Asset Replacements - faults only] SWITCHGEAR BY: HIGHEST OPERATING VOLTAGE ; SWITCH FUNCTION - > 66 kV & < = 132 kV ; Circuit Breaker [Expenditure - faults only] SWITCHGEAR BY: HIGHEST OPERATING VOLTAGE ; SWITCH FUNCTION - > 66 kV & < = 132 kV ; Circuit Breaker [Asset Replacements - faults only] SWITCHGEAR BY: HIGHEST OPERATING VOLTAGE ; SWITCH FUNCTION - > 132 kV ; Switch [Expenditure - faults only] SWITCHGEAR BY: HIGHEST OPERATING VOLTAGE ; SWITCH FUNCTION - > 132 kV ; Switch [Asset Replacements - faults only] SWITCHGEAR BY: HIGHEST OPERATING VOLTAGE ; SWITCH FUNCTION - > 132 kV ; Circuit Breaker [Expenditure - faults only] SWITCHGEAR BY: HIGHEST OPERATING VOLTAGE ; SWITCH FUNCTION - > 132 kV ; Circuit Breaker [Asset Replacements - faults only] SWITCHGEAR BY: HIGHEST OPERATING VOLTAGE ; SWITCH FUNCTION - Other [Expenditure - faults only] SWITCHGEAR BY: HIGHEST OPERATING VOLTAGE ; SWITCH FUNCTION - Other [Asset Replacements - faults only] PUBLIC LIGHTING BY: ASSET TYPE ; LIGHTING OBLIGATION - Luminaires ; Major Road [Expenditure - faults only] PUBLIC LIGHTING BY: ASSET TYPE ; LIGHTING OBLIGATION - Luminaires ; Major Road [Asset Replacements - faults only] PUBLIC LIGHTING BY: ASSET TYPE ; LIGHTING OBLIGATION - Luminaires ; Minor Road [Expenditure - faults only] PUBLIC LIGHTING BY: ASSET TYPE ; LIGHTING OBLIGATION - Luminaires ; Minor Road [Asset Replacements - faults only] PUBLIC LIGHTING BY: ASSET TYPE ; LIGHTING OBLIGATION - Brackets ; Major Road [Expenditure - faults only] PUBLIC LIGHTING BY: ASSET TYPE ; LIGHTING OBLIGATION - Brackets ; Major Road [Asset Replacements - faults only] PUBLIC LIGHTING BY: ASSET TYPE ; LIGHTING OBLIGATION - Brackets ; Minor Road [Expenditure - faults only] PUBLIC LIGHTING BY: ASSET TYPE ; LIGHTING OBLIGATION - Brackets ; Minor Road [Asset Replacements - faults only] PUBLIC LIGHTING BY: ASSET TYPE ; LIGHTING OBLIGATION - Lamps ; Major Road [Expenditure - faults only] PUBLIC LIGHTING BY: ASSET TYPE ; LIGHTING OBLIGATION - Lamps ; Major Road [Asset Replacements - faults only] PUBLIC LIGHTING BY: ASSET TYPE ; LIGHTING OBLIGATION - Lamps ; Minor Road [Expenditure - faults only] PUBLIC LIGHTING BY: ASSET TYPE ; LIGHTING OBLIGATION - Lamps ; Minor Road [Asset Replacements - faults only]
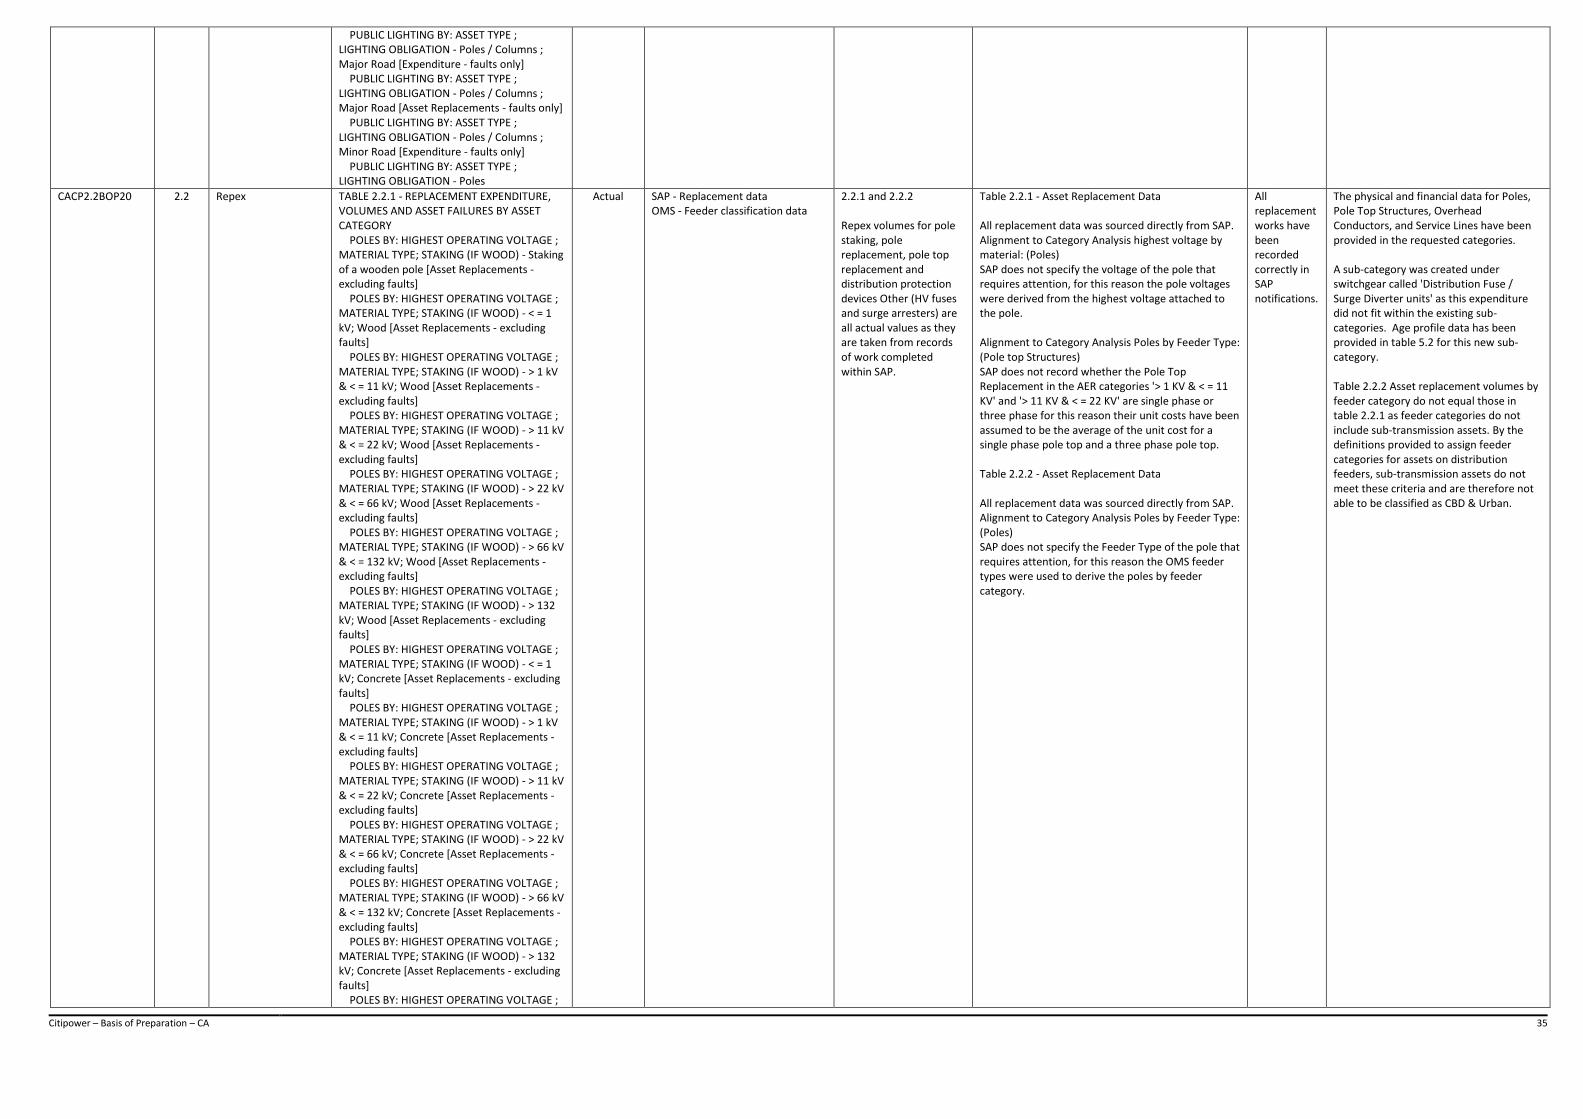
Citipower – Basis of Preparation – CA 35
PUBLIC LIGHTING BY: ASSET TYPE ; LIGHTING OBLIGATION - Poles / Columns ; Major Road [Expenditure - faults only] PUBLIC LIGHTING BY: ASSET TYPE ; LIGHTING OBLIGATION - Poles / Columns ; Major Road [Asset Replacements - faults only] PUBLIC LIGHTING BY: ASSET TYPE ; LIGHTING OBLIGATION - Poles / Columns ; Minor Road [Expenditure - faults only] PUBLIC LIGHTING BY: ASSET TYPE ; LIGHTING OBLIGATION - Poles
CACP2.2BOP20 2.2 Repex TABLE 2.2.1 - REPLACEMENT EXPENDITURE, VOLUMES AND ASSET FAILURES BY ASSET CATEGORY POLES BY: HIGHEST OPERATING VOLTAGE ; MATERIAL TYPE; STAKING (IF WOOD) - Staking of a wooden pole [Asset Replacements - excluding faults] POLES BY: HIGHEST OPERATING VOLTAGE ; MATERIAL TYPE; STAKING (IF WOOD) - < = 1 kV; Wood [Asset Replacements - excluding faults] POLES BY: HIGHEST OPERATING VOLTAGE ; MATERIAL TYPE; STAKING (IF WOOD) - > 1 kV & < = 11 kV; Wood [Asset Replacements - excluding faults] POLES BY: HIGHEST OPERATING VOLTAGE ; MATERIAL TYPE; STAKING (IF WOOD) - > 11 kV & < = 22 kV; Wood [Asset Replacements - excluding faults] POLES BY: HIGHEST OPERATING VOLTAGE ; MATERIAL TYPE; STAKING (IF WOOD) - > 22 kV & < = 66 kV; Wood [Asset Replacements - excluding faults] POLES BY: HIGHEST OPERATING VOLTAGE ; MATERIAL TYPE; STAKING (IF WOOD) - > 66 kV & < = 132 kV; Wood [Asset Replacements - excluding faults] POLES BY: HIGHEST OPERATING VOLTAGE ; MATERIAL TYPE; STAKING (IF WOOD) - > 132 kV; Wood [Asset Replacements - excluding faults] POLES BY: HIGHEST OPERATING VOLTAGE ; MATERIAL TYPE; STAKING (IF WOOD) - < = 1 kV; Concrete [Asset Replacements - excluding faults] POLES BY: HIGHEST OPERATING VOLTAGE ; MATERIAL TYPE; STAKING (IF WOOD) - > 1 kV & < = 11 kV; Concrete [Asset Replacements - excluding faults] POLES BY: HIGHEST OPERATING VOLTAGE ; MATERIAL TYPE; STAKING (IF WOOD) - > 11 kV & < = 22 kV; Concrete [Asset Replacements - excluding faults] POLES BY: HIGHEST OPERATING VOLTAGE ; MATERIAL TYPE; STAKING (IF WOOD) - > 22 kV & < = 66 kV; Concrete [Asset Replacements - excluding faults] POLES BY: HIGHEST OPERATING VOLTAGE ; MATERIAL TYPE; STAKING (IF WOOD) - > 66 kV & < = 132 kV; Concrete [Asset Replacements - excluding faults] POLES BY: HIGHEST OPERATING VOLTAGE ; MATERIAL TYPE; STAKING (IF WOOD) - > 132 kV; Concrete [Asset Replacements - excluding faults] POLES BY: HIGHEST OPERATING VOLTAGE ;
Actual SAP - Replacement data OMS - Feeder classification data
2.2.1 and 2.2.2 Repex volumes for pole staking, pole replacement, pole top replacement and distribution protection devices Other (HV fuses and surge arresters) are all actual values as they are taken from records of work completed within SAP.
Table 2.2.1 - Asset Replacement Data All replacement data was sourced directly from SAP. Alignment to Category Analysis highest voltage by material: (Poles) SAP does not specify the voltage of the pole that requires attention, for this reason the pole voltages were derived from the highest voltage attached to the pole. Alignment to Category Analysis Poles by Feeder Type: (Pole top Structures) SAP does not record whether the Pole Top Replacement in the AER categories '> 1 KV & < = 11 KV' and '> 11 KV & < = 22 KV' are single phase or three phase for this reason their unit costs have been assumed to be the average of the unit cost for a single phase pole top and a three phase pole top. Table 2.2.2 - Asset Replacement Data All replacement data was sourced directly from SAP. Alignment to Category Analysis Poles by Feeder Type: (Poles) SAP does not specify the Feeder Type of the pole that requires attention, for this reason the OMS feeder types were used to derive the poles by feeder category.
All replacement works have been recorded correctly in SAP notifications.
The physical and financial data for Poles, Pole Top Structures, Overhead Conductors, and Service Lines have been provided in the requested categories. A sub-category was created under switchgear called 'Distribution Fuse / Surge Diverter units' as this expenditure did not fit within the existing sub-categories. Age profile data has been provided in table 5.2 for this new sub-category. Table 2.2.2 Asset replacement volumes by feeder category do not equal those in table 2.2.1 as feeder categories do not include sub-transmission assets. By the definitions provided to assign feeder categories for assets on distribution feeders, sub-transmission assets do not meet these criteria and are therefore not able to be classified as CBD & Urban.
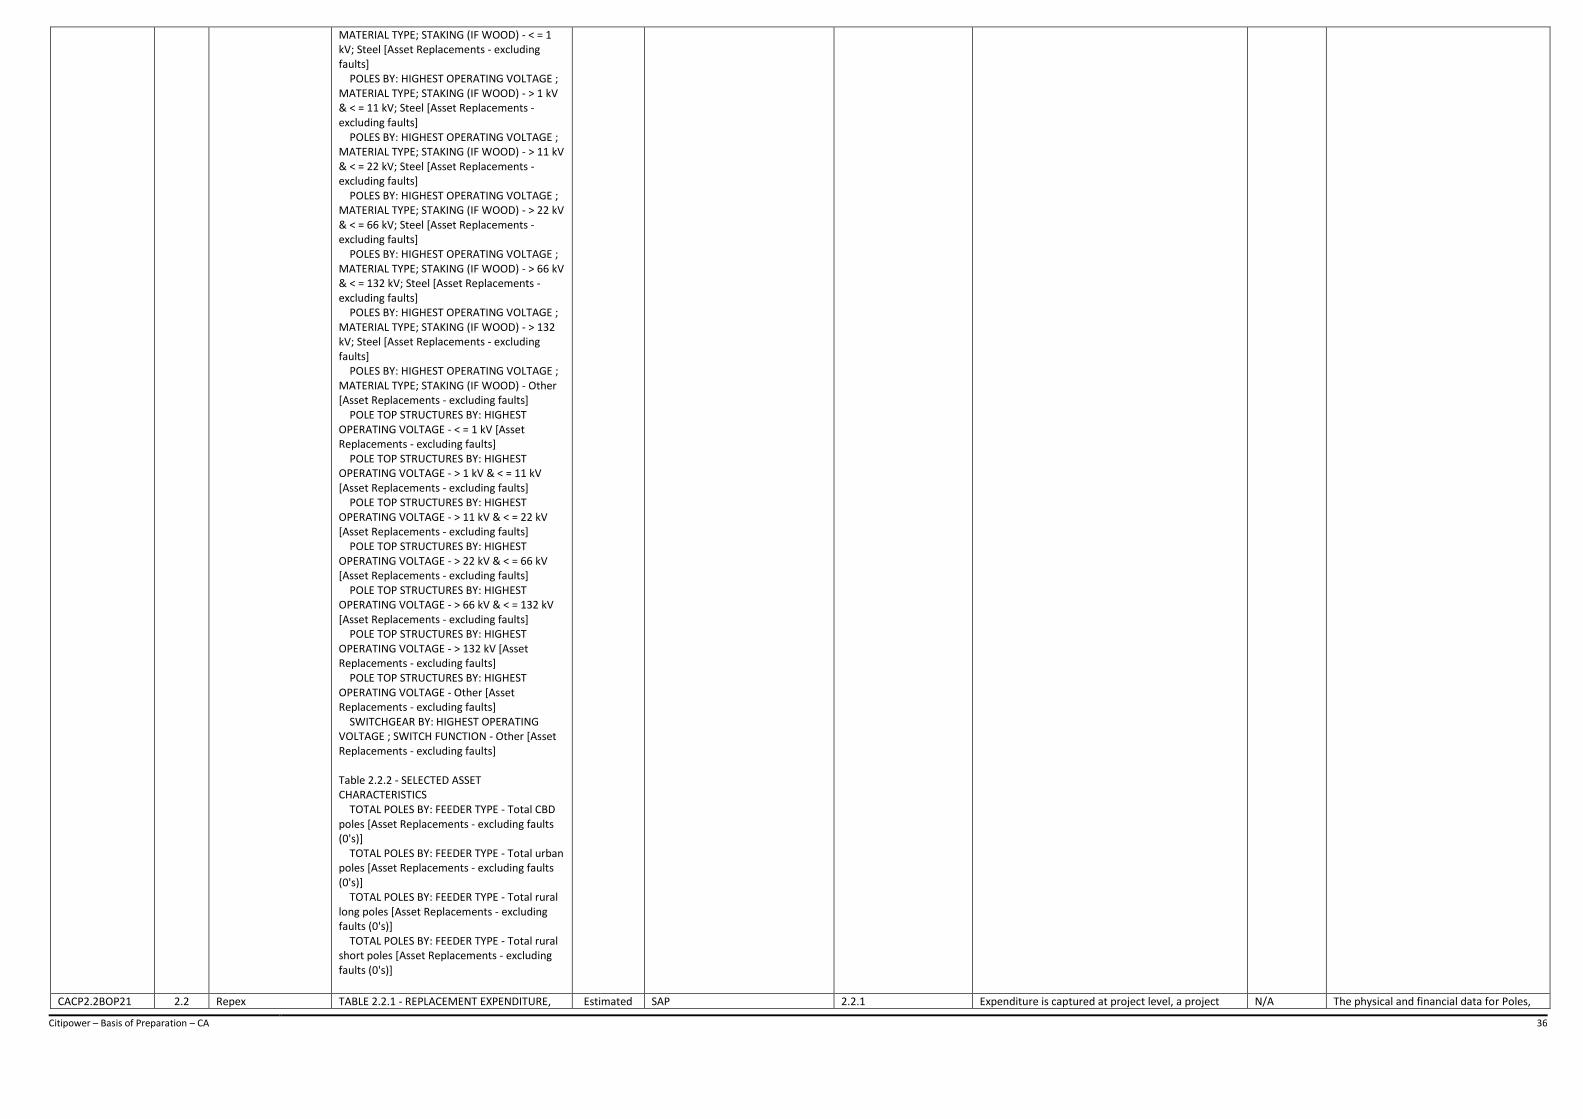
Citipower – Basis of Preparation – CA 36
MATERIAL TYPE; STAKING (IF WOOD) - < = 1 kV; Steel [Asset Replacements - excluding faults] POLES BY: HIGHEST OPERATING VOLTAGE ; MATERIAL TYPE; STAKING (IF WOOD) - > 1 kV & < = 11 kV; Steel [Asset Replacements - excluding faults] POLES BY: HIGHEST OPERATING VOLTAGE ; MATERIAL TYPE; STAKING (IF WOOD) - > 11 kV & < = 22 kV; Steel [Asset Replacements - excluding faults] POLES BY: HIGHEST OPERATING VOLTAGE ; MATERIAL TYPE; STAKING (IF WOOD) - > 22 kV & < = 66 kV; Steel [Asset Replacements - excluding faults] POLES BY: HIGHEST OPERATING VOLTAGE ; MATERIAL TYPE; STAKING (IF WOOD) - > 66 kV & < = 132 kV; Steel [Asset Replacements - excluding faults] POLES BY: HIGHEST OPERATING VOLTAGE ; MATERIAL TYPE; STAKING (IF WOOD) - > 132 kV; Steel [Asset Replacements - excluding faults] POLES BY: HIGHEST OPERATING VOLTAGE ; MATERIAL TYPE; STAKING (IF WOOD) - Other [Asset Replacements - excluding faults] POLE TOP STRUCTURES BY: HIGHEST OPERATING VOLTAGE - < = 1 kV [Asset Replacements - excluding faults] POLE TOP STRUCTURES BY: HIGHEST OPERATING VOLTAGE - > 1 kV & < = 11 kV [Asset Replacements - excluding faults] POLE TOP STRUCTURES BY: HIGHEST OPERATING VOLTAGE - > 11 kV & < = 22 kV [Asset Replacements - excluding faults] POLE TOP STRUCTURES BY: HIGHEST OPERATING VOLTAGE - > 22 kV & < = 66 kV [Asset Replacements - excluding faults] POLE TOP STRUCTURES BY: HIGHEST OPERATING VOLTAGE - > 66 kV & < = 132 kV [Asset Replacements - excluding faults] POLE TOP STRUCTURES BY: HIGHEST OPERATING VOLTAGE - > 132 kV [Asset Replacements - excluding faults] POLE TOP STRUCTURES BY: HIGHEST OPERATING VOLTAGE - Other [Asset Replacements - excluding faults] SWITCHGEAR BY: HIGHEST OPERATING VOLTAGE ; SWITCH FUNCTION - Other [Asset Replacements - excluding faults] Table 2.2.2 - SELECTED ASSET CHARACTERISTICS TOTAL POLES BY: FEEDER TYPE - Total CBD poles [Asset Replacements - excluding faults (0's)] TOTAL POLES BY: FEEDER TYPE - Total urban poles [Asset Replacements - excluding faults (0's)] TOTAL POLES BY: FEEDER TYPE - Total rural long poles [Asset Replacements - excluding faults (0's)] TOTAL POLES BY: FEEDER TYPE - Total rural short poles [Asset Replacements - excluding faults (0's)]
CACP2.2BOP21 2.2 Repex TABLE 2.2.1 - REPLACEMENT EXPENDITURE, Estimated SAP 2.2.1 Expenditure is captured at project level, a project N/A The physical and financial data for Poles,

Citipower – Basis of Preparation – CA 37
VOLUMES AND ASSET FAILURES BY ASSET CATEGORY POLES BY: HIGHEST OPERATING VOLTAGE ; MATERIAL TYPE; STAKING (IF WOOD) - Staking of a wooden pole [Expenditure - excluding faults] POLES BY: HIGHEST OPERATING VOLTAGE ; MATERIAL TYPE; STAKING (IF WOOD) - < = 1 kV; Wood [Expenditure - excluding faults] POLES BY: HIGHEST OPERATING VOLTAGE ; MATERIAL TYPE; STAKING (IF WOOD) - > 1 kV & < = 11 kV; Wood [Expenditure - excluding faults] POLES BY: HIGHEST OPERATING VOLTAGE ; MATERIAL TYPE; STAKING (IF WOOD) - > 11 kV & < = 22 kV; Wood [Expenditure - excluding faults] POLES BY: HIGHEST OPERATING VOLTAGE ; MATERIAL TYPE; STAKING (IF WOOD) - > 22 kV & < = 66 kV; Wood [Expenditure - excluding faults] POLES BY: HIGHEST OPERATING VOLTAGE ; MATERIAL TYPE; STAKING (IF WOOD) - > 66 kV & < = 132 kV; Wood [Expenditure - excluding faults] POLES BY: HIGHEST OPERATING VOLTAGE ; MATERIAL TYPE; STAKING (IF WOOD) - > 132 kV; Wood [Expenditure - excluding faults] POLES BY: HIGHEST OPERATING VOLTAGE ; MATERIAL TYPE; STAKING (IF WOOD) - < = 1 kV; Concrete [Expenditure - excluding faults] POLES BY: HIGHEST OPERATING VOLTAGE ; MATERIAL TYPE; STAKING (IF WOOD) - > 1 kV & < = 11 kV; Concrete [Expenditure - excluding faults] POLES BY: HIGHEST OPERATING VOLTAGE ; MATERIAL TYPE; STAKING (IF WOOD) - > 11 kV & < = 22 kV; Concrete [Expenditure - excluding faults] POLES BY: HIGHEST OPERATING VOLTAGE ; MATERIAL TYPE; STAKING (IF WOOD) - > 22 kV & < = 66 kV; Concrete [Expenditure - excluding faults] POLES BY: HIGHEST OPERATING VOLTAGE ; MATERIAL TYPE; STAKING (IF WOOD) - > 66 kV & < = 132 kV; Concrete [Expenditure - excluding faults] POLES BY: HIGHEST OPERATING VOLTAGE ; MATERIAL TYPE; STAKING (IF WOOD) - > 132 kV; Concrete [Expenditure - excluding faults] POLES BY: HIGHEST OPERATING VOLTAGE ; MATERIAL TYPE; STAKING (IF WOOD) - < = 1 kV; Steel [Expenditure - excluding faults] POLES BY: HIGHEST OPERATING VOLTAGE ; MATERIAL TYPE; STAKING (IF WOOD) - > 1 kV & < = 11 kV; Steel [Expenditure - excluding faults] POLES BY: HIGHEST OPERATING VOLTAGE ; MATERIAL TYPE; STAKING (IF WOOD) - > 11 kV & < = 22 kV; Steel [Expenditure - excluding faults] POLES BY: HIGHEST OPERATING VOLTAGE ; MATERIAL TYPE; STAKING (IF WOOD) - > 22 kV & < = 66 kV; Steel [Expenditure - excluding faults] POLES BY: HIGHEST OPERATING VOLTAGE ; MATERIAL TYPE; STAKING (IF WOOD) - > 66 kV
Costs for pole staking, pole replacement, pole top replacement, distribution protection equipment replacement (HV fuses and surge arresters) and service replacement are all estimated. These values are estimated because expenditure is captured at project level, a project may contain 1 item or a mix of different items, and therefore it is not possible to report accurately on the cost of individual items.
may contain 1 item or a mix of different items, and therefore it is not possible to report accurately on the cost of individual items. Bottom up site estimates and actual overall expenditure were used to derive sub-category expenditure for Poles (excluding staking) and Pole Top Structures respectively. Based on the estimators experience the following assumptions were applied: - Bottom up estimate contains site based direct costs only, materials, labour and contract costs. - These rates include an estimated design time allowance but do not include for any project management time. All design costs assumed to be internal design resources. There is no allowance for travel time, risk, or overheads. - All prices are for replacement tasks, using SAP technical standards and standard labour data, where possible live line rates have been used. Estimated Expenditure: (Poles) Based on the estimators experience the following assumptions were applied: - Poles are replaced like for like in same location, - 70% of new poles would be Wood, the remaining 30% Concrete, - 70% of the new structures would be inter/angles, the remaining 30% strain/termination structures, - 20% of pole replacements would require stay wire replacement - There is no allowance for any rock excavation. - Assumed that Steel Pole (<=1 KV)'s unit cost is the same as the unit cost for Wood Pole (<=1 KV). - The AG Pole unit cost has been assumed to be Single-Wire Earth Return (SWER). - Estimated Expenditure: (Pole Top Structures) Based on the estimators experience the following assumptions were applied: - 1 in 10 LV pole top structure replacements include fuse/isolator replacement, - 1 in 15 HV pole top structure replacements include a switch replacement. - Single circuit for all voltages of pole top structure replacement, - 1 in 100 66kV pole top structure replacements include an isolator replacement.
Pole Top Structures, Overhead Conductors, and Service Lines have been provided in the requested categories. A sub-category was created under switchgear called 'Distribution Fuse / Surge Diverter units' as this expenditure did not fit within the existing sub-categories. Age profile data has been provided in table 5.2 for this new sub-category. Table 2.2.2 Asset replacement volumes by feeder category do not equal those in table 2.2.1 as feeder categories do not include sub-transmission assets. By the definitions provided to assign feeder categories for assets on distribution feeders, sub-transmission assets do not meet these criteria and are therefore not able to be classified as CBD & Urban. In 2017 CP commenced capitalising pole inspection costs against pole replacement and staking activities resulting in pole inspection in 2.8 reducing to 0 cost and an increase in cost for 2.2 for pole staking and replacement.

Citipower – Basis of Preparation – CA 38
& < = 132 kV; Steel [Expenditure - excluding faults] POLES BY: HIGHEST OPERATING VOLTAGE ; MATERIAL TYPE; STAKING (IF WOOD) - > 132 kV; Steel [Expenditure - excluding faults] POLES BY: HIGHEST OPERATING VOLTAGE ; MATERIAL TYPE; STAKING (IF WOOD) - Other [Expenditure - excluding faults] POLE TOP STRUCTURES BY: HIGHEST OPERATING VOLTAGE - < = 1 kV [Expenditure - excluding faults] POLE TOP STRUCTURES BY: HIGHEST OPERATING VOLTAGE - > 1 kV & < = 11 kV [Expenditure - excluding faults] POLE TOP STRUCTURES BY: HIGHEST OPERATING VOLTAGE - > 11 kV & < = 22 kV [Expenditure - excluding faults] POLE TOP STRUCTURES BY: HIGHEST OPERATING VOLTAGE - > 22 kV & < = 66 kV [Expenditure - excluding faults] POLE TOP STRUCTURES BY: HIGHEST OPERATING VOLTAGE - > 66 kV & < = 132 kV [Expenditure - excluding faults] POLE TOP STRUCTURES BY: HIGHEST OPERATING VOLTAGE - > 132 kV [Expenditure - excluding faults] POLE TOP STRUCTURES BY: HIGHEST OPERATING VOLTAGE - Other [Expenditure - excluding faults] SERVICE LINES BY: CONNECTION VOLTAGE; CUSTOMER TYPE; CONNECTION COMPLEXITY - < = 11 kV ; Residential ; Simple Type [Expenditure - excluding faults] SERVICE LINES BY: CONNECTION VOLTAGE; CUSTOMER TYPE; CONNECTION COMPLEXITY - < = 11 kV ; Commercial & Industrial ; Simple Type [Expenditure - excluding faults] SERVICE LINES BY: CONNECTION VOLTAGE; CUSTOMER TYPE; CONNECTION COMPLEXITY - < = 11 kV ; Residential ; Complex Type [Expenditure - excluding faults] SERVICE LINES BY: CONNECTION VOLTAGE; CUSTOMER TYPE; CONNECTION COMPLEXITY - < = 11 kV ; Commercial & Industrial ; Complex Type [Expenditure - excluding faults] SERVICE LINES BY: CONNECTION VOLTAGE; CUSTOMER TYPE; CONNECTION COMPLEXITY - < = 11 kV ; Subdivision ; Complex Type [Expenditure - excluding faults] SERVICE LINES BY: CONNECTION VOLTAGE; CUSTOMER TYPE; CONNECTION COMPLEXITY - > 11 kV & < = 22 kV ; Commercial & Industrial ; [Expenditure - excluding faults] SERVICE LINES BY: CONNECTION VOLTAGE; CUSTOMER TYPE; CONNECTION COMPLEXITY - > 11 kV & < = 22 kV ; Subdivision ; [Expenditure - excluding faults] SERVICE LINES BY: CONNECTION VOLTAGE; CUSTOMER TYPE; CONNECTION COMPLEXITY - > 22 kV & < = 33 kV ; Commercial & Industrial ; [Expenditure - excluding faults] SERVICE LINES BY: CONNECTION VOLTAGE; CUSTOMER TYPE; CONNECTION COMPLEXITY - > 22 kV & < = 33 kV ; Subdivision ; [Expenditure - excluding faults] SERVICE LINES BY: CONNECTION VOLTAGE; CUSTOMER TYPE; CONNECTION COMPLEXITY -
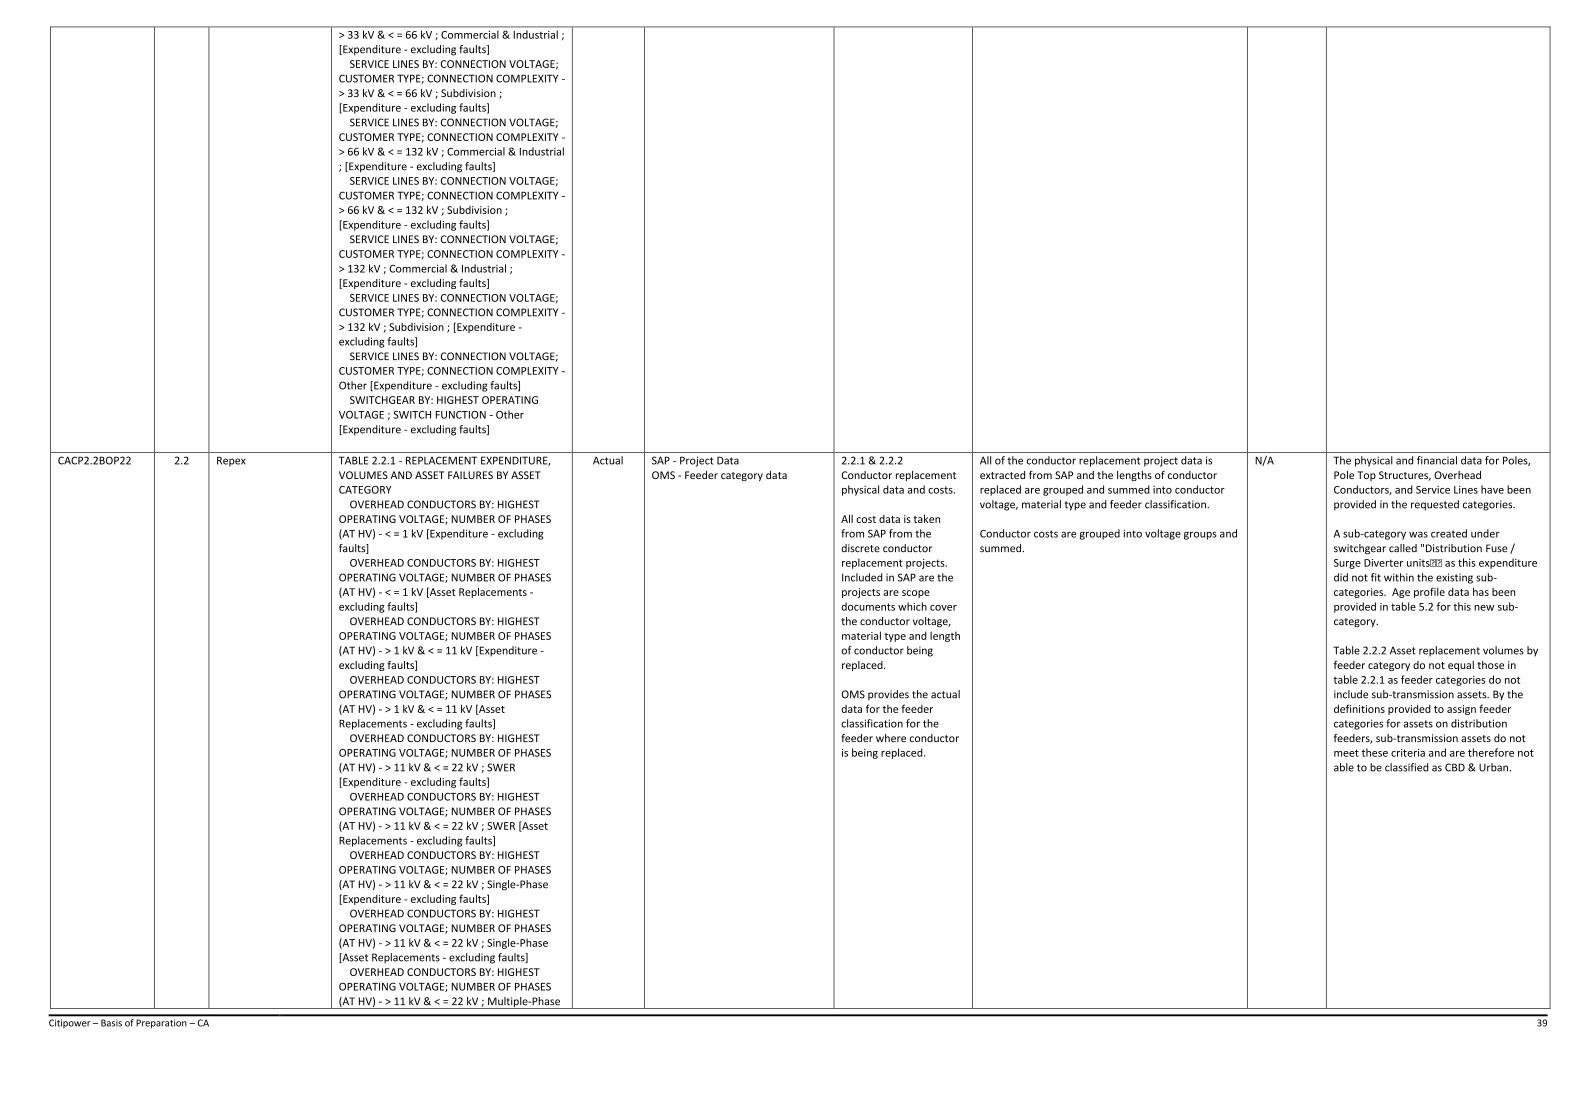
Citipower – Basis of Preparation – CA 39
> 33 kV & < = 66 kV ; Commercial & Industrial ; [Expenditure - excluding faults] SERVICE LINES BY: CONNECTION VOLTAGE; CUSTOMER TYPE; CONNECTION COMPLEXITY - > 33 kV & < = 66 kV ; Subdivision ; [Expenditure - excluding faults] SERVICE LINES BY: CONNECTION VOLTAGE; CUSTOMER TYPE; CONNECTION COMPLEXITY - > 66 kV & < = 132 kV ; Commercial & Industrial ; [Expenditure - excluding faults] SERVICE LINES BY: CONNECTION VOLTAGE; CUSTOMER TYPE; CONNECTION COMPLEXITY - > 66 kV & < = 132 kV ; Subdivision ; [Expenditure - excluding faults] SERVICE LINES BY: CONNECTION VOLTAGE; CUSTOMER TYPE; CONNECTION COMPLEXITY - > 132 kV ; Commercial & Industrial ; [Expenditure - excluding faults] SERVICE LINES BY: CONNECTION VOLTAGE; CUSTOMER TYPE; CONNECTION COMPLEXITY - > 132 kV ; Subdivision ; [Expenditure - excluding faults] SERVICE LINES BY: CONNECTION VOLTAGE; CUSTOMER TYPE; CONNECTION COMPLEXITY - Other [Expenditure - excluding faults] SWITCHGEAR BY: HIGHEST OPERATING VOLTAGE ; SWITCH FUNCTION - Other [Expenditure - excluding faults]
CACP2.2BOP22 2.2 Repex TABLE 2.2.1 - REPLACEMENT EXPENDITURE, VOLUMES AND ASSET FAILURES BY ASSET CATEGORY OVERHEAD CONDUCTORS BY: HIGHEST OPERATING VOLTAGE; NUMBER OF PHASES (AT HV) - < = 1 kV [Expenditure - excluding faults] OVERHEAD CONDUCTORS BY: HIGHEST OPERATING VOLTAGE; NUMBER OF PHASES (AT HV) - < = 1 kV [Asset Replacements - excluding faults] OVERHEAD CONDUCTORS BY: HIGHEST OPERATING VOLTAGE; NUMBER OF PHASES (AT HV) - > 1 kV & < = 11 kV [Expenditure - excluding faults] OVERHEAD CONDUCTORS BY: HIGHEST OPERATING VOLTAGE; NUMBER OF PHASES (AT HV) - > 1 kV & < = 11 kV [Asset Replacements - excluding faults] OVERHEAD CONDUCTORS BY: HIGHEST OPERATING VOLTAGE; NUMBER OF PHASES (AT HV) - > 11 kV & < = 22 kV ; SWER [Expenditure - excluding faults] OVERHEAD CONDUCTORS BY: HIGHEST OPERATING VOLTAGE; NUMBER OF PHASES (AT HV) - > 11 kV & < = 22 kV ; SWER [Asset Replacements - excluding faults] OVERHEAD CONDUCTORS BY: HIGHEST OPERATING VOLTAGE; NUMBER OF PHASES (AT HV) - > 11 kV & < = 22 kV ; Single-Phase [Expenditure - excluding faults] OVERHEAD CONDUCTORS BY: HIGHEST OPERATING VOLTAGE; NUMBER OF PHASES (AT HV) - > 11 kV & < = 22 kV ; Single-Phase [Asset Replacements - excluding faults] OVERHEAD CONDUCTORS BY: HIGHEST OPERATING VOLTAGE; NUMBER OF PHASES (AT HV) - > 11 kV & < = 22 kV ; Multiple-Phase
Actual SAP - Project Data OMS - Feeder category data
2.2.1 & 2.2.2 Conductor replacement physical data and costs. All cost data is taken from SAP from the discrete conductor replacement projects. Included in SAP are the projects are scope documents which cover the conductor voltage, material type and length of conductor being replaced. OMS provides the actual data for the feeder classification for the feeder where conductor is being replaced.
All of the conductor replacement project data is extracted from SAP and the lengths of conductor replaced are grouped and summed into conductor voltage, material type and feeder classification. Conductor costs are grouped into voltage groups and summed.
N/A The physical and financial data for Poles, Pole Top Structures, Overhead Conductors, and Service Lines have been provided in the requested categories. A sub-category was created under switchgear called "Distribution Fuse / Surge Diverter unitsۥ as this expenditure did not fit within the existing sub-categories. Age profile data has been provided in table 5.2 for this new sub-category. Table 2.2.2 Asset replacement volumes by feeder category do not equal those in table 2.2.1 as feeder categories do not include sub-transmission assets. By the definitions provided to assign feeder categories for assets on distribution feeders, sub-transmission assets do not meet these criteria and are therefore not able to be classified as CBD & Urban.

Citipower – Basis of Preparation – CA 40
[Expenditure - excluding faults] OVERHEAD CONDUCTORS BY: HIGHEST OPERATING VOLTAGE; NUMBER OF PHASES (AT HV) - > 11 kV & < = 22 kV ; Multiple-Phase [Asset Replacements - excluding faults] OVERHEAD CONDUCTORS BY: HIGHEST OPERATING VOLTAGE; NUMBER OF PHASES (AT HV) - > 22 kV & < = 66 kV [Expenditure - excluding faults] OVERHEAD CONDUCTORS BY: HIGHEST OPERATING VOLTAGE; NUMBER OF PHASES (AT HV) - > 22 kV & < = 66 kV [Asset Replacements - excluding faults] OVERHEAD CONDUCTORS BY: HIGHEST OPERATING VOLTAGE; NUMBER OF PHASES (AT HV) - > 66 kV & < = 132 kV [Expenditure - excluding faults] OVERHEAD CONDUCTORS BY: HIGHEST OPERATING VOLTAGE; NUMBER OF PHASES (AT HV) - > 66 kV & < = 132 kV [Asset Replacements - excluding faults] OVERHEAD CONDUCTORS BY: HIGHEST OPERATING VOLTAGE; NUMBER OF PHASES (AT HV) - > 132 kV [Expenditure - excluding faults] OVERHEAD CONDUCTORS BY: HIGHEST OPERATING VOLTAGE; NUMBER OF PHASES (AT HV) - > 132 kV [Asset Replacements - excluding faults] OVERHEAD CONDUCTORS BY: HIGHEST OPERATING VOLTAGE; NUMBER OF PHASES (AT HV) - Other [Expenditure - excluding faults] OVERHEAD CONDUCTORS BY: HIGHEST OPERATING VOLTAGE; NUMBER OF PHASES (AT HV) - Other [Asset Replacements - excluding faults] Table 2.2.2 - SELECTED ASSET CHARACTERISTICS OVERHEAD CONDUCTORS BY:CONDUCTOR LENGTH BY FEEDER TYPE - Conductors CBD (km) [Asset Replacements - excluding faults (0's)] OVERHEAD CONDUCTORS BY:CONDUCTOR LENGTH BY FEEDER TYPE - Conductors urban (km) [Asset Replacements - excluding faults (0's)] OVERHEAD CONDUCTORS BY:CONDUCTOR LENGTH BY FEEDER TYPE - Conductors rural long (km) [Asset Replacements - excluding faults (0's)] OVERHEAD CONDUCTORS BY:CONDUCTOR LENGTH BY FEEDER TYPE - Conductors rural short (km) [Asset Replacements - excluding faults (0's)] OVERHEAD CONDUCTORS BY: CONDUCTOR LENGTH MATERIAL TYPE - OH conductor LV ABC [Asset Replacements - excluding faults (0's)] OVERHEAD CONDUCTORS BY: CONDUCTOR LENGTH MATERIAL TYPE - OH conductor steel [Asset Replacements - excluding faults (0's)] OVERHEAD CONDUCTORS BY: CONDUCTOR LENGTH MATERIAL TYPE - OH conductor ACSR [Asset Replacements - excluding faults (0's)] OVERHEAD CONDUCTORS BY: CONDUCTOR
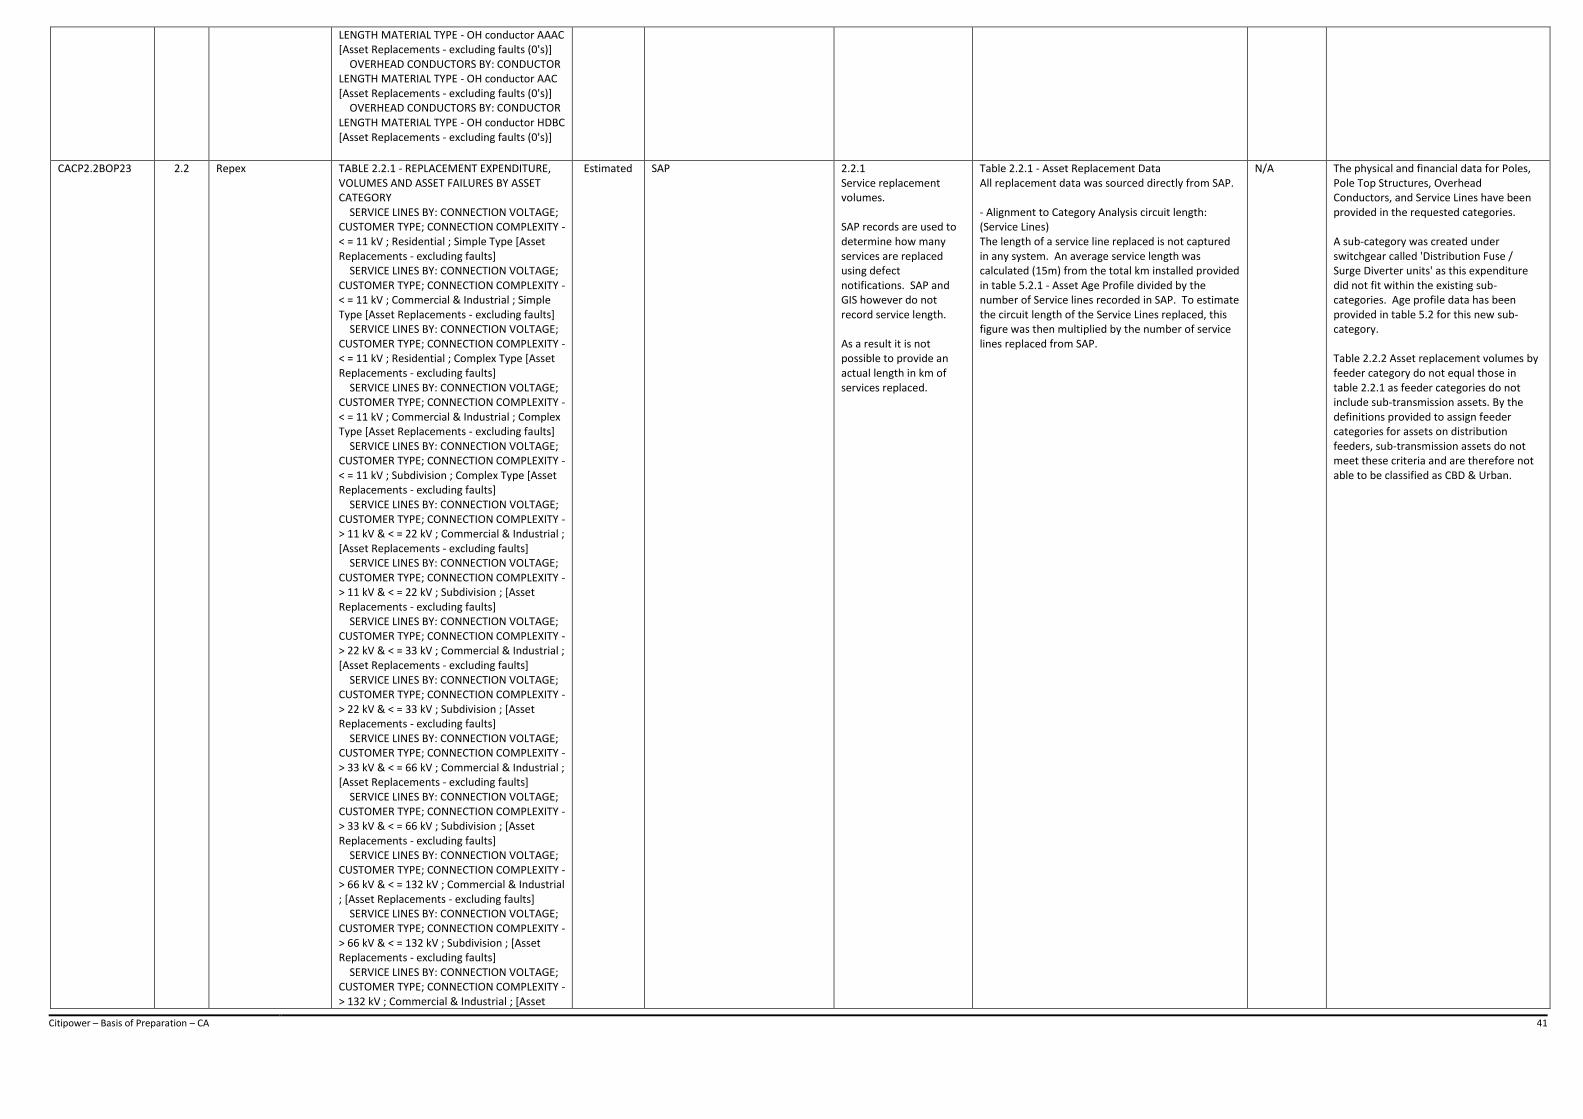
Citipower – Basis of Preparation – CA 41
LENGTH MATERIAL TYPE - OH conductor AAAC [Asset Replacements - excluding faults (0's)] OVERHEAD CONDUCTORS BY: CONDUCTOR LENGTH MATERIAL TYPE - OH conductor AAC [Asset Replacements - excluding faults (0's)] OVERHEAD CONDUCTORS BY: CONDUCTOR LENGTH MATERIAL TYPE - OH conductor HDBC [Asset Replacements - excluding faults (0's)]
CACP2.2BOP23 2.2 Repex TABLE 2.2.1 - REPLACEMENT EXPENDITURE, VOLUMES AND ASSET FAILURES BY ASSET CATEGORY SERVICE LINES BY: CONNECTION VOLTAGE; CUSTOMER TYPE; CONNECTION COMPLEXITY - < = 11 kV ; Residential ; Simple Type [Asset Replacements - excluding faults] SERVICE LINES BY: CONNECTION VOLTAGE; CUSTOMER TYPE; CONNECTION COMPLEXITY - < = 11 kV ; Commercial & Industrial ; Simple Type [Asset Replacements - excluding faults] SERVICE LINES BY: CONNECTION VOLTAGE; CUSTOMER TYPE; CONNECTION COMPLEXITY - < = 11 kV ; Residential ; Complex Type [Asset Replacements - excluding faults] SERVICE LINES BY: CONNECTION VOLTAGE; CUSTOMER TYPE; CONNECTION COMPLEXITY - < = 11 kV ; Commercial & Industrial ; Complex Type [Asset Replacements - excluding faults] SERVICE LINES BY: CONNECTION VOLTAGE; CUSTOMER TYPE; CONNECTION COMPLEXITY - < = 11 kV ; Subdivision ; Complex Type [Asset Replacements - excluding faults] SERVICE LINES BY: CONNECTION VOLTAGE; CUSTOMER TYPE; CONNECTION COMPLEXITY - > 11 kV & < = 22 kV ; Commercial & Industrial ; [Asset Replacements - excluding faults] SERVICE LINES BY: CONNECTION VOLTAGE; CUSTOMER TYPE; CONNECTION COMPLEXITY - > 11 kV & < = 22 kV ; Subdivision ; [Asset Replacements - excluding faults] SERVICE LINES BY: CONNECTION VOLTAGE; CUSTOMER TYPE; CONNECTION COMPLEXITY - > 22 kV & < = 33 kV ; Commercial & Industrial ; [Asset Replacements - excluding faults] SERVICE LINES BY: CONNECTION VOLTAGE; CUSTOMER TYPE; CONNECTION COMPLEXITY - > 22 kV & < = 33 kV ; Subdivision ; [Asset Replacements - excluding faults] SERVICE LINES BY: CONNECTION VOLTAGE; CUSTOMER TYPE; CONNECTION COMPLEXITY - > 33 kV & < = 66 kV ; Commercial & Industrial ; [Asset Replacements - excluding faults] SERVICE LINES BY: CONNECTION VOLTAGE; CUSTOMER TYPE; CONNECTION COMPLEXITY - > 33 kV & < = 66 kV ; Subdivision ; [Asset Replacements - excluding faults] SERVICE LINES BY: CONNECTION VOLTAGE; CUSTOMER TYPE; CONNECTION COMPLEXITY - > 66 kV & < = 132 kV ; Commercial & Industrial ; [Asset Replacements - excluding faults] SERVICE LINES BY: CONNECTION VOLTAGE; CUSTOMER TYPE; CONNECTION COMPLEXITY - > 66 kV & < = 132 kV ; Subdivision ; [Asset Replacements - excluding faults] SERVICE LINES BY: CONNECTION VOLTAGE; CUSTOMER TYPE; CONNECTION COMPLEXITY - > 132 kV ; Commercial & Industrial ; [Asset
Estimated SAP 2.2.1 Service replacement volumes. SAP records are used to determine how many services are replaced using defect notifications. SAP and GIS however do not record service length. As a result it is not possible to provide an actual length in km of services replaced.
Table 2.2.1 - Asset Replacement Data All replacement data was sourced directly from SAP. - Alignment to Category Analysis circuit length: (Service Lines) The length of a service line replaced is not captured in any system. An average service length was calculated (15m) from the total km installed provided in table 5.2.1 - Asset Age Profile divided by the number of Service lines recorded in SAP. To estimate the circuit length of the Service Lines replaced, this figure was then multiplied by the number of service lines replaced from SAP.
N/A The physical and financial data for Poles, Pole Top Structures, Overhead Conductors, and Service Lines have been provided in the requested categories. A sub-category was created under switchgear called 'Distribution Fuse / Surge Diverter units' as this expenditure did not fit within the existing sub-categories. Age profile data has been provided in table 5.2 for this new sub-category. Table 2.2.2 Asset replacement volumes by feeder category do not equal those in table 2.2.1 as feeder categories do not include sub-transmission assets. By the definitions provided to assign feeder categories for assets on distribution feeders, sub-transmission assets do not meet these criteria and are therefore not able to be classified as CBD & Urban.
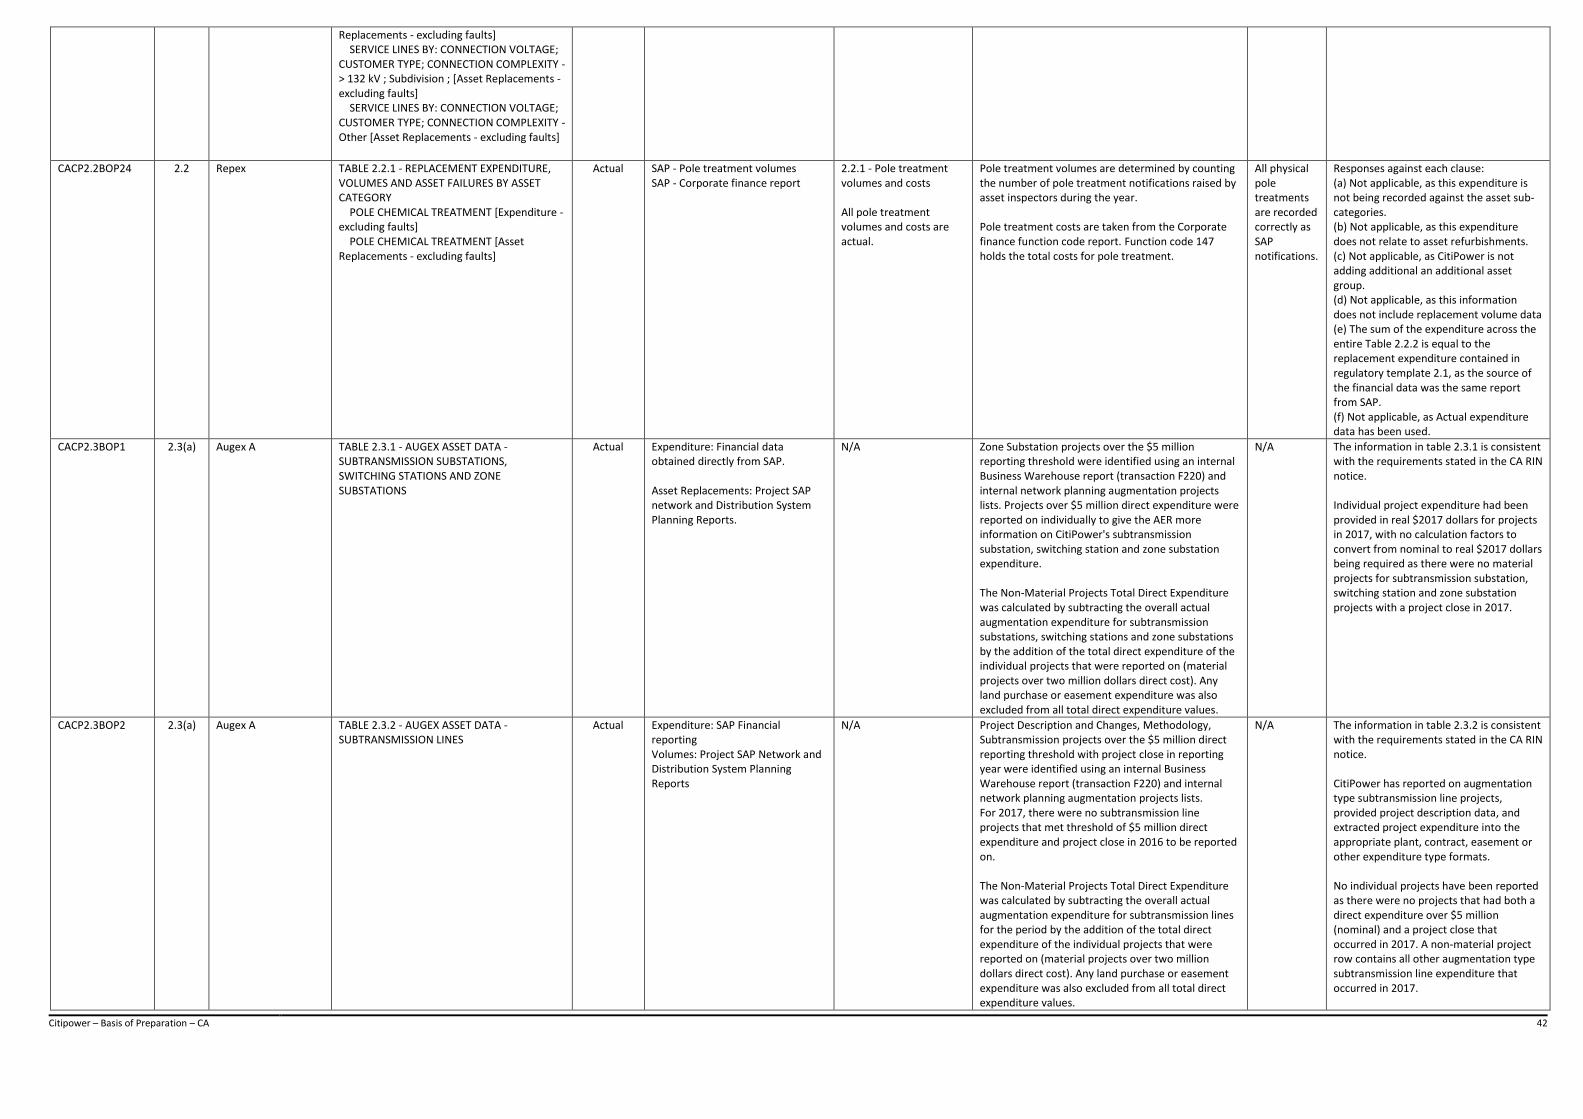
Citipower – Basis of Preparation – CA 42
Replacements - excluding faults] SERVICE LINES BY: CONNECTION VOLTAGE; CUSTOMER TYPE; CONNECTION COMPLEXITY - > 132 kV ; Subdivision ; [Asset Replacements - excluding faults] SERVICE LINES BY: CONNECTION VOLTAGE; CUSTOMER TYPE; CONNECTION COMPLEXITY - Other [Asset Replacements - excluding faults]
CACP2.2BOP24 2.2 Repex TABLE 2.2.1 - REPLACEMENT EXPENDITURE, VOLUMES AND ASSET FAILURES BY ASSET CATEGORY POLE CHEMICAL TREATMENT [Expenditure - excluding faults] POLE CHEMICAL TREATMENT [Asset Replacements - excluding faults]
Actual SAP - Pole treatment volumes SAP - Corporate finance report
2.2.1 - Pole treatment volumes and costs All pole treatment volumes and costs are actual.
Pole treatment volumes are determined by counting the number of pole treatment notifications raised by asset inspectors during the year. Pole treatment costs are taken from the Corporate finance function code report. Function code 147 holds the total costs for pole treatment.
All physical pole treatments are recorded correctly as SAP notifications.
Responses against each clause: (a) Not applicable, as this expenditure is not being recorded against the asset sub-categories. (b) Not applicable, as this expenditure does not relate to asset refurbishments. (c) Not applicable, as CitiPower is not adding additional an additional asset group. (d) Not applicable, as this information does not include replacement volume data (e) The sum of the expenditure across the entire Table 2.2.2 is equal to the replacement expenditure contained in regulatory template 2.1, as the source of the financial data was the same report from SAP. (f) Not applicable, as Actual expenditure data has been used.
CACP2.3BOP1 2.3(a) Augex A TABLE 2.3.1 - AUGEX ASSET DATA - SUBTRANSMISSION SUBSTATIONS, SWITCHING STATIONS AND ZONE SUBSTATIONS
Actual Expenditure: Financial data obtained directly from SAP. Asset Replacements: Project SAP network and Distribution System Planning Reports.
N/A Zone Substation projects over the $5 million reporting threshold were identified using an internal Business Warehouse report (transaction F220) and internal network planning augmentation projects lists. Projects over $5 million direct expenditure were reported on individually to give the AER more information on CitiPower's subtransmission substation, switching station and zone substation expenditure. The Non-Material Projects Total Direct Expenditure was calculated by subtracting the overall actual augmentation expenditure for subtransmission substations, switching stations and zone substations by the addition of the total direct expenditure of the individual projects that were reported on (material projects over two million dollars direct cost). Any land purchase or easement expenditure was also excluded from all total direct expenditure values.
N/A The information in table 2.3.1 is consistent with the requirements stated in the CA RIN notice. Individual project expenditure had been provided in real $2017 dollars for projects in 2017, with no calculation factors to convert from nominal to real $2017 dollars being required as there were no material projects for subtransmission substation, switching station and zone substation projects with a project close in 2017.
CACP2.3BOP2 2.3(a) Augex A TABLE 2.3.2 - AUGEX ASSET DATA - SUBTRANSMISSION LINES
Actual Expenditure: SAP Financial reporting Volumes: Project SAP Network and Distribution System Planning Reports
N/A Project Description and Changes, Methodology, Subtransmission projects over the $5 million direct reporting threshold with project close in reporting year were identified using an internal Business Warehouse report (transaction F220) and internal network planning augmentation projects lists. For 2017, there were no subtransmission line projects that met threshold of $5 million direct expenditure and project close in 2016 to be reported on. The Non-Material Projects Total Direct Expenditure was calculated by subtracting the overall actual augmentation expenditure for subtransmission lines for the period by the addition of the total direct expenditure of the individual projects that were reported on (material projects over two million dollars direct cost). Any land purchase or easement expenditure was also excluded from all total direct expenditure values.
N/A The information in table 2.3.2 is consistent with the requirements stated in the CA RIN notice. CitiPower has reported on augmentation type subtransmission line projects, provided project description data, and extracted project expenditure into the appropriate plant, contract, easement or other expenditure type formats. No individual projects have been reported as there were no projects that had both a direct expenditure over $5 million (nominal) and a project close that occurred in 2017. A non-material project row contains all other augmentation type subtransmission line expenditure that occurred in 2017.
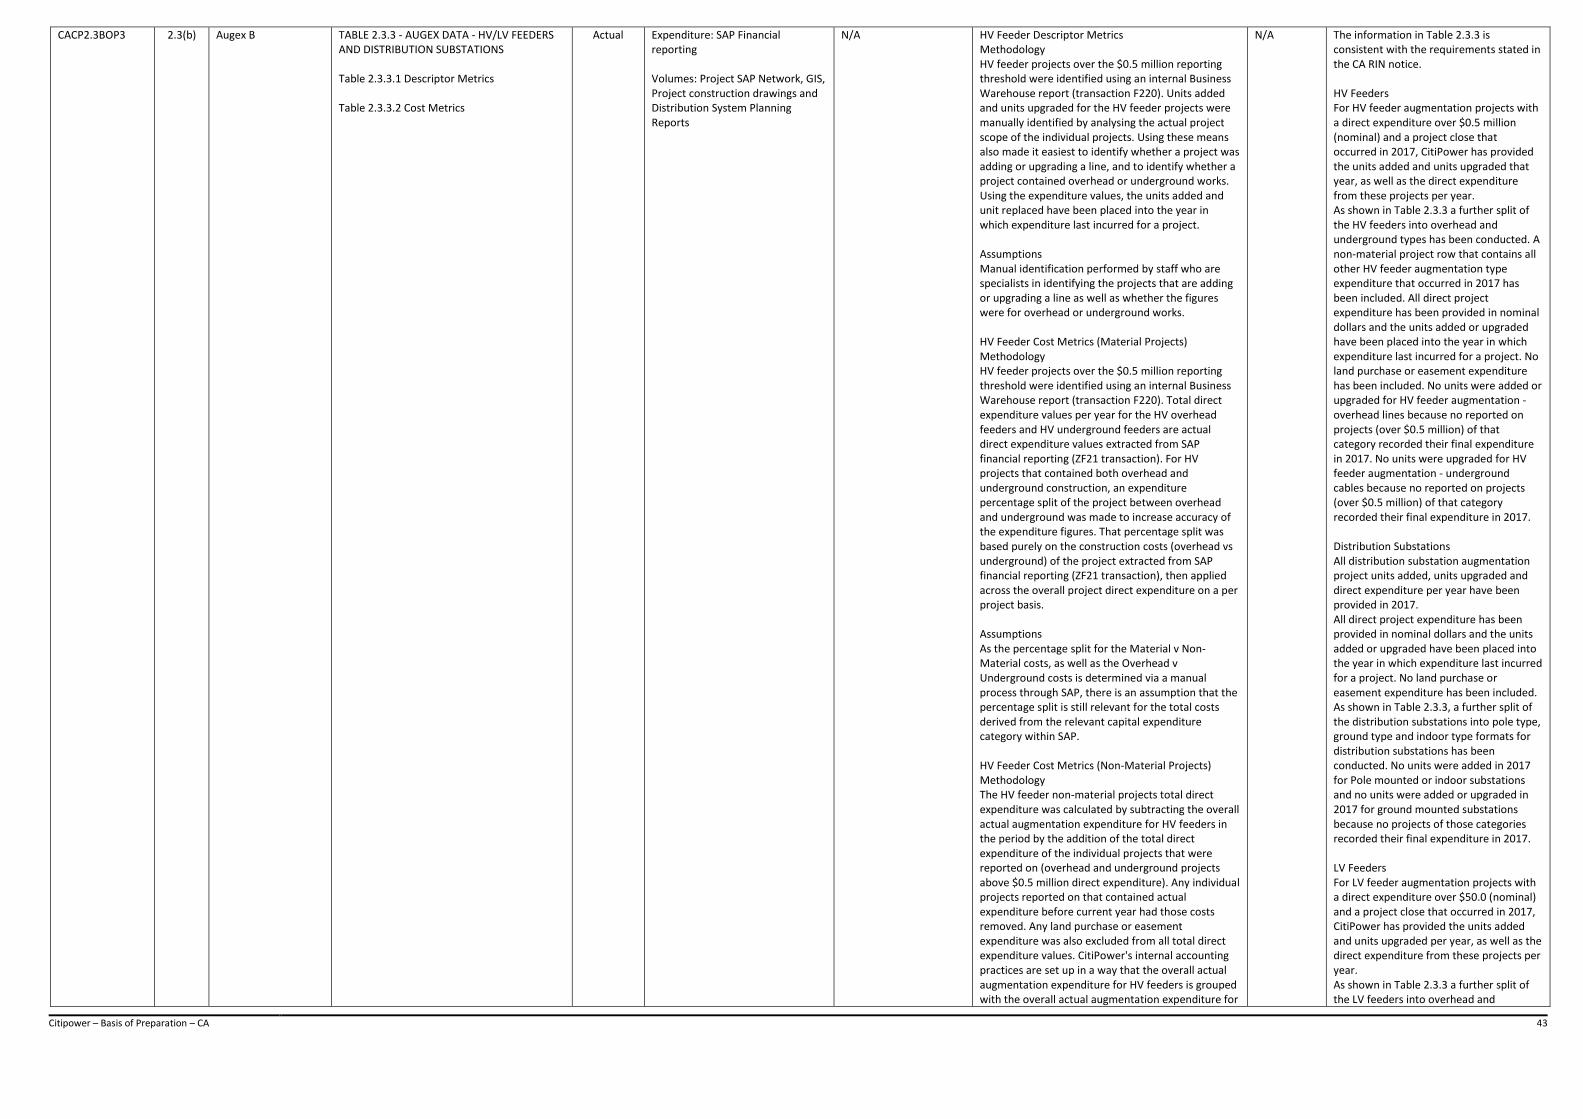
Citipower – Basis of Preparation – CA 43
CACP2.3BOP3 2.3(b) Augex B TABLE 2.3.3 - AUGEX DATA - HV/LV FEEDERS AND DISTRIBUTION SUBSTATIONS Table 2.3.3.1 Descriptor Metrics Table 2.3.3.2 Cost Metrics
Actual Expenditure: SAP Financial reporting Volumes: Project SAP Network, GIS, Project construction drawings and Distribution System Planning Reports
N/A HV Feeder Descriptor Metrics Methodology HV feeder projects over the $0.5 million reporting threshold were identified using an internal Business Warehouse report (transaction F220). Units added and units upgraded for the HV feeder projects were manually identified by analysing the actual project scope of the individual projects. Using these means also made it easiest to identify whether a project was adding or upgrading a line, and to identify whether a project contained overhead or underground works. Using the expenditure values, the units added and unit replaced have been placed into the year in which expenditure last incurred for a project. Assumptions Manual identification performed by staff who are specialists in identifying the projects that are adding or upgrading a line as well as whether the figures were for overhead or underground works. HV Feeder Cost Metrics (Material Projects) Methodology HV feeder projects over the $0.5 million reporting threshold were identified using an internal Business Warehouse report (transaction F220). Total direct expenditure values per year for the HV overhead feeders and HV underground feeders are actual direct expenditure values extracted from SAP financial reporting (ZF21 transaction). For HV projects that contained both overhead and underground construction, an expenditure percentage split of the project between overhead and underground was made to increase accuracy of the expenditure figures. That percentage split was based purely on the construction costs (overhead vs underground) of the project extracted from SAP financial reporting (ZF21 transaction), then applied across the overall project direct expenditure on a per project basis. Assumptions As the percentage split for the Material v Non-Material costs, as well as the Overhead v Underground costs is determined via a manual process through SAP, there is an assumption that the percentage split is still relevant for the total costs derived from the relevant capital expenditure category within SAP. HV Feeder Cost Metrics (Non-Material Projects) Methodology The HV feeder non-material projects total direct expenditure was calculated by subtracting the overall actual augmentation expenditure for HV feeders in the period by the addition of the total direct expenditure of the individual projects that were reported on (overhead and underground projects above $0.5 million direct expenditure). Any individual projects reported on that contained actual expenditure before current year had those costs removed. Any land purchase or easement expenditure was also excluded from all total direct expenditure values. CitiPower's internal accounting practices are set up in a way that the overall actual augmentation expenditure for HV feeders is grouped with the overall actual augmentation expenditure for
N/A The information in Table 2.3.3 is consistent with the requirements stated in the CA RIN notice. HV Feeders For HV feeder augmentation projects with a direct expenditure over $0.5 million (nominal) and a project close that occurred in 2017, CitiPower has provided the units added and units upgraded that year, as well as the direct expenditure from these projects per year. As shown in Table 2.3.3 a further split of the HV feeders into overhead and underground types has been conducted. A non-material project row that contains all other HV feeder augmentation type expenditure that occurred in 2017 has been included. All direct project expenditure has been provided in nominal dollars and the units added or upgraded have been placed into the year in which expenditure last incurred for a project. No land purchase or easement expenditure has been included. No units were added or upgraded for HV feeder augmentation - overhead lines because no reported on projects (over $0.5 million) of that category recorded their final expenditure in 2017. No units were upgraded for HV feeder augmentation - underground cables because no reported on projects (over $0.5 million) of that category recorded their final expenditure in 2017. Distribution Substations All distribution substation augmentation project units added, units upgraded and direct expenditure per year have been provided in 2017. All direct project expenditure has been provided in nominal dollars and the units added or upgraded have been placed into the year in which expenditure last incurred for a project. No land purchase or easement expenditure has been included. As shown in Table 2.3.3, a further split of the distribution substations into pole type, ground type and indoor type formats for distribution substations has been conducted. No units were added in 2017 for Pole mounted or indoor substations and no units were added or upgraded in 2017 for ground mounted substations because no projects of those categories recorded their final expenditure in 2017. LV Feeders For LV feeder augmentation projects with a direct expenditure over $50.0 (nominal) and a project close that occurred in 2017, CitiPower has provided the units added and units upgraded per year, as well as the direct expenditure from these projects per year. As shown in Table 2.3.3 a further split of the LV feeders into overhead and
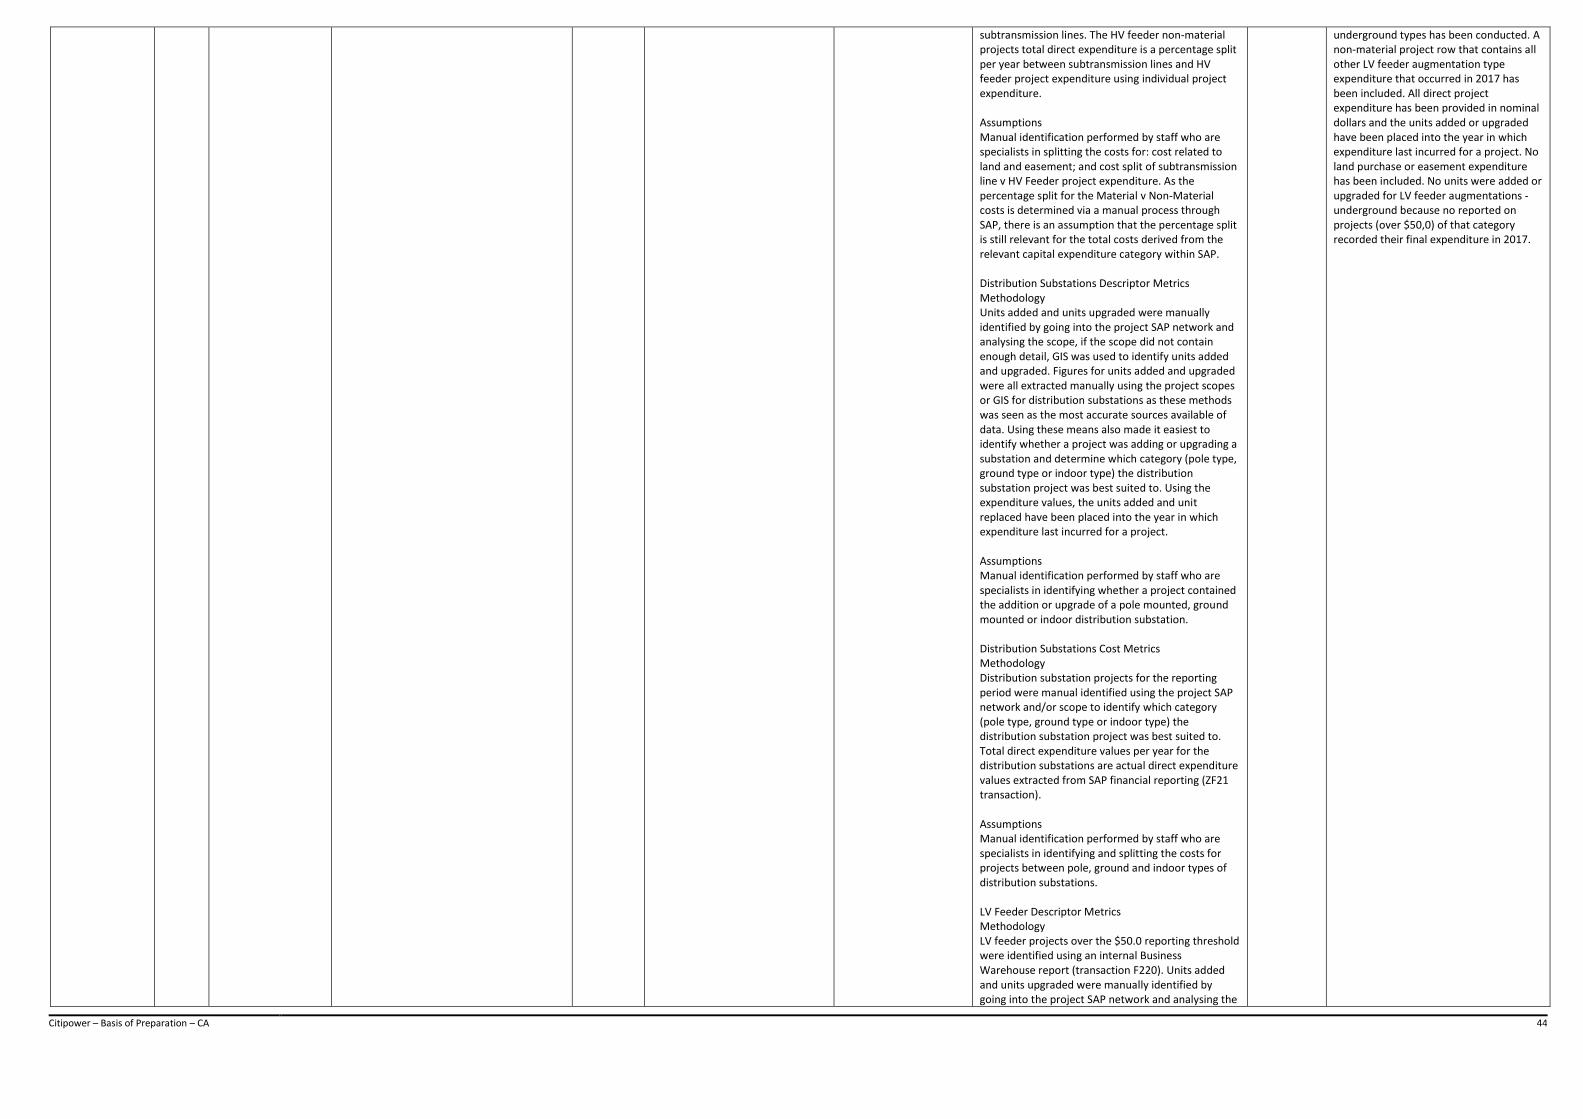
Citipower – Basis of Preparation – CA 44
subtransmission lines. The HV feeder non-material projects total direct expenditure is a percentage split per year between subtransmission lines and HV feeder project expenditure using individual project expenditure. Assumptions Manual identification performed by staff who are specialists in splitting the costs for: cost related to land and easement; and cost split of subtransmission line v HV Feeder project expenditure. As the percentage split for the Material v Non-Material costs is determined via a manual process through SAP, there is an assumption that the percentage split is still relevant for the total costs derived from the relevant capital expenditure category within SAP. Distribution Substations Descriptor Metrics Methodology Units added and units upgraded were manually identified by going into the project SAP network and analysing the scope, if the scope did not contain enough detail, GIS was used to identify units added and upgraded. Figures for units added and upgraded were all extracted manually using the project scopes or GIS for distribution substations as these methods was seen as the most accurate sources available of data. Using these means also made it easiest to identify whether a project was adding or upgrading a substation and determine which category (pole type, ground type or indoor type) the distribution substation project was best suited to. Using the expenditure values, the units added and unit replaced have been placed into the year in which expenditure last incurred for a project. Assumptions Manual identification performed by staff who are specialists in identifying whether a project contained the addition or upgrade of a pole mounted, ground mounted or indoor distribution substation. Distribution Substations Cost Metrics Methodology Distribution substation projects for the reporting period were manual identified using the project SAP network and/or scope to identify which category (pole type, ground type or indoor type) the distribution substation project was best suited to. Total direct expenditure values per year for the distribution substations are actual direct expenditure values extracted from SAP financial reporting (ZF21 transaction). Assumptions Manual identification performed by staff who are specialists in identifying and splitting the costs for projects between pole, ground and indoor types of distribution substations. LV Feeder Descriptor Metrics Methodology LV feeder projects over the $50.0 reporting threshold were identified using an internal Business Warehouse report (transaction F220). Units added and units upgraded were manually identified by going into the project SAP network and analysing the
underground types has been conducted. A non-material project row that contains all other LV feeder augmentation type expenditure that occurred in 2017 has been included. All direct project expenditure has been provided in nominal dollars and the units added or upgraded have been placed into the year in which expenditure last incurred for a project. No land purchase or easement expenditure has been included. No units were added or upgraded for LV feeder augmentations - underground because no reported on projects (over $50,0) of that category recorded their final expenditure in 2017.
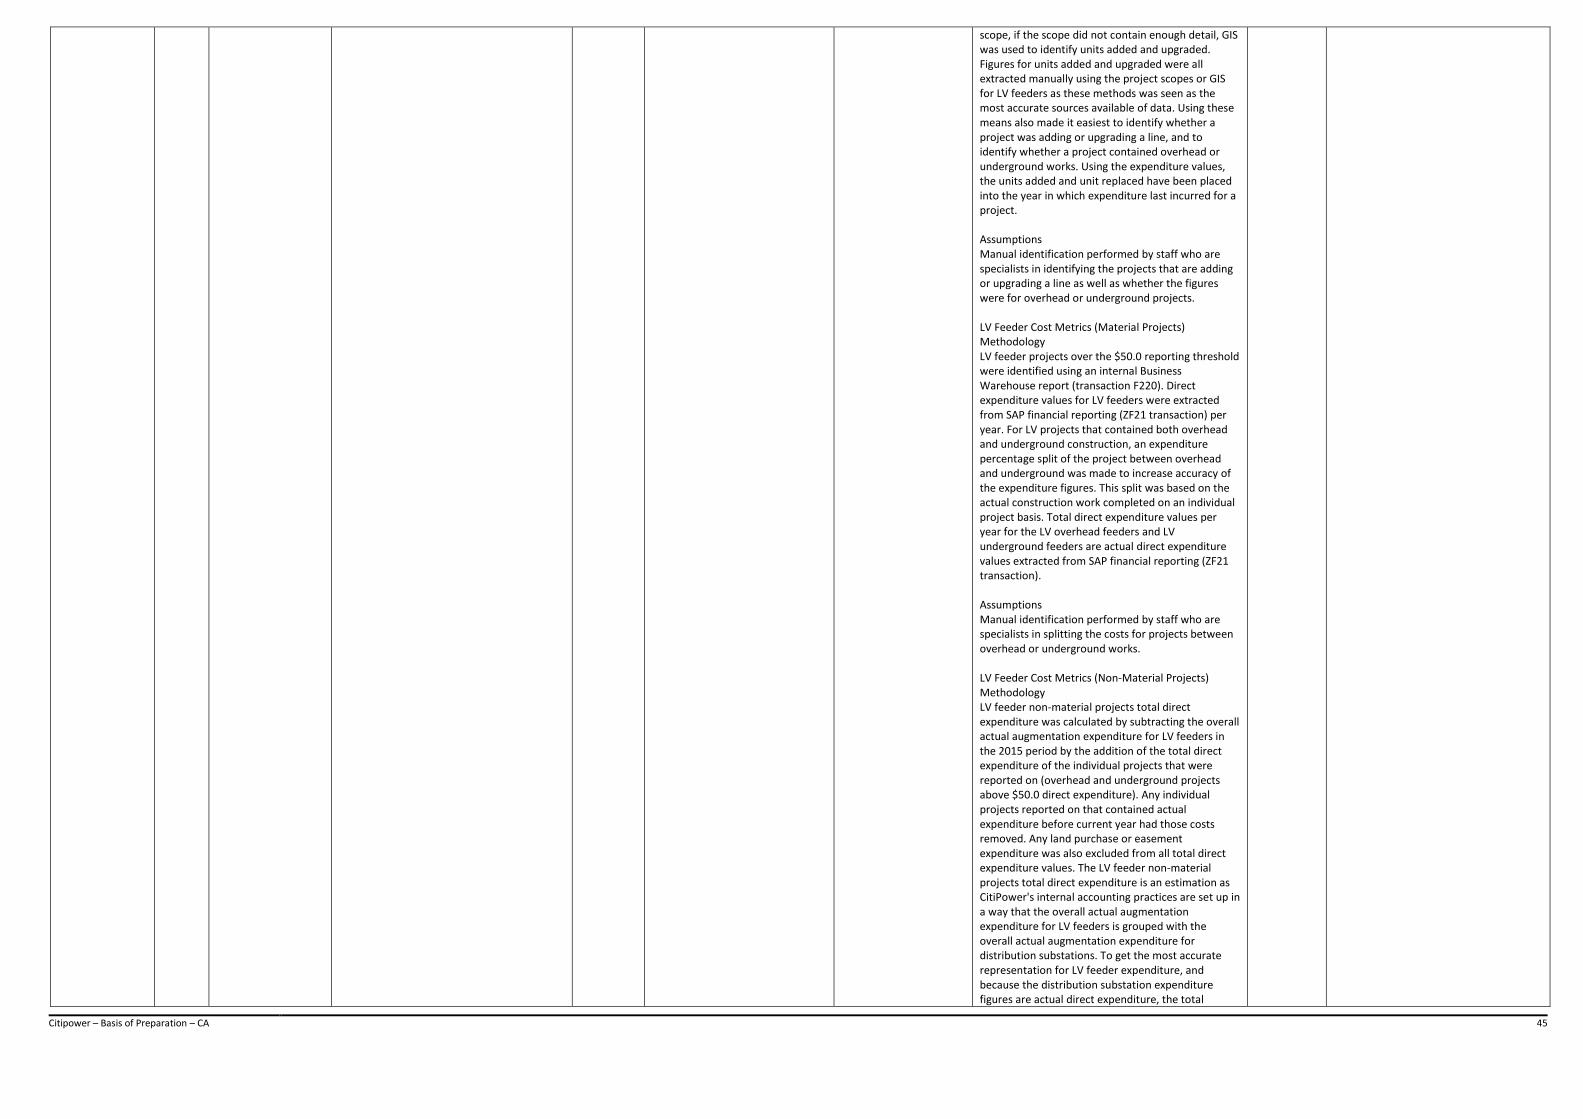
Citipower – Basis of Preparation – CA 45
scope, if the scope did not contain enough detail, GIS was used to identify units added and upgraded. Figures for units added and upgraded were all extracted manually using the project scopes or GIS for LV feeders as these methods was seen as the most accurate sources available of data. Using these means also made it easiest to identify whether a project was adding or upgrading a line, and to identify whether a project contained overhead or underground works. Using the expenditure values, the units added and unit replaced have been placed into the year in which expenditure last incurred for a project. Assumptions Manual identification performed by staff who are specialists in identifying the projects that are adding or upgrading a line as well as whether the figures were for overhead or underground projects. LV Feeder Cost Metrics (Material Projects) Methodology LV feeder projects over the $50.0 reporting threshold were identified using an internal Business Warehouse report (transaction F220). Direct expenditure values for LV feeders were extracted from SAP financial reporting (ZF21 transaction) per year. For LV projects that contained both overhead and underground construction, an expenditure percentage split of the project between overhead and underground was made to increase accuracy of the expenditure figures. This split was based on the actual construction work completed on an individual project basis. Total direct expenditure values per year for the LV overhead feeders and LV underground feeders are actual direct expenditure values extracted from SAP financial reporting (ZF21 transaction). Assumptions Manual identification performed by staff who are specialists in splitting the costs for projects between overhead or underground works. LV Feeder Cost Metrics (Non-Material Projects) Methodology LV feeder non-material projects total direct expenditure was calculated by subtracting the overall actual augmentation expenditure for LV feeders in the 2015 period by the addition of the total direct expenditure of the individual projects that were reported on (overhead and underground projects above $50.0 direct expenditure). Any individual projects reported on that contained actual expenditure before current year had those costs removed. Any land purchase or easement expenditure was also excluded from all total direct expenditure values. The LV feeder non-material projects total direct expenditure is an estimation as CitiPower's internal accounting practices are set up in a way that the overall actual augmentation expenditure for LV feeders is grouped with the overall actual augmentation expenditure for distribution substations. To get the most accurate representation for LV feeder expenditure, and because the distribution substation expenditure figures are actual direct expenditure, the total
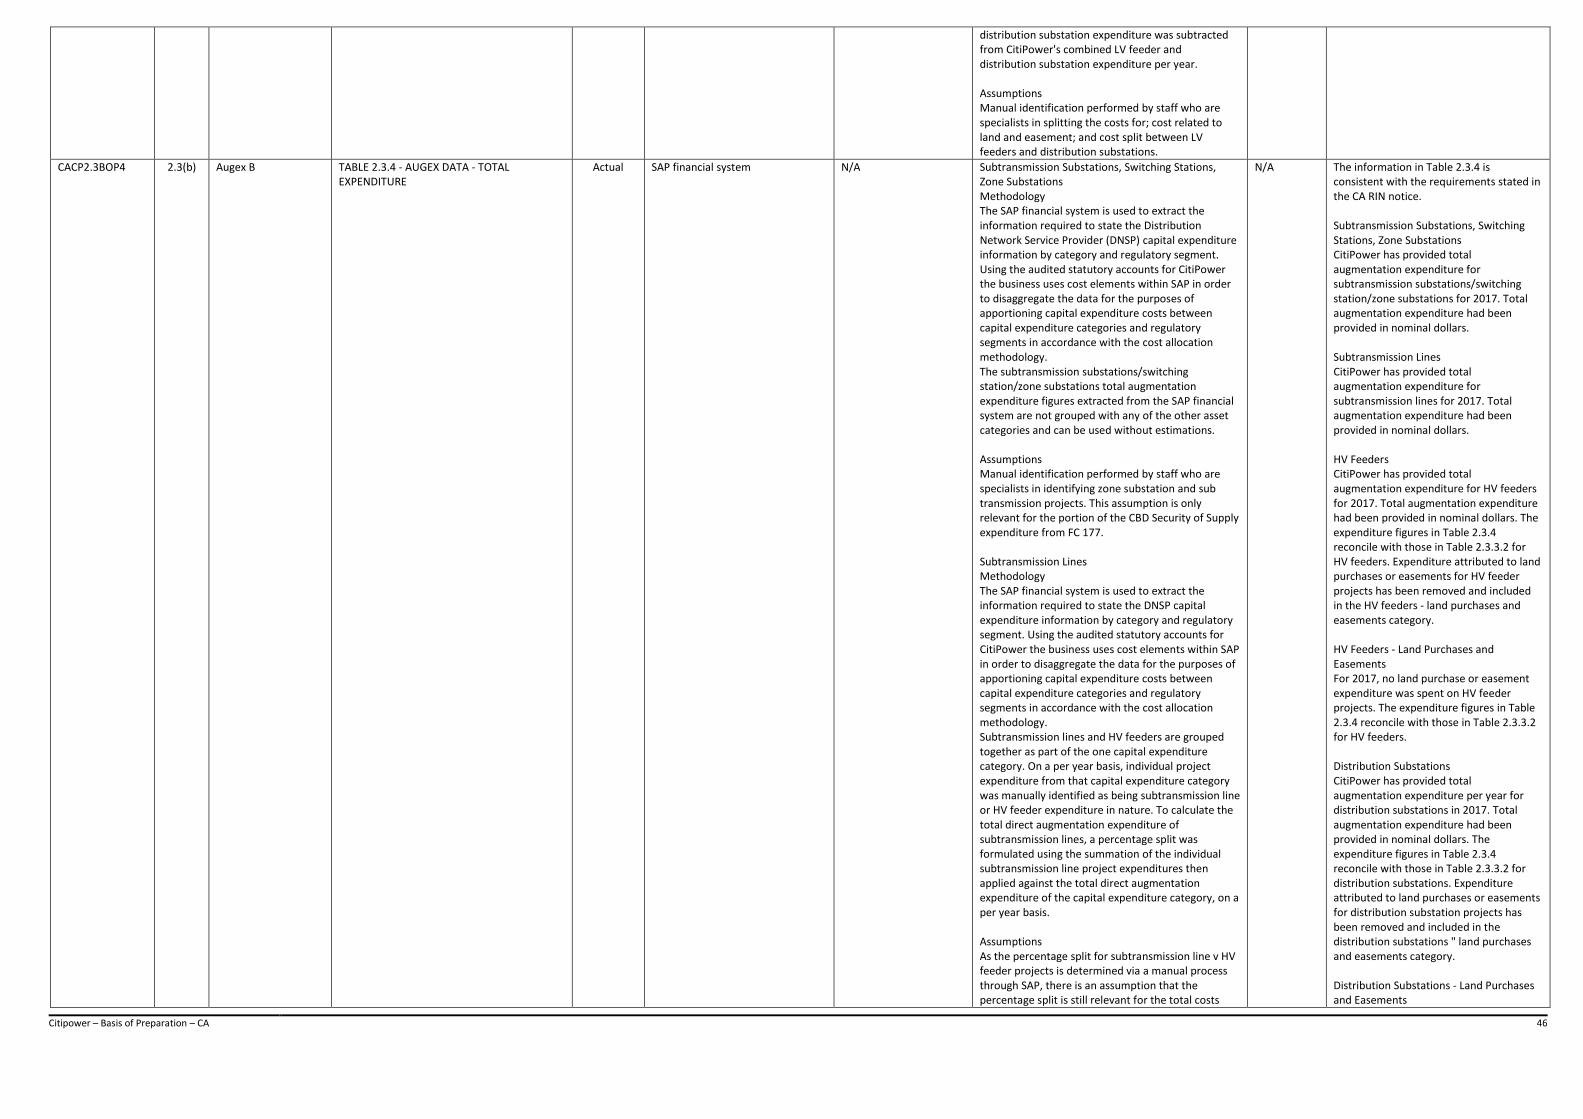
Citipower – Basis of Preparation – CA 46
distribution substation expenditure was subtracted from CitiPower's combined LV feeder and distribution substation expenditure per year. Assumptions Manual identification performed by staff who are specialists in splitting the costs for; cost related to land and easement; and cost split between LV feeders and distribution substations.
CACP2.3BOP4 2.3(b) Augex B TABLE 2.3.4 - AUGEX DATA - TOTAL EXPENDITURE
Actual SAP financial system N/A Subtransmission Substations, Switching Stations, Zone Substations Methodology The SAP financial system is used to extract the information required to state the Distribution Network Service Provider (DNSP) capital expenditure information by category and regulatory segment. Using the audited statutory accounts for CitiPower the business uses cost elements within SAP in order to disaggregate the data for the purposes of apportioning capital expenditure costs between capital expenditure categories and regulatory segments in accordance with the cost allocation methodology. The subtransmission substations/switching station/zone substations total augmentation expenditure figures extracted from the SAP financial system are not grouped with any of the other asset categories and can be used without estimations. Assumptions Manual identification performed by staff who are specialists in identifying zone substation and sub transmission projects. This assumption is only relevant for the portion of the CBD Security of Supply expenditure from FC 177. Subtransmission Lines Methodology The SAP financial system is used to extract the information required to state the DNSP capital expenditure information by category and regulatory segment. Using the audited statutory accounts for CitiPower the business uses cost elements within SAP in order to disaggregate the data for the purposes of apportioning capital expenditure costs between capital expenditure categories and regulatory segments in accordance with the cost allocation methodology. Subtransmission lines and HV feeders are grouped together as part of the one capital expenditure category. On a per year basis, individual project expenditure from that capital expenditure category was manually identified as being subtransmission line or HV feeder expenditure in nature. To calculate the total direct augmentation expenditure of subtransmission lines, a percentage split was formulated using the summation of the individual subtransmission line project expenditures then applied against the total direct augmentation expenditure of the capital expenditure category, on a per year basis. Assumptions As the percentage split for subtransmission line v HV feeder projects is determined via a manual process through SAP, there is an assumption that the percentage split is still relevant for the total costs
N/A The information in Table 2.3.4 is consistent with the requirements stated in the CA RIN notice. Subtransmission Substations, Switching Stations, Zone Substations CitiPower has provided total augmentation expenditure for subtransmission substations/switching station/zone substations for 2017. Total augmentation expenditure had been provided in nominal dollars. Subtransmission Lines CitiPower has provided total augmentation expenditure for subtransmission lines for 2017. Total augmentation expenditure had been provided in nominal dollars. HV Feeders CitiPower has provided total augmentation expenditure for HV feeders for 2017. Total augmentation expenditure had been provided in nominal dollars. The expenditure figures in Table 2.3.4 reconcile with those in Table 2.3.3.2 for HV feeders. Expenditure attributed to land purchases or easements for HV feeder projects has been removed and included in the HV feeders - land purchases and easements category. HV Feeders - Land Purchases and Easements For 2017, no land purchase or easement expenditure was spent on HV feeder projects. The expenditure figures in Table 2.3.4 reconcile with those in Table 2.3.3.2 for HV feeders. Distribution Substations CitiPower has provided total augmentation expenditure per year for distribution substations in 2017. Total augmentation expenditure had been provided in nominal dollars. The expenditure figures in Table 2.3.4 reconcile with those in Table 2.3.3.2 for distribution substations. Expenditure attributed to land purchases or easements for distribution substation projects has been removed and included in the distribution substations " land purchases and easements category. Distribution Substations - Land Purchases and Easements
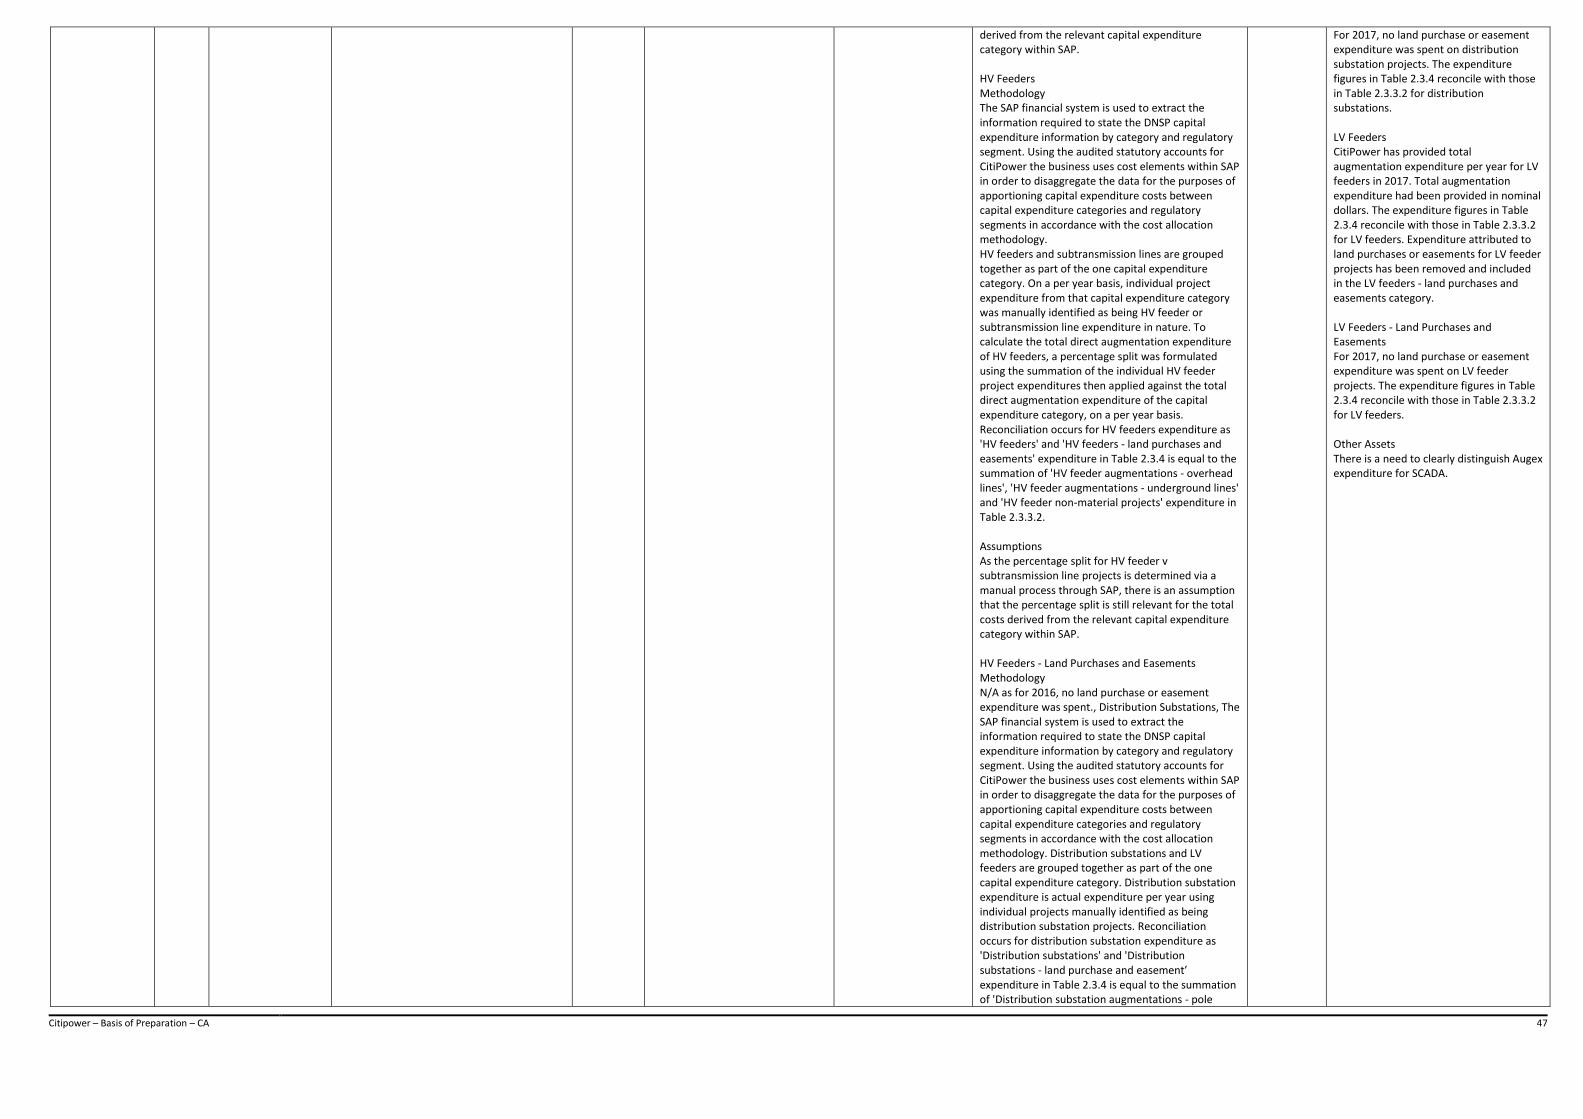
Citipower – Basis of Preparation – CA 47
derived from the relevant capital expenditure category within SAP. HV Feeders Methodology The SAP financial system is used to extract the information required to state the DNSP capital expenditure information by category and regulatory segment. Using the audited statutory accounts for CitiPower the business uses cost elements within SAP in order to disaggregate the data for the purposes of apportioning capital expenditure costs between capital expenditure categories and regulatory segments in accordance with the cost allocation methodology. HV feeders and subtransmission lines are grouped together as part of the one capital expenditure category. On a per year basis, individual project expenditure from that capital expenditure category was manually identified as being HV feeder or subtransmission line expenditure in nature. To calculate the total direct augmentation expenditure of HV feeders, a percentage split was formulated using the summation of the individual HV feeder project expenditures then applied against the total direct augmentation expenditure of the capital expenditure category, on a per year basis. Reconciliation occurs for HV feeders expenditure as 'HV feeders' and 'HV feeders - land purchases and easements' expenditure in Table 2.3.4 is equal to the summation of 'HV feeder augmentations - overhead lines', 'HV feeder augmentations - underground lines' and 'HV feeder non-material projects' expenditure in Table 2.3.3.2. Assumptions As the percentage split for HV feeder v subtransmission line projects is determined via a manual process through SAP, there is an assumption that the percentage split is still relevant for the total costs derived from the relevant capital expenditure category within SAP. HV Feeders - Land Purchases and Easements Methodology N/A as for 2016, no land purchase or easement expenditure was spent., Distribution Substations, The SAP financial system is used to extract the information required to state the DNSP capital expenditure information by category and regulatory segment. Using the audited statutory accounts for CitiPower the business uses cost elements within SAP in order to disaggregate the data for the purposes of apportioning capital expenditure costs between capital expenditure categories and regulatory segments in accordance with the cost allocation methodology. Distribution substations and LV feeders are grouped together as part of the one capital expenditure category. Distribution substation expenditure is actual expenditure per year using individual projects manually identified as being distribution substation projects. Reconciliation occurs for distribution substation expenditure as 'Distribution substations' and 'Distribution substations - land purchase and easement’ expenditure in Table 2.3.4 is equal to the summation of 'Distribution substation augmentations - pole
For 2017, no land purchase or easement expenditure was spent on distribution substation projects. The expenditure figures in Table 2.3.4 reconcile with those in Table 2.3.3.2 for distribution substations. LV Feeders CitiPower has provided total augmentation expenditure per year for LV feeders in 2017. Total augmentation expenditure had been provided in nominal dollars. The expenditure figures in Table 2.3.4 reconcile with those in Table 2.3.3.2 for LV feeders. Expenditure attributed to land purchases or easements for LV feeder projects has been removed and included in the LV feeders - land purchases and easements category. LV Feeders - Land Purchases and Easements For 2017, no land purchase or easement expenditure was spent on LV feeder projects. The expenditure figures in Table 2.3.4 reconcile with those in Table 2.3.3.2 for LV feeders. Other Assets There is a need to clearly distinguish Augex expenditure for SCADA.
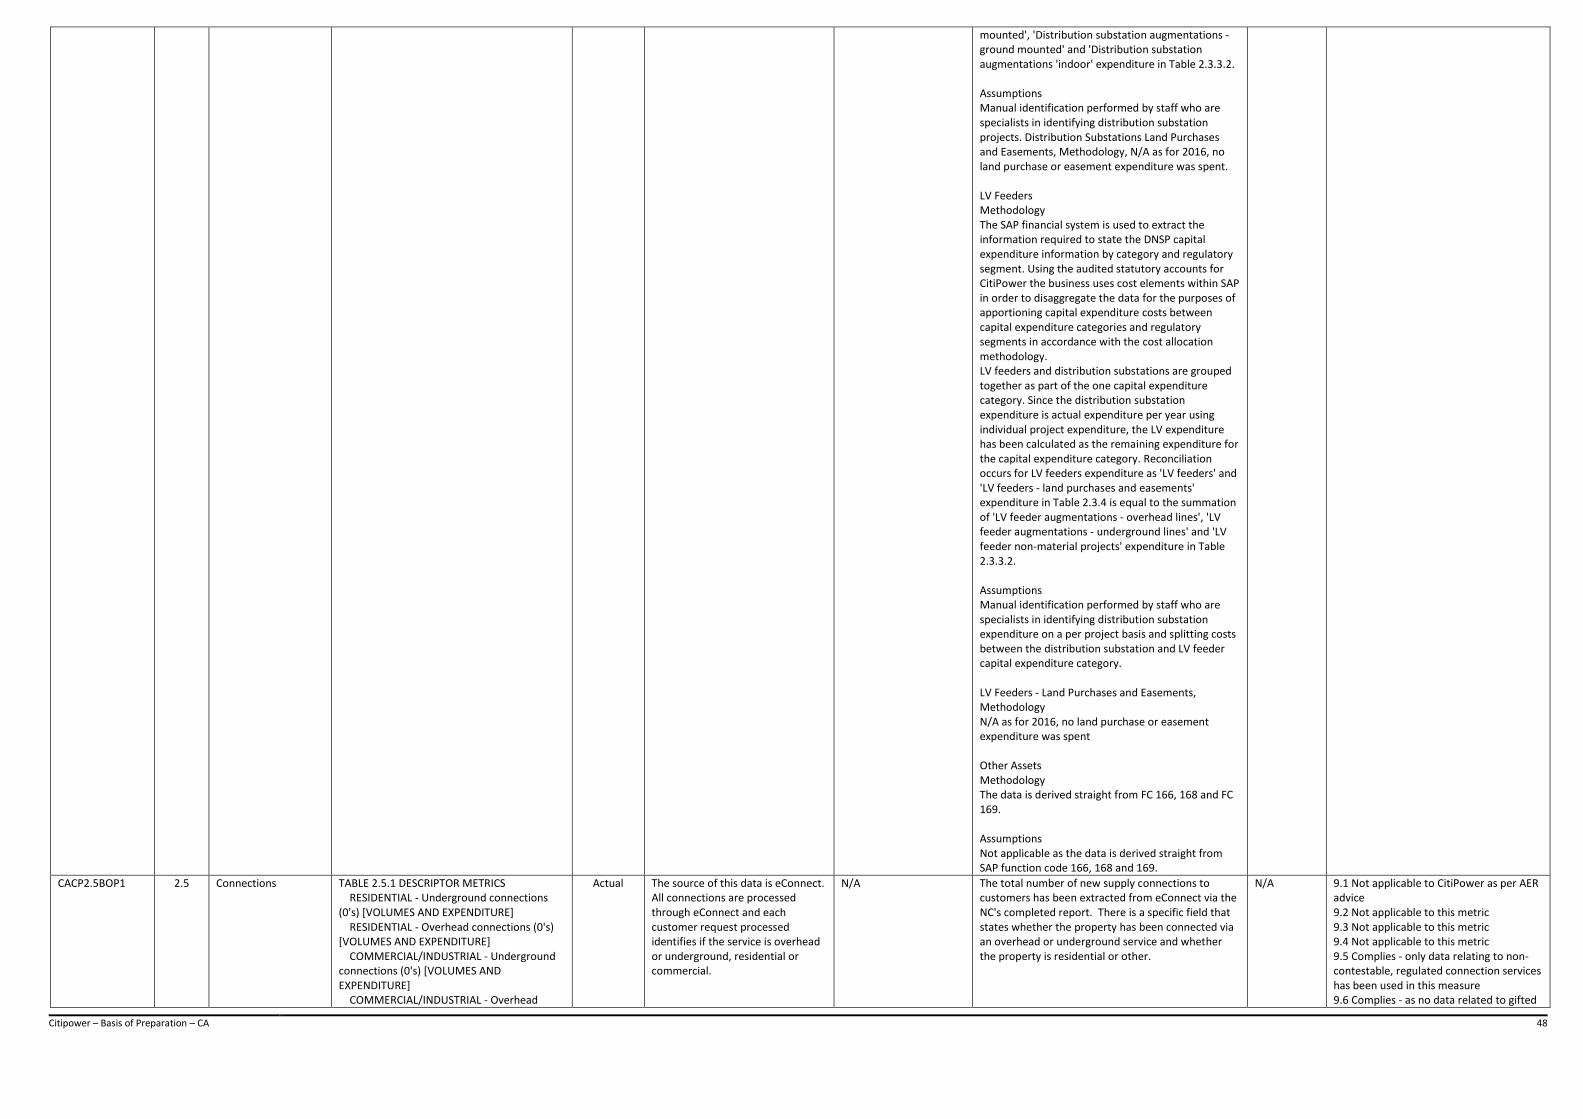
Citipower – Basis of Preparation – CA 48
mounted', 'Distribution substation augmentations - ground mounted' and 'Distribution substation augmentations 'indoor' expenditure in Table 2.3.3.2. Assumptions Manual identification performed by staff who are specialists in identifying distribution substation projects. Distribution Substations Land Purchases and Easements, Methodology, N/A as for 2016, no land purchase or easement expenditure was spent. LV Feeders Methodology The SAP financial system is used to extract the information required to state the DNSP capital expenditure information by category and regulatory segment. Using the audited statutory accounts for CitiPower the business uses cost elements within SAP in order to disaggregate the data for the purposes of apportioning capital expenditure costs between capital expenditure categories and regulatory segments in accordance with the cost allocation methodology. LV feeders and distribution substations are grouped together as part of the one capital expenditure category. Since the distribution substation expenditure is actual expenditure per year using individual project expenditure, the LV expenditure has been calculated as the remaining expenditure for the capital expenditure category. Reconciliation occurs for LV feeders expenditure as 'LV feeders' and 'LV feeders - land purchases and easements' expenditure in Table 2.3.4 is equal to the summation of 'LV feeder augmentations - overhead lines', 'LV feeder augmentations - underground lines' and 'LV feeder non-material projects' expenditure in Table 2.3.3.2. Assumptions Manual identification performed by staff who are specialists in identifying distribution substation expenditure on a per project basis and splitting costs between the distribution substation and LV feeder capital expenditure category. LV Feeders - Land Purchases and Easements, Methodology N/A as for 2016, no land purchase or easement expenditure was spent Other Assets Methodology The data is derived straight from FC 166, 168 and FC 169. Assumptions Not applicable as the data is derived straight from SAP function code 166, 168 and 169.
CACP2.5BOP1 2.5 Connections TABLE 2.5.1 DESCRIPTOR METRICS RESIDENTIAL - Underground connections (0's) [VOLUMES AND EXPENDITURE] RESIDENTIAL - Overhead connections (0's) [VOLUMES AND EXPENDITURE] COMMERCIAL/INDUSTRIAL - Underground connections (0's) [VOLUMES AND EXPENDITURE] COMMERCIAL/INDUSTRIAL - Overhead
Actual The source of this data is eConnect. All connections are processed through eConnect and each customer request processed identifies if the service is overhead or underground, residential or commercial.
N/A The total number of new supply connections to customers has been extracted from eConnect via the NC's completed report. There is a specific field that states whether the property has been connected via an overhead or underground service and whether the property is residential or other.
N/A 9.1 Not applicable to CitiPower as per AER advice 9.2 Not applicable to this metric 9.3 Not applicable to this metric 9.4 Not applicable to this metric 9.5 Complies - only data relating to non-contestable, regulated connection services has been used in this measure 9.6 Complies - as no data related to gifted
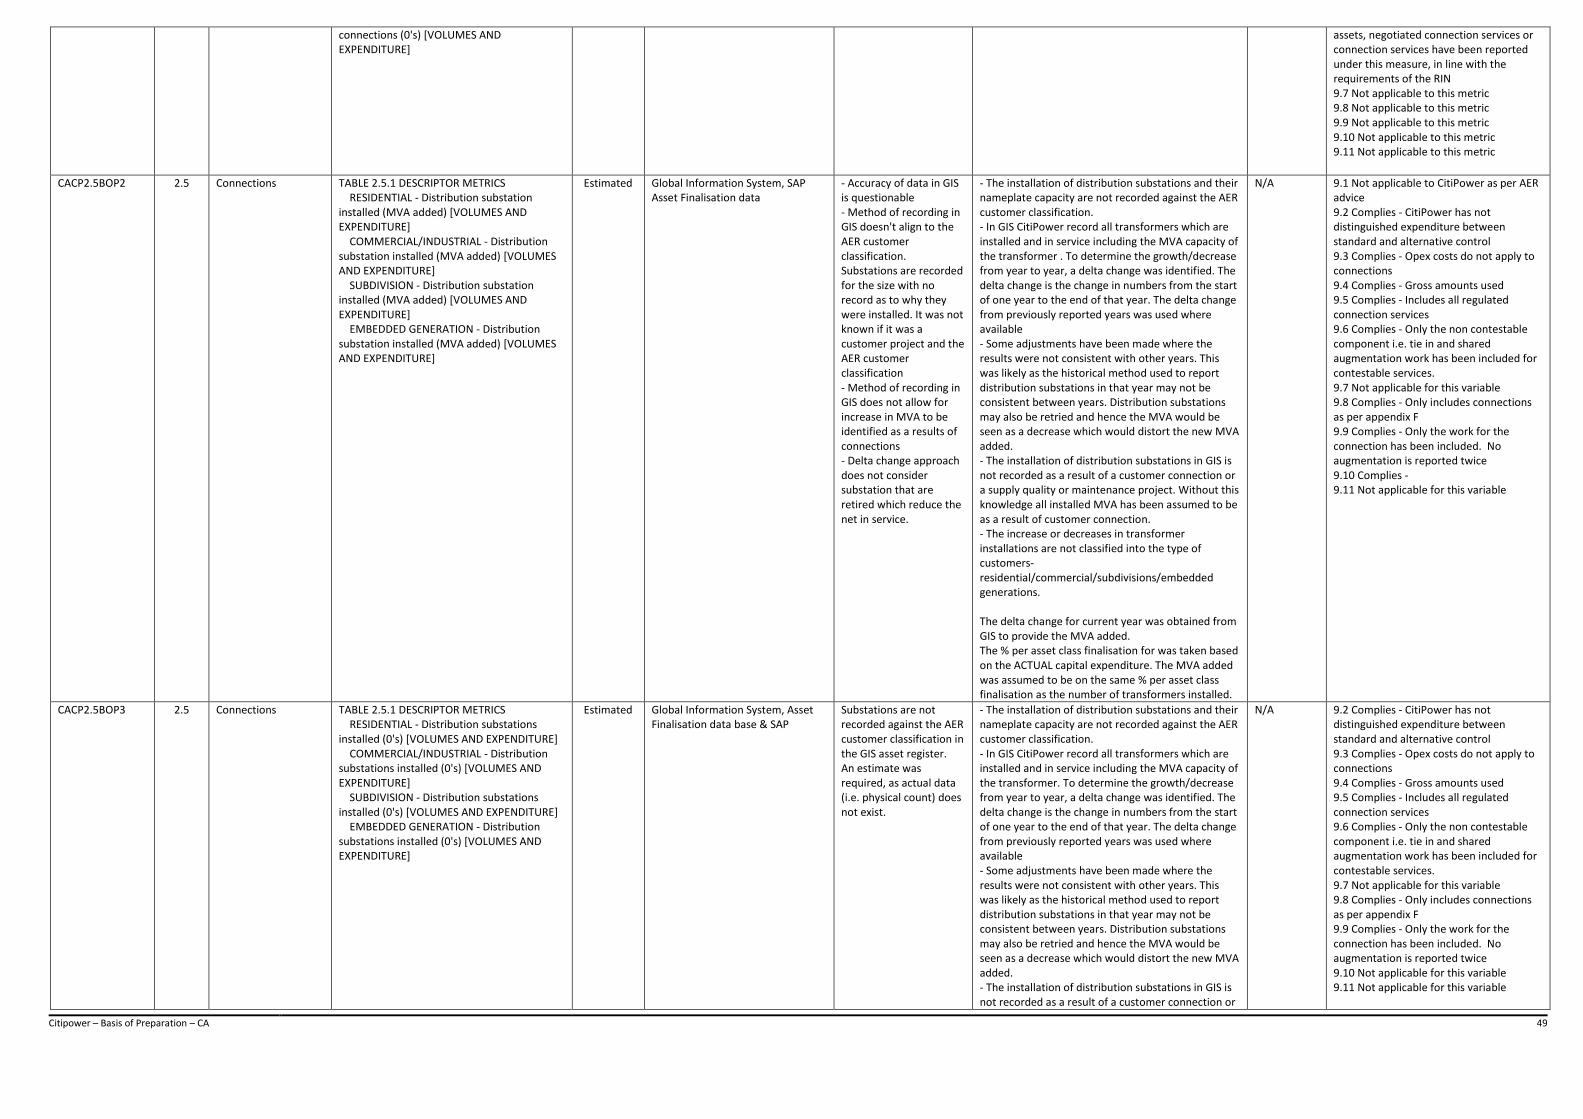
Citipower – Basis of Preparation – CA 49
connections (0's) [VOLUMES AND EXPENDITURE]
assets, negotiated connection services or connection services have been reported under this measure, in line with the requirements of the RIN 9.7 Not applicable to this metric 9.8 Not applicable to this metric 9.9 Not applicable to this metric 9.10 Not applicable to this metric 9.11 Not applicable to this metric
CACP2.5BOP2 2.5 Connections TABLE 2.5.1 DESCRIPTOR METRICS RESIDENTIAL - Distribution substation installed (MVA added) [VOLUMES AND EXPENDITURE] COMMERCIAL/INDUSTRIAL - Distribution substation installed (MVA added) [VOLUMES AND EXPENDITURE] SUBDIVISION - Distribution substation installed (MVA added) [VOLUMES AND EXPENDITURE] EMBEDDED GENERATION - Distribution substation installed (MVA added) [VOLUMES AND EXPENDITURE]
Estimated Global Information System, SAP Asset Finalisation data
- Accuracy of data in GIS is questionable - Method of recording in GIS doesn't align to the AER customer classification. Substations are recorded for the size with no record as to why they were installed. It was not known if it was a customer project and the AER customer classification - Method of recording in GIS does not allow for increase in MVA to be identified as a results of connections - Delta change approach does not consider substation that are retired which reduce the net in service.
- The installation of distribution substations and their nameplate capacity are not recorded against the AER customer classification. - In GIS CitiPower record all transformers which are installed and in service including the MVA capacity of the transformer . To determine the growth/decrease from year to year, a delta change was identified. The delta change is the change in numbers from the start of one year to the end of that year. The delta change from previously reported years was used where available - Some adjustments have been made where the results were not consistent with other years. This was likely as the historical method used to report distribution substations in that year may not be consistent between years. Distribution substations may also be retried and hence the MVA would be seen as a decrease which would distort the new MVA added. - The installation of distribution substations in GIS is not recorded as a result of a customer connection or a supply quality or maintenance project. Without this knowledge all installed MVA has been assumed to be as a result of customer connection. - The increase or decreases in transformer installations are not classified into the type of customers-residential/commercial/subdivisions/embedded generations. The delta change for current year was obtained from GIS to provide the MVA added. The % per asset class finalisation for was taken based on the ACTUAL capital expenditure. The MVA added was assumed to be on the same % per asset class finalisation as the number of transformers installed.
N/A 9.1 Not applicable to CitiPower as per AER advice 9.2 Complies - CitiPower has not distinguished expenditure between standard and alternative control 9.3 Complies - Opex costs do not apply to connections 9.4 Complies - Gross amounts used 9.5 Complies - Includes all regulated connection services 9.6 Complies - Only the non contestable component i.e. tie in and shared augmentation work has been included for contestable services. 9.7 Not applicable for this variable 9.8 Complies - Only includes connections as per appendix F 9.9 Complies - Only the work for the connection has been included. No augmentation is reported twice 9.10 Complies - 9.11 Not applicable for this variable
CACP2.5BOP3 2.5 Connections TABLE 2.5.1 DESCRIPTOR METRICS RESIDENTIAL - Distribution substations installed (0's) [VOLUMES AND EXPENDITURE] COMMERCIAL/INDUSTRIAL - Distribution substations installed (0's) [VOLUMES AND EXPENDITURE] SUBDIVISION - Distribution substations installed (0's) [VOLUMES AND EXPENDITURE] EMBEDDED GENERATION - Distribution substations installed (0's) [VOLUMES AND EXPENDITURE]
Estimated Global Information System, Asset Finalisation data base & SAP
Substations are not recorded against the AER customer classification in the GIS asset register. An estimate was required, as actual data (i.e. physical count) does not exist.
- The installation of distribution substations and their nameplate capacity are not recorded against the AER customer classification. - In GIS CitiPower record all transformers which are installed and in service including the MVA capacity of the transformer. To determine the growth/decrease from year to year, a delta change was identified. The delta change is the change in numbers from the start of one year to the end of that year. The delta change from previously reported years was used where available - Some adjustments have been made where the results were not consistent with other years. This was likely as the historical method used to report distribution substations in that year may not be consistent between years. Distribution substations may also be retried and hence the MVA would be seen as a decrease which would distort the new MVA added. - The installation of distribution substations in GIS is not recorded as a result of a customer connection or
N/A 9.2 Complies - CitiPower has not distinguished expenditure between standard and alternative control 9.3 Complies - Opex costs do not apply to connections 9.4 Complies - Gross amounts used 9.5 Complies - Includes all regulated connection services 9.6 Complies - Only the non contestable component i.e. tie in and shared augmentation work has been included for contestable services. 9.7 Not applicable for this variable 9.8 Complies - Only includes connections as per appendix F 9.9 Complies - Only the work for the connection has been included. No augmentation is reported twice 9.10 Not applicable for this variable 9.11 Not applicable for this variable

Citipower – Basis of Preparation – CA 50
a supply quality or maintenance project. Without this knowledge all installed MVA has been assumed to be as a result of customer connection. - The increase or decreases in transformer installations are not classified into the type of customers-residential/commercial/subdivisions/embedded generations. The delta change for current year was obtained from GIS to provide the MVA added. The % per asset class finalisation for was taken based on the ACTUAL capital expenditure. The MVA added was assumed to be on the same % per asset class finalisation as the number of transformers installed.
CACP2.5BOP4 2.5 Connections TABLE 2.5.1 DESCRIPTOR METRICS RESIDENTIAL - Distribution substation installed (total spend $0's) [VOLUMES AND EXPENDITURE] COMMERCIAL/INDUSTRIAL - Distribution substation installed total spend ($0's) [VOLUMES AND EXPENDITURE] SUBDIVISION - Distribution substation installed (total spend $0's) [VOLUMES AND EXPENDITURE] EMBEDDED GENERATION - Distribution substation installed (total spend $0's) [VOLUMES AND EXPENDITURE]
Estimated SAP Business Intelligence Report, Global Information System
Substation augmentation assets are not recorded against the AER customer classification in the Global Information System. GIS does not contain any financial information. Financial costs for projects in standard reports only contains the total costs not individual assets. Substations installed are not recorded against the AER customer classification Actual financial data is used but an estimate is required to apportion to each customer category.
Financial information is available from the asset finalisation procedure that splits cost into asset classes. The asset class of substations assets is able to be determined from the asset finalisation data. The expenditure for the asset class was determined for each function code. The function codes were mapped to the AER customer classification. The percentage of the expenditure for substation augmentation asset class was determined against the total expenditure. The percentage was then applied against the total cost as reported in Table 2.5.2. to provide the expenditure for substations in the 4 metrics. The % per asset class finalisation was taken based on the ACTUAL capital expenditure.
N/A 9.1 Not applicable to CitiPower as per AER advice 9.2 Complies - CitiPower has not distinguished expenditure between standard and alternative control 9.3 Complies - Expenditure has not been distinguished as Opex costs do not apply to connections 9.4 Complies - Gross amounts used 9.5 Complies - Includes all regulated connection services 9.6 Complies - Only the non-contestable component i.e. tie in and shared augmentation work has been included for contestable services. 9.7 Not applicable for this variable 9.8 Complies - Only includes connections at high voltage 22 kV 9.9 Complies - Only the work for the connection has been included. No augmentation is reported twice 9.10 Not applicable for this variable 9.11 Not applicable for this variable
CACP2.5BOP5 2.5 Connections TABLE 2.5.1 DESCRIPTOR METRICS RESIDENTIAL - Augmentation HV (net circuit KM added) [VOLUMES AND EXPENDITURE] RESIDENTIAL - Augmentation LV (net circuit KM added) [VOLUMES AND EXPENDITURE] COMMERCIAL/INDUSTRIAL - Augmentation HV (net circuit KM added) [VOLUMES AND EXPENDITURE] COMMERCIAL/INDUSTRIAL - Augmentation LV (net circuit KM added) [VOLUMES AND EXPENDITURE] SUBDIVISION - Augmentation HV (net circuit KM added) [VOLUMES AND EXPENDITURE] SUBDIVISION - Augmentation LV (net circuit KM added) [VOLUMES AND EXPENDITURE] EMBEDDED GENERATION - Augmentation HV (net circuit KM added) [VOLUMES AND EXPENDITURE] EMBEDDED GENERATION - Augmentation LV (net circuit KM added) [VOLUMES AND EXPENDITURE]
Estimated Global Information System and SAP Financial asset finalisation sheets
Conductor installed in the Global Information System is not recorded against the AER customer classification. A combination of financial data and physical data has had to be combined to provide an estimate.
The Financial asset finalisation data contains financial data against the asset class of conductor and includes the CitiPower function code. This was assumed to be suitable to determine the allocation of conductor against the AER customer classification categories. The expenditure for the asset class that matched HV, LV and Substation were totalled for each function code. This this was then mapped to the AER customer classification to determine a % of the expenditure for HV, and LV and substations. This was then applied against the total KM’s from GIS. The % per asset class finalisation was taken based on the ACTUAL capital expenditure. The total KMs of circuit from a delta change were obtained from GIS and these were allocated against the customer classification on the basis of the percentage of cost per function code as reported in the asset class as part of the asset finalisation.
N/A
For 2017 the HV route metres installed from GIS delta change is in error. The average of the values from 2014 to 2017 has been used for the 2017 value. The LV route metres is consistent with previous years and has been used. 9.1 Not applicable to CitiPower as per AER advice 9.2 Complies - CitiPower has not distinguished expenditure between standard and alternative control 9.3 Complies - Opex costs do not apply to connections 9.4 Complies - Gross amounts used 9.5 Complies - Includes all regulated connection services 9.6 Complies - Only the non-contestable component i.e. tie in and shared augmentation work has been included for contestable services. 9.7 Not applicable for this variable 9.8 Complies - Only includes connections as per appendix F 9.9 Complies - Only the work for the connection has been included. No augmentation is reported twice 9.10 Not applicable for this variable 9.11 Not applicable for this variable

Citipower – Basis of Preparation – CA 51
CACP2.5BOP6 2.5 Connections TABLE 2.5.1 DESCRIPTOR METRICS RESIDENTIAL - Augmentation HV (total spend $0's) [VOLUMES AND EXPENDITURE] RESIDENTIAL - Augmentation LV (total spend $0's) [VOLUMES AND EXPENDITURE] COMMERCIAL/INDUSTRIAL - Augmentation HV (total spend $0's) [VOLUMES AND EXPENDITURE] COMMERCIAL/INDUSTRIAL - Augmentation LV (total spend $0's) [VOLUMES AND EXPENDITURE] SUBDIVISION - Augmentation HV (total spend $0's) [VOLUMES AND EXPENDITURE] SUBDIVISION - Augmentation LV (total spend $0's) [VOLUMES AND EXPENDITURE] EMBEDDED GENERATION - Augmentation HV (total spend $0's) [VOLUMES AND EXPENDITURE] EMBEDDED GENERATION - Augmentation LV (total spend $0's) [VOLUMES AND EXPENDITURE]
Estimated SAP Asset Finalisation Report using Business Intelligence. Global Information System
An estimate is required as HV & LV augmentation assets are not recorded against the AER customer classification in the Global Information System (GIS). GIS does not contain any financial information. Financial costs for projects in standard reports only contain the total costs not individual assets.
The Financial asset finalisation data contains financial data against the asset class of conductor and includes the CitiPower function code. This was assumed to be suitable to determine the allocation of conductor against the AER customer classification categories. The expenditure for the asset class that matched HV, LV and Substation were totalled for each function code. This this was then mapped to the AER customer classification to determine a % of the expenditure for HV, and LV and substations. This was then applied against the total KM’s from GIS. The % per asset class finalisation was taken based on the ACTUAL capital expenditure. The total KMs of circuit from a delta change were obtained from GIS and these were allocated against the customer classification on the basis of the percentage of cost per function code as reported in the asset class as part of the asset finalisation.
N/A 9.1 Not applicable to CitiPower as per AER advice 9.2 Complies - CitiPower has not distinguished expenditure between standard and alternative control 9.3 Complies - Opex costs do not apply to connections 9.4 Complies - Gross amounts used 9.5 Complies - Includes all regulated connection services 9.6 Complies - Only the non contestable component i.e. tie in and shared augmentation work has been included for contestable services. 9.7 Not applicable for this variable 9.8 Complies - Only includes connections as per appendix F 9.9 Complies - Only the work for the connection has been included. No augmentation is reported twice 9.10 Not applicable for this variable 9.11 Not applicable for this variable
CACP2.5BOP7 2.5 Connections TABLE 2.5.1 DESCRIPTOR METRICS RESIDENTIAL - Mean days to connect residential customer with LV single phase connection (0's) [VOLUMES AND EXPENDITURE]
Actual The source of this data is eConnect. All connections are processed through eConnect and the number of days (cycle time) from clock start to fulfilled is recorded.
N/A The total number of new supply connections to customers has been extracted from eConnect via the NC's completed report. There is a specific field that calculates the number of days from clock start to fulfilled, which is the number of days for the property to be connected. This field has then been used to determine the average number of days for residential connections
N/A 9.1 Not applicable to CitiPower as per AER advice 9.2 Not applicable to this metric 9.3 Not applicable to this metric 9.4 Not applicable to this metric 9.5 Complies - only data relating to non-contestable, regulated connection services has been used for this measure 9.6 Complies - as no data related to gifted assets, negotiated connection services or connection services have been reported under this measure, in line with the requirements of the RIN 9.7 Not applicable to this metric 9.8 Not applicable to this metric 9.9 Not applicable to this metric 9.10 Not applicable to this metric 9.11 Not applicable to this metric
CACP2.5BOP8 2.5 Connections TABLE 2.5.1 DESCRIPTOR METRICS RESIDENTIAL - Volume of GSL breaches for residential customers (0's) [VOLUMES AND EXPENDITURE] RESIDENTIAL - GSL payments ($0's) [VOLUMES AND EXPENDITURE]
Actual The source of the data is eConnect. This information is extracted to Excel, working files used and cross checked via CIS OV.
N/A The data is extracted from eConnect via the 'Month] GSL 2017' report. The report is filtered by: Connection Type - New Connection; No appointment; No unmetered supply; Closed/Fulfilled; Business days >11 & Clock start to fulfilled >11. This information is then exported to Excel and each connection manually reviewed for eligibility. Those NMIs eligible are filtered and cross checked in CIS to confirm if the property is residential.
N/A 9.1 Not applicable to CitiPower as per AER advice 9.2 Not applicable to this metric 9.3 Not applicable to this metric 9.4 Not applicable to this metric 9.5 Complies - only data relating to non-contestable, regulated connection services has been used in this measure 9.6 Complies - as no data related to gifted assets, negotiated connection services or connection services have been reported under this measure, in line with the requirements of the RIN 9.7 Not applicable to this metric 9.8 Not applicable to this metric 9.9 Not applicable to this metric 9.10 Not applicable to this metric 9.11 Complies - a GSL scheme does exist for these connections services
CACP2.5BOP9 2.5 Connections TABLE 2.5.1 DESCRIPTOR METRICS RESIDENTIAL - Volume of customer complaints relating to connection services (0's) [VOLUMES AND EXPENDITURE]
Actual Customised SAP based system CARE (Customer Action and Response).
N/A It is essential that all information extracted from the CARE system is reviewed and validated at year end. CARE has a reporting tool that allows us to extract information relating to a variety of categories including connection service and supply augmentation complaints. Administrating CARE standard work instruction 03-10-W02 is used to extract relevant data. SAP
N/A 9.1 Not applicable to CitiPower as per AER advice 9.2 Not applicable to this metric 9.3 Not applicable to this metric 9.4 Not applicable to this metric 9.5 Complies - only data relating to non-contestable, regulated connection services has been used in this measure
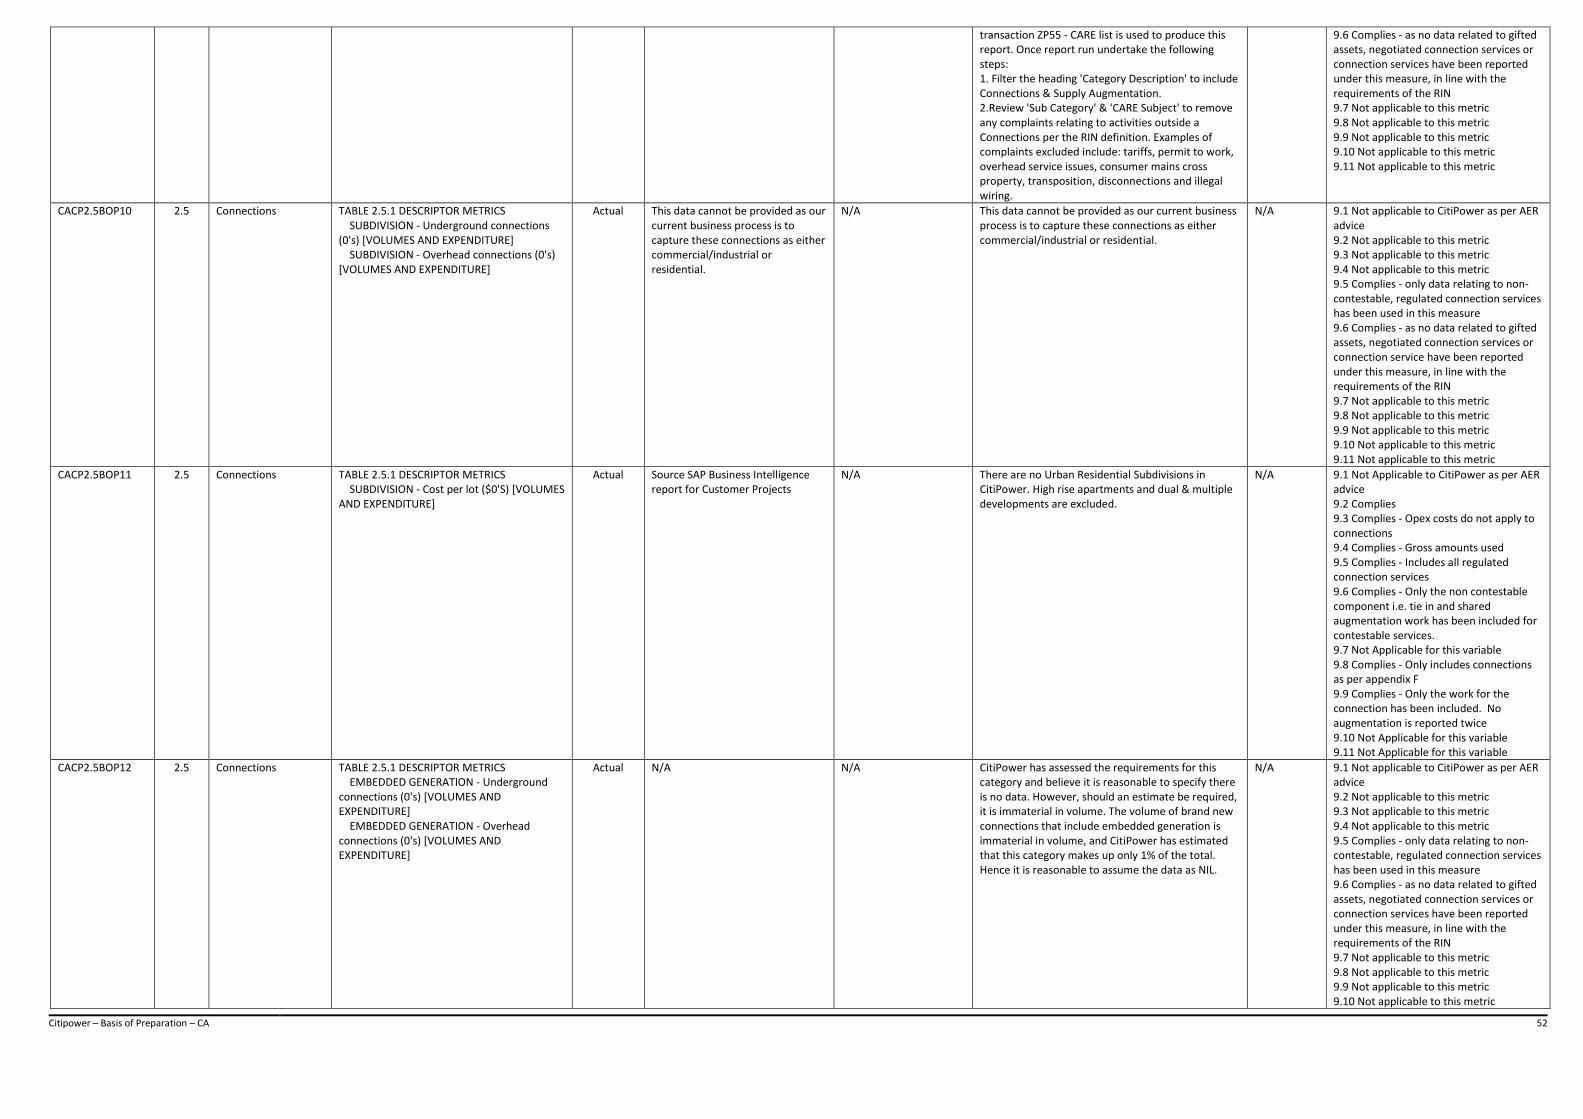
Citipower – Basis of Preparation – CA 52
transaction ZP55 - CARE list is used to produce this report. Once report run undertake the following steps: 1. Filter the heading 'Category Description' to include Connections & Supply Augmentation. 2.Review 'Sub Category' & 'CARE Subject' to remove any complaints relating to activities outside a Connections per the RIN definition. Examples of complaints excluded include: tariffs, permit to work, overhead service issues, consumer mains cross property, transposition, disconnections and illegal wiring.
9.6 Complies - as no data related to gifted assets, negotiated connection services or connection services have been reported under this measure, in line with the requirements of the RIN 9.7 Not applicable to this metric 9.8 Not applicable to this metric 9.9 Not applicable to this metric 9.10 Not applicable to this metric 9.11 Not applicable to this metric
CACP2.5BOP10 2.5 Connections TABLE 2.5.1 DESCRIPTOR METRICS SUBDIVISION - Underground connections (0's) [VOLUMES AND EXPENDITURE] SUBDIVISION - Overhead connections (0's) [VOLUMES AND EXPENDITURE]
Actual This data cannot be provided as our current business process is to capture these connections as either commercial/industrial or residential.
N/A This data cannot be provided as our current business process is to capture these connections as either commercial/industrial or residential.
N/A 9.1 Not applicable to CitiPower as per AER advice 9.2 Not applicable to this metric 9.3 Not applicable to this metric 9.4 Not applicable to this metric 9.5 Complies - only data relating to non-contestable, regulated connection services has been used in this measure 9.6 Complies - as no data related to gifted assets, negotiated connection services or connection service have been reported under this measure, in line with the requirements of the RIN 9.7 Not applicable to this metric 9.8 Not applicable to this metric 9.9 Not applicable to this metric 9.10 Not applicable to this metric 9.11 Not applicable to this metric
CACP2.5BOP11 2.5 Connections TABLE 2.5.1 DESCRIPTOR METRICS SUBDIVISION - Cost per lot ($0'S) [VOLUMES AND EXPENDITURE]
Actual Source SAP Business Intelligence report for Customer Projects
N/A There are no Urban Residential Subdivisions in CitiPower. High rise apartments and dual & multiple developments are excluded.
N/A 9.1 Not Applicable to CitiPower as per AER advice 9.2 Complies 9.3 Complies - Opex costs do not apply to connections 9.4 Complies - Gross amounts used 9.5 Complies - Includes all regulated connection services 9.6 Complies - Only the non contestable component i.e. tie in and shared augmentation work has been included for contestable services. 9.7 Not Applicable for this variable 9.8 Complies - Only includes connections as per appendix F 9.9 Complies - Only the work for the connection has been included. No augmentation is reported twice 9.10 Not Applicable for this variable 9.11 Not Applicable for this variable
CACP2.5BOP12 2.5 Connections TABLE 2.5.1 DESCRIPTOR METRICS EMBEDDED GENERATION - Underground connections (0's) [VOLUMES AND EXPENDITURE] EMBEDDED GENERATION - Overhead connections (0's) [VOLUMES AND EXPENDITURE]
Actual N/A N/A CitiPower has assessed the requirements for this category and believe it is reasonable to specify there is no data. However, should an estimate be required, it is immaterial in volume. The volume of brand new connections that include embedded generation is immaterial in volume, and CitiPower has estimated that this category makes up only 1% of the total. Hence it is reasonable to assume the data as NIL.
N/A 9.1 Not applicable to CitiPower as per AER advice 9.2 Not applicable to this metric 9.3 Not applicable to this metric 9.4 Not applicable to this metric 9.5 Complies - only data relating to non-contestable, regulated connection services has been used in this measure 9.6 Complies - as no data related to gifted assets, negotiated connection services or connection services have been reported under this measure, in line with the requirements of the RIN 9.7 Not applicable to this metric 9.8 Not applicable to this metric 9.9 Not applicable to this metric 9.10 Not applicable to this metric
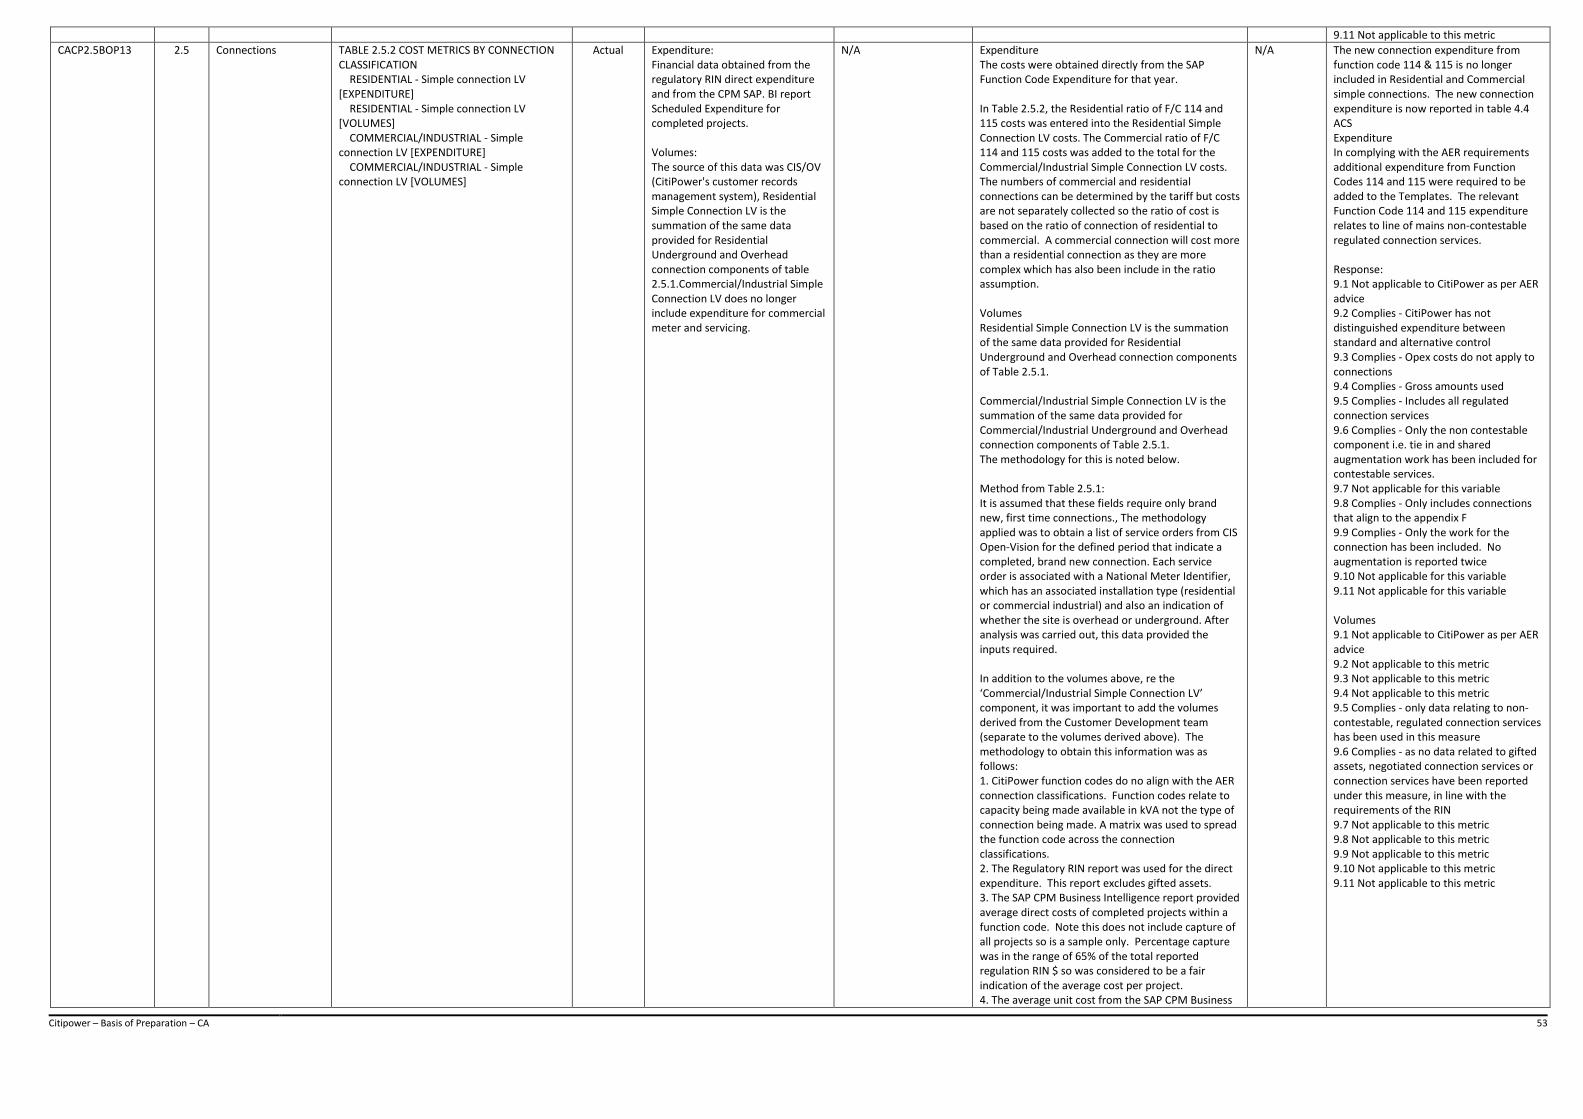
Citipower – Basis of Preparation – CA 53
9.11 Not applicable to this metric
CACP2.5BOP13 2.5 Connections TABLE 2.5.2 COST METRICS BY CONNECTION CLASSIFICATION RESIDENTIAL - Simple connection LV [EXPENDITURE] RESIDENTIAL - Simple connection LV [VOLUMES] COMMERCIAL/INDUSTRIAL - Simple connection LV [EXPENDITURE] COMMERCIAL/INDUSTRIAL - Simple connection LV [VOLUMES]
Actual Expenditure: Financial data obtained from the regulatory RIN direct expenditure and from the CPM SAP. BI report Scheduled Expenditure for completed projects. Volumes: The source of this data was CIS/OV (CitiPower's customer records management system), Residential Simple Connection LV is the summation of the same data provided for Residential Underground and Overhead connection components of table 2.5.1.Commercial/Industrial Simple Connection LV does no longer include expenditure for commercial meter and servicing.
N/A Expenditure The costs were obtained directly from the SAP Function Code Expenditure for that year. In Table 2.5.2, the Residential ratio of F/C 114 and 115 costs was entered into the Residential Simple Connection LV costs. The Commercial ratio of F/C 114 and 115 costs was added to the total for the Commercial/Industrial Simple Connection LV costs. The numbers of commercial and residential connections can be determined by the tariff but costs are not separately collected so the ratio of cost is based on the ratio of connection of residential to commercial. A commercial connection will cost more than a residential connection as they are more complex which has also been include in the ratio assumption. Volumes Residential Simple Connection LV is the summation of the same data provided for Residential Underground and Overhead connection components of Table 2.5.1. Commercial/Industrial Simple Connection LV is the summation of the same data provided for Commercial/Industrial Underground and Overhead connection components of Table 2.5.1. The methodology for this is noted below. Method from Table 2.5.1: It is assumed that these fields require only brand new, first time connections., The methodology applied was to obtain a list of service orders from CIS Open-Vision for the defined period that indicate a completed, brand new connection. Each service order is associated with a National Meter Identifier, which has an associated installation type (residential or commercial industrial) and also an indication of whether the site is overhead or underground. After analysis was carried out, this data provided the inputs required. In addition to the volumes above, re the ‘Commercial/Industrial Simple Connection LV’ component, it was important to add the volumes derived from the Customer Development team (separate to the volumes derived above). The methodology to obtain this information was as follows: 1. CitiPower function codes do no align with the AER connection classifications. Function codes relate to capacity being made available in kVA not the type of connection being made. A matrix was used to spread the function code across the connection classifications. 2. The Regulatory RIN report was used for the direct expenditure. This report excludes gifted assets. 3. The SAP CPM Business Intelligence report provided average direct costs of completed projects within a function code. Note this does not include capture of all projects so is a sample only. Percentage capture was in the range of 65% of the total reported regulation RIN $ so was considered to be a fair indication of the average cost per project. 4. The average unit cost from the SAP CPM Business
N/A The new connection expenditure from function code 114 & 115 is no longer included in Residential and Commercial simple connections. The new connection expenditure is now reported in table 4.4 ACS Expenditure In complying with the AER requirements additional expenditure from Function Codes 114 and 115 were required to be added to the Templates. The relevant Function Code 114 and 115 expenditure relates to line of mains non-contestable regulated connection services. Response: 9.1 Not applicable to CitiPower as per AER advice 9.2 Complies - CitiPower has not distinguished expenditure between standard and alternative control 9.3 Complies - Opex costs do not apply to connections 9.4 Complies - Gross amounts used 9.5 Complies - Includes all regulated connection services 9.6 Complies - Only the non contestable component i.e. tie in and shared augmentation work has been included for contestable services. 9.7 Not applicable for this variable 9.8 Complies - Only includes connections that align to the appendix F 9.9 Complies - Only the work for the connection has been included. No augmentation is reported twice 9.10 Not applicable for this variable 9.11 Not applicable for this variable Volumes 9.1 Not applicable to CitiPower as per AER advice 9.2 Not applicable to this metric 9.3 Not applicable to this metric 9.4 Not applicable to this metric 9.5 Complies - only data relating to non-contestable, regulated connection services has been used in this measure 9.6 Complies - as no data related to gifted assets, negotiated connection services or connection services have been reported under this measure, in line with the requirements of the RIN 9.7 Not applicable to this metric 9.8 Not applicable to this metric 9.9 Not applicable to this metric 9.10 Not applicable to this metric 9.11 Not applicable to this metric
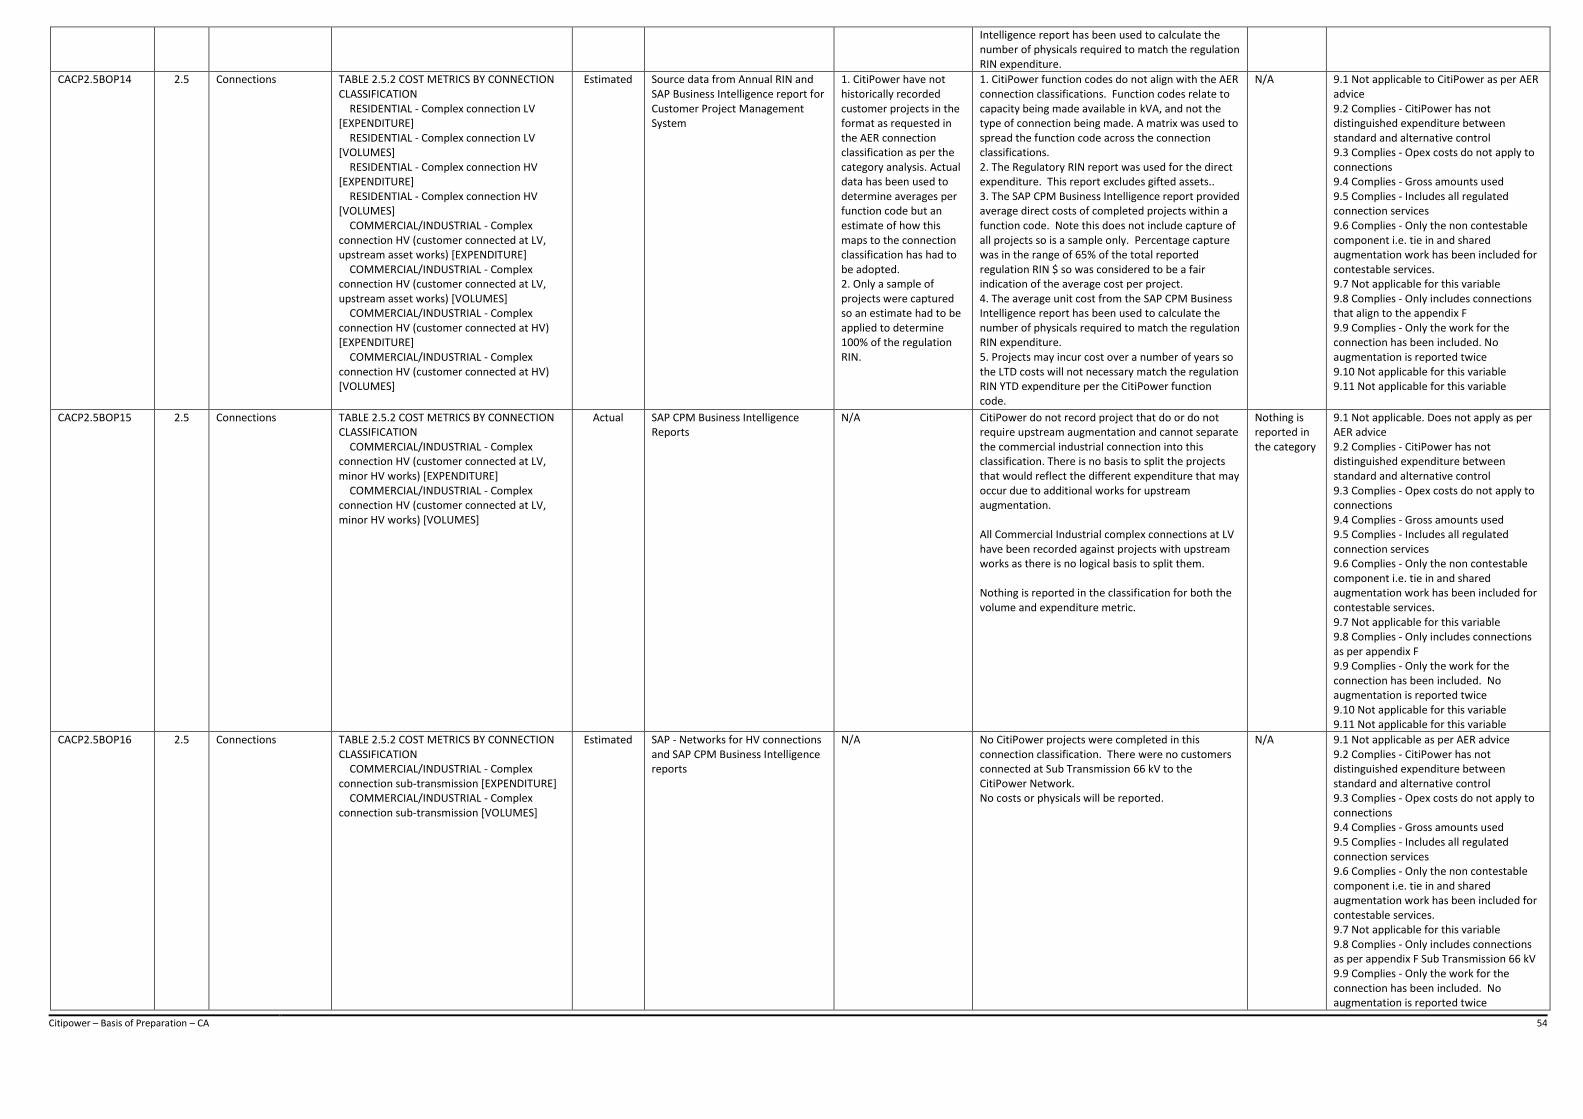
Citipower – Basis of Preparation – CA 54
Intelligence report has been used to calculate the number of physicals required to match the regulation RIN expenditure.
CACP2.5BOP14 2.5 Connections TABLE 2.5.2 COST METRICS BY CONNECTION CLASSIFICATION RESIDENTIAL - Complex connection LV [EXPENDITURE] RESIDENTIAL - Complex connection LV [VOLUMES] RESIDENTIAL - Complex connection HV [EXPENDITURE] RESIDENTIAL - Complex connection HV [VOLUMES] COMMERCIAL/INDUSTRIAL - Complex connection HV (customer connected at LV, upstream asset works) [EXPENDITURE] COMMERCIAL/INDUSTRIAL - Complex connection HV (customer connected at LV, upstream asset works) [VOLUMES] COMMERCIAL/INDUSTRIAL - Complex connection HV (customer connected at HV) [EXPENDITURE] COMMERCIAL/INDUSTRIAL - Complex connection HV (customer connected at HV) [VOLUMES]
Estimated Source data from Annual RIN and SAP Business Intelligence report for Customer Project Management System
1. CitiPower have not historically recorded customer projects in the format as requested in the AER connection classification as per the category analysis. Actual data has been used to determine averages per function code but an estimate of how this maps to the connection classification has had to be adopted. 2. Only a sample of projects were captured so an estimate had to be applied to determine 100% of the regulation RIN.
1. CitiPower function codes do not align with the AER connection classifications. Function codes relate to capacity being made available in kVA, and not the type of connection being made. A matrix was used to spread the function code across the connection classifications. 2. The Regulatory RIN report was used for the direct expenditure. This report excludes gifted assets.. 3. The SAP CPM Business Intelligence report provided average direct costs of completed projects within a function code. Note this does not include capture of all projects so is a sample only. Percentage capture was in the range of 65% of the total reported regulation RIN $ so was considered to be a fair indication of the average cost per project. 4. The average unit cost from the SAP CPM Business Intelligence report has been used to calculate the number of physicals required to match the regulation RIN expenditure. 5. Projects may incur cost over a number of years so the LTD costs will not necessary match the regulation RIN YTD expenditure per the CitiPower function code.
N/A 9.1 Not applicable to CitiPower as per AER advice 9.2 Complies - CitiPower has not distinguished expenditure between standard and alternative control 9.3 Complies - Opex costs do not apply to connections 9.4 Complies - Gross amounts used 9.5 Complies - Includes all regulated connection services 9.6 Complies - Only the non contestable component i.e. tie in and shared augmentation work has been included for contestable services. 9.7 Not applicable for this variable 9.8 Complies - Only includes connections that align to the appendix F 9.9 Complies - Only the work for the connection has been included. No augmentation is reported twice 9.10 Not applicable for this variable 9.11 Not applicable for this variable
CACP2.5BOP15 2.5 Connections TABLE 2.5.2 COST METRICS BY CONNECTION CLASSIFICATION COMMERCIAL/INDUSTRIAL - Complex connection HV (customer connected at LV, minor HV works) [EXPENDITURE] COMMERCIAL/INDUSTRIAL - Complex connection HV (customer connected at LV, minor HV works) [VOLUMES]
Actual SAP CPM Business Intelligence Reports
N/A CitiPower do not record project that do or do not require upstream augmentation and cannot separate the commercial industrial connection into this classification. There is no basis to split the projects that would reflect the different expenditure that may occur due to additional works for upstream augmentation. All Commercial Industrial complex connections at LV have been recorded against projects with upstream works as there is no logical basis to split them. Nothing is reported in the classification for both the volume and expenditure metric.
Nothing is reported in the category
9.1 Not applicable. Does not apply as per AER advice 9.2 Complies - CitiPower has not distinguished expenditure between standard and alternative control 9.3 Complies - Opex costs do not apply to connections 9.4 Complies - Gross amounts used 9.5 Complies - Includes all regulated connection services 9.6 Complies - Only the non contestable component i.e. tie in and shared augmentation work has been included for contestable services. 9.7 Not applicable for this variable 9.8 Complies - Only includes connections as per appendix F 9.9 Complies - Only the work for the connection has been included. No augmentation is reported twice 9.10 Not applicable for this variable 9.11 Not applicable for this variable
CACP2.5BOP16 2.5 Connections TABLE 2.5.2 COST METRICS BY CONNECTION CLASSIFICATION COMMERCIAL/INDUSTRIAL - Complex connection sub-transmission [EXPENDITURE] COMMERCIAL/INDUSTRIAL - Complex connection sub-transmission [VOLUMES]
Estimated SAP - Networks for HV connections and SAP CPM Business Intelligence reports
N/A No CitiPower projects were completed in this connection classification. There were no customers connected at Sub Transmission 66 kV to the CitiPower Network. No costs or physicals will be reported.
N/A 9.1 Not applicable as per AER advice 9.2 Complies - CitiPower has not distinguished expenditure between standard and alternative control 9.3 Complies - Opex costs do not apply to connections 9.4 Complies - Gross amounts used 9.5 Complies - Includes all regulated connection services 9.6 Complies - Only the non contestable component i.e. tie in and shared augmentation work has been included for contestable services. 9.7 Not applicable for this variable 9.8 Complies - Only includes connections as per appendix F Sub Transmission 66 kV 9.9 Complies - Only the work for the connection has been included. No augmentation is reported twice
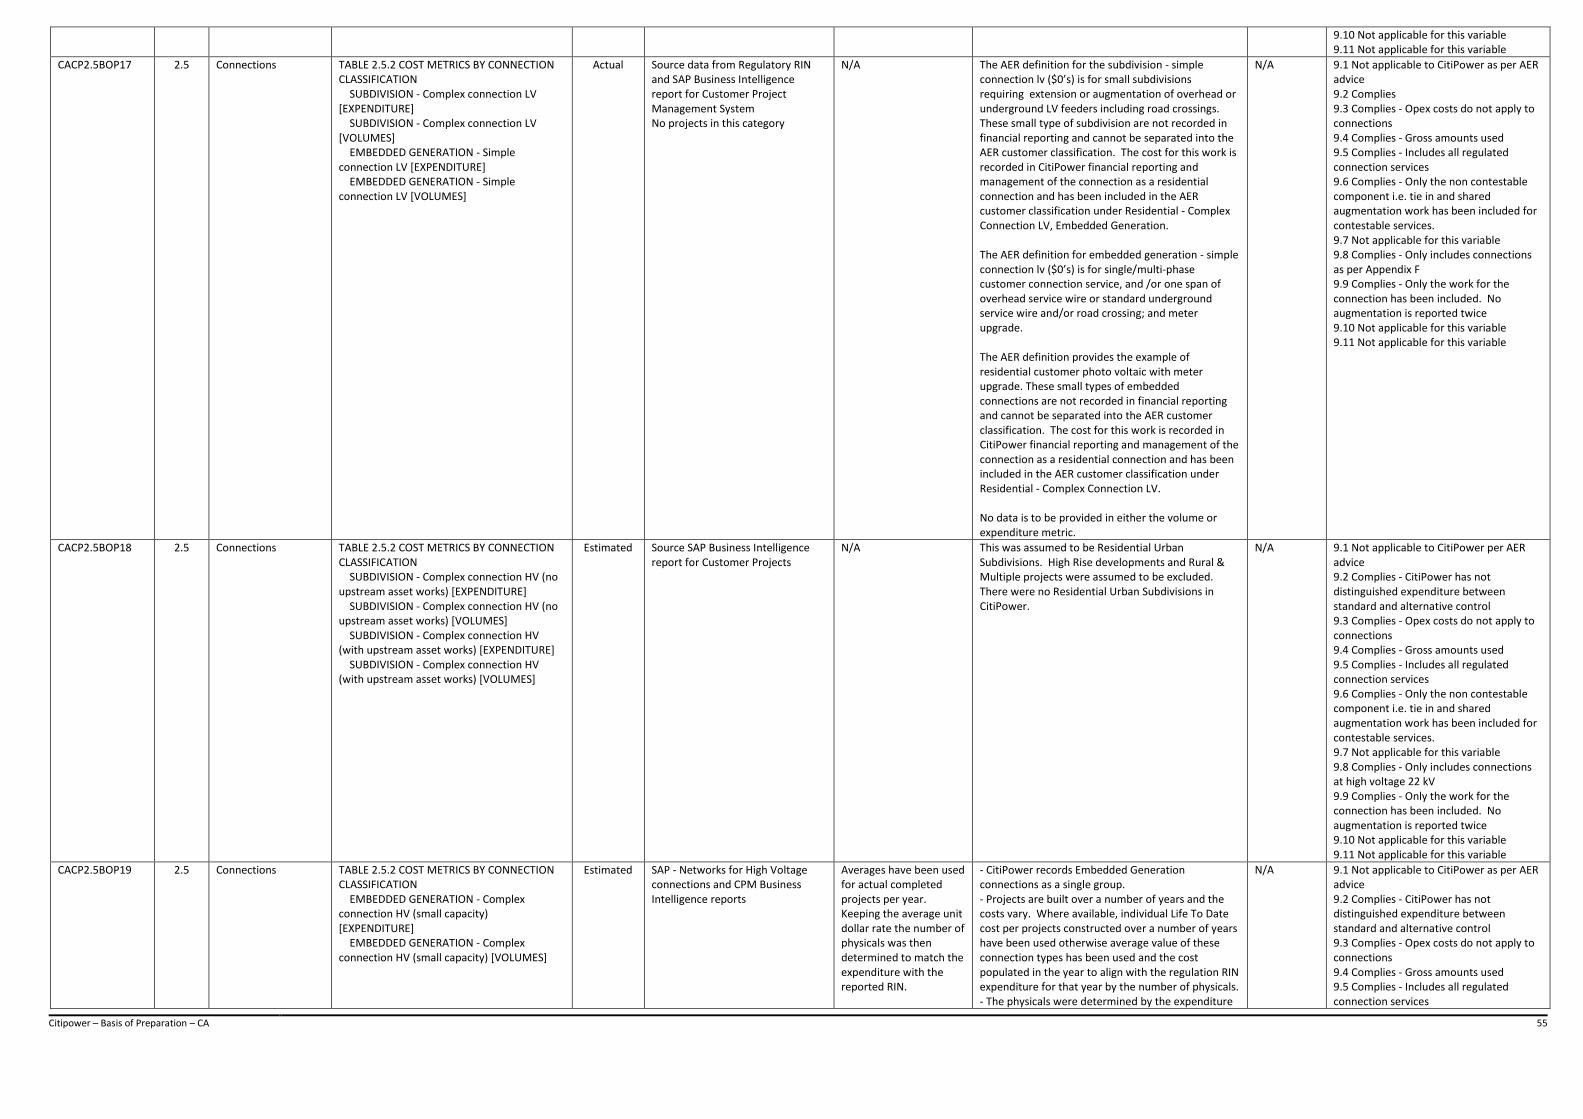
Citipower – Basis of Preparation – CA 55
9.10 Not applicable for this variable 9.11 Not applicable for this variable
CACP2.5BOP17 2.5 Connections TABLE 2.5.2 COST METRICS BY CONNECTION CLASSIFICATION SUBDIVISION - Complex connection LV [EXPENDITURE] SUBDIVISION - Complex connection LV [VOLUMES] EMBEDDED GENERATION - Simple connection LV [EXPENDITURE] EMBEDDED GENERATION - Simple connection LV [VOLUMES]
Actual Source data from Regulatory RIN and SAP Business Intelligence report for Customer Project Management System No projects in this category
N/A The AER definition for the subdivision - simple connection lv ($0’s) is for small subdivisions requiring extension or augmentation of overhead or underground LV feeders including road crossings. These small type of subdivision are not recorded in financial reporting and cannot be separated into the AER customer classification. The cost for this work is recorded in CitiPower financial reporting and management of the connection as a residential connection and has been included in the AER customer classification under Residential - Complex Connection LV, Embedded Generation. The AER definition for embedded generation - simple connection lv ($0’s) is for single/multi-phase customer connection service, and /or one span of overhead service wire or standard underground service wire and/or road crossing; and meter upgrade. The AER definition provides the example of residential customer photo voltaic with meter upgrade. These small types of embedded connections are not recorded in financial reporting and cannot be separated into the AER customer classification. The cost for this work is recorded in CitiPower financial reporting and management of the connection as a residential connection and has been included in the AER customer classification under Residential - Complex Connection LV. No data is to be provided in either the volume or expenditure metric.
N/A 9.1 Not applicable to CitiPower as per AER advice 9.2 Complies 9.3 Complies - Opex costs do not apply to connections 9.4 Complies - Gross amounts used 9.5 Complies - Includes all regulated connection services 9.6 Complies - Only the non contestable component i.e. tie in and shared augmentation work has been included for contestable services. 9.7 Not applicable for this variable 9.8 Complies - Only includes connections as per Appendix F 9.9 Complies - Only the work for the connection has been included. No augmentation is reported twice 9.10 Not applicable for this variable 9.11 Not applicable for this variable
CACP2.5BOP18 2.5 Connections TABLE 2.5.2 COST METRICS BY CONNECTION CLASSIFICATION SUBDIVISION - Complex connection HV (no upstream asset works) [EXPENDITURE] SUBDIVISION - Complex connection HV (no upstream asset works) [VOLUMES] SUBDIVISION - Complex connection HV (with upstream asset works) [EXPENDITURE] SUBDIVISION - Complex connection HV (with upstream asset works) [VOLUMES]
Estimated Source SAP Business Intelligence report for Customer Projects
N/A This was assumed to be Residential Urban Subdivisions. High Rise developments and Rural & Multiple projects were assumed to be excluded. There were no Residential Urban Subdivisions in CitiPower.
N/A 9.1 Not applicable to CitiPower per AER advice 9.2 Complies - CitiPower has not distinguished expenditure between standard and alternative control 9.3 Complies - Opex costs do not apply to connections 9.4 Complies - Gross amounts used 9.5 Complies - Includes all regulated connection services 9.6 Complies - Only the non contestable component i.e. tie in and shared augmentation work has been included for contestable services. 9.7 Not applicable for this variable 9.8 Complies - Only includes connections at high voltage 22 kV 9.9 Complies - Only the work for the connection has been included. No augmentation is reported twice 9.10 Not applicable for this variable 9.11 Not applicable for this variable
CACP2.5BOP19 2.5 Connections TABLE 2.5.2 COST METRICS BY CONNECTION CLASSIFICATION EMBEDDED GENERATION - Complex connection HV (small capacity) [EXPENDITURE] EMBEDDED GENERATION - Complex connection HV (small capacity) [VOLUMES]
Estimated SAP - Networks for High Voltage connections and CPM Business Intelligence reports
Averages have been used for actual completed projects per year. Keeping the average unit dollar rate the number of physicals was then determined to match the expenditure with the reported RIN.
- CitiPower records Embedded Generation connections as a single group. - Projects are built over a number of years and the costs vary. Where available, individual Life To Date cost per projects constructed over a number of years have been used otherwise average value of these connection types has been used and the cost populated in the year to align with the regulation RIN expenditure for that year by the number of physicals. - The physicals were determined by the expenditure
N/A 9.1 Not applicable to CitiPower as per AER advice 9.2 Complies - CitiPower has not distinguished expenditure between standard and alternative control 9.3 Complies - Opex costs do not apply to connections 9.4 Complies - Gross amounts used 9.5 Complies - Includes all regulated connection services
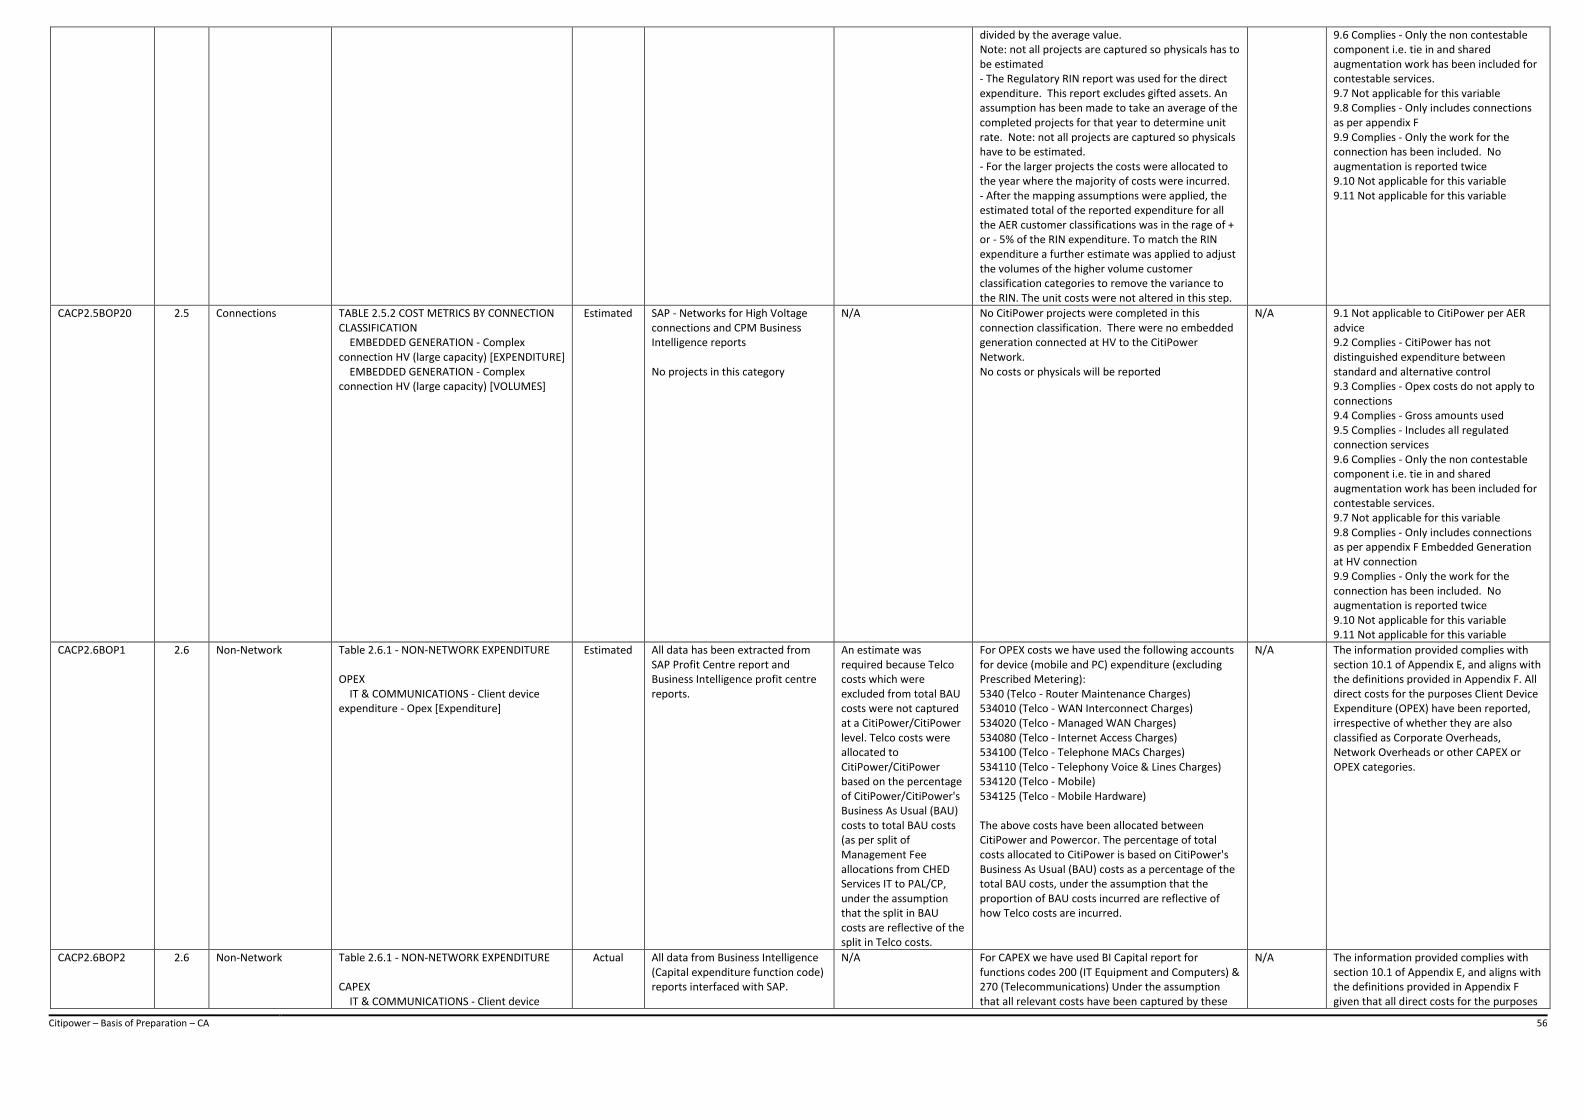
Citipower – Basis of Preparation – CA 56
divided by the average value. Note: not all projects are captured so physicals has to be estimated - The Regulatory RIN report was used for the direct expenditure. This report excludes gifted assets. An assumption has been made to take an average of the completed projects for that year to determine unit rate. Note: not all projects are captured so physicals have to be estimated. - For the larger projects the costs were allocated to the year where the majority of costs were incurred. - After the mapping assumptions were applied, the estimated total of the reported expenditure for all the AER customer classifications was in the rage of + or - 5% of the RIN expenditure. To match the RIN expenditure a further estimate was applied to adjust the volumes of the higher volume customer classification categories to remove the variance to the RIN. The unit costs were not altered in this step.
9.6 Complies - Only the non contestable component i.e. tie in and shared augmentation work has been included for contestable services. 9.7 Not applicable for this variable 9.8 Complies - Only includes connections as per appendix F 9.9 Complies - Only the work for the connection has been included. No augmentation is reported twice 9.10 Not applicable for this variable 9.11 Not applicable for this variable
CACP2.5BOP20 2.5 Connections TABLE 2.5.2 COST METRICS BY CONNECTION CLASSIFICATION EMBEDDED GENERATION - Complex connection HV (large capacity) [EXPENDITURE] EMBEDDED GENERATION - Complex connection HV (large capacity) [VOLUMES]
Estimated SAP - Networks for High Voltage connections and CPM Business Intelligence reports No projects in this category
N/A No CitiPower projects were completed in this connection classification. There were no embedded generation connected at HV to the CitiPower Network. No costs or physicals will be reported
N/A 9.1 Not applicable to CitiPower per AER advice 9.2 Complies - CitiPower has not distinguished expenditure between standard and alternative control 9.3 Complies - Opex costs do not apply to connections 9.4 Complies - Gross amounts used 9.5 Complies - Includes all regulated connection services 9.6 Complies - Only the non contestable component i.e. tie in and shared augmentation work has been included for contestable services. 9.7 Not applicable for this variable 9.8 Complies - Only includes connections as per appendix F Embedded Generation at HV connection 9.9 Complies - Only the work for the connection has been included. No augmentation is reported twice 9.10 Not applicable for this variable 9.11 Not applicable for this variable
CACP2.6BOP1 2.6 Non-Network Table 2.6.1 - NON-NETWORK EXPENDITURE OPEX IT & COMMUNICATIONS - Client device expenditure - Opex [Expenditure]
Estimated All data has been extracted from SAP Profit Centre report and Business Intelligence profit centre reports.
An estimate was required because Telco costs which were excluded from total BAU costs were not captured at a CitiPower/CitiPower level. Telco costs were allocated to CitiPower/CitiPower based on the percentage of CitiPower/CitiPower's Business As Usual (BAU) costs to total BAU costs (as per split of Management Fee allocations from CHED Services IT to PAL/CP, under the assumption that the split in BAU costs are reflective of the split in Telco costs.
For OPEX costs we have used the following accounts for device (mobile and PC) expenditure (excluding Prescribed Metering): 5340 (Telco - Router Maintenance Charges) 534010 (Telco - WAN Interconnect Charges) 534020 (Telco - Managed WAN Charges) 534080 (Telco - Internet Access Charges) 534100 (Telco - Telephone MACs Charges) 534110 (Telco - Telephony Voice & Lines Charges) 534120 (Telco - Mobile) 534125 (Telco - Mobile Hardware) The above costs have been allocated between CitiPower and Powercor. The percentage of total costs allocated to CitiPower is based on CitiPower's Business As Usual (BAU) costs as a percentage of the total BAU costs, under the assumption that the proportion of BAU costs incurred are reflective of how Telco costs are incurred.
N/A The information provided complies with section 10.1 of Appendix E, and aligns with the definitions provided in Appendix F. All direct costs for the purposes Client Device Expenditure (OPEX) have been reported, irrespective of whether they are also classified as Corporate Overheads, Network Overheads or other CAPEX or OPEX categories.
CACP2.6BOP2 2.6 Non-Network Table 2.6.1 - NON-NETWORK EXPENDITURE CAPEX IT & COMMUNICATIONS - Client device
Actual All data from Business Intelligence (Capital expenditure function code) reports interfaced with SAP.
N/A For CAPEX we have used BI Capital report for functions codes 200 (IT Equipment and Computers) & 270 (Telecommunications) Under the assumption that all relevant costs have been captured by these
N/A The information provided complies with section 10.1 of Appendix E, and aligns with the definitions provided in Appendix F given that all direct costs for the purposes
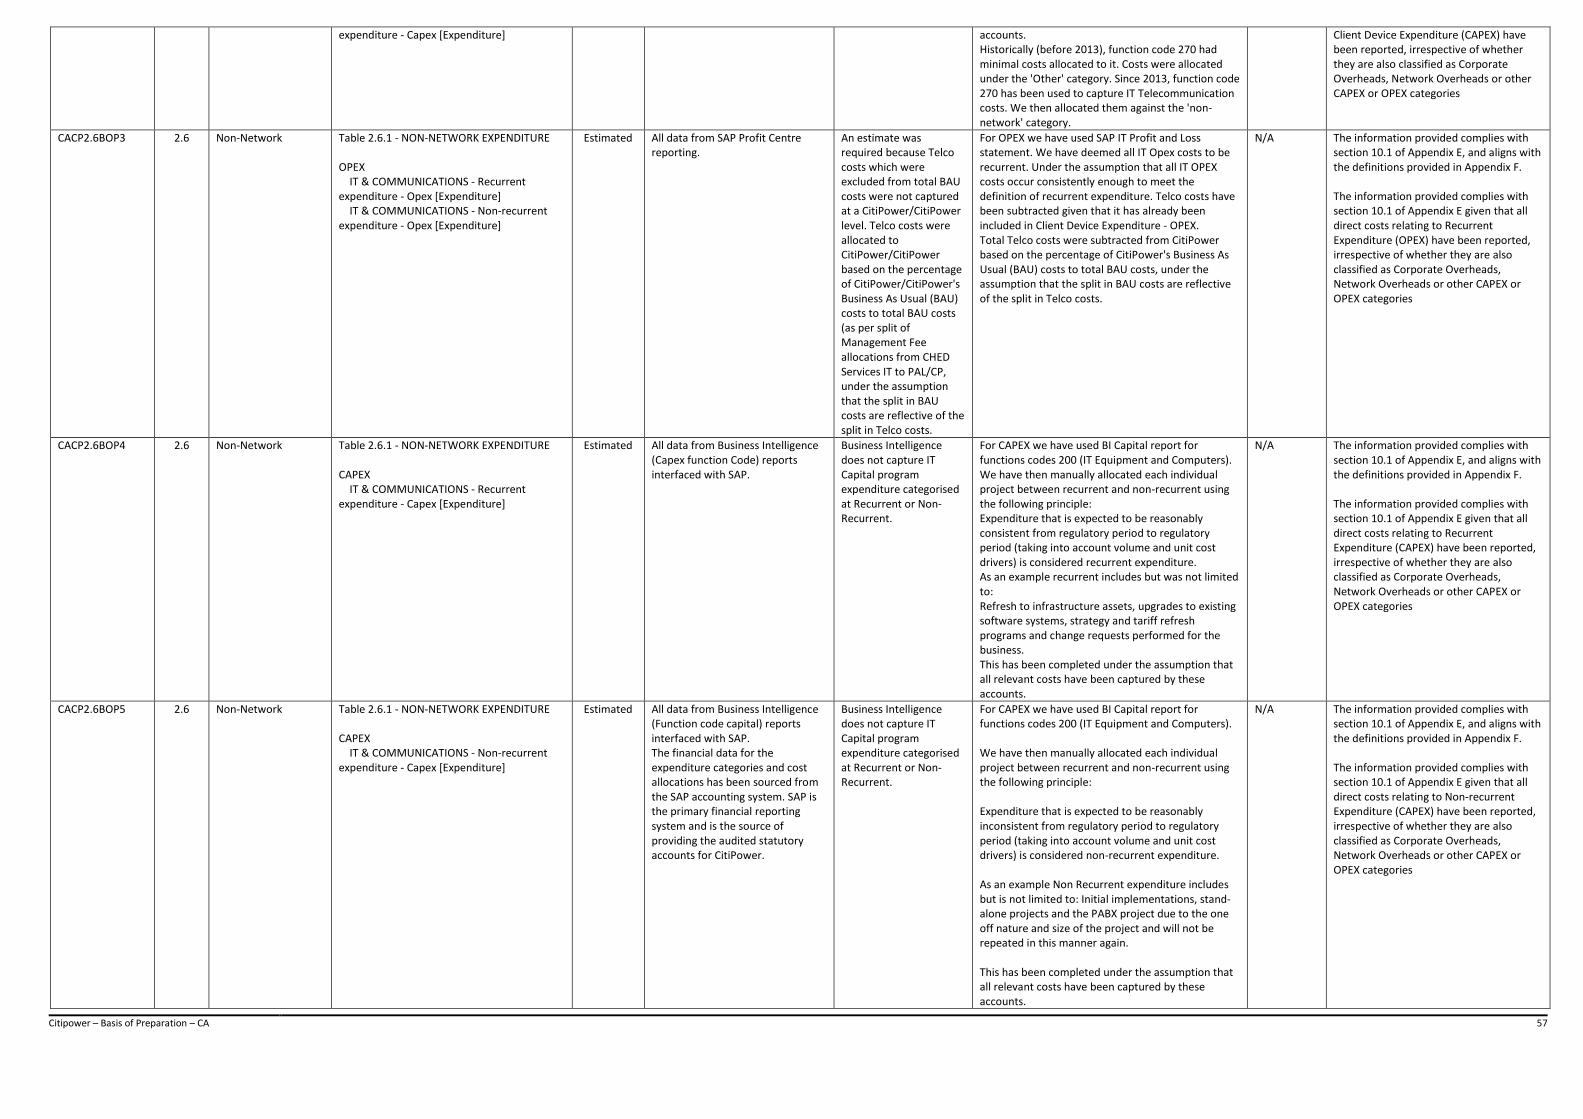
Citipower – Basis of Preparation – CA 57
expenditure - Capex [Expenditure] accounts. Historically (before 2013), function code 270 had minimal costs allocated to it. Costs were allocated under the 'Other' category. Since 2013, function code 270 has been used to capture IT Telecommunication costs. We then allocated them against the 'non-network' category.
Client Device Expenditure (CAPEX) have been reported, irrespective of whether they are also classified as Corporate Overheads, Network Overheads or other CAPEX or OPEX categories
CACP2.6BOP3 2.6 Non-Network Table 2.6.1 - NON-NETWORK EXPENDITURE OPEX IT & COMMUNICATIONS - Recurrent expenditure - Opex [Expenditure] IT & COMMUNICATIONS - Non-recurrent expenditure - Opex [Expenditure]
Estimated All data from SAP Profit Centre reporting.
An estimate was required because Telco costs which were excluded from total BAU costs were not captured at a CitiPower/CitiPower level. Telco costs were allocated to CitiPower/CitiPower based on the percentage of CitiPower/CitiPower's Business As Usual (BAU) costs to total BAU costs (as per split of Management Fee allocations from CHED Services IT to PAL/CP, under the assumption that the split in BAU costs are reflective of the split in Telco costs.
For OPEX we have used SAP IT Profit and Loss statement. We have deemed all IT Opex costs to be recurrent. Under the assumption that all IT OPEX costs occur consistently enough to meet the definition of recurrent expenditure. Telco costs have been subtracted given that it has already been included in Client Device Expenditure - OPEX. Total Telco costs were subtracted from CitiPower based on the percentage of CitiPower's Business As Usual (BAU) costs to total BAU costs, under the assumption that the split in BAU costs are reflective of the split in Telco costs.
N/A The information provided complies with section 10.1 of Appendix E, and aligns with the definitions provided in Appendix F. The information provided complies with section 10.1 of Appendix E given that all direct costs relating to Recurrent Expenditure (OPEX) have been reported, irrespective of whether they are also classified as Corporate Overheads, Network Overheads or other CAPEX or OPEX categories
CACP2.6BOP4 2.6 Non-Network Table 2.6.1 - NON-NETWORK EXPENDITURE CAPEX IT & COMMUNICATIONS - Recurrent expenditure - Capex [Expenditure]
Estimated All data from Business Intelligence (Capex function Code) reports interfaced with SAP.
Business Intelligence does not capture IT Capital program expenditure categorised at Recurrent or Non-Recurrent.
For CAPEX we have used BI Capital report for functions codes 200 (IT Equipment and Computers). We have then manually allocated each individual project between recurrent and non-recurrent using the following principle: Expenditure that is expected to be reasonably consistent from regulatory period to regulatory period (taking into account volume and unit cost drivers) is considered recurrent expenditure. As an example recurrent includes but was not limited to: Refresh to infrastructure assets, upgrades to existing software systems, strategy and tariff refresh programs and change requests performed for the business. This has been completed under the assumption that all relevant costs have been captured by these accounts.
N/A The information provided complies with section 10.1 of Appendix E, and aligns with the definitions provided in Appendix F. The information provided complies with section 10.1 of Appendix E given that all direct costs relating to Recurrent Expenditure (CAPEX) have been reported, irrespective of whether they are also classified as Corporate Overheads, Network Overheads or other CAPEX or OPEX categories
CACP2.6BOP5 2.6 Non-Network Table 2.6.1 - NON-NETWORK EXPENDITURE CAPEX IT & COMMUNICATIONS - Non-recurrent expenditure - Capex [Expenditure]
Estimated All data from Business Intelligence (Function code capital) reports interfaced with SAP. The financial data for the expenditure categories and cost allocations has been sourced from the SAP accounting system. SAP is the primary financial reporting system and is the source of providing the audited statutory accounts for CitiPower.
Business Intelligence does not capture IT Capital program expenditure categorised at Recurrent or Non-Recurrent.
For CAPEX we have used BI Capital report for functions codes 200 (IT Equipment and Computers). We have then manually allocated each individual project between recurrent and non-recurrent using the following principle: Expenditure that is expected to be reasonably inconsistent from regulatory period to regulatory period (taking into account volume and unit cost drivers) is considered non-recurrent expenditure. As an example Non Recurrent expenditure includes but is not limited to: Initial implementations, stand-alone projects and the PABX project due to the one off nature and size of the project and will not be repeated in this manner again. This has been completed under the assumption that all relevant costs have been captured by these accounts.
N/A The information provided complies with section 10.1 of Appendix E, and aligns with the definitions provided in Appendix F. The information provided complies with section 10.1 of Appendix E given that all direct costs relating to Non-recurrent Expenditure (CAPEX) have been reported, irrespective of whether they are also classified as Corporate Overheads, Network Overheads or other CAPEX or OPEX categories
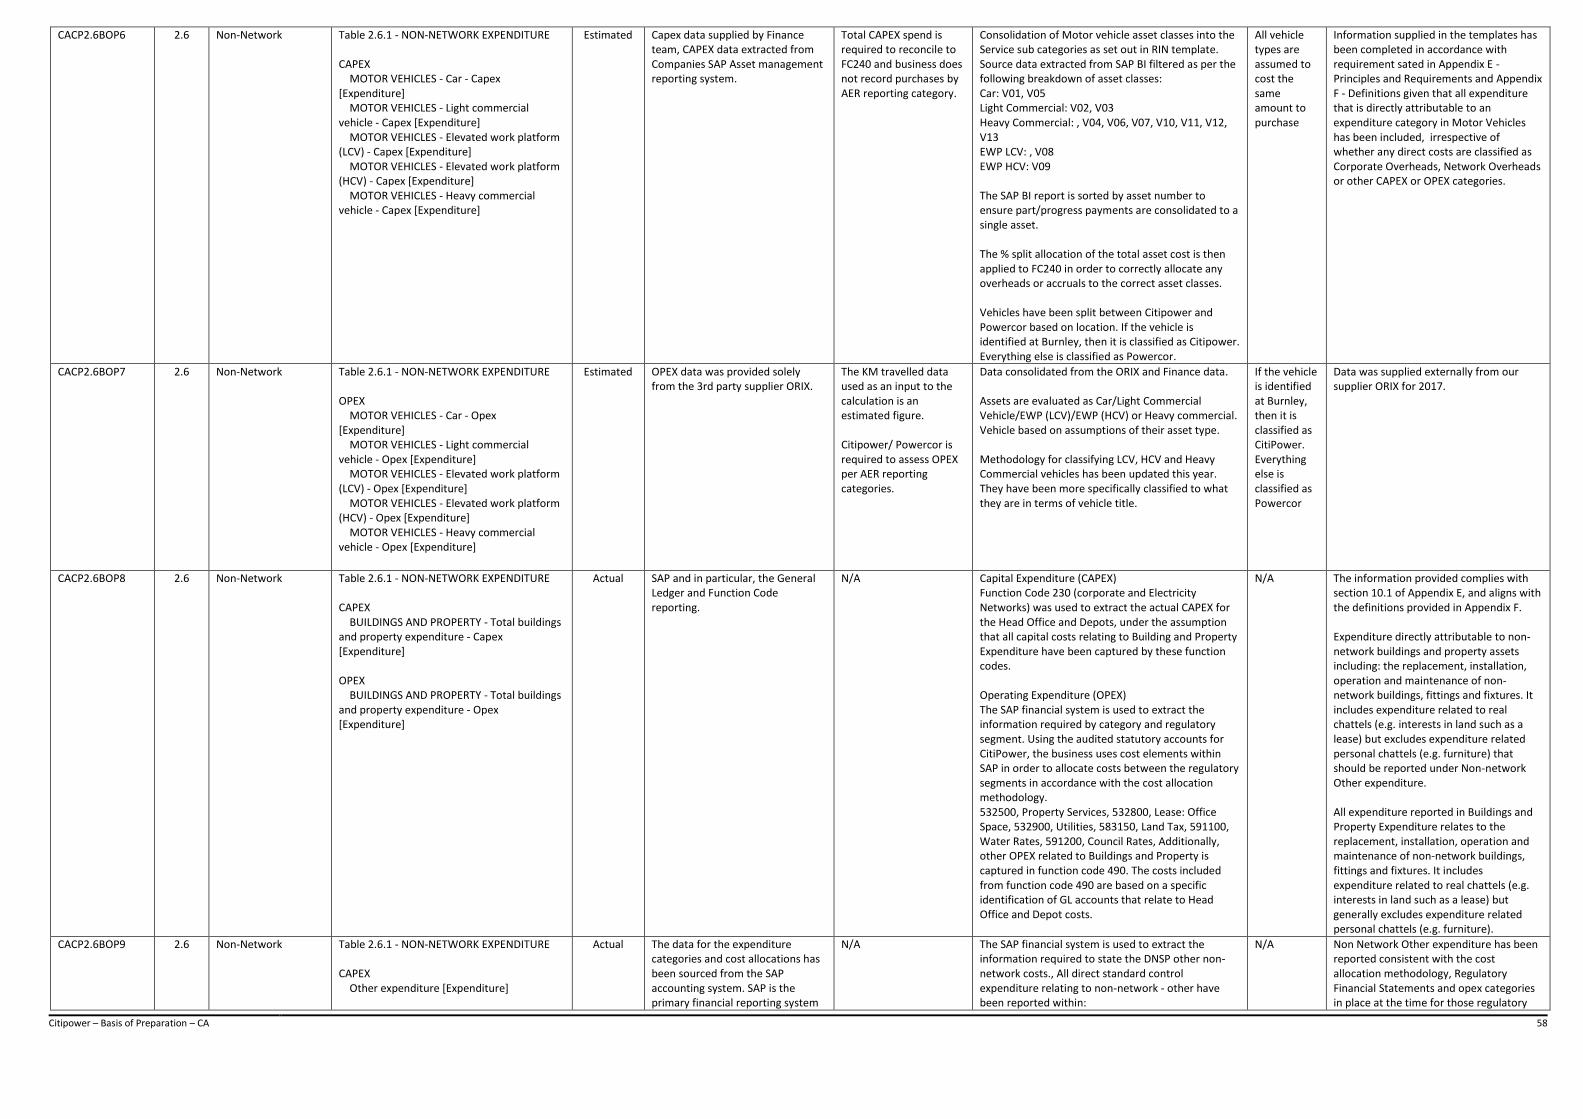
Citipower – Basis of Preparation – CA 58
CACP2.6BOP6 2.6 Non-Network Table 2.6.1 - NON-NETWORK EXPENDITURE CAPEX MOTOR VEHICLES - Car - Capex [Expenditure] MOTOR VEHICLES - Light commercial vehicle - Capex [Expenditure] MOTOR VEHICLES - Elevated work platform (LCV) - Capex [Expenditure] MOTOR VEHICLES - Elevated work platform (HCV) - Capex [Expenditure] MOTOR VEHICLES - Heavy commercial vehicle - Capex [Expenditure]
Estimated Capex data supplied by Finance team, CAPEX data extracted from Companies SAP Asset management reporting system.
Total CAPEX spend is required to reconcile to FC240 and business does not record purchases by AER reporting category.
Consolidation of Motor vehicle asset classes into the Service sub categories as set out in RIN template. Source data extracted from SAP BI filtered as per the following breakdown of asset classes: Car: V01, V05 Light Commercial: V02, V03 Heavy Commercial: , V04, V06, V07, V10, V11, V12, V13 EWP LCV: , V08 EWP HCV: V09 The SAP BI report is sorted by asset number to ensure part/progress payments are consolidated to a single asset. The % split allocation of the total asset cost is then applied to FC240 in order to correctly allocate any overheads or accruals to the correct asset classes. Vehicles have been split between Citipower and Powercor based on location. If the vehicle is identified at Burnley, then it is classified as Citipower. Everything else is classified as Powercor.
All vehicle types are assumed to cost the same amount to purchase
Information supplied in the templates has been completed in accordance with requirement sated in Appendix E - Principles and Requirements and Appendix F - Definitions given that all expenditure that is directly attributable to an expenditure category in Motor Vehicles has been included, irrespective of whether any direct costs are classified as Corporate Overheads, Network Overheads or other CAPEX or OPEX categories.
CACP2.6BOP7 2.6 Non-Network Table 2.6.1 - NON-NETWORK EXPENDITURE OPEX MOTOR VEHICLES - Car - Opex [Expenditure] MOTOR VEHICLES - Light commercial vehicle - Opex [Expenditure] MOTOR VEHICLES - Elevated work platform (LCV) - Opex [Expenditure] MOTOR VEHICLES - Elevated work platform (HCV) - Opex [Expenditure] MOTOR VEHICLES - Heavy commercial vehicle - Opex [Expenditure]
Estimated OPEX data was provided solely from the 3rd party supplier ORIX.
The KM travelled data used as an input to the calculation is an estimated figure. Citipower/ Powercor is required to assess OPEX per AER reporting categories.
Data consolidated from the ORIX and Finance data. Assets are evaluated as Car/Light Commercial Vehicle/EWP (LCV)/EWP (HCV) or Heavy commercial. Vehicle based on assumptions of their asset type. Methodology for classifying LCV, HCV and Heavy Commercial vehicles has been updated this year. They have been more specifically classified to what they are in terms of vehicle title.
If the vehicle is identified at Burnley, then it is classified as CitiPower. Everything else is classified as Powercor
Data was supplied externally from our supplier ORIX for 2017.
CACP2.6BOP8 2.6 Non-Network Table 2.6.1 - NON-NETWORK EXPENDITURE CAPEX BUILDINGS AND PROPERTY - Total buildings and property expenditure - Capex [Expenditure] OPEX BUILDINGS AND PROPERTY - Total buildings and property expenditure - Opex [Expenditure]
Actual SAP and in particular, the General Ledger and Function Code reporting.
N/A Capital Expenditure (CAPEX) Function Code 230 (corporate and Electricity Networks) was used to extract the actual CAPEX for the Head Office and Depots, under the assumption that all capital costs relating to Building and Property Expenditure have been captured by these function codes. Operating Expenditure (OPEX) The SAP financial system is used to extract the information required by category and regulatory segment. Using the audited statutory accounts for CitiPower, the business uses cost elements within SAP in order to allocate costs between the regulatory segments in accordance with the cost allocation methodology. 532500, Property Services, 532800, Lease: Office Space, 532900, Utilities, 583150, Land Tax, 591100, Water Rates, 591200, Council Rates, Additionally, other OPEX related to Buildings and Property is captured in function code 490. The costs included from function code 490 are based on a specific identification of GL accounts that relate to Head Office and Depot costs.
N/A The information provided complies with section 10.1 of Appendix E, and aligns with the definitions provided in Appendix F. Expenditure directly attributable to non-network buildings and property assets including: the replacement, installation, operation and maintenance of non-network buildings, fittings and fixtures. It includes expenditure related to real chattels (e.g. interests in land such as a lease) but excludes expenditure related personal chattels (e.g. furniture) that should be reported under Non-network Other expenditure. All expenditure reported in Buildings and Property Expenditure relates to the replacement, installation, operation and maintenance of non-network buildings, fittings and fixtures. It includes expenditure related to real chattels (e.g. interests in land such as a lease) but generally excludes expenditure related personal chattels (e.g. furniture).
CACP2.6BOP9 2.6 Non-Network Table 2.6.1 - NON-NETWORK EXPENDITURE CAPEX Other expenditure [Expenditure]
Actual The data for the expenditure categories and cost allocations has been sourced from the SAP accounting system. SAP is the primary financial reporting system
N/A The SAP financial system is used to extract the information required to state the DNSP other non-network costs., All direct standard control expenditure relating to non-network - other have been reported within:
N/A Non Network Other expenditure has been reported consistent with the cost allocation methodology, Regulatory Financial Statements and opex categories in place at the time for those regulatory
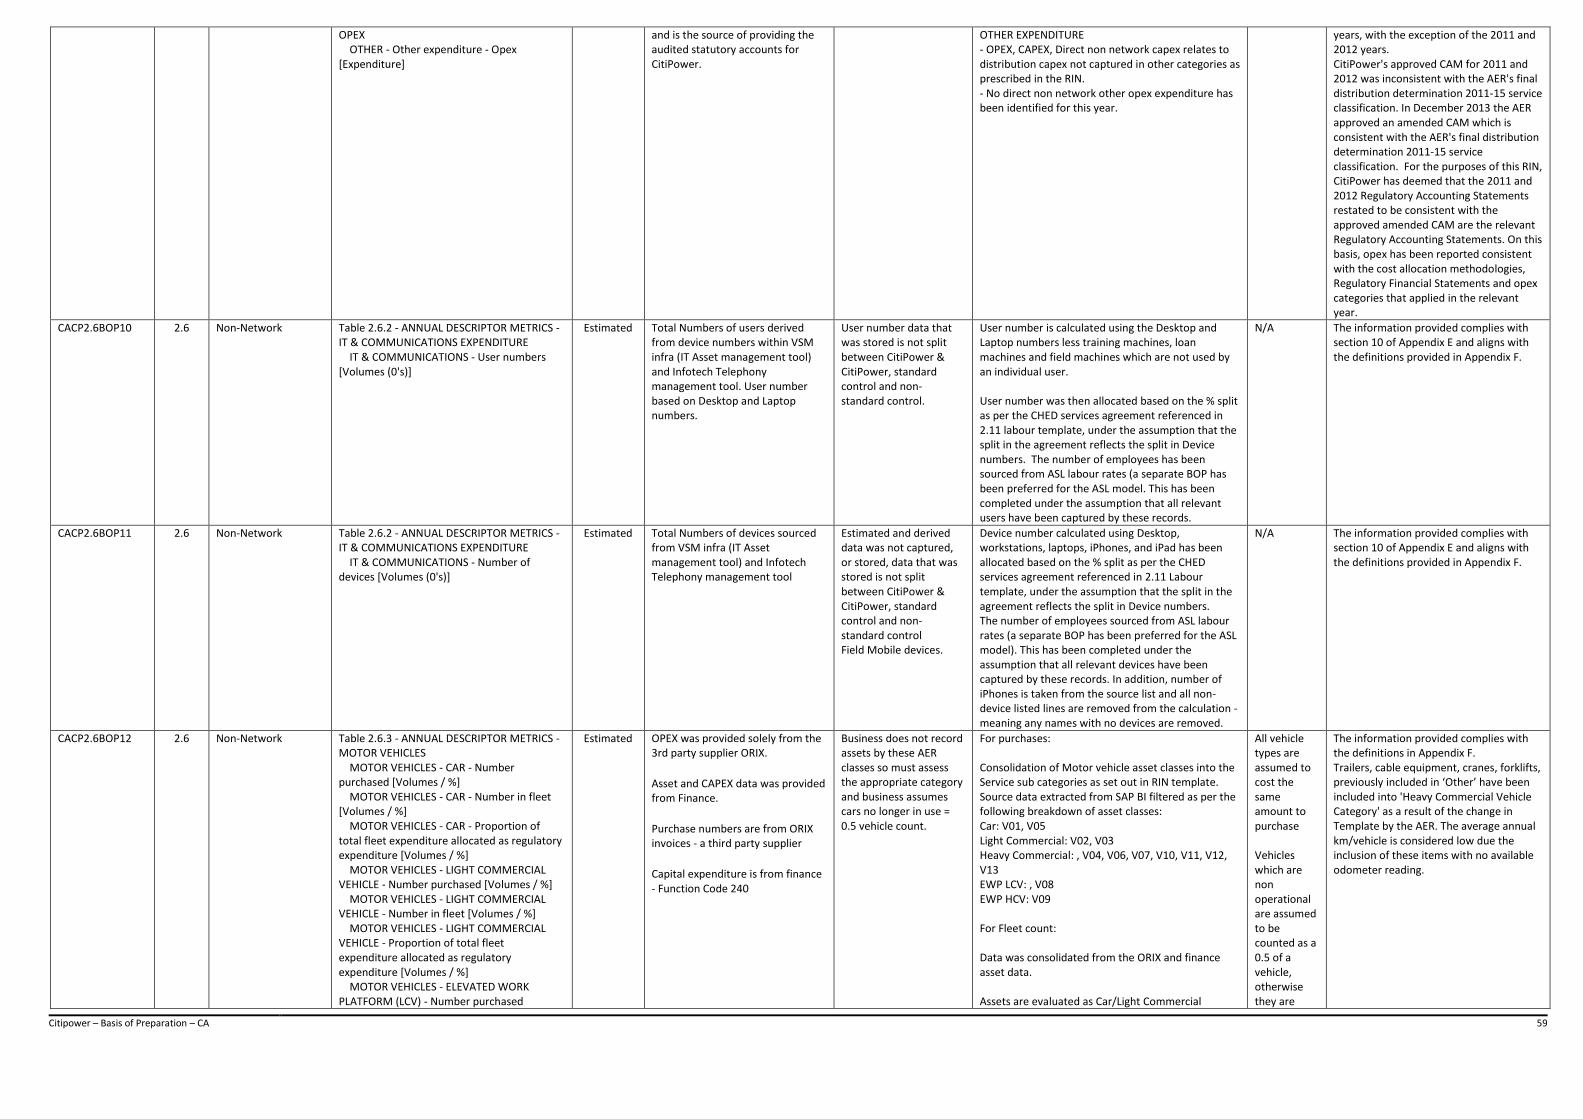
Citipower – Basis of Preparation – CA 59
OPEX OTHER - Other expenditure - Opex [Expenditure]
and is the source of providing the audited statutory accounts for CitiPower.
OTHER EXPENDITURE - OPEX, CAPEX, Direct non network capex relates to distribution capex not captured in other categories as prescribed in the RIN. - No direct non network other opex expenditure has been identified for this year.
years, with the exception of the 2011 and 2012 years. CitiPower's approved CAM for 2011 and 2012 was inconsistent with the AER's final distribution determination 2011-15 service classification. In December 2013 the AER approved an amended CAM which is consistent with the AER's final distribution determination 2011-15 service classification. For the purposes of this RIN, CitiPower has deemed that the 2011 and 2012 Regulatory Accounting Statements restated to be consistent with the approved amended CAM are the relevant Regulatory Accounting Statements. On this basis, opex has been reported consistent with the cost allocation methodologies, Regulatory Financial Statements and opex categories that applied in the relevant year.
CACP2.6BOP10 2.6 Non-Network Table 2.6.2 - ANNUAL DESCRIPTOR METRICS - IT & COMMUNICATIONS EXPENDITURE IT & COMMUNICATIONS - User numbers [Volumes (0's)]
Estimated Total Numbers of users derived from device numbers within VSM infra (IT Asset management tool) and Infotech Telephony management tool. User number based on Desktop and Laptop numbers.
User number data that was stored is not split between CitiPower & CitiPower, standard control and non-standard control.
User number is calculated using the Desktop and Laptop numbers less training machines, loan machines and field machines which are not used by an individual user. User number was then allocated based on the % split as per the CHED services agreement referenced in 2.11 labour template, under the assumption that the split in the agreement reflects the split in Device numbers. The number of employees has been sourced from ASL labour rates (a separate BOP has been preferred for the ASL model. This has been completed under the assumption that all relevant users have been captured by these records.
N/A The information provided complies with section 10 of Appendix E and aligns with the definitions provided in Appendix F.
CACP2.6BOP11 2.6 Non-Network Table 2.6.2 - ANNUAL DESCRIPTOR METRICS - IT & COMMUNICATIONS EXPENDITURE IT & COMMUNICATIONS - Number of devices [Volumes (0's)]
Estimated Total Numbers of devices sourced from VSM infra (IT Asset management tool) and Infotech Telephony management tool
Estimated and derived data was not captured, or stored, data that was stored is not split between CitiPower & CitiPower, standard control and non-standard control Field Mobile devices.
Device number calculated using Desktop, workstations, laptops, iPhones, and iPad has been allocated based on the % split as per the CHED services agreement referenced in 2.11 Labour template, under the assumption that the split in the agreement reflects the split in Device numbers. The number of employees sourced from ASL labour rates (a separate BOP has been preferred for the ASL model). This has been completed under the assumption that all relevant devices have been captured by these records. In addition, number of iPhones is taken from the source list and all non-device listed lines are removed from the calculation - meaning any names with no devices are removed.
N/A The information provided complies with section 10 of Appendix E and aligns with the definitions provided in Appendix F.
CACP2.6BOP12 2.6 Non-Network Table 2.6.3 - ANNUAL DESCRIPTOR METRICS - MOTOR VEHICLES MOTOR VEHICLES - CAR - Number purchased [Volumes / %] MOTOR VEHICLES - CAR - Number in fleet [Volumes / %] MOTOR VEHICLES - CAR - Proportion of total fleet expenditure allocated as regulatory expenditure [Volumes / %] MOTOR VEHICLES - LIGHT COMMERCIAL VEHICLE - Number purchased [Volumes / %] MOTOR VEHICLES - LIGHT COMMERCIAL VEHICLE - Number in fleet [Volumes / %] MOTOR VEHICLES - LIGHT COMMERCIAL VEHICLE - Proportion of total fleet expenditure allocated as regulatory expenditure [Volumes / %] MOTOR VEHICLES - ELEVATED WORK PLATFORM (LCV) - Number purchased
Estimated OPEX was provided solely from the 3rd party supplier ORIX.
Asset and CAPEX data was provided from Finance.
Purchase numbers are from ORIX invoices - a third party supplier
Capital expenditure is from finance - Function Code 240
Business does not record assets by these AER classes so must assess the appropriate category and business assumes cars no longer in use = 0.5 vehicle count.
For purchases: Consolidation of Motor vehicle asset classes into the Service sub categories as set out in RIN template. Source data extracted from SAP BI filtered as per the following breakdown of asset classes: Car: V01, V05 Light Commercial: V02, V03 Heavy Commercial: , V04, V06, V07, V10, V11, V12, V13 EWP LCV: , V08 EWP HCV: V09 For Fleet count: Data was consolidated from the ORIX and finance asset data. Assets are evaluated as Car/Light Commercial
All vehicle types are assumed to cost the same amount to purchase Vehicles which are non operational are assumed to be counted as a 0.5 of a vehicle, otherwise they are
The information provided complies with the definitions in Appendix F. Trailers, cable equipment, cranes, forklifts, previously included in ‘Other’ have been included into 'Heavy Commercial Vehicle Category' as a result of the change in Template by the AER. The average annual km/vehicle is considered low due the inclusion of these items with no available odometer reading.
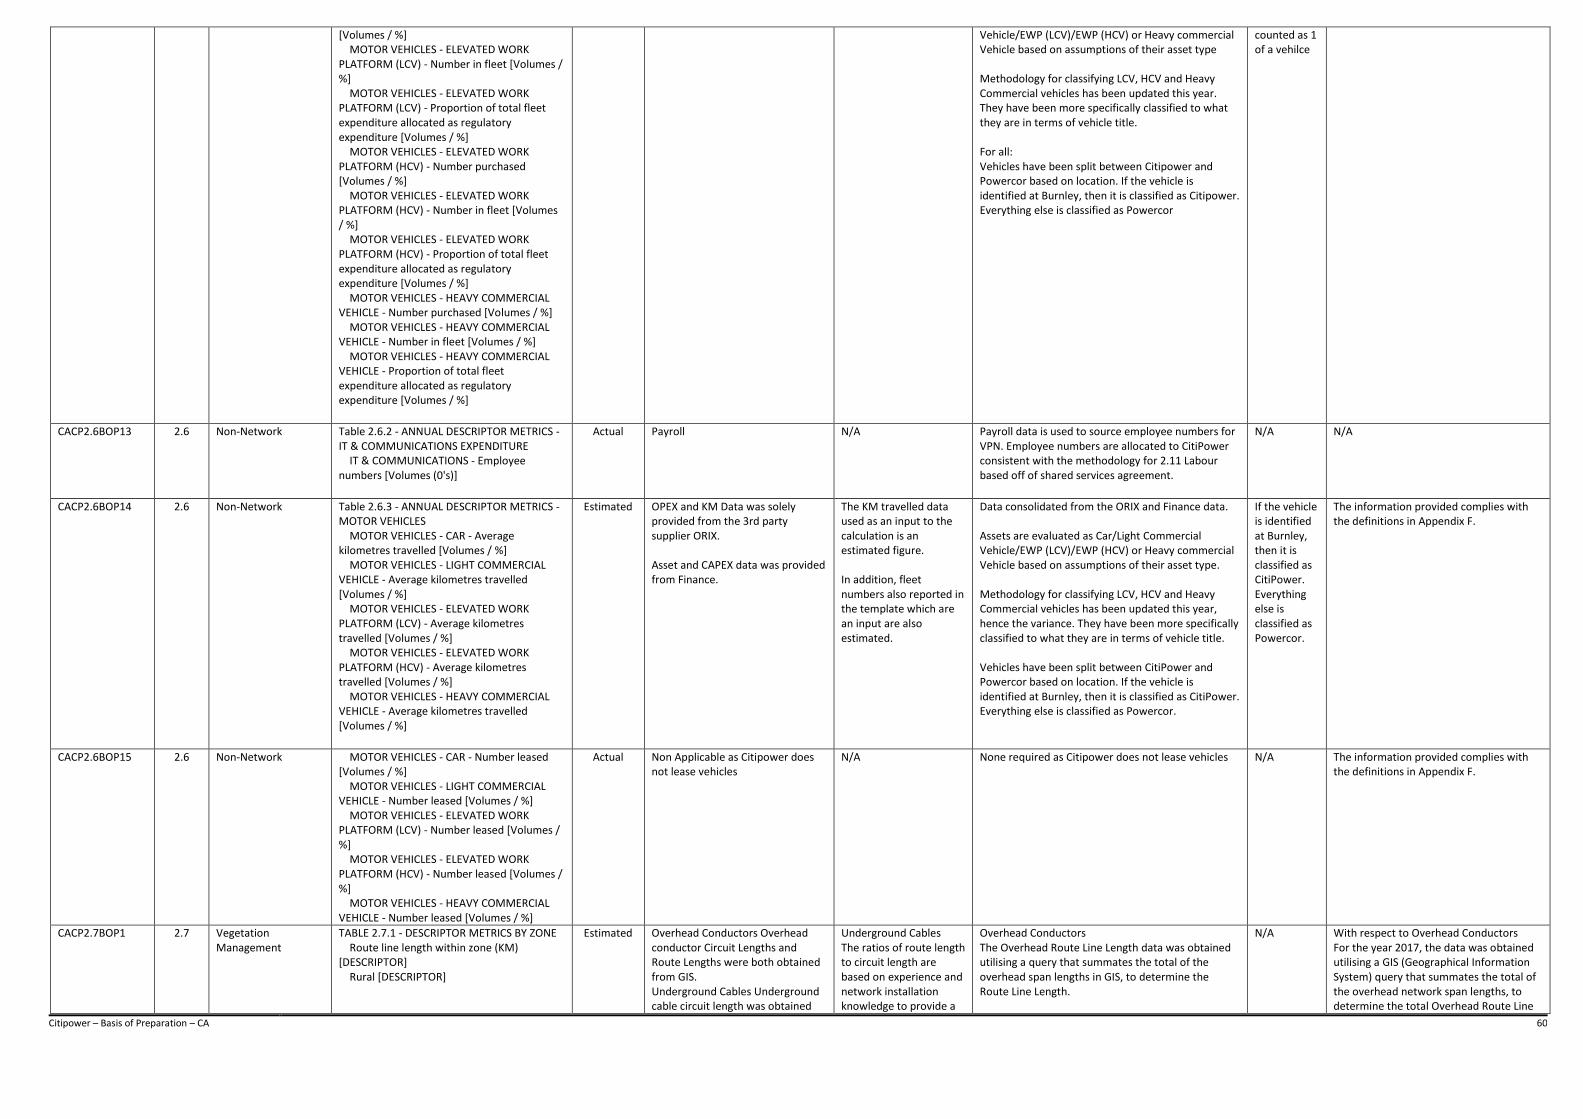
Citipower – Basis of Preparation – CA 60
[Volumes / %] MOTOR VEHICLES - ELEVATED WORK PLATFORM (LCV) - Number in fleet [Volumes / %] MOTOR VEHICLES - ELEVATED WORK PLATFORM (LCV) - Proportion of total fleet expenditure allocated as regulatory expenditure [Volumes / %] MOTOR VEHICLES - ELEVATED WORK PLATFORM (HCV) - Number purchased [Volumes / %] MOTOR VEHICLES - ELEVATED WORK PLATFORM (HCV) - Number in fleet [Volumes / %] MOTOR VEHICLES - ELEVATED WORK PLATFORM (HCV) - Proportion of total fleet expenditure allocated as regulatory expenditure [Volumes / %] MOTOR VEHICLES - HEAVY COMMERCIAL VEHICLE - Number purchased [Volumes / %] MOTOR VEHICLES - HEAVY COMMERCIAL VEHICLE - Number in fleet [Volumes / %] MOTOR VEHICLES - HEAVY COMMERCIAL VEHICLE - Proportion of total fleet expenditure allocated as regulatory expenditure [Volumes / %]
Vehicle/EWP (LCV)/EWP (HCV) or Heavy commercial Vehicle based on assumptions of their asset type Methodology for classifying LCV, HCV and Heavy Commercial vehicles has been updated this year. They have been more specifically classified to what they are in terms of vehicle title. For all: Vehicles have been split between Citipower and Powercor based on location. If the vehicle is identified at Burnley, then it is classified as Citipower. Everything else is classified as Powercor
counted as 1 of a vehilce
CACP2.6BOP13 2.6 Non-Network Table 2.6.2 - ANNUAL DESCRIPTOR METRICS - IT & COMMUNICATIONS EXPENDITURE IT & COMMUNICATIONS - Employee numbers [Volumes (0's)]
Actual Payroll N/A Payroll data is used to source employee numbers for VPN. Employee numbers are allocated to CitiPower consistent with the methodology for 2.11 Labour based off of shared services agreement.
N/A N/A
CACP2.6BOP14 2.6 Non-Network Table 2.6.3 - ANNUAL DESCRIPTOR METRICS - MOTOR VEHICLES MOTOR VEHICLES - CAR - Average kilometres travelled [Volumes / %] MOTOR VEHICLES - LIGHT COMMERCIAL VEHICLE - Average kilometres travelled [Volumes / %] MOTOR VEHICLES - ELEVATED WORK PLATFORM (LCV) - Average kilometres travelled [Volumes / %] MOTOR VEHICLES - ELEVATED WORK PLATFORM (HCV) - Average kilometres travelled [Volumes / %] MOTOR VEHICLES - HEAVY COMMERCIAL VEHICLE - Average kilometres travelled [Volumes / %]
Estimated OPEX and KM Data was solely provided from the 3rd party supplier ORIX. Asset and CAPEX data was provided from Finance.
The KM travelled data used as an input to the calculation is an estimated figure. In addition, fleet numbers also reported in the template which are an input are also estimated.
Data consolidated from the ORIX and Finance data. Assets are evaluated as Car/Light Commercial Vehicle/EWP (LCV)/EWP (HCV) or Heavy commercial Vehicle based on assumptions of their asset type. Methodology for classifying LCV, HCV and Heavy Commercial vehicles has been updated this year, hence the variance. They have been more specifically classified to what they are in terms of vehicle title. Vehicles have been split between CitiPower and Powercor based on location. If the vehicle is identified at Burnley, then it is classified as CitiPower. Everything else is classified as Powercor.
If the vehicle is identified at Burnley, then it is classified as CitiPower. Everything else is classified as Powercor.
The information provided complies with the definitions in Appendix F.
CACP2.6BOP15 2.6 Non-Network MOTOR VEHICLES - CAR - Number leased [Volumes / %] MOTOR VEHICLES - LIGHT COMMERCIAL VEHICLE - Number leased [Volumes / %] MOTOR VEHICLES - ELEVATED WORK PLATFORM (LCV) - Number leased [Volumes / %] MOTOR VEHICLES - ELEVATED WORK PLATFORM (HCV) - Number leased [Volumes / %] MOTOR VEHICLES - HEAVY COMMERCIAL VEHICLE - Number leased [Volumes / %]
Actual Non Applicable as Citipower does not lease vehicles
N/A None required as Citipower does not lease vehicles N/A The information provided complies with the definitions in Appendix F.
CACP2.7BOP1 2.7 Vegetation Management
TABLE 2.7.1 - DESCRIPTOR METRICS BY ZONE Route line length within zone (KM) [DESCRIPTOR] Rural [DESCRIPTOR]
Estimated Overhead Conductors Overhead conductor Circuit Lengths and Route Lengths were both obtained from GIS. Underground Cables Underground cable circuit length was obtained
Underground Cables The ratios of route length to circuit length are based on experience and network installation knowledge to provide a
Overhead Conductors The Overhead Route Line Length data was obtained utilising a query that summates the total of the overhead span lengths in GIS, to determine the Route Line Length.
N/A With respect to Overhead Conductors For the year 2017, the data was obtained utilising a GIS (Geographical Information System) query that summates the total of the overhead network span lengths, to determine the total Overhead Route Line
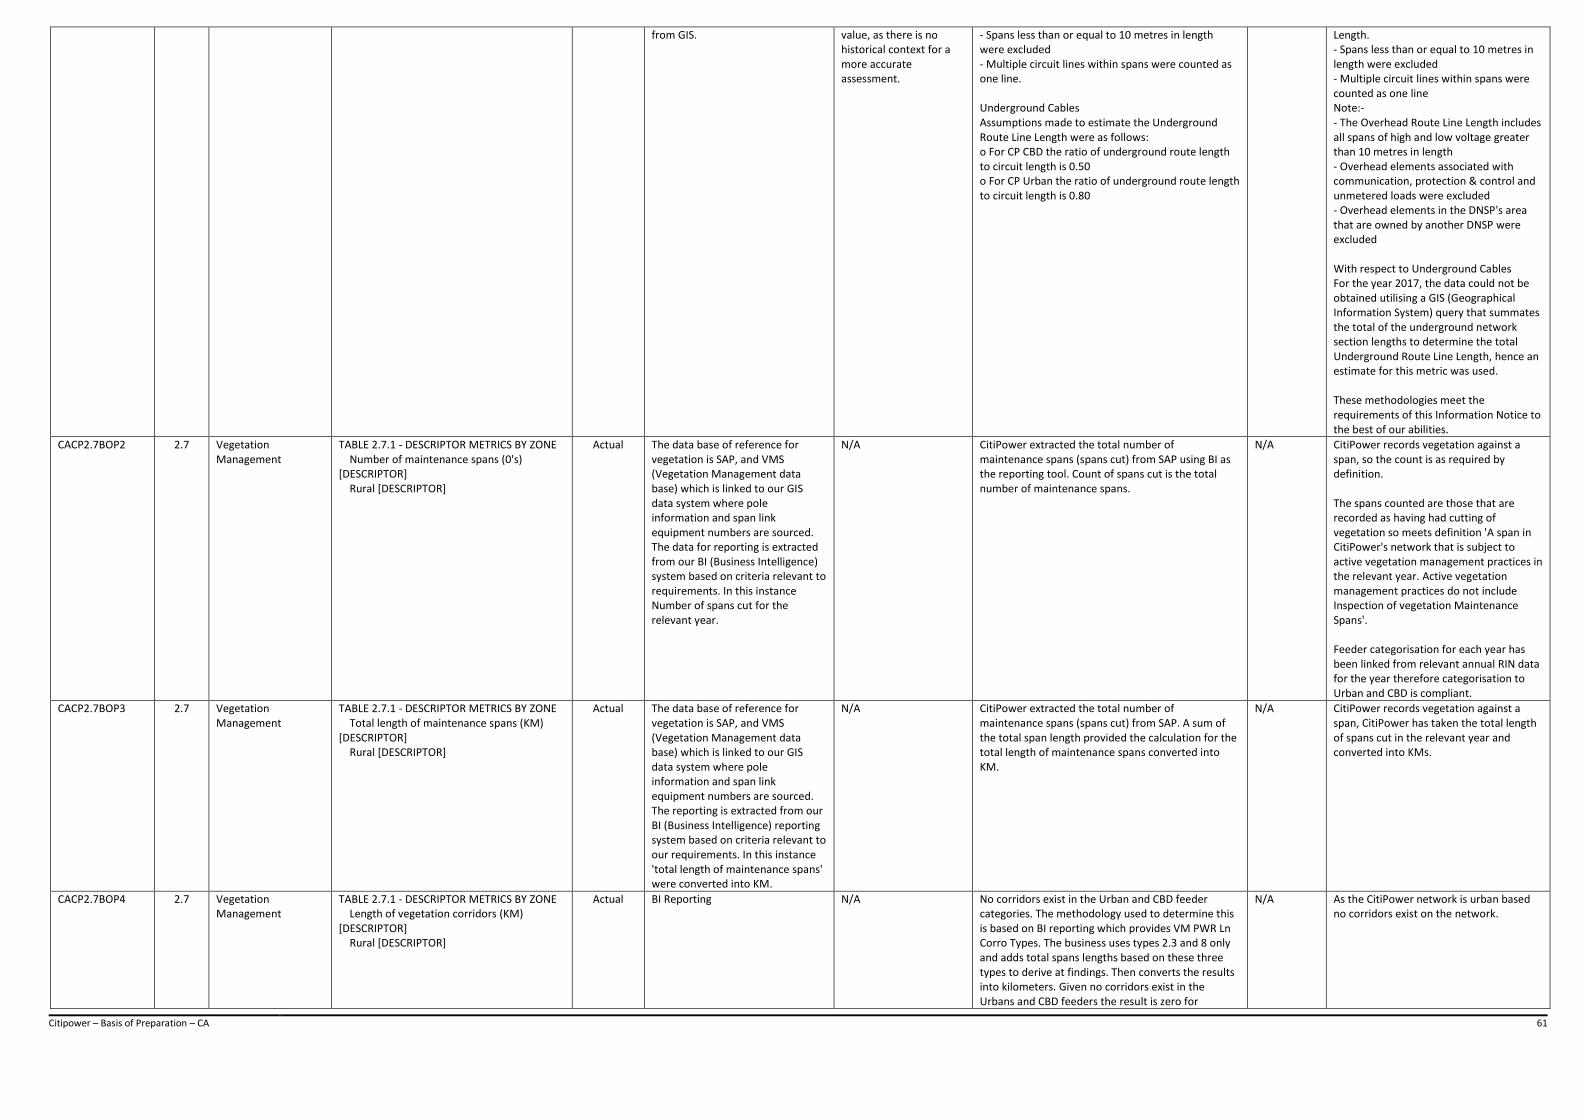
Citipower – Basis of Preparation – CA 61
from GIS. value, as there is no historical context for a more accurate assessment.
- Spans less than or equal to 10 metres in length were excluded - Multiple circuit lines within spans were counted as one line. Underground Cables Assumptions made to estimate the Underground Route Line Length were as follows: o For CP CBD the ratio of underground route length to circuit length is 0.50 o For CP Urban the ratio of underground route length to circuit length is 0.80
Length. - Spans less than or equal to 10 metres in length were excluded - Multiple circuit lines within spans were counted as one line Note:- - The Overhead Route Line Length includes all spans of high and low voltage greater than 10 metres in length - Overhead elements associated with communication, protection & control and unmetered loads were excluded - Overhead elements in the DNSP's area that are owned by another DNSP were excluded With respect to Underground Cables For the year 2017, the data could not be obtained utilising a GIS (Geographical Information System) query that summates the total of the underground network section lengths to determine the total Underground Route Line Length, hence an estimate for this metric was used. These methodologies meet the requirements of this Information Notice to the best of our abilities.
CACP2.7BOP2 2.7 Vegetation Management
TABLE 2.7.1 - DESCRIPTOR METRICS BY ZONE Number of maintenance spans (0's) [DESCRIPTOR] Rural [DESCRIPTOR]
Actual The data base of reference for vegetation is SAP, and VMS (Vegetation Management data base) which is linked to our GIS data system where pole information and span link equipment numbers are sourced. The data for reporting is extracted from our BI (Business Intelligence) system based on criteria relevant to requirements. In this instance Number of spans cut for the relevant year.
N/A CitiPower extracted the total number of maintenance spans (spans cut) from SAP using BI as the reporting tool. Count of spans cut is the total number of maintenance spans.
N/A CitiPower records vegetation against a span, so the count is as required by definition. The spans counted are those that are recorded as having had cutting of vegetation so meets definition 'A span in CitiPower's network that is subject to active vegetation management practices in the relevant year. Active vegetation management practices do not include Inspection of vegetation Maintenance Spans'. Feeder categorisation for each year has been linked from relevant annual RIN data for the year therefore categorisation to Urban and CBD is compliant.
CACP2.7BOP3 2.7 Vegetation Management
TABLE 2.7.1 - DESCRIPTOR METRICS BY ZONE Total length of maintenance spans (KM) [DESCRIPTOR] Rural [DESCRIPTOR]
Actual The data base of reference for vegetation is SAP, and VMS (Vegetation Management data base) which is linked to our GIS data system where pole information and span link equipment numbers are sourced. The reporting is extracted from our BI (Business Intelligence) reporting system based on criteria relevant to our requirements. In this instance 'total length of maintenance spans' were converted into KM.
N/A CitiPower extracted the total number of maintenance spans (spans cut) from SAP. A sum of the total span length provided the calculation for the total length of maintenance spans converted into KM.
N/A CitiPower records vegetation against a span, CitiPower has taken the total length of spans cut in the relevant year and converted into KMs.
CACP2.7BOP4 2.7 Vegetation Management
TABLE 2.7.1 - DESCRIPTOR METRICS BY ZONE Length of vegetation corridors (KM) [DESCRIPTOR] Rural [DESCRIPTOR]
Actual BI Reporting N/A No corridors exist in the Urban and CBD feeder categories. The methodology used to determine this is based on BI reporting which provides VM PWR Ln Corro Types. The business uses types 2.3 and 8 only and adds total spans lengths based on these three types to derive at findings. Then converts the results into kilometers. Given no corridors exist in the Urbans and CBD feeders the result is zero for
N/A As the CitiPower network is urban based no corridors exist on the network.
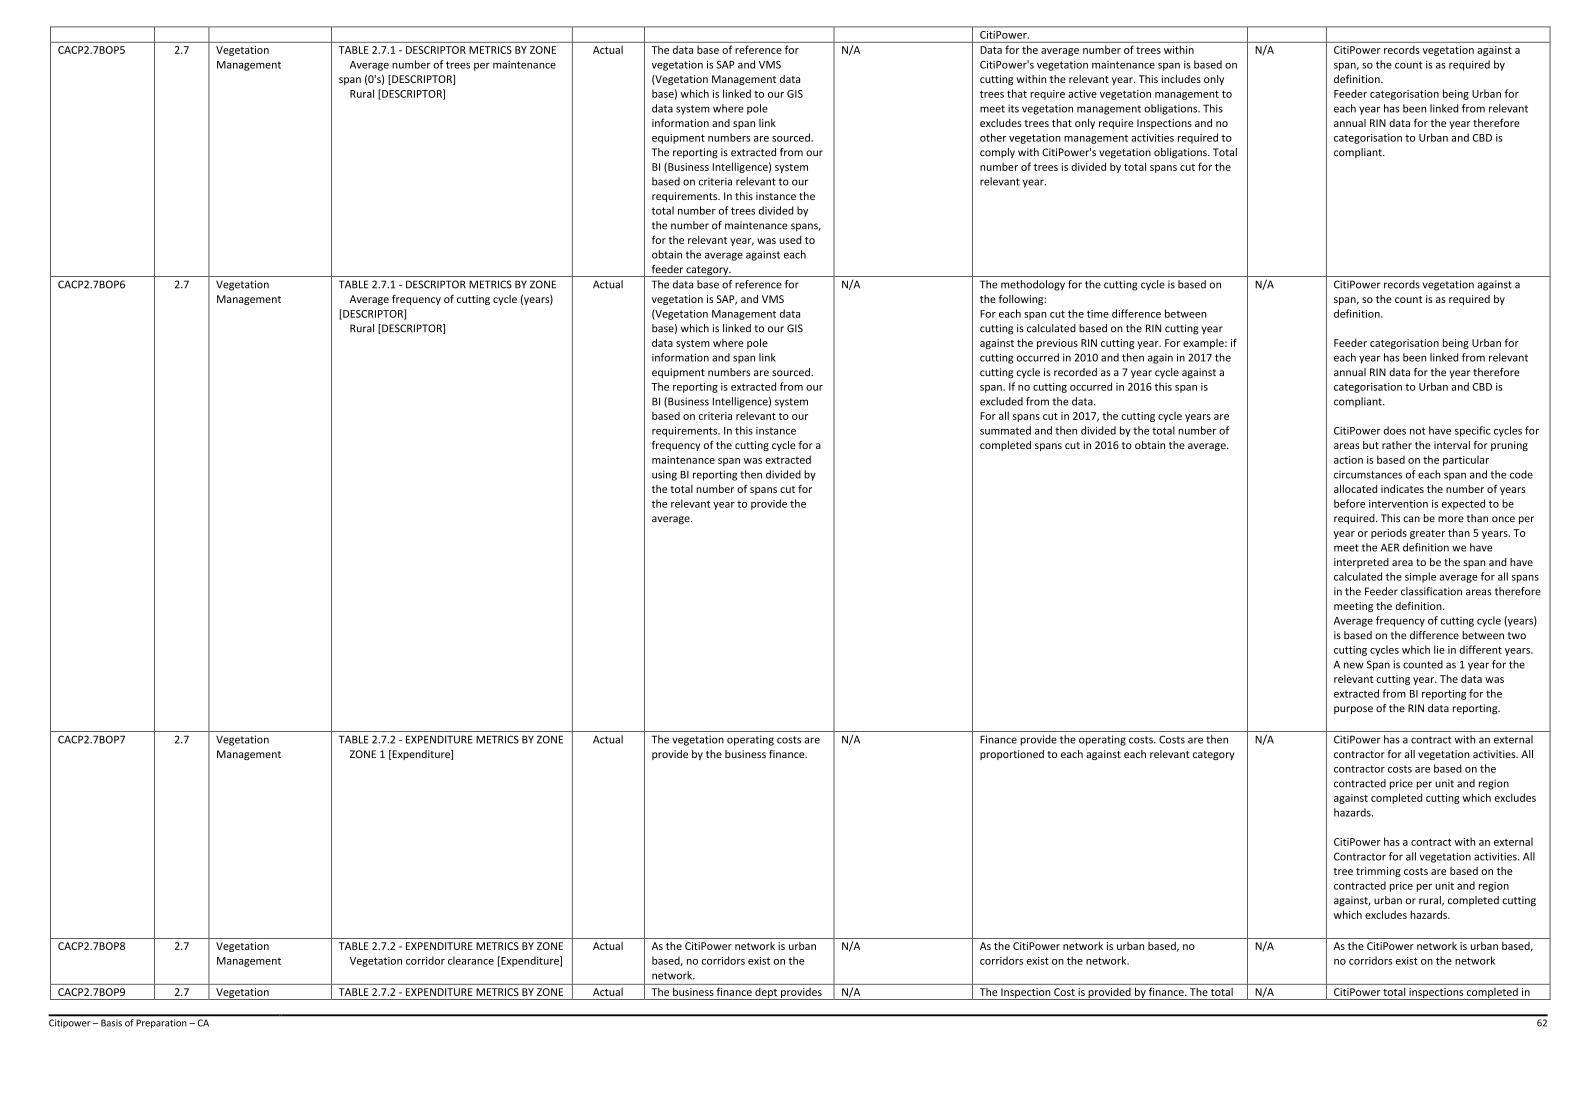
Citipower – Basis of Preparation – CA 62
CitiPower.
CACP2.7BOP5 2.7 Vegetation Management
TABLE 2.7.1 - DESCRIPTOR METRICS BY ZONE Average number of trees per maintenance span (0's) [DESCRIPTOR] Rural [DESCRIPTOR]
Actual The data base of reference for vegetation is SAP and VMS (Vegetation Management data base) which is linked to our GIS data system where pole information and span link equipment numbers are sourced. The reporting is extracted from our BI (Business Intelligence) system based on criteria relevant to our requirements. In this instance the total number of trees divided by the number of maintenance spans, for the relevant year, was used to obtain the average against each feeder category.
N/A Data for the average number of trees within CitiPower's vegetation maintenance span is based on cutting within the relevant year. This includes only trees that require active vegetation management to meet its vegetation management obligations. This excludes trees that only require Inspections and no other vegetation management activities required to comply with CitiPower's vegetation obligations. Total number of trees is divided by total spans cut for the relevant year.
N/A CitiPower records vegetation against a span, so the count is as required by definition. Feeder categorisation being Urban for each year has been linked from relevant annual RIN data for the year therefore categorisation to Urban and CBD is compliant.
CACP2.7BOP6 2.7 Vegetation Management
TABLE 2.7.1 - DESCRIPTOR METRICS BY ZONE Average frequency of cutting cycle (years) [DESCRIPTOR] Rural [DESCRIPTOR]
Actual The data base of reference for vegetation is SAP, and VMS (Vegetation Management data base) which is linked to our GIS data system where pole information and span link equipment numbers are sourced. The reporting is extracted from our BI (Business Intelligence) system based on criteria relevant to our requirements. In this instance frequency of the cutting cycle for a maintenance span was extracted using BI reporting then divided by the total number of spans cut for the relevant year to provide the average.
N/A The methodology for the cutting cycle is based on the following: For each span cut the time difference between cutting is calculated based on the RIN cutting year against the previous RIN cutting year. For example: if cutting occurred in 2010 and then again in 2017 the cutting cycle is recorded as a 7 year cycle against a span. If no cutting occurred in 2016 this span is excluded from the data. For all spans cut in 2017, the cutting cycle years are summated and then divided by the total number of completed spans cut in 2016 to obtain the average.
N/A CitiPower records vegetation against a span, so the count is as required by definition. Feeder categorisation being Urban for each year has been linked from relevant annual RIN data for the year therefore categorisation to Urban and CBD is compliant. CitiPower does not have specific cycles for areas but rather the interval for pruning action is based on the particular circumstances of each span and the code allocated indicates the number of years before intervention is expected to be required. This can be more than once per year or periods greater than 5 years. To meet the AER definition we have interpreted area to be the span and have calculated the simple average for all spans in the Feeder classification areas therefore meeting the definition. Average frequency of cutting cycle (years) is based on the difference between two cutting cycles which lie in different years. A new Span is counted as 1 year for the relevant cutting year. The data was extracted from BI reporting for the purpose of the RIN data reporting.
CACP2.7BOP7 2.7 Vegetation Management
TABLE 2.7.2 - EXPENDITURE METRICS BY ZONE ZONE 1 [Expenditure]
Actual The vegetation operating costs are provide by the business finance.
N/A Finance provide the operating costs. Costs are then proportioned to each against each relevant category
N/A CitiPower has a contract with an external contractor for all vegetation activities. All contractor costs are based on the contracted price per unit and region against completed cutting which excludes hazards. CitiPower has a contract with an external Contractor for all vegetation activities. All tree trimming costs are based on the contracted price per unit and region against, urban or rural, completed cutting which excludes hazards.
CACP2.7BOP8 2.7 Vegetation Management
TABLE 2.7.2 - EXPENDITURE METRICS BY ZONE Vegetation corridor clearance [Expenditure]
Actual As the CitiPower network is urban based, no corridors exist on the network.
N/A As the CitiPower network is urban based, no corridors exist on the network.
N/A As the CitiPower network is urban based, no corridors exist on the network
CACP2.7BOP9 2.7 Vegetation TABLE 2.7.2 - EXPENDITURE METRICS BY ZONE Actual The business finance dept provides N/A The Inspection Cost is provided by finance. The total N/A CitiPower total inspections completed in
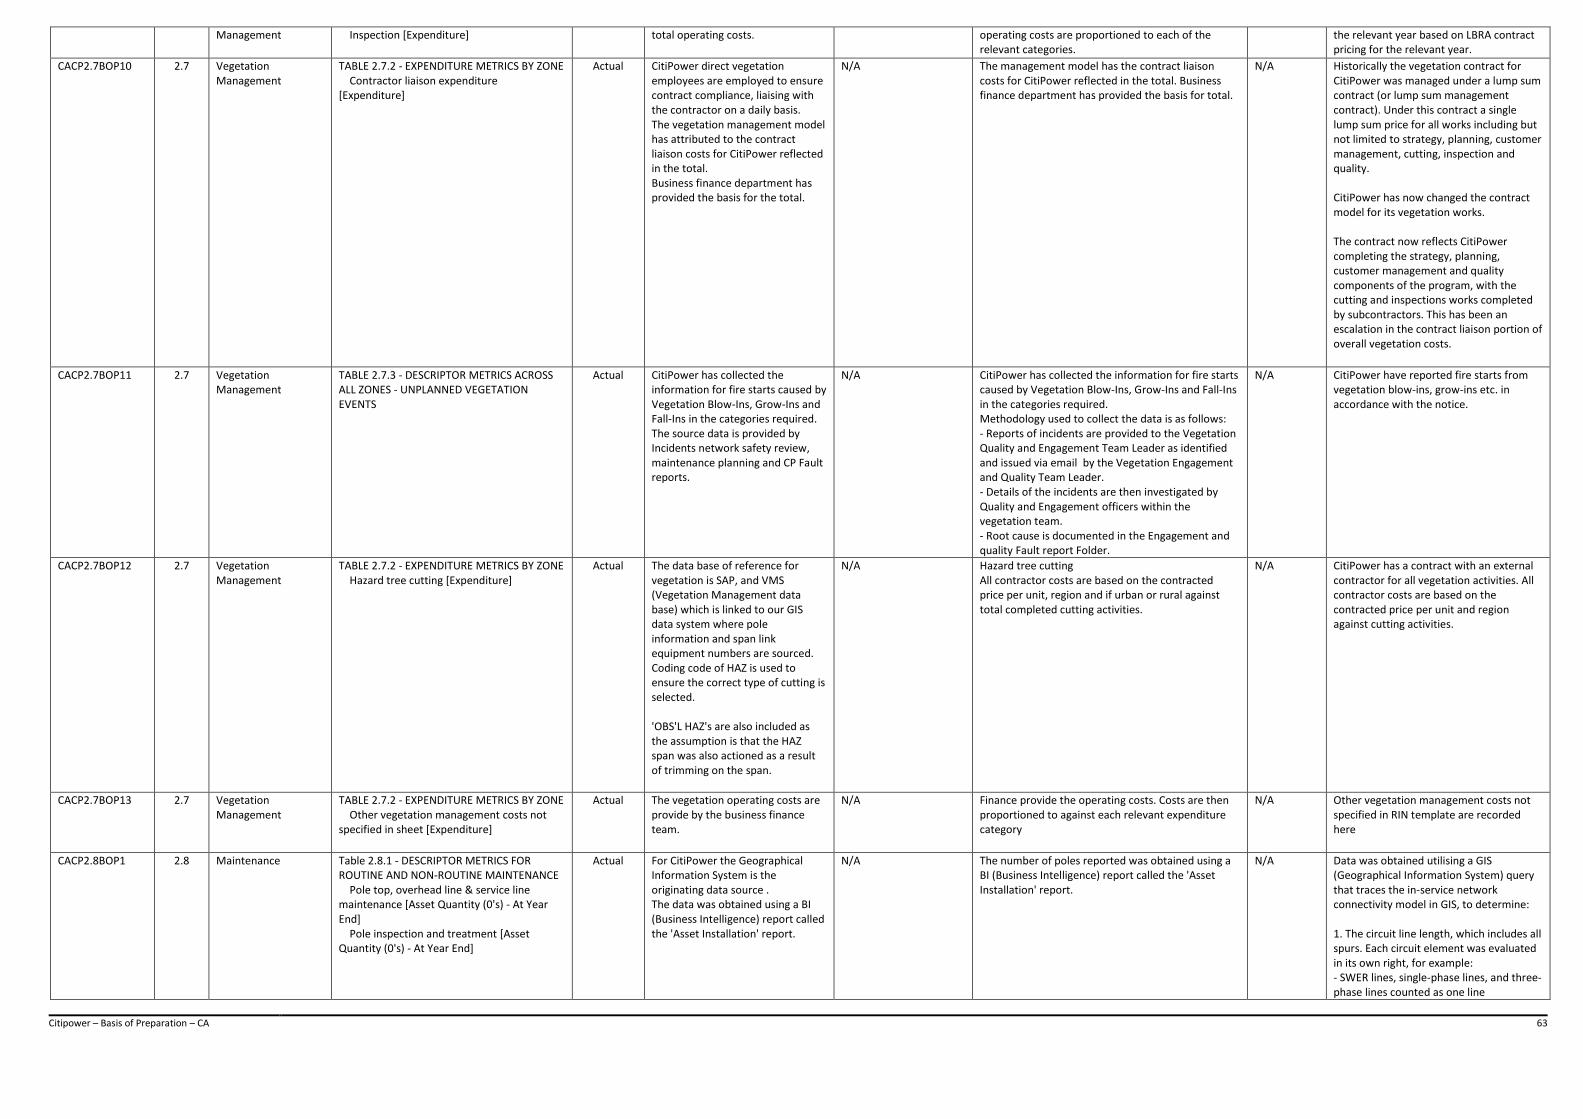
Citipower – Basis of Preparation – CA 63
Management Inspection [Expenditure] total operating costs. operating costs are proportioned to each of the relevant categories.
the relevant year based on LBRA contract pricing for the relevant year.
CACP2.7BOP10 2.7 Vegetation Management
TABLE 2.7.2 - EXPENDITURE METRICS BY ZONE Contractor liaison expenditure [Expenditure]
Actual CitiPower direct vegetation employees are employed to ensure contract compliance, liaising with the contractor on a daily basis. The vegetation management model has attributed to the contract liaison costs for CitiPower reflected in the total. Business finance department has provided the basis for the total.
N/A The management model has the contract liaison costs for CitiPower reflected in the total. Business finance department has provided the basis for total.
N/A Historically the vegetation contract for CitiPower was managed under a lump sum contract (or lump sum management contract). Under this contract a single lump sum price for all works including but not limited to strategy, planning, customer management, cutting, inspection and quality. CitiPower has now changed the contract model for its vegetation works. The contract now reflects CitiPower completing the strategy, planning, customer management and quality components of the program, with the cutting and inspections works completed by subcontractors. This has been an escalation in the contract liaison portion of overall vegetation costs.
CACP2.7BOP11 2.7 Vegetation Management
TABLE 2.7.3 - DESCRIPTOR METRICS ACROSS ALL ZONES - UNPLANNED VEGETATION EVENTS
Actual CitiPower has collected the information for fire starts caused by Vegetation Blow-Ins, Grow-Ins and Fall-Ins in the categories required. The source data is provided by Incidents network safety review, maintenance planning and CP Fault reports.
N/A CitiPower has collected the information for fire starts caused by Vegetation Blow-Ins, Grow-Ins and Fall-Ins in the categories required. Methodology used to collect the data is as follows: - Reports of incidents are provided to the Vegetation Quality and Engagement Team Leader as identified and issued via email by the Vegetation Engagement and Quality Team Leader. - Details of the incidents are then investigated by Quality and Engagement officers within the vegetation team. - Root cause is documented in the Engagement and quality Fault report Folder.
N/A CitiPower have reported fire starts from vegetation blow-ins, grow-ins etc. in accordance with the notice.
CACP2.7BOP12 2.7 Vegetation Management
TABLE 2.7.2 - EXPENDITURE METRICS BY ZONE Hazard tree cutting [Expenditure]
Actual The data base of reference for vegetation is SAP, and VMS (Vegetation Management data base) which is linked to our GIS data system where pole information and span link equipment numbers are sourced. Coding code of HAZ is used to ensure the correct type of cutting is selected. 'OBS'L HAZ's are also included as the assumption is that the HAZ span was also actioned as a result of trimming on the span.
N/A Hazard tree cutting All contractor costs are based on the contracted price per unit, region and if urban or rural against total completed cutting activities.
N/A CitiPower has a contract with an external contractor for all vegetation activities. All contractor costs are based on the contracted price per unit and region against cutting activities.
CACP2.7BOP13 2.7 Vegetation Management
TABLE 2.7.2 - EXPENDITURE METRICS BY ZONE Other vegetation management costs not specified in sheet [Expenditure]
Actual The vegetation operating costs are provide by the business finance team.
N/A Finance provide the operating costs. Costs are then proportioned to against each relevant expenditure category
N/A Other vegetation management costs not specified in RIN template are recorded here
CACP2.8BOP1 2.8 Maintenance Table 2.8.1 - DESCRIPTOR METRICS FOR ROUTINE AND NON-ROUTINE MAINTENANCE Pole top, overhead line & service line maintenance [Asset Quantity (0's) - At Year End] Pole inspection and treatment [Asset Quantity (0's) - At Year End]
Actual For CitiPower the Geographical Information System is the originating data source . The data was obtained using a BI (Business Intelligence) report called the 'Asset Installation' report.
N/A The number of poles reported was obtained using a BI (Business Intelligence) report called the 'Asset Installation' report.
N/A Data was obtained utilising a GIS (Geographical Information System) query that traces the in-service network connectivity model in GIS, to determine: 1. The circuit line length, which includes all spurs. Each circuit element was evaluated in its own right, for example: - SWER lines, single-phase lines, and three-phase lines counted as one line
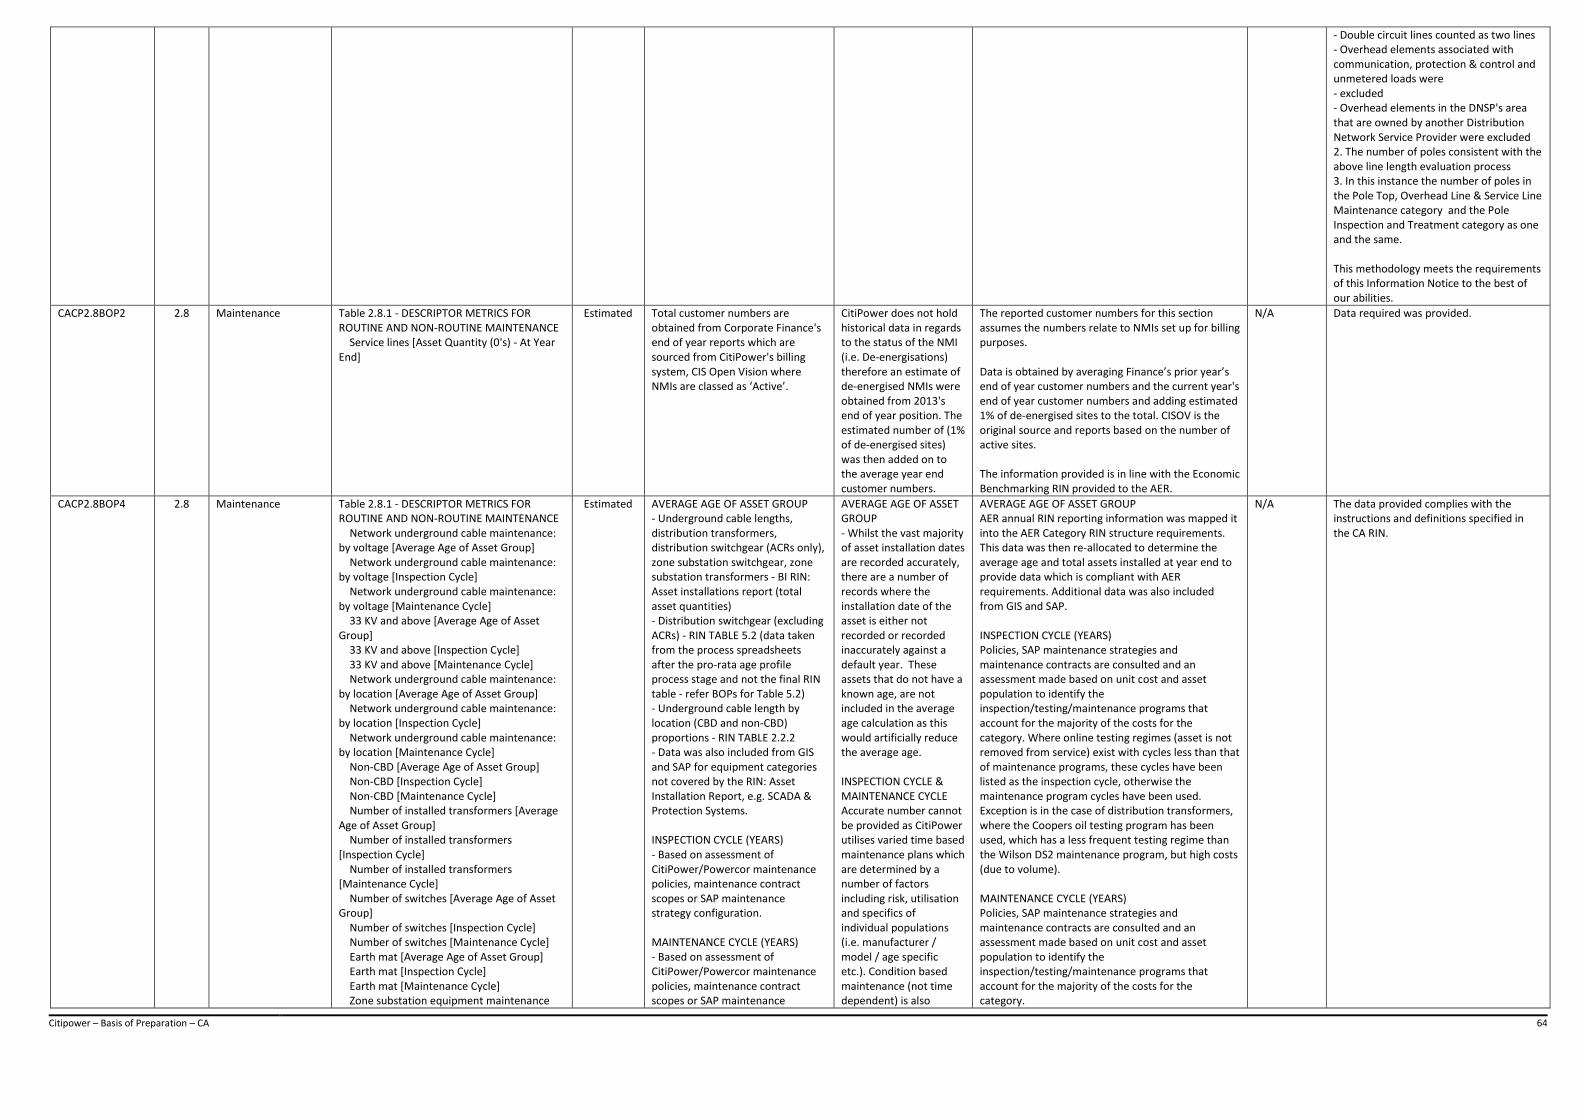
Citipower – Basis of Preparation – CA 64
- Double circuit lines counted as two lines - Overhead elements associated with communication, protection & control and unmetered loads were - excluded - Overhead elements in the DNSP's area that are owned by another Distribution Network Service Provider were excluded 2. The number of poles consistent with the above line length evaluation process 3. In this instance the number of poles in the Pole Top, Overhead Line & Service Line Maintenance category and the Pole Inspection and Treatment category as one and the same. This methodology meets the requirements of this Information Notice to the best of our abilities.
CACP2.8BOP2 2.8 Maintenance Table 2.8.1 - DESCRIPTOR METRICS FOR ROUTINE AND NON-ROUTINE MAINTENANCE Service lines [Asset Quantity (0's) - At Year End]
Estimated Total customer numbers are obtained from Corporate Finance's end of year reports which are sourced from CitiPower's billing system, CIS Open Vision where NMIs are classed as ‘Active’.
CitiPower does not hold historical data in regards to the status of the NMI (i.e. De-energisations) therefore an estimate of de-energised NMIs were obtained from 2013's end of year position. The estimated number of (1% of de-energised sites) was then added on to the average year end customer numbers.
The reported customer numbers for this section assumes the numbers relate to NMIs set up for billing purposes. Data is obtained by averaging Finance’s prior year’s end of year customer numbers and the current year's end of year customer numbers and adding estimated 1% of de-energised sites to the total. CISOV is the original source and reports based on the number of active sites. The information provided is in line with the Economic Benchmarking RIN provided to the AER.
N/A Data required was provided.
CACP2.8BOP4 2.8 Maintenance Table 2.8.1 - DESCRIPTOR METRICS FOR ROUTINE AND NON-ROUTINE MAINTENANCE Network underground cable maintenance: by voltage [Average Age of Asset Group] Network underground cable maintenance: by voltage [Inspection Cycle] Network underground cable maintenance: by voltage [Maintenance Cycle] 33 KV and above [Average Age of Asset Group] 33 KV and above [Inspection Cycle] 33 KV and above [Maintenance Cycle] Network underground cable maintenance: by location [Average Age of Asset Group] Network underground cable maintenance: by location [Inspection Cycle] Network underground cable maintenance: by location [Maintenance Cycle] Non-CBD [Average Age of Asset Group] Non-CBD [Inspection Cycle] Non-CBD [Maintenance Cycle] Number of installed transformers [Average Age of Asset Group] Number of installed transformers [Inspection Cycle] Number of installed transformers [Maintenance Cycle] Number of switches [Average Age of Asset Group] Number of switches [Inspection Cycle] Number of switches [Maintenance Cycle] Earth mat [Average Age of Asset Group] Earth mat [Inspection Cycle] Earth mat [Maintenance Cycle] Zone substation equipment maintenance
Estimated AVERAGE AGE OF ASSET GROUP - Underground cable lengths, distribution transformers, distribution switchgear (ACRs only), zone substation switchgear, zone substation transformers - BI RIN: Asset installations report (total asset quantities) - Distribution switchgear (excluding ACRs) - RIN TABLE 5.2 (data taken from the process spreadsheets after the pro-rata age profile process stage and not the final RIN table - refer BOPs for Table 5.2) - Underground cable length by location (CBD and non-CBD) proportions - RIN TABLE 2.2.2 - Data was also included from GIS and SAP for equipment categories not covered by the RIN: Asset Installation Report, e.g. SCADA & Protection Systems. INSPECTION CYCLE (YEARS) - Based on assessment of CitiPower/Powercor maintenance policies, maintenance contract scopes or SAP maintenance strategy configuration. MAINTENANCE CYCLE (YEARS) - Based on assessment of CitiPower/Powercor maintenance policies, maintenance contract scopes or SAP maintenance
AVERAGE AGE OF ASSET GROUP - Whilst the vast majority of asset installation dates are recorded accurately, there are a number of records where the installation date of the asset is either not recorded or recorded inaccurately against a default year. These assets that do not have a known age, are not included in the average age calculation as this would artificially reduce the average age. INSPECTION CYCLE & MAINTENANCE CYCLE Accurate number cannot be provided as CitiPower utilises varied time based maintenance plans which are determined by a number of factors including risk, utilisation and specifics of individual populations (i.e. manufacturer / model / age specific etc.). Condition based maintenance (not time dependent) is also
AVERAGE AGE OF ASSET GROUP AER annual RIN reporting information was mapped it into the AER Category RIN structure requirements. This data was then re-allocated to determine the average age and total assets installed at year end to provide data which is compliant with AER requirements. Additional data was also included from GIS and SAP. INSPECTION CYCLE (YEARS) Policies, SAP maintenance strategies and maintenance contracts are consulted and an assessment made based on unit cost and asset population to identify the inspection/testing/maintenance programs that account for the majority of the costs for the category. Where online testing regimes (asset is not removed from service) exist with cycles less than that of maintenance programs, these cycles have been listed as the inspection cycle, otherwise the maintenance program cycles have been used. Exception is in the case of distribution transformers, where the Coopers oil testing program has been used, which has a less frequent testing regime than the Wilson DS2 maintenance program, but high costs (due to volume). MAINTENANCE CYCLE (YEARS) Policies, SAP maintenance strategies and maintenance contracts are consulted and an assessment made based on unit cost and asset population to identify the inspection/testing/maintenance programs that account for the majority of the costs for the category.
N/A The data provided complies with the instructions and definitions specified in the CA RIN.
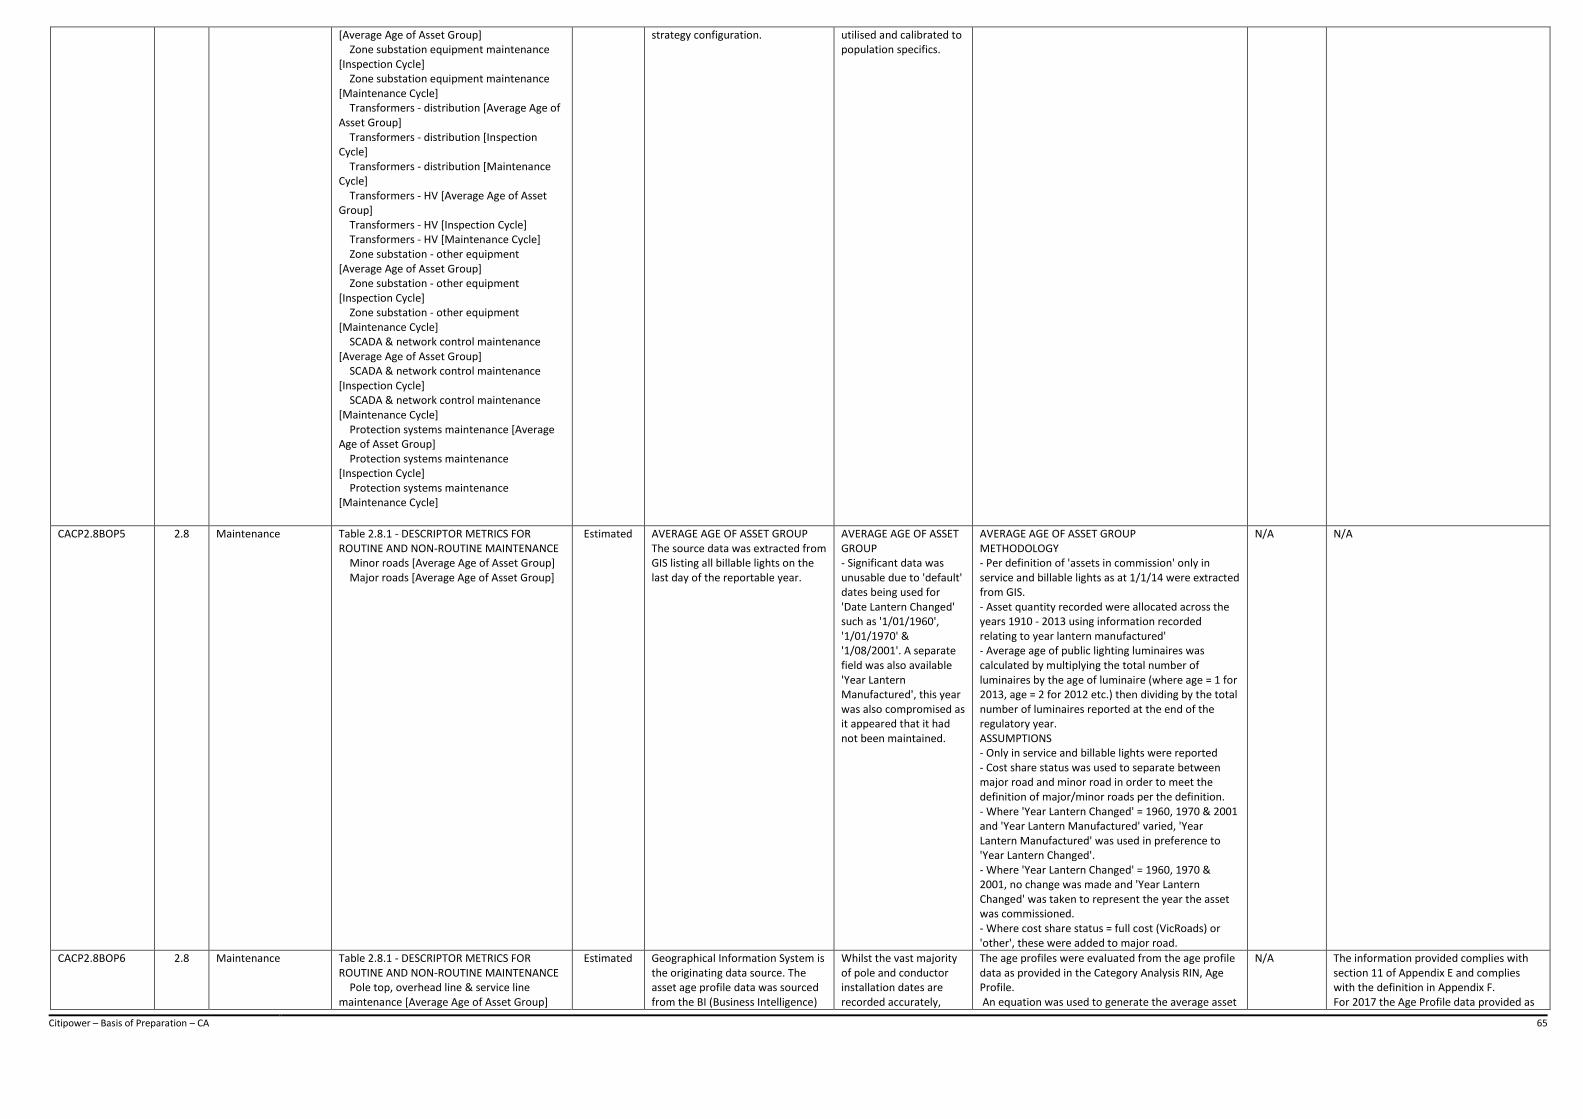
Citipower – Basis of Preparation – CA 65
[Average Age of Asset Group] Zone substation equipment maintenance [Inspection Cycle] Zone substation equipment maintenance [Maintenance Cycle] Transformers - distribution [Average Age of Asset Group] Transformers - distribution [Inspection Cycle] Transformers - distribution [Maintenance Cycle] Transformers - HV [Average Age of Asset Group] Transformers - HV [Inspection Cycle] Transformers - HV [Maintenance Cycle] Zone substation - other equipment [Average Age of Asset Group] Zone substation - other equipment [Inspection Cycle] Zone substation - other equipment [Maintenance Cycle] SCADA & network control maintenance [Average Age of Asset Group] SCADA & network control maintenance [Inspection Cycle] SCADA & network control maintenance [Maintenance Cycle] Protection systems maintenance [Average Age of Asset Group] Protection systems maintenance [Inspection Cycle] Protection systems maintenance [Maintenance Cycle]
strategy configuration. utilised and calibrated to population specifics.
CACP2.8BOP5 2.8 Maintenance Table 2.8.1 - DESCRIPTOR METRICS FOR ROUTINE AND NON-ROUTINE MAINTENANCE Minor roads [Average Age of Asset Group] Major roads [Average Age of Asset Group]
Estimated AVERAGE AGE OF ASSET GROUP The source data was extracted from GIS listing all billable lights on the last day of the reportable year.
AVERAGE AGE OF ASSET GROUP - Significant data was unusable due to 'default' dates being used for 'Date Lantern Changed' such as '1/01/1960', '1/01/1970' & '1/08/2001'. A separate field was also available 'Year Lantern Manufactured', this year was also compromised as it appeared that it had not been maintained.
AVERAGE AGE OF ASSET GROUP METHODOLOGY - Per definition of 'assets in commission' only in service and billable lights as at 1/1/14 were extracted from GIS. - Asset quantity recorded were allocated across the years 1910 - 2013 using information recorded relating to year lantern manufactured' - Average age of public lighting luminaires was calculated by multiplying the total number of luminaires by the age of luminaire (where age = 1 for 2013, age = 2 for 2012 etc.) then dividing by the total number of luminaires reported at the end of the regulatory year. ASSUMPTIONS - Only in service and billable lights were reported - Cost share status was used to separate between major road and minor road in order to meet the definition of major/minor roads per the definition. - Where 'Year Lantern Changed' = 1960, 1970 & 2001 and 'Year Lantern Manufactured' varied, 'Year Lantern Manufactured' was used in preference to 'Year Lantern Changed'. - Where 'Year Lantern Changed' = 1960, 1970 & 2001, no change was made and 'Year Lantern Changed' was taken to represent the year the asset was commissioned. - Where cost share status = full cost (VicRoads) or 'other', these were added to major road.
N/A N/A
CACP2.8BOP6 2.8 Maintenance Table 2.8.1 - DESCRIPTOR METRICS FOR ROUTINE AND NON-ROUTINE MAINTENANCE Pole top, overhead line & service line maintenance [Average Age of Asset Group]
Estimated Geographical Information System is the originating data source. The asset age profile data was sourced from the BI (Business Intelligence)
Whilst the vast majority of pole and conductor installation dates are recorded accurately,
The age profiles were evaluated from the age profile data as provided in the Category Analysis RIN, Age Profile. An equation was used to generate the average asset
N/A The information provided complies with section 11 of Appendix E and complies with the definition in Appendix F. For 2017 the Age Profile data provided as
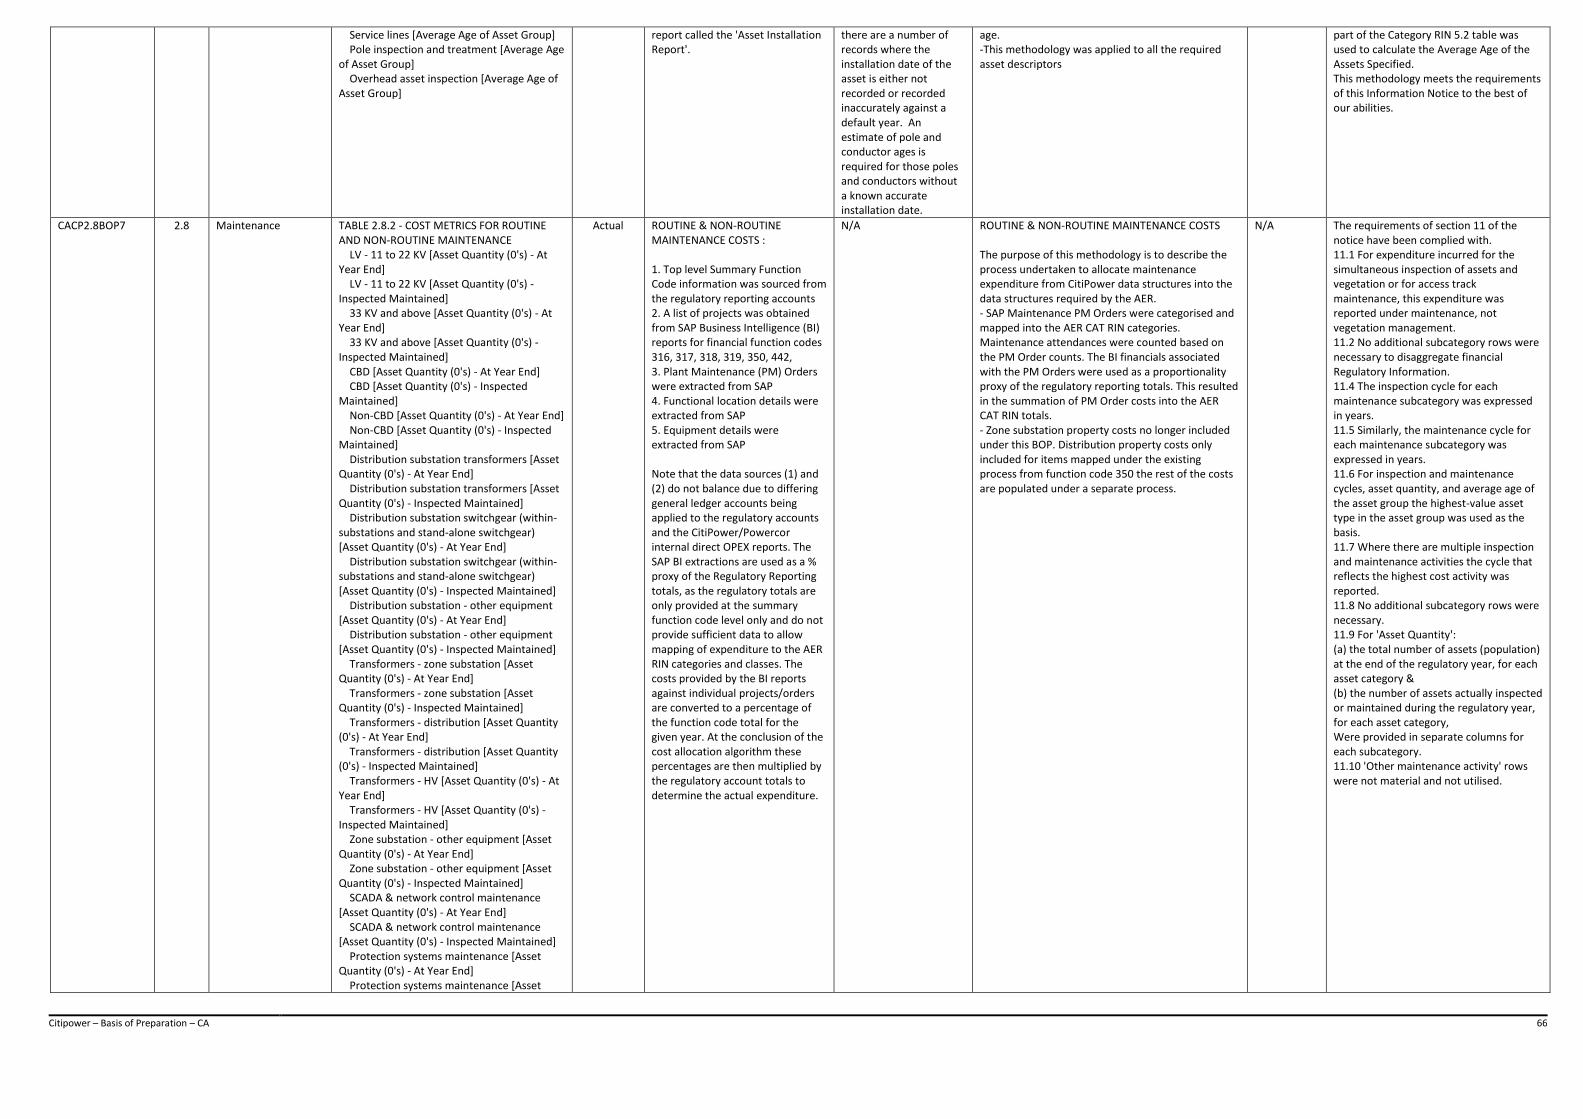
Citipower – Basis of Preparation – CA 66
Service lines [Average Age of Asset Group] Pole inspection and treatment [Average Age of Asset Group] Overhead asset inspection [Average Age of Asset Group]
report called the 'Asset Installation Report'.
there are a number of records where the installation date of the asset is either not recorded or recorded inaccurately against a default year. An estimate of pole and conductor ages is required for those poles and conductors without a known accurate installation date.
age. -This methodology was applied to all the required asset descriptors
part of the Category RIN 5.2 table was used to calculate the Average Age of the Assets Specified. This methodology meets the requirements of this Information Notice to the best of our abilities.
CACP2.8BOP7 2.8 Maintenance TABLE 2.8.2 - COST METRICS FOR ROUTINE AND NON-ROUTINE MAINTENANCE LV - 11 to 22 KV [Asset Quantity (0's) - At Year End] LV - 11 to 22 KV [Asset Quantity (0's) - Inspected Maintained] 33 KV and above [Asset Quantity (0's) - At Year End] 33 KV and above [Asset Quantity (0's) - Inspected Maintained] CBD [Asset Quantity (0's) - At Year End] CBD [Asset Quantity (0's) - Inspected Maintained] Non-CBD [Asset Quantity (0's) - At Year End] Non-CBD [Asset Quantity (0's) - Inspected Maintained] Distribution substation transformers [Asset Quantity (0's) - At Year End] Distribution substation transformers [Asset Quantity (0's) - Inspected Maintained] Distribution substation switchgear (within-substations and stand-alone switchgear) [Asset Quantity (0's) - At Year End] Distribution substation switchgear (within-substations and stand-alone switchgear) [Asset Quantity (0's) - Inspected Maintained] Distribution substation - other equipment [Asset Quantity (0's) - At Year End] Distribution substation - other equipment [Asset Quantity (0's) - Inspected Maintained] Transformers - zone substation [Asset Quantity (0's) - At Year End] Transformers - zone substation [Asset Quantity (0's) - Inspected Maintained] Transformers - distribution [Asset Quantity (0's) - At Year End] Transformers - distribution [Asset Quantity (0's) - Inspected Maintained] Transformers - HV [Asset Quantity (0's) - At Year End] Transformers - HV [Asset Quantity (0's) - Inspected Maintained] Zone substation - other equipment [Asset Quantity (0's) - At Year End] Zone substation - other equipment [Asset Quantity (0's) - Inspected Maintained] SCADA & network control maintenance [Asset Quantity (0's) - At Year End] SCADA & network control maintenance [Asset Quantity (0's) - Inspected Maintained] Protection systems maintenance [Asset Quantity (0's) - At Year End] Protection systems maintenance [Asset
Actual ROUTINE & NON-ROUTINE MAINTENANCE COSTS : 1. Top level Summary Function Code information was sourced from the regulatory reporting accounts 2. A list of projects was obtained from SAP Business Intelligence (BI) reports for financial function codes 316, 317, 318, 319, 350, 442, 3. Plant Maintenance (PM) Orders were extracted from SAP 4. Functional location details were extracted from SAP 5. Equipment details were extracted from SAP Note that the data sources (1) and (2) do not balance due to differing general ledger accounts being applied to the regulatory accounts and the CitiPower/Powercor internal direct OPEX reports. The SAP BI extractions are used as a % proxy of the Regulatory Reporting totals, as the regulatory totals are only provided at the summary function code level only and do not provide sufficient data to allow mapping of expenditure to the AER RIN categories and classes. The costs provided by the BI reports against individual projects/orders are converted to a percentage of the function code total for the given year. At the conclusion of the cost allocation algorithm these percentages are then multiplied by the regulatory account totals to determine the actual expenditure.
N/A ROUTINE & NON-ROUTINE MAINTENANCE COSTS The purpose of this methodology is to describe the process undertaken to allocate maintenance expenditure from CitiPower data structures into the data structures required by the AER. - SAP Maintenance PM Orders were categorised and mapped into the AER CAT RIN categories. Maintenance attendances were counted based on the PM Order counts. The BI financials associated with the PM Orders were used as a proportionality proxy of the regulatory reporting totals. This resulted in the summation of PM Order costs into the AER CAT RIN totals. - Zone substation property costs no longer included under this BOP. Distribution property costs only included for items mapped under the existing process from function code 350 the rest of the costs are populated under a separate process.
N/A The requirements of section 11 of the notice have been complied with. 11.1 For expenditure incurred for the simultaneous inspection of assets and vegetation or for access track maintenance, this expenditure was reported under maintenance, not vegetation management. 11.2 No additional subcategory rows were necessary to disaggregate financial Regulatory Information. 11.4 The inspection cycle for each maintenance subcategory was expressed in years. 11.5 Similarly, the maintenance cycle for each maintenance subcategory was expressed in years. 11.6 For inspection and maintenance cycles, asset quantity, and average age of the asset group the highest-value asset type in the asset group was used as the basis. 11.7 Where there are multiple inspection and maintenance activities the cycle that reflects the highest cost activity was reported. 11.8 No additional subcategory rows were necessary. 11.9 For 'Asset Quantity': (a) the total number of assets (population) at the end of the regulatory year, for each asset category & (b) the number of assets actually inspected or maintained during the regulatory year, for each asset category, Were provided in separate columns for each subcategory. 11.10 'Other maintenance activity' rows were not material and not utilised.
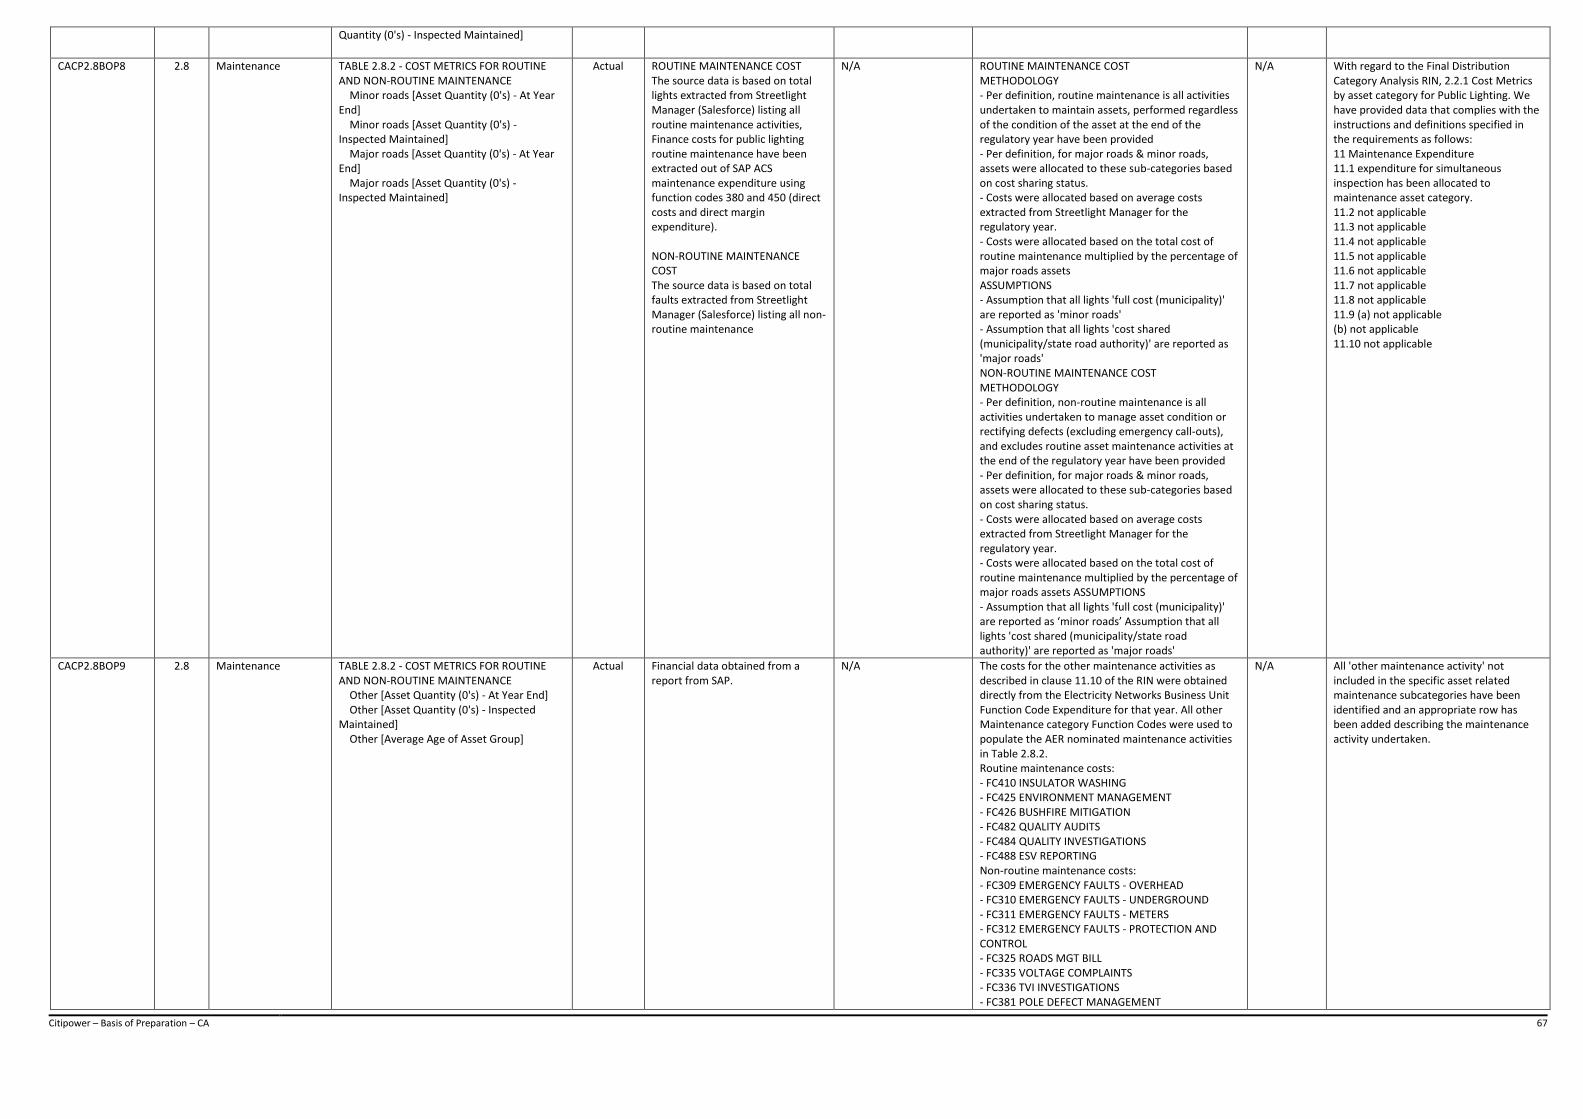
Citipower – Basis of Preparation – CA 67
Quantity (0's) - Inspected Maintained]
CACP2.8BOP8 2.8 Maintenance TABLE 2.8.2 - COST METRICS FOR ROUTINE AND NON-ROUTINE MAINTENANCE Minor roads [Asset Quantity (0's) - At Year End] Minor roads [Asset Quantity (0's) - Inspected Maintained] Major roads [Asset Quantity (0's) - At Year End] Major roads [Asset Quantity (0's) - Inspected Maintained]
Actual ROUTINE MAINTENANCE COST The source data is based on total lights extracted from Streetlight Manager (Salesforce) listing all routine maintenance activities, Finance costs for public lighting routine maintenance have been extracted out of SAP ACS maintenance expenditure using function codes 380 and 450 (direct costs and direct margin expenditure). NON-ROUTINE MAINTENANCE COST The source data is based on total faults extracted from Streetlight Manager (Salesforce) listing all non-routine maintenance
N/A ROUTINE MAINTENANCE COST METHODOLOGY - Per definition, routine maintenance is all activities undertaken to maintain assets, performed regardless of the condition of the asset at the end of the regulatory year have been provided - Per definition, for major roads & minor roads, assets were allocated to these sub-categories based on cost sharing status. - Costs were allocated based on average costs extracted from Streetlight Manager for the regulatory year. - Costs were allocated based on the total cost of routine maintenance multiplied by the percentage of major roads assets ASSUMPTIONS - Assumption that all lights 'full cost (municipality)' are reported as 'minor roads' - Assumption that all lights 'cost shared (municipality/state road authority)' are reported as 'major roads' NON-ROUTINE MAINTENANCE COST METHODOLOGY - Per definition, non-routine maintenance is all activities undertaken to manage asset condition or rectifying defects (excluding emergency call-outs), and excludes routine asset maintenance activities at the end of the regulatory year have been provided - Per definition, for major roads & minor roads, assets were allocated to these sub-categories based on cost sharing status. - Costs were allocated based on average costs extracted from Streetlight Manager for the regulatory year. - Costs were allocated based on the total cost of routine maintenance multiplied by the percentage of major roads assets ASSUMPTIONS - Assumption that all lights 'full cost (municipality)' are reported as ‘minor roads’ Assumption that all lights 'cost shared (municipality/state road authority)' are reported as 'major roads'
N/A With regard to the Final Distribution Category Analysis RIN, 2.2.1 Cost Metrics by asset category for Public Lighting. We have provided data that complies with the instructions and definitions specified in the requirements as follows: 11 Maintenance Expenditure 11.1 expenditure for simultaneous inspection has been allocated to maintenance asset category. 11.2 not applicable 11.3 not applicable 11.4 not applicable 11.5 not applicable 11.6 not applicable 11.7 not applicable 11.8 not applicable 11.9 (a) not applicable (b) not applicable 11.10 not applicable
CACP2.8BOP9 2.8 Maintenance TABLE 2.8.2 - COST METRICS FOR ROUTINE AND NON-ROUTINE MAINTENANCE Other [Asset Quantity (0's) - At Year End] Other [Asset Quantity (0's) - Inspected Maintained] Other [Average Age of Asset Group]
Actual Financial data obtained from a report from SAP.
N/A The costs for the other maintenance activities as described in clause 11.10 of the RIN were obtained directly from the Electricity Networks Business Unit Function Code Expenditure for that year. All other Maintenance category Function Codes were used to populate the AER nominated maintenance activities in Table 2.8.2. Routine maintenance costs: - FC410 INSULATOR WASHING - FC425 ENVIRONMENT MANAGEMENT - FC426 BUSHFIRE MITIGATION - FC482 QUALITY AUDITS - FC484 QUALITY INVESTIGATIONS - FC488 ESV REPORTING Non-routine maintenance costs: - FC309 EMERGENCY FAULTS - OVERHEAD - FC310 EMERGENCY FAULTS - UNDERGROUND - FC311 EMERGENCY FAULTS - METERS - FC312 EMERGENCY FAULTS - PROTECTION AND CONTROL - FC325 ROADS MGT BILL - FC335 VOLTAGE COMPLAINTS - FC336 TVI INVESTIGATIONS - FC381 POLE DEFECT MANAGEMENT
N/A All 'other maintenance activity' not included in the specific asset related maintenance subcategories have been identified and an appropriate row has been added describing the maintenance activity undertaken.
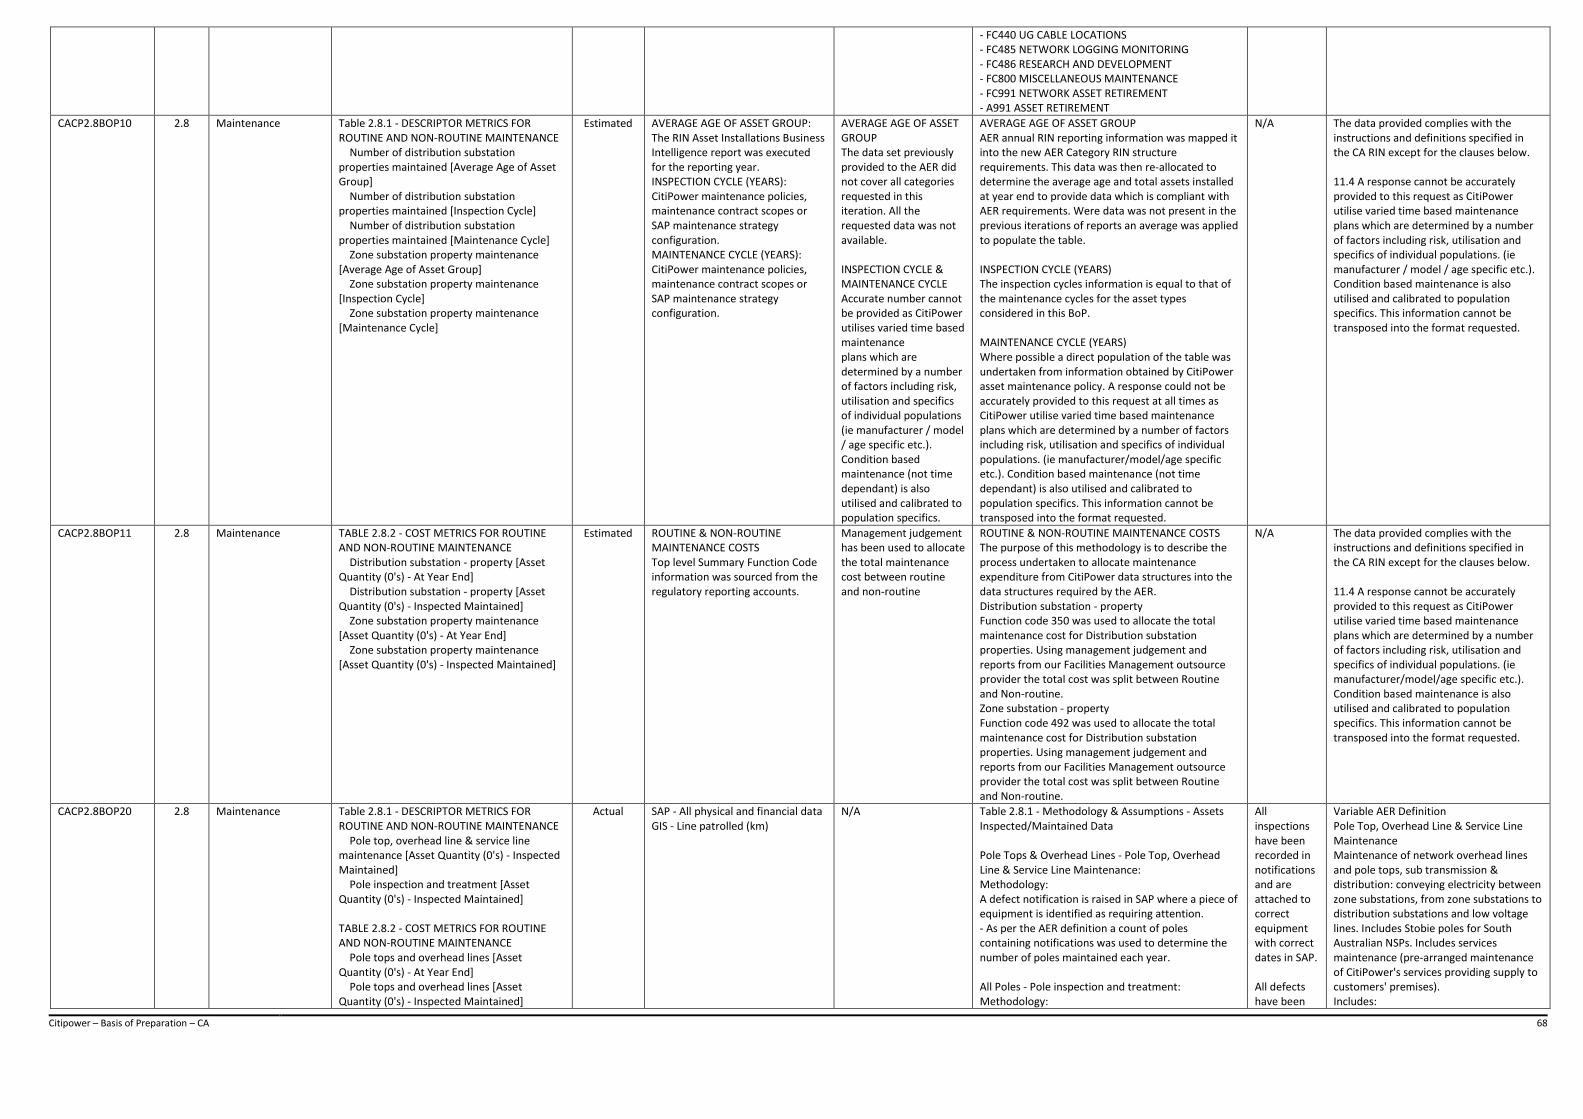
Citipower – Basis of Preparation – CA 68
- FC440 UG CABLE LOCATIONS - FC485 NETWORK LOGGING MONITORING - FC486 RESEARCH AND DEVELOPMENT - FC800 MISCELLANEOUS MAINTENANCE - FC991 NETWORK ASSET RETIREMENT - A991 ASSET RETIREMENT
CACP2.8BOP10 2.8 Maintenance Table 2.8.1 - DESCRIPTOR METRICS FOR ROUTINE AND NON-ROUTINE MAINTENANCE Number of distribution substation properties maintained [Average Age of Asset Group] Number of distribution substation properties maintained [Inspection Cycle] Number of distribution substation properties maintained [Maintenance Cycle] Zone substation property maintenance [Average Age of Asset Group] Zone substation property maintenance [Inspection Cycle] Zone substation property maintenance [Maintenance Cycle]
Estimated AVERAGE AGE OF ASSET GROUP: The RIN Asset Installations Business Intelligence report was executed for the reporting year. INSPECTION CYCLE (YEARS): CitiPower maintenance policies, maintenance contract scopes or SAP maintenance strategy configuration. MAINTENANCE CYCLE (YEARS): CitiPower maintenance policies, maintenance contract scopes or SAP maintenance strategy configuration.
AVERAGE AGE OF ASSET GROUP The data set previously provided to the AER did not cover all categories requested in this iteration. All the requested data was not available. INSPECTION CYCLE & MAINTENANCE CYCLE Accurate number cannot be provided as CitiPower utilises varied time based maintenance plans which are determined by a number of factors including risk, utilisation and specifics of individual populations (ie manufacturer / model / age specific etc.). Condition based maintenance (not time dependant) is also utilised and calibrated to population specifics.
AVERAGE AGE OF ASSET GROUP AER annual RIN reporting information was mapped it into the new AER Category RIN structure requirements. This data was then re-allocated to determine the average age and total assets installed at year end to provide data which is compliant with AER requirements. Were data was not present in the previous iterations of reports an average was applied to populate the table. INSPECTION CYCLE (YEARS) The inspection cycles information is equal to that of the maintenance cycles for the asset types considered in this BoP. MAINTENANCE CYCLE (YEARS) Where possible a direct population of the table was undertaken from information obtained by CitiPower asset maintenance policy. A response could not be accurately provided to this request at all times as CitiPower utilise varied time based maintenance plans which are determined by a number of factors including risk, utilisation and specifics of individual populations. (ie manufacturer/model/age specific etc.). Condition based maintenance (not time dependant) is also utilised and calibrated to population specifics. This information cannot be transposed into the format requested.
N/A The data provided complies with the instructions and definitions specified in the CA RIN except for the clauses below. 11.4 A response cannot be accurately provided to this request as CitiPower utilise varied time based maintenance plans which are determined by a number of factors including risk, utilisation and specifics of individual populations. (ie manufacturer / model / age specific etc.). Condition based maintenance is also utilised and calibrated to population specifics. This information cannot be transposed into the format requested.
CACP2.8BOP11 2.8 Maintenance TABLE 2.8.2 - COST METRICS FOR ROUTINE AND NON-ROUTINE MAINTENANCE Distribution substation - property [Asset Quantity (0's) - At Year End] Distribution substation - property [Asset Quantity (0's) - Inspected Maintained] Zone substation property maintenance [Asset Quantity (0's) - At Year End] Zone substation property maintenance [Asset Quantity (0's) - Inspected Maintained]
Estimated ROUTINE & NON-ROUTINE MAINTENANCE COSTS Top level Summary Function Code information was sourced from the regulatory reporting accounts.
Management judgement has been used to allocate the total maintenance cost between routine and non-routine
ROUTINE & NON-ROUTINE MAINTENANCE COSTS The purpose of this methodology is to describe the process undertaken to allocate maintenance expenditure from CitiPower data structures into the data structures required by the AER. Distribution substation - property Function code 350 was used to allocate the total maintenance cost for Distribution substation properties. Using management judgement and reports from our Facilities Management outsource provider the total cost was split between Routine and Non-routine. Zone substation - property Function code 492 was used to allocate the total maintenance cost for Distribution substation properties. Using management judgement and reports from our Facilities Management outsource provider the total cost was split between Routine and Non-routine.
N/A The data provided complies with the instructions and definitions specified in the CA RIN except for the clauses below. 11.4 A response cannot be accurately provided to this request as CitiPower utilise varied time based maintenance plans which are determined by a number of factors including risk, utilisation and specifics of individual populations. (ie manufacturer/model/age specific etc.). Condition based maintenance is also utilised and calibrated to population specifics. This information cannot be transposed into the format requested.
CACP2.8BOP20 2.8 Maintenance Table 2.8.1 - DESCRIPTOR METRICS FOR ROUTINE AND NON-ROUTINE MAINTENANCE Pole top, overhead line & service line maintenance [Asset Quantity (0's) - Inspected Maintained] Pole inspection and treatment [Asset Quantity (0's) - Inspected Maintained] TABLE 2.8.2 - COST METRICS FOR ROUTINE AND NON-ROUTINE MAINTENANCE Pole tops and overhead lines [Asset Quantity (0's) - At Year End] Pole tops and overhead lines [Asset Quantity (0's) - Inspected Maintained]
Actual SAP - All physical and financial data GIS - Line patrolled (km)
N/A Table 2.8.1 - Methodology & Assumptions - Assets Inspected/Maintained Data Pole Tops & Overhead Lines - Pole Top, Overhead Line & Service Line Maintenance: Methodology: A defect notification is raised in SAP where a piece of equipment is identified as requiring attention. - As per the AER definition a count of poles containing notifications was used to determine the number of poles maintained each year. All Poles - Pole inspection and treatment: Methodology:
All inspections have been recorded in notifications and are attached to correct equipment with correct dates in SAP. All defects have been
Variable AER Definition Pole Top, Overhead Line & Service Line Maintenance Maintenance of network overhead lines and pole tops, sub transmission & distribution: conveying electricity between zone substations, from zone substations to distribution substations and low voltage lines. Includes Stobie poles for South Australian NSPs. Includes services maintenance (pre-arranged maintenance of CitiPower's services providing supply to customers' premises). Includes:
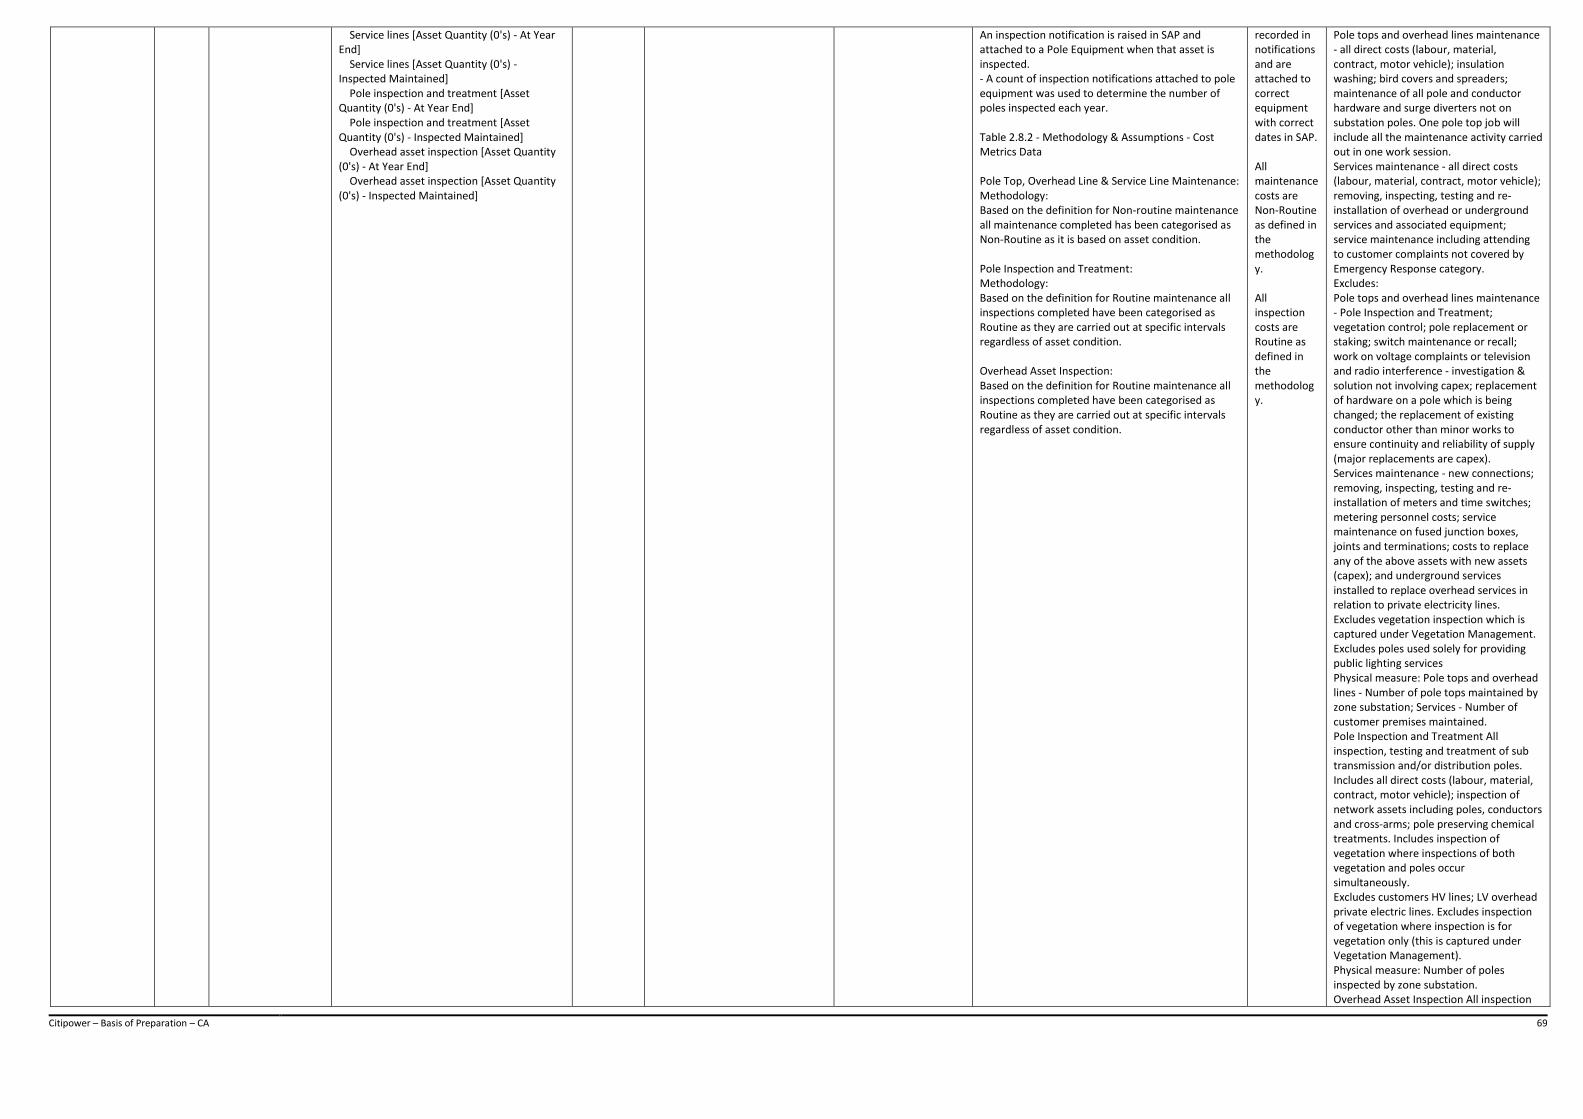
Citipower – Basis of Preparation – CA 69
Service lines [Asset Quantity (0's) - At Year End] Service lines [Asset Quantity (0's) - Inspected Maintained] Pole inspection and treatment [Asset Quantity (0's) - At Year End] Pole inspection and treatment [Asset Quantity (0's) - Inspected Maintained] Overhead asset inspection [Asset Quantity (0's) - At Year End] Overhead asset inspection [Asset Quantity (0's) - Inspected Maintained]
An inspection notification is raised in SAP and attached to a Pole Equipment when that asset is inspected. - A count of inspection notifications attached to pole equipment was used to determine the number of poles inspected each year. Table 2.8.2 - Methodology & Assumptions - Cost Metrics Data Pole Top, Overhead Line & Service Line Maintenance: Methodology: Based on the definition for Non-routine maintenance all maintenance completed has been categorised as Non-Routine as it is based on asset condition. Pole Inspection and Treatment: Methodology: Based on the definition for Routine maintenance all inspections completed have been categorised as Routine as they are carried out at specific intervals regardless of asset condition. Overhead Asset Inspection: Based on the definition for Routine maintenance all inspections completed have been categorised as Routine as they are carried out at specific intervals regardless of asset condition.
recorded in notifications and are attached to correct equipment with correct dates in SAP. All maintenance costs are Non-Routine as defined in the methodology. All inspection costs are Routine as defined in the methodology.
Pole tops and overhead lines maintenance - all direct costs (labour, material, contract, motor vehicle); insulation washing; bird covers and spreaders; maintenance of all pole and conductor hardware and surge diverters not on substation poles. One pole top job will include all the maintenance activity carried out in one work session. Services maintenance - all direct costs (labour, material, contract, motor vehicle); removing, inspecting, testing and re-installation of overhead or underground services and associated equipment; service maintenance including attending to customer complaints not covered by Emergency Response category. Excludes: Pole tops and overhead lines maintenance - Pole Inspection and Treatment; vegetation control; pole replacement or staking; switch maintenance or recall; work on voltage complaints or television and radio interference - investigation & solution not involving capex; replacement of hardware on a pole which is being changed; the replacement of existing conductor other than minor works to ensure continuity and reliability of supply (major replacements are capex). Services maintenance - new connections; removing, inspecting, testing and re-installation of meters and time switches; metering personnel costs; service maintenance on fused junction boxes, joints and terminations; costs to replace any of the above assets with new assets (capex); and underground services installed to replace overhead services in relation to private electricity lines. Excludes vegetation inspection which is captured under Vegetation Management. Excludes poles used solely for providing public lighting services Physical measure: Pole tops and overhead lines - Number of pole tops maintained by zone substation; Services - Number of customer premises maintained. Pole Inspection and Treatment All inspection, testing and treatment of sub transmission and/or distribution poles. Includes all direct costs (labour, material, contract, motor vehicle); inspection of network assets including poles, conductors and cross-arms; pole preserving chemical treatments. Includes inspection of vegetation where inspections of both vegetation and poles occur simultaneously. Excludes customers HV lines; LV overhead private electric lines. Excludes inspection of vegetation where inspection is for vegetation only (this is captured under Vegetation Management). Physical measure: Number of poles inspected by zone substation. Overhead Asset Inspection All inspection

Citipower – Basis of Preparation – CA 70
of network overhead assets. Includes all direct costs (labour, material, contract, motor vehicle); thermal survey programs. Physical measure: Route km line patrolled by zone substation In 2017 CP commenced capitalising pole inspection costs against pole replacement and staking activities resulting in pole inspection in 2.8 reducing to 0 cost and an increase in cost for 2.2 for pole staking and replacement.
CACP2.8BOP21 2.8 Maintenance Table 2.8.1 - DESCRIPTOR METRICS FOR ROUTINE AND NON-ROUTINE MAINTENANCE Service lines [Asset Quantity (0's) - Inspected Maintained]
Estimated SAP 2.8.1 Service Lines - Pole top, Overhead Line & Service Line replacement is estimated because there is no link between the aerial service asset and the customer information.
Service Lines - Pole Top, Overhead Line & Service Line Maintenance: There is no customer details associated with the notifications that are raised in SAP it was assumed there is one to one relationship between an aerial service and a customer. A count of aerial services maintained was used to determine the number of customers maintained each year
All inspections have been recorded in notifications and are attached to correct equipment with correct dates in SAP. There is a one to one relationship between aerial services and customers (as per methodology statement).
Variable AER Definition Pole Top, Overhead Line & Service Line Maintenance Maintenance of network overhead lines and pole tops, sub transmission & distribution: conveying electricity between zone substations, from zone substations to distribution substations and low voltage lines. Includes Stobie poles for South Australian NSPs. Includes services maintenance (pre-arranged maintenance of CitiPower's services providing supply to customers' premises). Includes: Pole tops and overhead lines maintenance - all direct costs (labour, material, contract, motor vehicle); insulation washing; bird covers and spreaders; maintenance of all pole and conductor hardware and surge diverters not on substation poles. One pole top job will include all the maintenance activity carried out in one work session. Services maintenance - all direct costs (labour, material, contract, motor vehicle); removing, inspecting, testing and re-installation of overhead or underground services and associated equipment; service maintenance including attending to customer complaints not covered by Emergency Response category. Excludes: Pole tops and overhead lines maintenance - Pole Inspection and Treatment; vegetation control; pole replacement or staking; switch maintenance or recall; work on voltage complaints or television and radio interference - investigation & solution not involving capex; replacement of hardware on a pole which is being changed; the replacement of existing conductor other than minor works to ensure continuity and reliability of supply (major replacements are capex). Services maintenance - new connections; removing, inspecting, testing and re-installation of meters and time switches; metering personnel costs; service maintenance on fused junction boxes, joints and terminations; costs to replace any of the above assets with new assets (capex); and underground services installed to replace overhead services in relation to private electricity lines. Excludes vegetation inspection which is
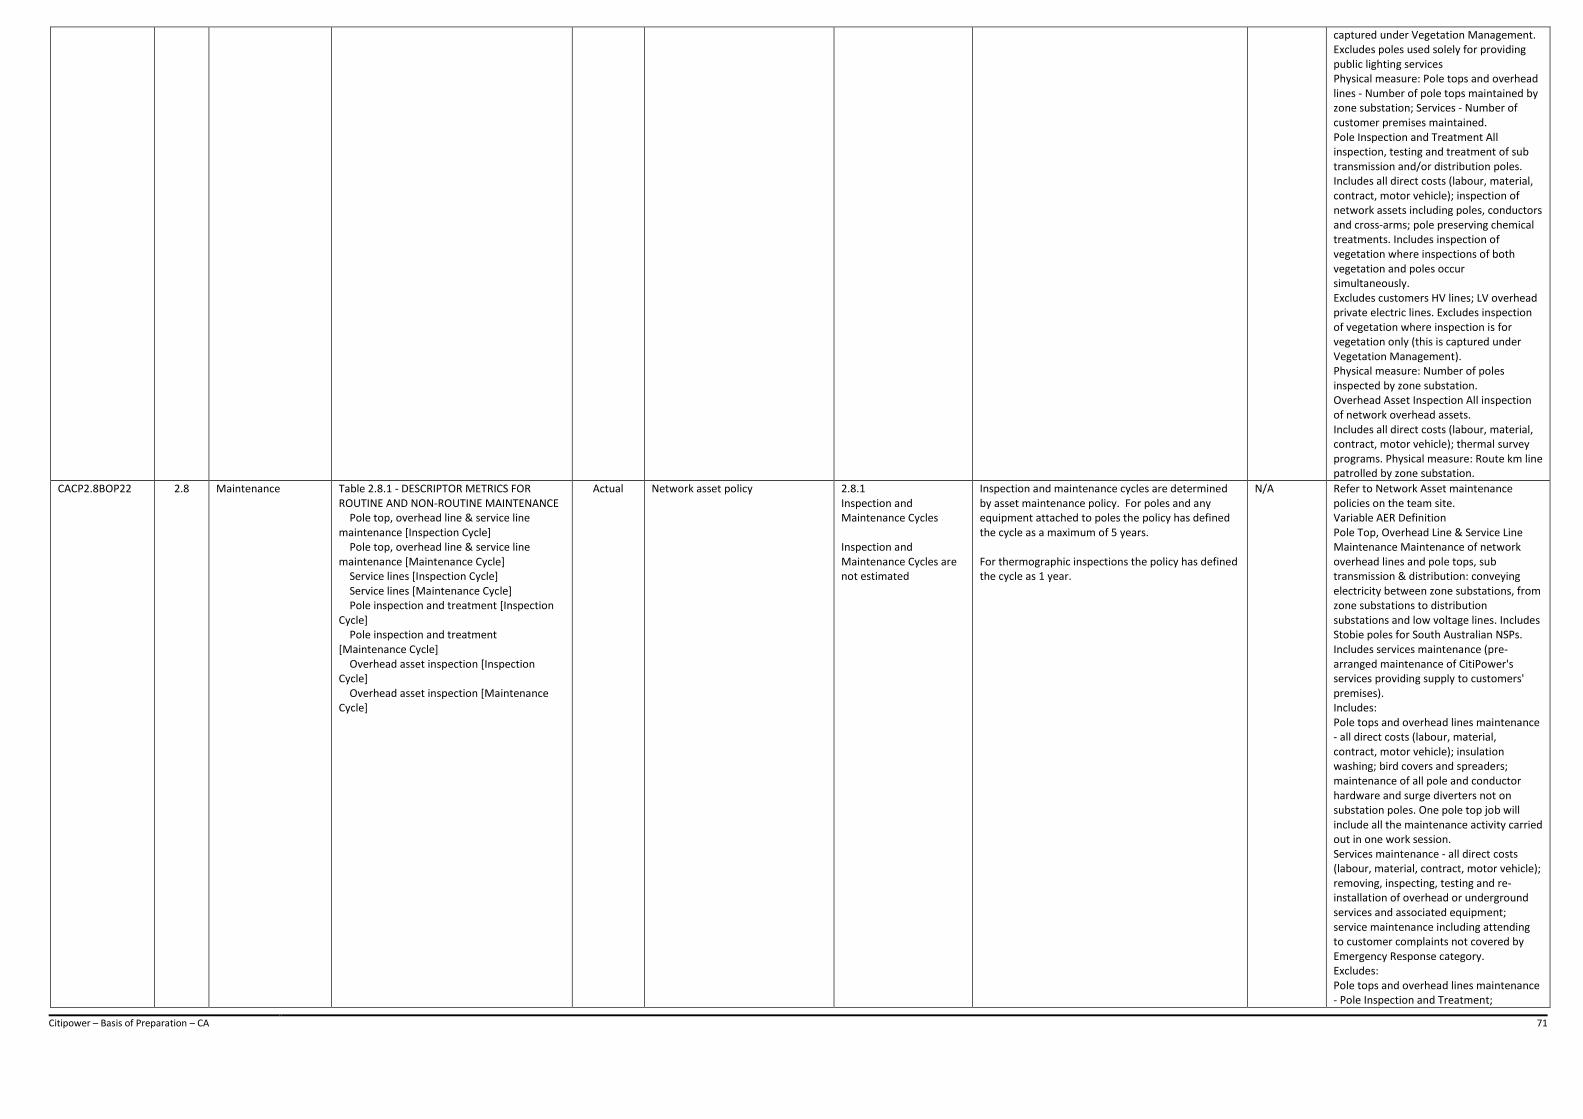
Citipower – Basis of Preparation – CA 71
captured under Vegetation Management. Excludes poles used solely for providing public lighting services Physical measure: Pole tops and overhead lines - Number of pole tops maintained by zone substation; Services - Number of customer premises maintained. Pole Inspection and Treatment All inspection, testing and treatment of sub transmission and/or distribution poles. Includes all direct costs (labour, material, contract, motor vehicle); inspection of network assets including poles, conductors and cross-arms; pole preserving chemical treatments. Includes inspection of vegetation where inspections of both vegetation and poles occur simultaneously. Excludes customers HV lines; LV overhead private electric lines. Excludes inspection of vegetation where inspection is for vegetation only (this is captured under Vegetation Management). Physical measure: Number of poles inspected by zone substation. Overhead Asset Inspection All inspection of network overhead assets. Includes all direct costs (labour, material, contract, motor vehicle); thermal survey programs. Physical measure: Route km line patrolled by zone substation.
CACP2.8BOP22 2.8 Maintenance Table 2.8.1 - DESCRIPTOR METRICS FOR ROUTINE AND NON-ROUTINE MAINTENANCE Pole top, overhead line & service line maintenance [Inspection Cycle] Pole top, overhead line & service line maintenance [Maintenance Cycle] Service lines [Inspection Cycle] Service lines [Maintenance Cycle] Pole inspection and treatment [Inspection Cycle] Pole inspection and treatment [Maintenance Cycle] Overhead asset inspection [Inspection Cycle] Overhead asset inspection [Maintenance Cycle]
Actual Network asset policy 2.8.1 Inspection and Maintenance Cycles Inspection and Maintenance Cycles are not estimated
Inspection and maintenance cycles are determined by asset maintenance policy. For poles and any equipment attached to poles the policy has defined the cycle as a maximum of 5 years. For thermographic inspections the policy has defined the cycle as 1 year.
N/A Refer to Network Asset maintenance policies on the team site. Variable AER Definition Pole Top, Overhead Line & Service Line Maintenance Maintenance of network overhead lines and pole tops, sub transmission & distribution: conveying electricity between zone substations, from zone substations to distribution substations and low voltage lines. Includes Stobie poles for South Australian NSPs. Includes services maintenance (pre-arranged maintenance of CitiPower's services providing supply to customers' premises). Includes: Pole tops and overhead lines maintenance - all direct costs (labour, material, contract, motor vehicle); insulation washing; bird covers and spreaders; maintenance of all pole and conductor hardware and surge diverters not on substation poles. One pole top job will include all the maintenance activity carried out in one work session. Services maintenance - all direct costs (labour, material, contract, motor vehicle); removing, inspecting, testing and re-installation of overhead or underground services and associated equipment; service maintenance including attending to customer complaints not covered by Emergency Response category. Excludes: Pole tops and overhead lines maintenance - Pole Inspection and Treatment;
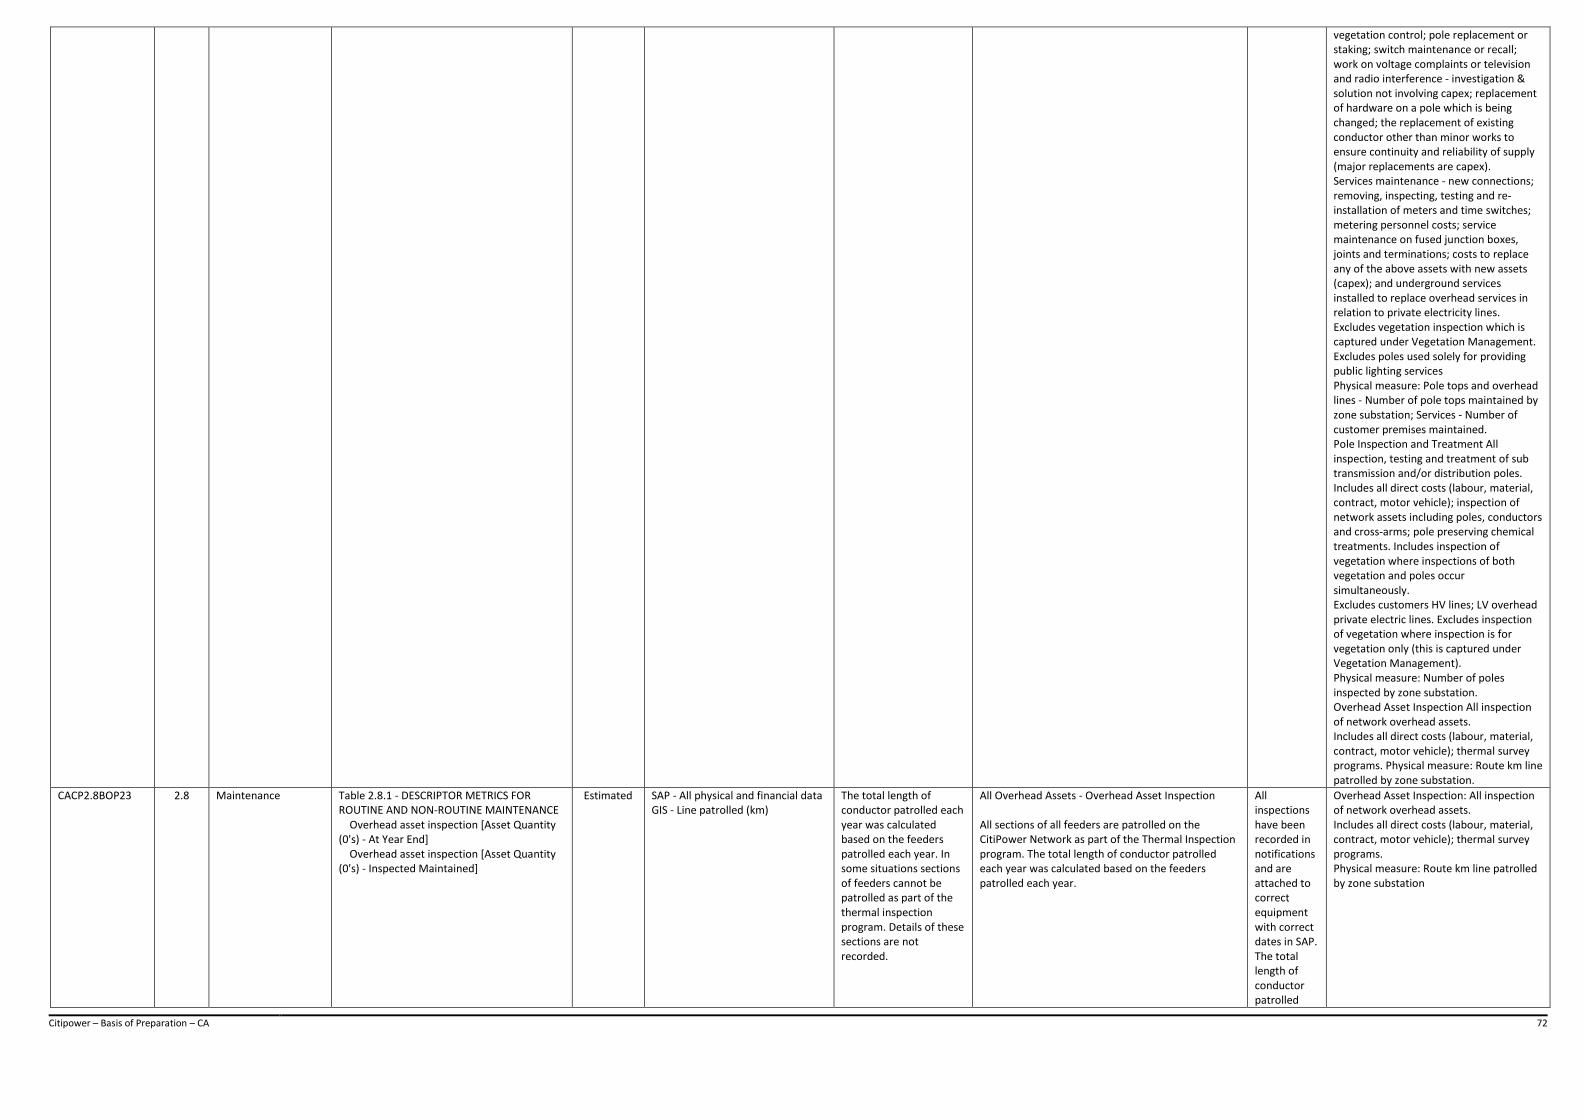
Citipower – Basis of Preparation – CA 72
vegetation control; pole replacement or staking; switch maintenance or recall; work on voltage complaints or television and radio interference - investigation & solution not involving capex; replacement of hardware on a pole which is being changed; the replacement of existing conductor other than minor works to ensure continuity and reliability of supply (major replacements are capex). Services maintenance - new connections; removing, inspecting, testing and re-installation of meters and time switches; metering personnel costs; service maintenance on fused junction boxes, joints and terminations; costs to replace any of the above assets with new assets (capex); and underground services installed to replace overhead services in relation to private electricity lines. Excludes vegetation inspection which is captured under Vegetation Management. Excludes poles used solely for providing public lighting services Physical measure: Pole tops and overhead lines - Number of pole tops maintained by zone substation; Services - Number of customer premises maintained. Pole Inspection and Treatment All inspection, testing and treatment of sub transmission and/or distribution poles. Includes all direct costs (labour, material, contract, motor vehicle); inspection of network assets including poles, conductors and cross-arms; pole preserving chemical treatments. Includes inspection of vegetation where inspections of both vegetation and poles occur simultaneously. Excludes customers HV lines; LV overhead private electric lines. Excludes inspection of vegetation where inspection is for vegetation only (this is captured under Vegetation Management). Physical measure: Number of poles inspected by zone substation. Overhead Asset Inspection All inspection of network overhead assets. Includes all direct costs (labour, material, contract, motor vehicle); thermal survey programs. Physical measure: Route km line patrolled by zone substation.
CACP2.8BOP23 2.8 Maintenance Table 2.8.1 - DESCRIPTOR METRICS FOR ROUTINE AND NON-ROUTINE MAINTENANCE Overhead asset inspection [Asset Quantity (0's) - At Year End] Overhead asset inspection [Asset Quantity (0's) - Inspected Maintained]
Estimated SAP - All physical and financial data GIS - Line patrolled (km)
The total length of conductor patrolled each year was calculated based on the feeders patrolled each year. In some situations sections of feeders cannot be patrolled as part of the thermal inspection program. Details of these sections are not recorded.
All Overhead Assets - Overhead Asset Inspection All sections of all feeders are patrolled on the CitiPower Network as part of the Thermal Inspection program. The total length of conductor patrolled each year was calculated based on the feeders patrolled each year.
All inspections have been recorded in notifications and are attached to correct equipment with correct dates in SAP. The total length of conductor patrolled
Overhead Asset Inspection: All inspection of network overhead assets. Includes all direct costs (labour, material, contract, motor vehicle); thermal survey programs. Physical measure: Route km line patrolled by zone substation
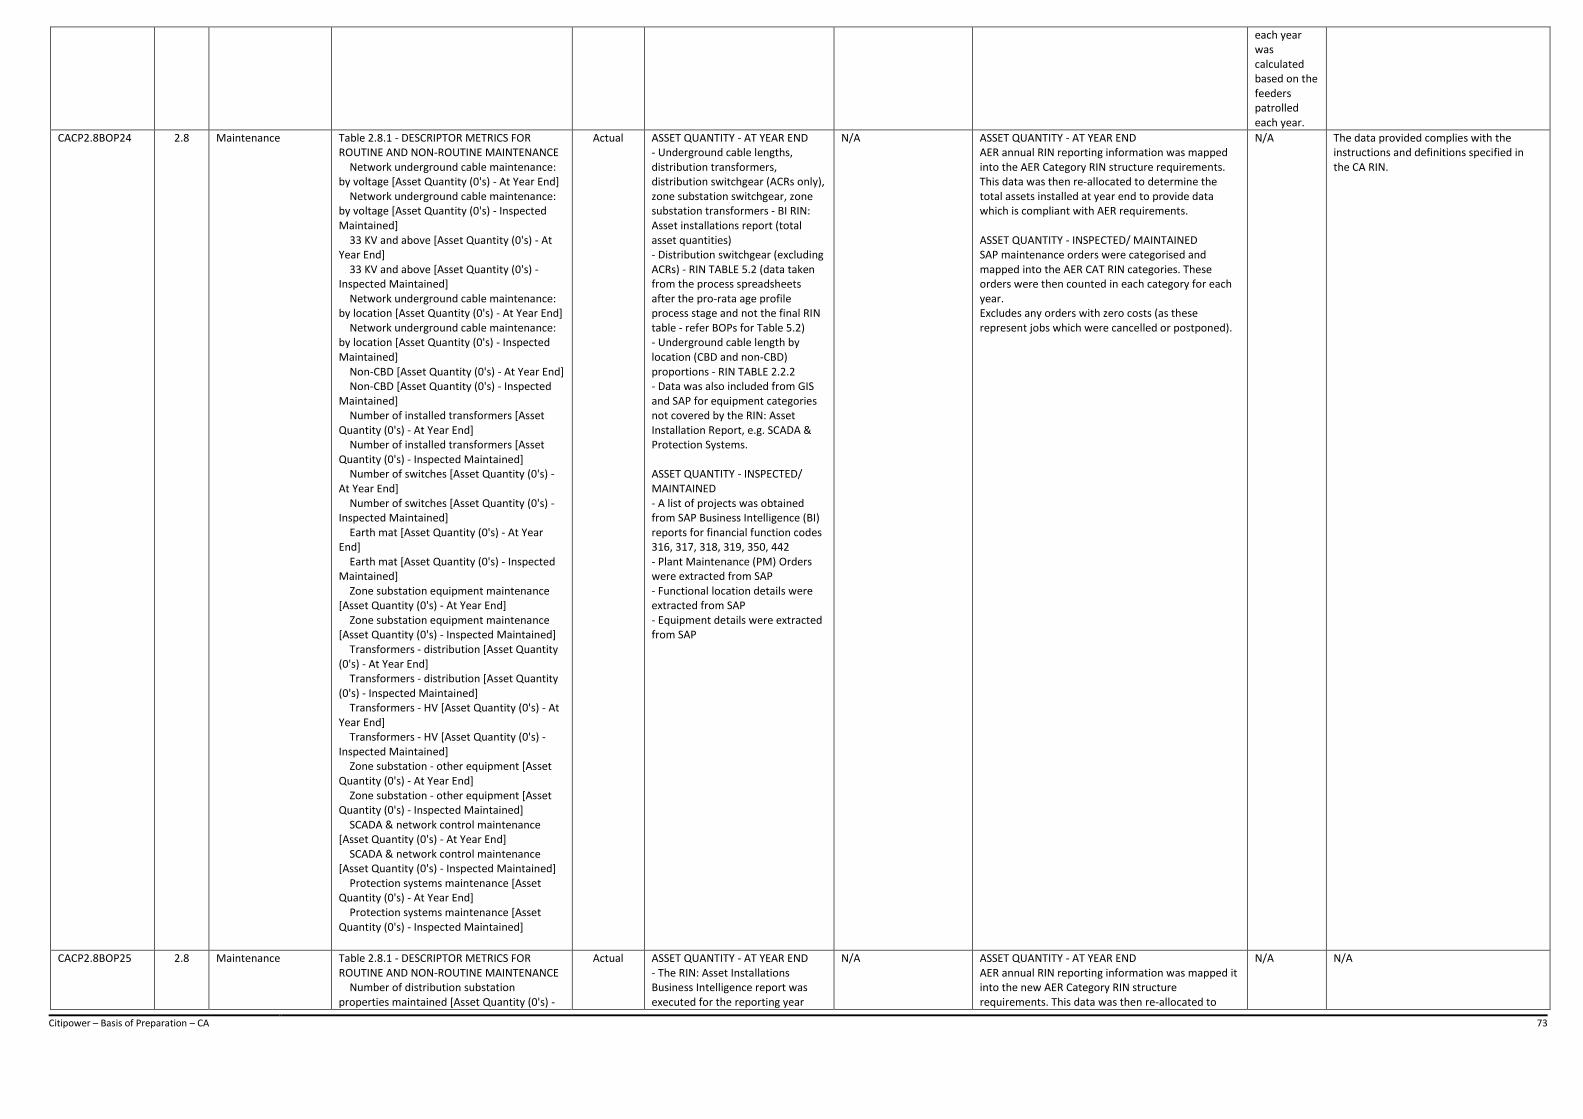
Citipower – Basis of Preparation – CA 73
each year was calculated based on the feeders patrolled each year.
CACP2.8BOP24 2.8 Maintenance Table 2.8.1 - DESCRIPTOR METRICS FOR ROUTINE AND NON-ROUTINE MAINTENANCE Network underground cable maintenance: by voltage [Asset Quantity (0's) - At Year End] Network underground cable maintenance: by voltage [Asset Quantity (0's) - Inspected Maintained] 33 KV and above [Asset Quantity (0's) - At Year End] 33 KV and above [Asset Quantity (0's) - Inspected Maintained] Network underground cable maintenance: by location [Asset Quantity (0's) - At Year End] Network underground cable maintenance: by location [Asset Quantity (0's) - Inspected Maintained] Non-CBD [Asset Quantity (0's) - At Year End] Non-CBD [Asset Quantity (0's) - Inspected Maintained] Number of installed transformers [Asset Quantity (0's) - At Year End] Number of installed transformers [Asset Quantity (0's) - Inspected Maintained] Number of switches [Asset Quantity (0's) - At Year End] Number of switches [Asset Quantity (0's) - Inspected Maintained] Earth mat [Asset Quantity (0's) - At Year End] Earth mat [Asset Quantity (0's) - Inspected Maintained] Zone substation equipment maintenance [Asset Quantity (0's) - At Year End] Zone substation equipment maintenance [Asset Quantity (0's) - Inspected Maintained] Transformers - distribution [Asset Quantity (0's) - At Year End] Transformers - distribution [Asset Quantity (0's) - Inspected Maintained] Transformers - HV [Asset Quantity (0's) - At Year End] Transformers - HV [Asset Quantity (0's) - Inspected Maintained] Zone substation - other equipment [Asset Quantity (0's) - At Year End] Zone substation - other equipment [Asset Quantity (0's) - Inspected Maintained] SCADA & network control maintenance [Asset Quantity (0's) - At Year End] SCADA & network control maintenance [Asset Quantity (0's) - Inspected Maintained] Protection systems maintenance [Asset Quantity (0's) - At Year End] Protection systems maintenance [Asset Quantity (0's) - Inspected Maintained]
Actual ASSET QUANTITY - AT YEAR END - Underground cable lengths, distribution transformers, distribution switchgear (ACRs only), zone substation switchgear, zone substation transformers - BI RIN: Asset installations report (total asset quantities) - Distribution switchgear (excluding ACRs) - RIN TABLE 5.2 (data taken from the process spreadsheets after the pro-rata age profile process stage and not the final RIN table - refer BOPs for Table 5.2) - Underground cable length by location (CBD and non-CBD) proportions - RIN TABLE 2.2.2 - Data was also included from GIS and SAP for equipment categories not covered by the RIN: Asset Installation Report, e.g. SCADA & Protection Systems. ASSET QUANTITY - INSPECTED/ MAINTAINED - A list of projects was obtained from SAP Business Intelligence (BI) reports for financial function codes 316, 317, 318, 319, 350, 442 - Plant Maintenance (PM) Orders were extracted from SAP - Functional location details were extracted from SAP - Equipment details were extracted from SAP
N/A ASSET QUANTITY - AT YEAR END AER annual RIN reporting information was mapped into the AER Category RIN structure requirements. This data was then re-allocated to determine the total assets installed at year end to provide data which is compliant with AER requirements. ASSET QUANTITY - INSPECTED/ MAINTAINED SAP maintenance orders were categorised and mapped into the AER CAT RIN categories. These orders were then counted in each category for each year. Excludes any orders with zero costs (as these represent jobs which were cancelled or postponed).
N/A The data provided complies with the instructions and definitions specified in the CA RIN.
CACP2.8BOP25 2.8 Maintenance Table 2.8.1 - DESCRIPTOR METRICS FOR ROUTINE AND NON-ROUTINE MAINTENANCE Number of distribution substation properties maintained [Asset Quantity (0's) -
Actual ASSET QUANTITY - AT YEAR END - The RIN: Asset Installations Business Intelligence report was executed for the reporting year
N/A ASSET QUANTITY - AT YEAR END AER annual RIN reporting information was mapped it into the new AER Category RIN structure requirements. This data was then re-allocated to
N/A N/A
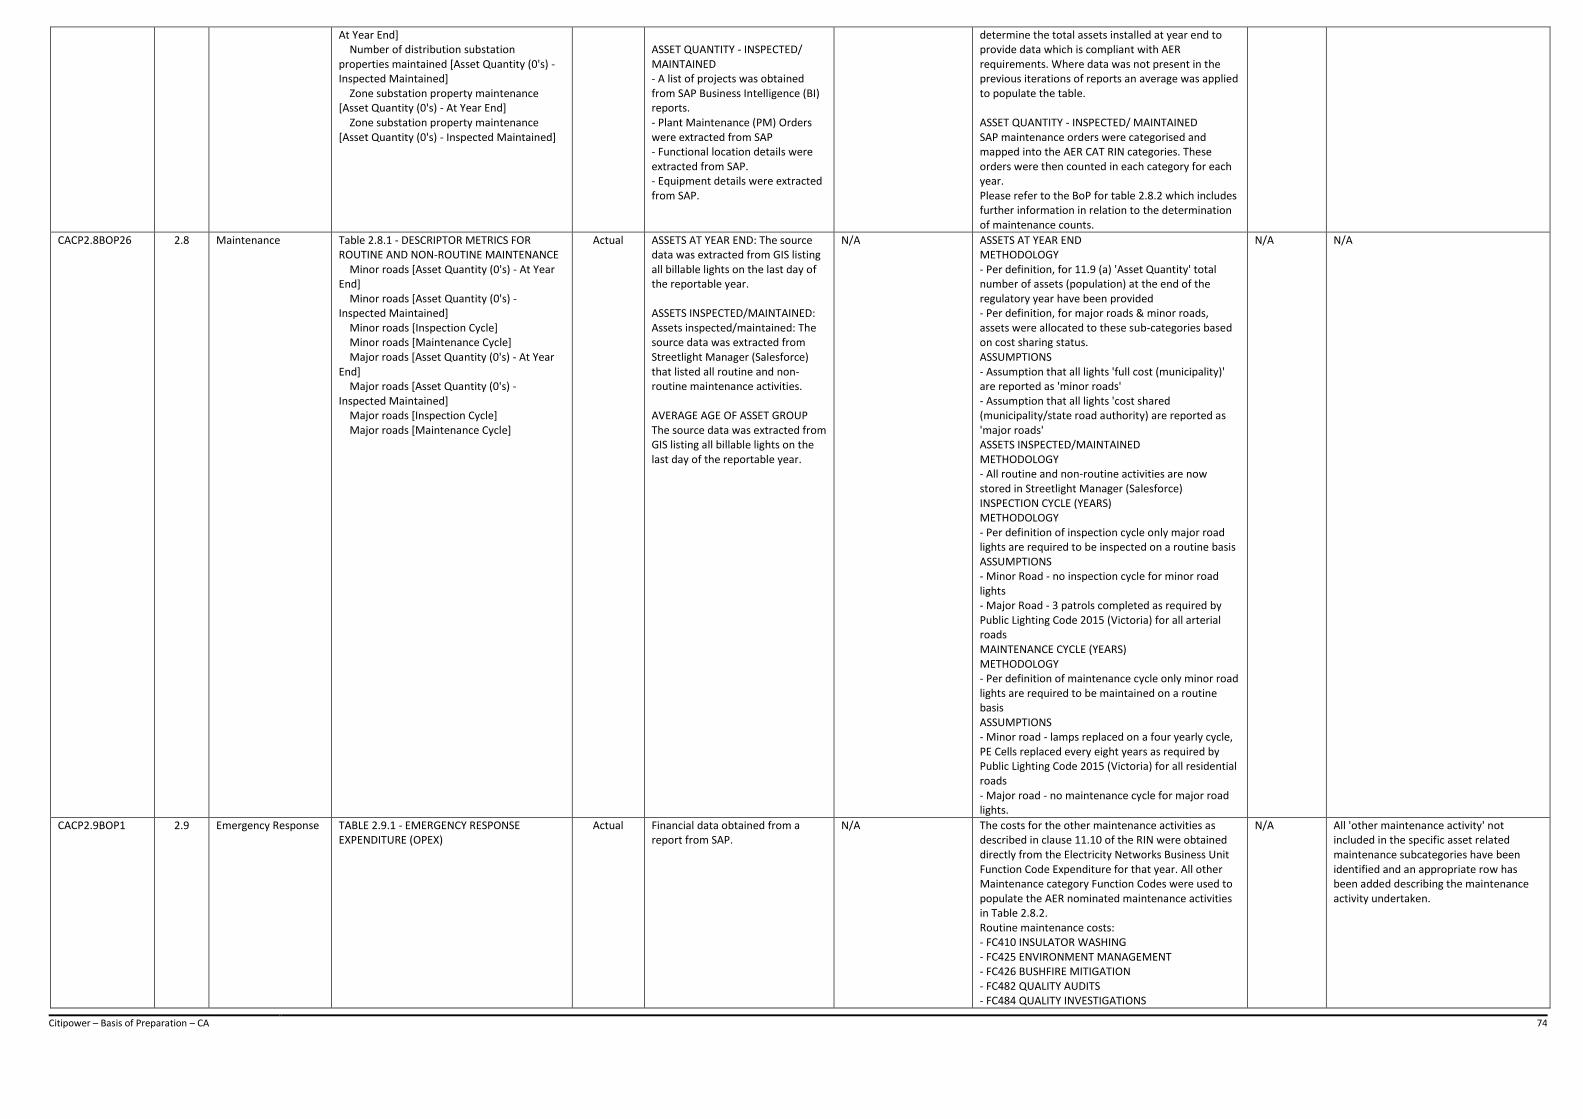
Citipower – Basis of Preparation – CA 74
At Year End] Number of distribution substation properties maintained [Asset Quantity (0's) - Inspected Maintained] Zone substation property maintenance [Asset Quantity (0's) - At Year End] Zone substation property maintenance [Asset Quantity (0's) - Inspected Maintained]
ASSET QUANTITY - INSPECTED/ MAINTAINED - A list of projects was obtained from SAP Business Intelligence (BI) reports. - Plant Maintenance (PM) Orders were extracted from SAP - Functional location details were extracted from SAP. - Equipment details were extracted from SAP.
determine the total assets installed at year end to provide data which is compliant with AER requirements. Where data was not present in the previous iterations of reports an average was applied to populate the table. ASSET QUANTITY - INSPECTED/ MAINTAINED SAP maintenance orders were categorised and mapped into the AER CAT RIN categories. These orders were then counted in each category for each year. Please refer to the BoP for table 2.8.2 which includes further information in relation to the determination of maintenance counts.
CACP2.8BOP26 2.8 Maintenance Table 2.8.1 - DESCRIPTOR METRICS FOR ROUTINE AND NON-ROUTINE MAINTENANCE Minor roads [Asset Quantity (0's) - At Year End] Minor roads [Asset Quantity (0's) - Inspected Maintained] Minor roads [Inspection Cycle] Minor roads [Maintenance Cycle] Major roads [Asset Quantity (0's) - At Year End] Major roads [Asset Quantity (0's) - Inspected Maintained] Major roads [Inspection Cycle] Major roads [Maintenance Cycle]
Actual ASSETS AT YEAR END: The source data was extracted from GIS listing all billable lights on the last day of the reportable year. ASSETS INSPECTED/MAINTAINED: Assets inspected/maintained: The source data was extracted from Streetlight Manager (Salesforce) that listed all routine and non-routine maintenance activities. AVERAGE AGE OF ASSET GROUP The source data was extracted from GIS listing all billable lights on the last day of the reportable year.
N/A ASSETS AT YEAR END METHODOLOGY - Per definition, for 11.9 (a) 'Asset Quantity' total number of assets (population) at the end of the regulatory year have been provided - Per definition, for major roads & minor roads, assets were allocated to these sub-categories based on cost sharing status. ASSUMPTIONS - Assumption that all lights 'full cost (municipality)' are reported as 'minor roads' - Assumption that all lights 'cost shared (municipality/state road authority) are reported as 'major roads' ASSETS INSPECTED/MAINTAINED METHODOLOGY - All routine and non-routine activities are now stored in Streetlight Manager (Salesforce) INSPECTION CYCLE (YEARS) METHODOLOGY - Per definition of inspection cycle only major road lights are required to be inspected on a routine basis ASSUMPTIONS - Minor Road - no inspection cycle for minor road lights - Major Road - 3 patrols completed as required by Public Lighting Code 2015 (Victoria) for all arterial roads MAINTENANCE CYCLE (YEARS) METHODOLOGY - Per definition of maintenance cycle only minor road lights are required to be maintained on a routine basis ASSUMPTIONS - Minor road - lamps replaced on a four yearly cycle, PE Cells replaced every eight years as required by Public Lighting Code 2015 (Victoria) for all residential roads - Major road - no maintenance cycle for major road lights.
N/A N/A
CACP2.9BOP1 2.9 Emergency Response TABLE 2.9.1 - EMERGENCY RESPONSE EXPENDITURE (OPEX)
Actual Financial data obtained from a report from SAP.
N/A The costs for the other maintenance activities as described in clause 11.10 of the RIN were obtained directly from the Electricity Networks Business Unit Function Code Expenditure for that year. All other Maintenance category Function Codes were used to populate the AER nominated maintenance activities in Table 2.8.2. Routine maintenance costs: - FC410 INSULATOR WASHING - FC425 ENVIRONMENT MANAGEMENT - FC426 BUSHFIRE MITIGATION - FC482 QUALITY AUDITS - FC484 QUALITY INVESTIGATIONS
N/A All 'other maintenance activity' not included in the specific asset related maintenance subcategories have been identified and an appropriate row has been added describing the maintenance activity undertaken.

Citipower – Basis of Preparation – CA 75
- FC488 ESV REPORTING Non-routine maintenance costs: - FC309 EMERGENCY FAULTS - OVERHEAD - FC310 EMERGENCY FAULTS - UNDERGROUND - FC311 EMERGENCY FAULTS - METERS - FC312 EMERGENCY FAULTS - PROTECTION AND CONTROL - FC325 ROADS MGT BILL - FC335 VOLTAGE COMPLAINTS - FC336 TVI INVESTIGATIONS - FC381 POLE DEFECT MANAGEMENT - FC440 UG CABLE LOCATIONS - FC485 NETWORK LOGGING MONITORING - FC486 RESEARCH AND DEVELOPMENT - FC800 MISCELLANEOUS MAINTENANCE - FC991 NETWORK ASSET RETIREMENT - A991 ASSET RETIREMENT
CACP2.10(A)BOP1 2.10(A) Overheads A Table 2.10.1 - NETWORK OVERHEADS EXPENDITURE Table 2.10.2 - CORPORATE OVERHEADS EXPENDITURE
Actual The data for the expenditure categories and cost allocations has been sourced from the SAP accounting system. SAP is the primary financial reporting system and is the source of providing the audited statutory accounts.
N/A The SAP financial system is used to extract the information required by category and regulatory segment. The business uses cost elements within SAP in order to allocate costs between the regulatory segments in accordance with the cost allocation methodology. Information presented in this table utilises the cost allocation methodology applicable for the particular year.
N/A N/A
CACP2.11BOP1 2.11 Labour TABLE 2.11.1 - COST METRICS PER ANNUM TABLE 2.11.2 - EXTRA DESCRIPTOR METRICS FOR CURRENT YEAR
Actual ASLs - Data for the ASLs has been sourced from the payroll system as at December 2017. Labour Expenditure - Data for labour expenditure has been sourced from the SAP accounting system. Ordinary Hours - Payroll
N/A ASLs - ASLs have been sourced directly from the payroll system as at December 2017. Each position from the payroll system has been mapped to a labour type and category as per the template. SCS labour expenditure as a % of total labour expenditure for the Distribution Business has been used to allocate the Distribution Business FTEs to SCS, arriving to 2017 ASLs. Labour Expenditure - SAP cost elements have been used to identify total labour expenditure for SCS by Network and Corporate Overhead categories. Average remunerations were derived per labour type from the payroll system in order to create a weighting to allocate total SCS labour expenditure between the various labour types. Ordinary Hours - as per Payroll Hourly Rate - Formula: Labour Expenditure / ASL / Ordinary Hours
N/A N/A
CACP2.12BOP1 2.12 Input Tables Table 2.12 INPUT TABLES ZONE 1 [Direct Material Expenditure] ZONE 1 [Direct Labour Expenditure] ZONE 1 [Contract Expenditure] ZONE 1 [Other Expenditure] ROUTINE MAINTENANCE [Direct Material Expenditure] ROUTINE MAINTENANCE [Direct Labour Expenditure] ROUTINE MAINTENANCE [Contract Expenditure] ROUTINE MAINTENANCE [Other Expenditure] Pole inspection and treatment [Direct Material Expenditure] Pole inspection and treatment [Direct Labour Expenditure] Pole inspection and treatment [Contract Expenditure] Pole inspection and treatment [Other Expenditure] Overhead asset inspection [Direct Material Expenditure] Overhead asset inspection [Direct Labour
Estimated The data for the labour, material, contract, other expenditure has been sourced from the SAP accounting system. SAP is the primary financial reporting system and is the source of providing the audited statutory accounts for CitiPower.
Estimates have been made for the following data; - Labour / Materials / Contracts / Other Split - A mapping is applied to assign cost elements as either labour, material, contract or other costs. This mapping is a management estimate assigning activity allocation GL accounts against these categories. Where a GL account materially fits one of these categories, that account has been mapped in its entirety to either labour, materials or contracts.
The SAP financial system is used to extract the information required to state the DNSP costs by category and regulatory segment. Using the audited statutory accounts for CitiPower, the business uses cost elements within SAP in order to allocate costs between the regulatory segments in accordance with the cost allocation methodology. In order to establish the proportion of costs that relate to labour, materials, contracts and others as per the definition of labour in the RIN, a mapping is applied to assign GL accounts as either labour, materials contracts or other costs. This mapping is a management judgement to best align GL account definitions with RIN definitions of labour, material, contracts and others. Most GL accounts have been mapped in their entirety to either labour, materials or contracts. For the remaining GL accounts, management judgement has been used to estimate an allocation between labour, materials, contracts and other. Note: The basis of preparation for the assignment of costs
Relates to columns, Direct Material Expenditure Direct Labour Expenditure Contract Expenditure Other Expenditure
In accordance with the requirements of the RIN notice: Labour and Contract costs have been reported consistent with the definitions contained in the RIN notice. As a definition has not been listed for materials an interpretation has been made internally to allocate costs appropriately.
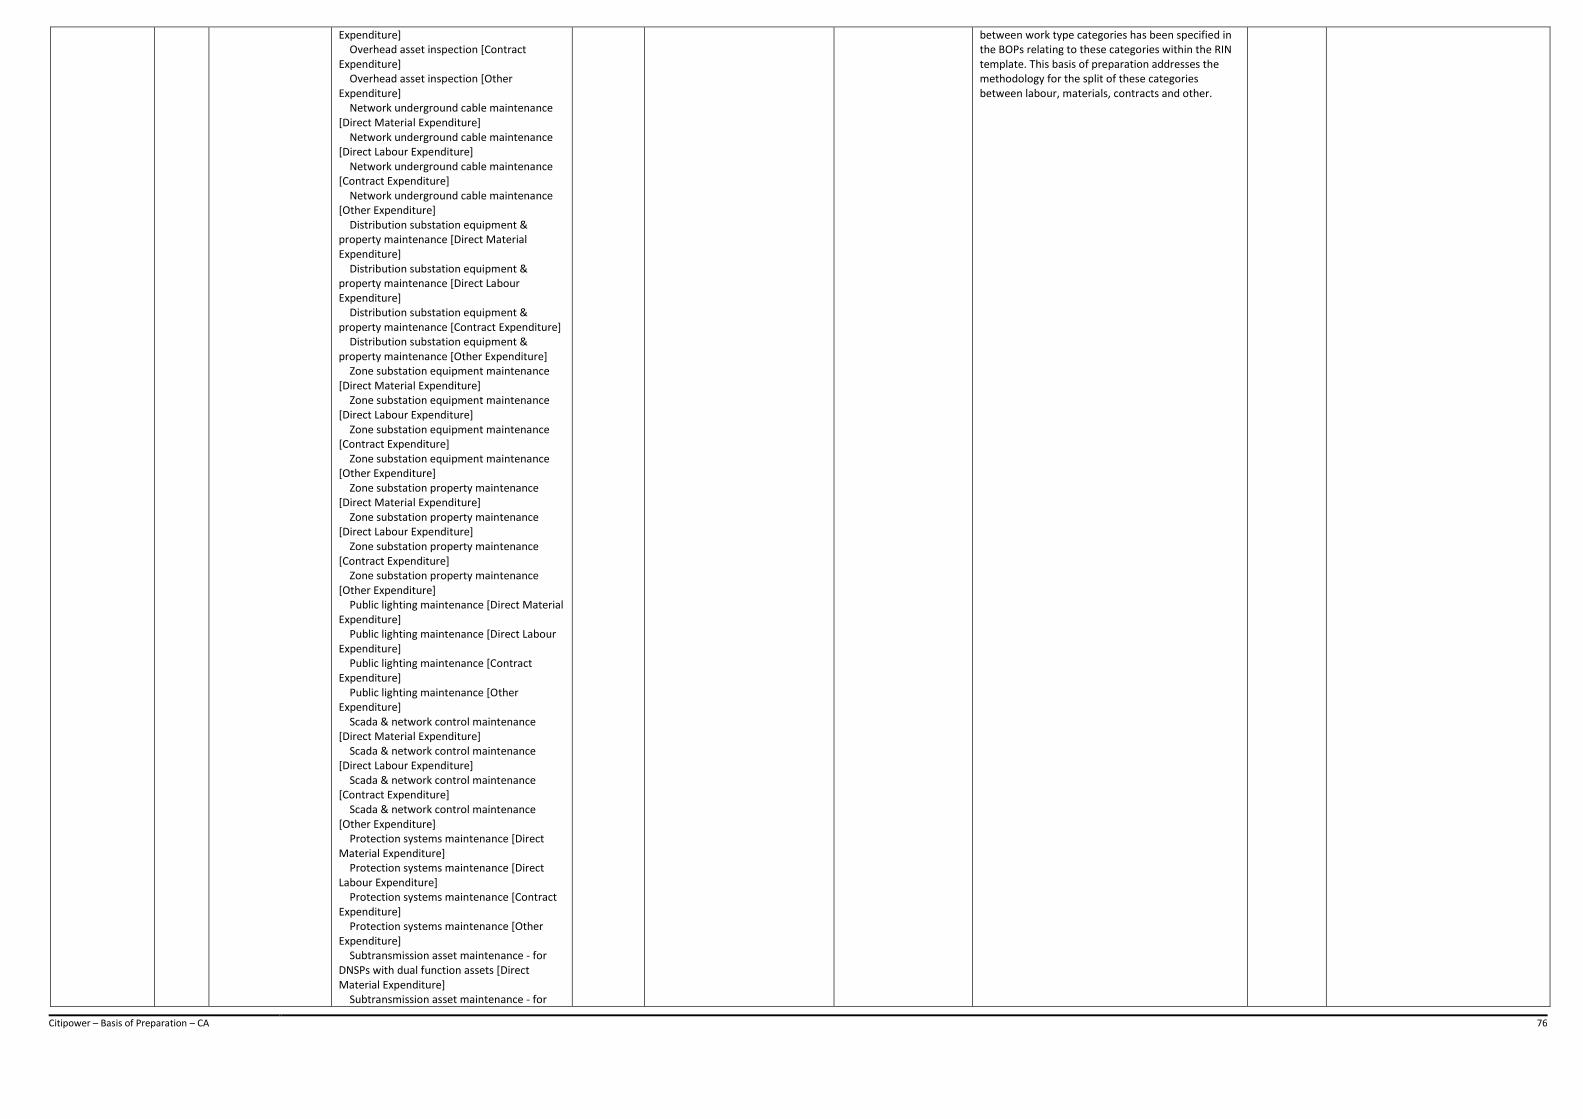
Citipower – Basis of Preparation – CA 76
Expenditure] Overhead asset inspection [Contract Expenditure] Overhead asset inspection [Other Expenditure] Network underground cable maintenance [Direct Material Expenditure] Network underground cable maintenance [Direct Labour Expenditure] Network underground cable maintenance [Contract Expenditure] Network underground cable maintenance [Other Expenditure] Distribution substation equipment & property maintenance [Direct Material Expenditure] Distribution substation equipment & property maintenance [Direct Labour Expenditure] Distribution substation equipment & property maintenance [Contract Expenditure] Distribution substation equipment & property maintenance [Other Expenditure] Zone substation equipment maintenance [Direct Material Expenditure] Zone substation equipment maintenance [Direct Labour Expenditure] Zone substation equipment maintenance [Contract Expenditure] Zone substation equipment maintenance [Other Expenditure] Zone substation property maintenance [Direct Material Expenditure] Zone substation property maintenance [Direct Labour Expenditure] Zone substation property maintenance [Contract Expenditure] Zone substation property maintenance [Other Expenditure] Public lighting maintenance [Direct Material Expenditure] Public lighting maintenance [Direct Labour Expenditure] Public lighting maintenance [Contract Expenditure] Public lighting maintenance [Other Expenditure] Scada & network control maintenance [Direct Material Expenditure] Scada & network control maintenance [Direct Labour Expenditure] Scada & network control maintenance [Contract Expenditure] Scada & network control maintenance [Other Expenditure] Protection systems maintenance [Direct Material Expenditure] Protection systems maintenance [Direct Labour Expenditure] Protection systems maintenance [Contract Expenditure] Protection systems maintenance [Other Expenditure] Subtransmission asset maintenance - for DNSPs with dual function assets [Direct Material Expenditure] Subtransmission asset maintenance - for
between work type categories has been specified in the BOPs relating to these categories within the RIN template. This basis of preparation addresses the methodology for the split of these categories between labour, materials, contracts and other.
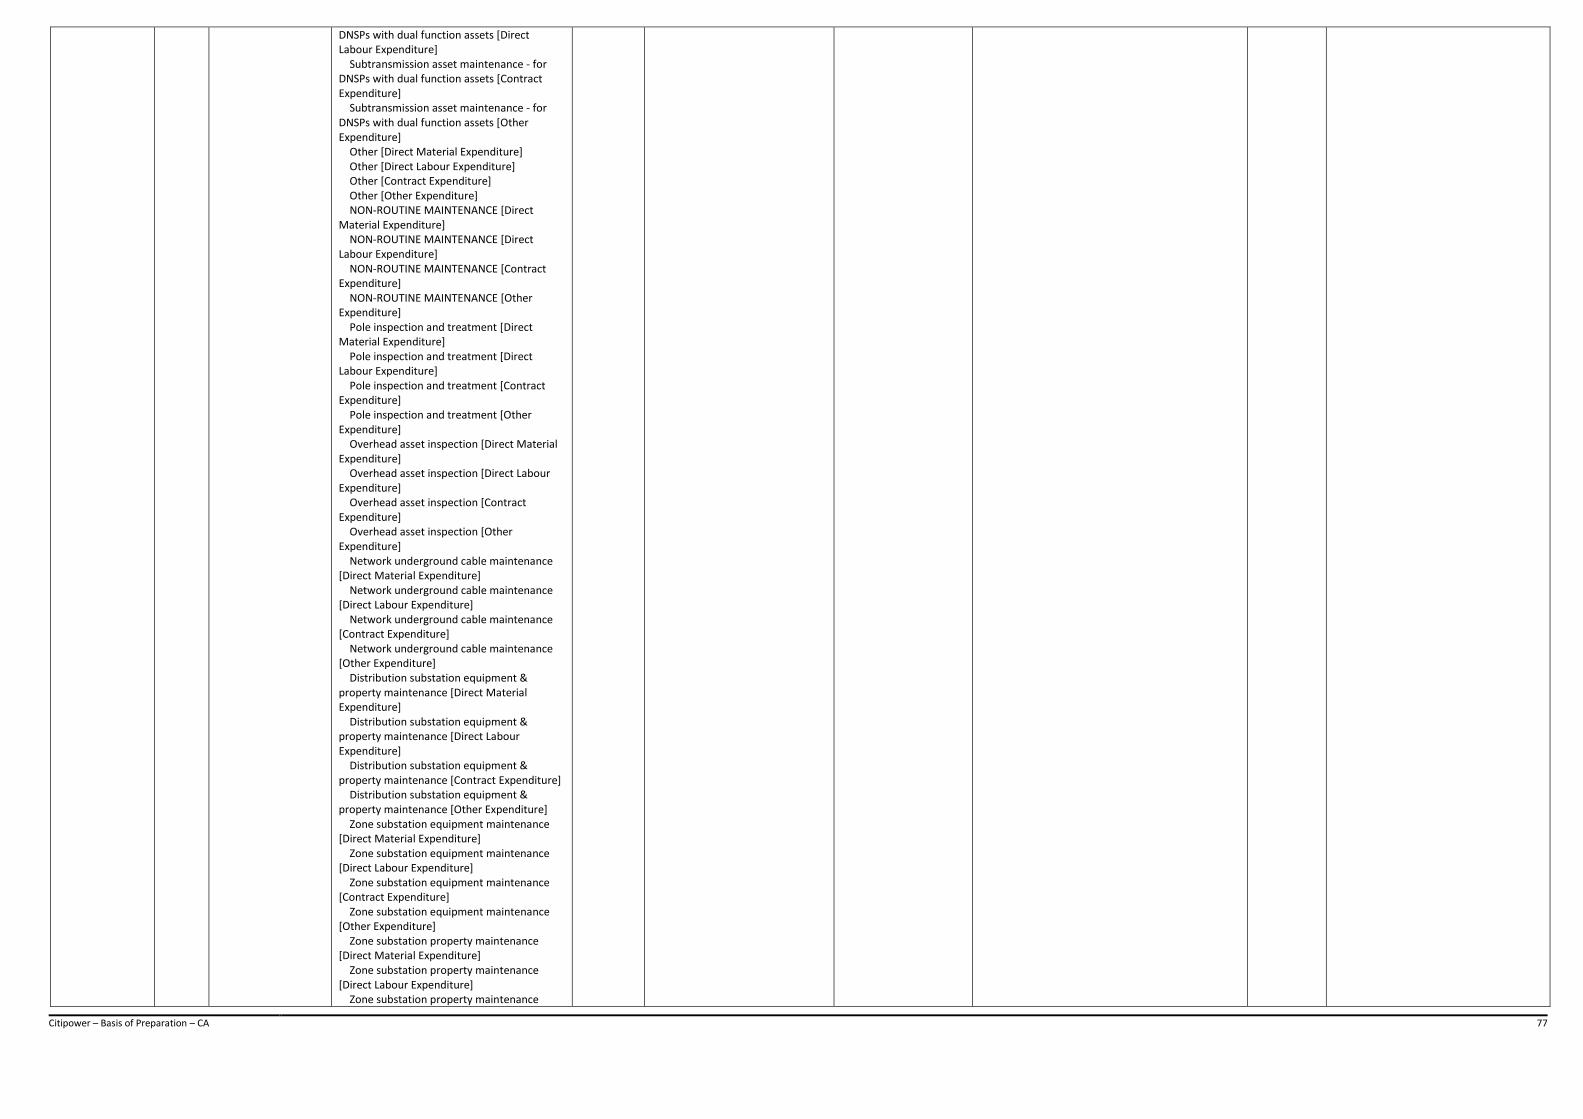
Citipower – Basis of Preparation – CA 77
DNSPs with dual function assets [Direct Labour Expenditure] Subtransmission asset maintenance - for DNSPs with dual function assets [Contract Expenditure] Subtransmission asset maintenance - for DNSPs with dual function assets [Other Expenditure] Other [Direct Material Expenditure] Other [Direct Labour Expenditure] Other [Contract Expenditure] Other [Other Expenditure] NON-ROUTINE MAINTENANCE [Direct Material Expenditure] NON-ROUTINE MAINTENANCE [Direct Labour Expenditure] NON-ROUTINE MAINTENANCE [Contract Expenditure] NON-ROUTINE MAINTENANCE [Other Expenditure] Pole inspection and treatment [Direct Material Expenditure] Pole inspection and treatment [Direct Labour Expenditure] Pole inspection and treatment [Contract Expenditure] Pole inspection and treatment [Other Expenditure] Overhead asset inspection [Direct Material Expenditure] Overhead asset inspection [Direct Labour Expenditure] Overhead asset inspection [Contract Expenditure] Overhead asset inspection [Other Expenditure] Network underground cable maintenance [Direct Material Expenditure] Network underground cable maintenance [Direct Labour Expenditure] Network underground cable maintenance [Contract Expenditure] Network underground cable maintenance [Other Expenditure] Distribution substation equipment & property maintenance [Direct Material Expenditure] Distribution substation equipment & property maintenance [Direct Labour Expenditure] Distribution substation equipment & property maintenance [Contract Expenditure] Distribution substation equipment & property maintenance [Other Expenditure] Zone substation equipment maintenance [Direct Material Expenditure] Zone substation equipment maintenance [Direct Labour Expenditure] Zone substation equipment maintenance [Contract Expenditure] Zone substation equipment maintenance [Other Expenditure] Zone substation property maintenance [Direct Material Expenditure] Zone substation property maintenance [Direct Labour Expenditure] Zone substation property maintenance
Citipower – Basis of Preparation – CA 78
[Contract Expenditure] Zone substation property maintenance [Other Expenditure] Public lighting maintenance [Direct Material Expenditure] Public lighting maintenance [Direct Labour Expenditure] Public lighting maintenance [Contract Expenditure] Public lighting maintenance [Other Expenditure] SCADA & network control maintenance [Direct Material Expenditure] SCADA & network control maintenance [Direct Labour Expenditure] SCADA & network control maintenance [Contract Expenditure] SCADA & network control maintenance [Other Expenditure] Protection systems maintenance [Direct Material Expenditure] Protection systems maintenance [Direct Labour Expenditure] Protection systems maintenance [Contract Expenditure] Protection systems maintenance [Other Expenditure] Subtransmission asset maintenance - for DNSP with dual function assets [Direct Material Expenditure] Subtransmission asset maintenance - for DNSP with dual function assets [Direct Labour Expenditure] Subtransmission asset maintenance - for DNSP with dual function assets [Contract Expenditure] Subtransmission asset maintenance - for DNSP with dual function assets [Other Expenditure] Other [Direct Material Expenditure] Other [Direct Labour Expenditure] Other [Contract Expenditure] Other [Other Expenditure] OVERHEADS [Direct Material Expenditure] OVERHEADS [Direct Labour Expenditure] OVERHEADS [Contract Expenditure] OVERHEADS [Other Expenditure] Corporate overheads [Direct Material Expenditure] Corporate overheads [Direct Labour Expenditure] Corporate overheads [Contract Expenditure] Corporate overheads [Other Expenditure] AUGMENTATION [Direct Material Expenditure] AUGMENTATION [Direct Labour Expenditure] AUGMENTATION [Contract Expenditure] AUGMENTATION [Other Expenditure] Subtransmission lines [Direct Material Expenditure] Subtransmission lines [Direct Labour Expenditure] Subtransmission lines [Contract Expenditure] Subtransmission lines [Other Expenditure]
Citipower – Basis of Preparation – CA 79
HV feeders [Direct Material Expenditure] HV feeders [Direct Labour Expenditure] HV feeders [Contract Expenditure] HV feeders [Other Expenditure] Distribution substations [Direct Material Expenditure] Distribution substations [Direct Labour Expenditure] Distribution substations [Contract Expenditure] Distribution substations [Other Expenditure] LV feeders [Direct Material Expenditure] LV feeders [Direct Labour Expenditure] LV feeders [Contract Expenditure] LV feeders [Other Expenditure] Other assets [Direct Material Expenditure] Other assets [Direct Labour Expenditure] Other assets [Contract Expenditure] Other assets [Other Expenditure] CONNECTIONS [Direct Material Expenditure] CONNECTIONS [Direct Labour Expenditure] CONNECTIONS [Contract Expenditure] CONNECTIONS [Other Expenditure] EMERGENCY RESPONSE [Direct Material Expenditure] EMERGENCY RESPONSE [Direct Labour Expenditure] EMERGENCY RESPONSE [Contract Expenditure] EMERGENCY RESPONSE [Other Expenditure] Major event days [Direct Material Expenditure] Major event days [Direct Labour Expenditure] Major event days [Contract Expenditure] Major event days [Other Expenditure] PUBLIC LIGHTING [Direct Material Expenditure] PUBLIC LIGHTING [Direct Labour Expenditure] PUBLIC LIGHTING [Contract Expenditure] PUBLIC LIGHTING [Other Expenditure] METERING [Direct Material Expenditure] METERING [Direct Labour Expenditure] METERING [Contract Expenditure] METERING [Other Expenditure] FEE-BASED SERVICES [Direct Material Expenditure] FEE-BASED SERVICES [Direct Labour Expenditure] FEE-BASED SERVICES [Contract Expenditure] FEE-BASED SERVICES [Other Expenditure] QUOTED SERVICES [Direct Material Expenditure] QUOTED SERVICES [Direct Labour Expenditure] QUOTED SERVICES [Contract Expenditure] QUOTED SERVICES [Other Expenditure] REPLACEMENT [Direct Material Expenditure] REPLACEMENT [Direct Labour Expenditure] REPLACEMENT [Contract Expenditure] REPLACEMENT [Other Expenditure] Pole top structures [Direct Material

Citipower – Basis of Preparation – CA 80
Expenditure] Pole top structures [Direct Labour Expenditure] Pole top structures [Contract Expenditure] Pole top structures [Other Expenditure] Overhead conductors [Direct Material Expenditure] Overhead conductors [Direct Labour Expenditure] Overhead conductors [Contract Expenditure] Overhead conductors [Other Expenditure] Underground cables [Direct Material Expenditure] Underground cables [Direct Labour Expenditure] Underground cables [Contract Expenditure] Underground cables [Other Expenditure] Service lines [Direct Material Expenditure] Service lines [Direct Labour Expenditure] Service lines [Contract Expenditure] Service lines [Other Expenditure] Transformers [Direct Material Expenditure] Transformers [Direct Labour Expenditure] Transformers [Contract Expenditure] Transformers [Other Expenditure] Switchgear [Direct Material Expenditure] Switchgear [Direct Labour Expenditure] Switchgear [Contract Expenditure] Switchgear [Other Expenditure] Public lighting [Direct Material Expenditure] Public lighting [Direct Labour Expenditure] Public lighting [Contract Expenditure] Public lighting [Other Expenditure] SCADA network control and protection systems [Direct Material Expenditure] SCADA network control and protection systems [Direct Labour Expenditure] SCADA network control and protection systems [Contract Expenditure] SCADA network control and protection systems [Other Expenditure] Other [Direct Material Expenditure] Other [Direct Labour Expenditure] Other [Contract Expenditure] Other [Other Expenditure] NON-NETWORK EXPENDITURE [Direct Material Expenditure] NON-NETWORK EXPENDITURE [Direct Labour Expenditure] NON-NETWORK EXPENDITURE [Contract Expenditure] NON-NETWORK EXPENDITURE [Other Expenditure] Motor vehicles [Direct Material Expenditure] Motor vehicles [Direct Labour Expenditure] Motor vehicles [Contract Expenditure] Motor vehicles [Other Expenditure] Buildings and property [Direct Material Expenditure] Buildings and property [Direct Labour Expenditure] Buildings and property [Contract Expenditure] Buildings and property [Other Expenditure] Other [Direct Material Expenditure]
Citipower – Basis of Preparation – CA 81
Other [Direct Labour Expenditure] Other [Contract Expenditure] Other [Other Expenditure]
CACP2.12BOP2 2.12 Input Tables Table 2.12 INPUT TABLES ZONE 1 [Related Party Contract Expenditure] ZONE 1 [Related Party Contract Margin] ROUTINE MAINTENANCE [Related Party Contract Expenditure] ROUTINE MAINTENANCE [Related Party Contract Margin] Pole inspection and treatment [Related Party Contract Expenditure] Pole inspection and treatment [Related Party Contract Margin] Overhead asset inspection [Related Party Contract Expenditure] Overhead asset inspection [Related Party Contract Margin] Network underground cable maintenance [Related Party Contract Expenditure] Network underground cable maintenance [Related Party Contract Margin] Distribution substation equipment & property maintenance [Related Party Contract Expenditure] Distribution substation equipment & property maintenance [Related Party Contract Margin] Zone substation equipment maintenance [Related Party Contract Expenditure] Zone substation equipment maintenance [Related Party Contract Margin] Zone substation property maintenance [Related Party Contract Expenditure] Zone substation property maintenance [Related Party Contract Margin] Public lighting maintenance [Related Party Contract Expenditure] Public lighting maintenance [Related Party Contract Margin] Scada & network control maintenance [Related Party Contract Expenditure] Scada & network control maintenance [Related Party Contract Margin] Protection systems maintenance [Related Party Contract Expenditure] Protection systems maintenance [Related Party Contract Margin] Subtransmission asset maintenance - for DNSPs with dual function assets [Related Party Contract Expenditure] Subtransmission asset maintenance - for DNSPs with dual function assets [Related Party Contract Margin] Other [Related Party Contract Expenditure] Other [Related Party Contract Margin] NON-ROUTINE MAINTENANCE [Related Party Contract Expenditure] NON-ROUTINE MAINTENANCE [Related Party Contract Margin] Pole inspection and treatment [Related Party Contract Expenditure] Pole inspection and treatment [Related Party Contract Margin] Overhead asset inspection [Related Party
Estimated The data for the related party costs and margins has been sourced from related party SAP accounting systems. SAP is the primary financial reporting system and is the source of providing the audited statutory accounts for related parties. In addition to this, as part of the Annual RIN process related parties are required to provide the actual cost of providing services. This under or over recovery by related party is allocated on pro rata basis across the specific activity.
CitiPower is required to make estimates for the following reasons; - CitiPower does not readily have access to complete and comprehensive information supporting the related party contracts at the more granular level of the Category Analysis RIN. - As the actual cost from the related party is not identifiable at an activity level there is a level of estimation in applying the pro rata.
The methodology used to state the related party information is as follows; Related Party Margins - Detailed related party data was extracted from the related party SAP accounting systems. This data does not align to the categories in the input tables and is allocated in accordance with the allocation of all other costs and described in their basis of preparations. Related Party Contract Cost - Utilising the total costs of each related party contract as reported in the Annual RIN's, which has been extracted from cost elements within SAP, total related party contract costs have been apportioned utilising a combination of margin and direct cost to represent the related party cost applicable to the categories in the RIN. Whilst estimating the related party contract costs by category the total related party contract reported in the RIN reflect that of previously reported Annual RIN's. Utilising the assumption that particular maintenance functions are known to be primarily either performed by a related party or externally provided, further alignment was made between opex direct and opex overheads to ensure related party cost best reflect management’s best estimate.
Relates to columns, Related Party Contract Expenditure Related Party Contract Margin Expenditure
In accordance with the requirements of the RIN notice: Related Party Contract costs and margins have been reported consistent with the definitions contained in the RIN.
Citipower – Basis of Preparation – CA 82
Contract Expenditure] Overhead asset inspection [Related Party Contract Margin] Network underground cable maintenance [Related Party Contract Expenditure] Network underground cable maintenance [Related Party Contract Margin] Distribution substation equipment & property maintenance [Related Party Contract Expenditure] Distribution substation equipment & property maintenance [Related Party Contract Margin] Zone substation equipment maintenance [Related Party Contract Expenditure] Zone substation equipment maintenance [Related Party Contract Margin] Zone substation property maintenance [Related Party Contract Expenditure] Zone substation property maintenance [Related Party Contract Margin] Public lighting maintenance [Related Party Contract Expenditure] Public lighting maintenance [Related Party Contract Margin] SCADA & network control maintenance [Related Party Contract Expenditure] SCADA & network control maintenance [Related Party Contract Margin] Protection systems maintenance [Related Party Contract Expenditure] Protection systems maintenance [Related Party Contract Margin] Subtransmission asset maintenance - for DNSP with dual function assets [Related Party Contract Expenditure] Subtransmission asset maintenance - for DNSP with dual function assets [Related Party Contract Margin] Other [Related Party Contract Expenditure] Other [Related Party Contract Margin] OVERHEADS [Related Party Contract Expenditure] OVERHEADS [Related Party Contract Margin] Corporate overheads [Related Party Contract Expenditure] Corporate overheads [Related Party Contract Margin] AUGMENTATION [Related Party Contract Expenditure] AUGMENTATION [Related Party Contract Margin] Subtransmission lines [Related Party Contract Expenditure] Subtransmission lines [Related Party Contract Margin] HV feeders [Related Party Contract Expenditure] HV feeders [Related Party Contract Margin] Distribution substations [Related Party Contract Expenditure] Distribution substations [Related Party Contract Margin] LV feeders [Related Party Contract Expenditure] LV feeders [Related Party Contract Margin]
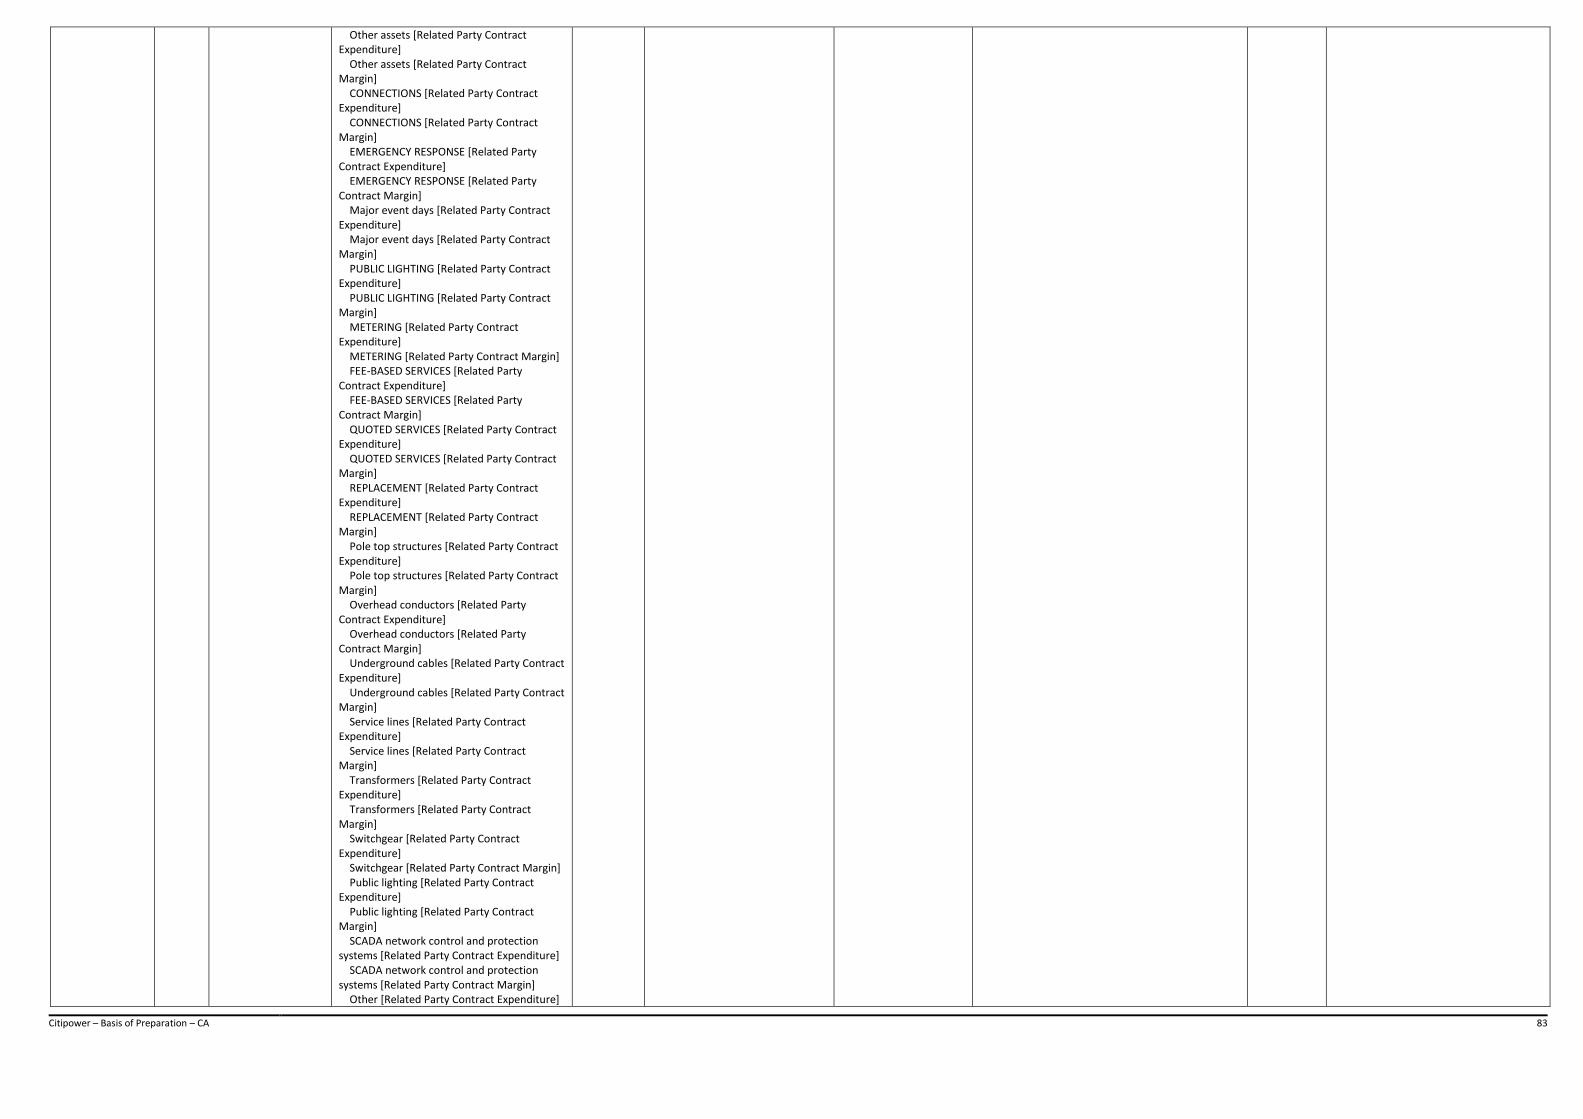
Citipower – Basis of Preparation – CA 83
Other assets [Related Party Contract Expenditure] Other assets [Related Party Contract Margin] CONNECTIONS [Related Party Contract Expenditure] CONNECTIONS [Related Party Contract Margin] EMERGENCY RESPONSE [Related Party Contract Expenditure] EMERGENCY RESPONSE [Related Party Contract Margin] Major event days [Related Party Contract Expenditure] Major event days [Related Party Contract Margin] PUBLIC LIGHTING [Related Party Contract Expenditure] PUBLIC LIGHTING [Related Party Contract Margin] METERING [Related Party Contract Expenditure] METERING [Related Party Contract Margin] FEE-BASED SERVICES [Related Party Contract Expenditure] FEE-BASED SERVICES [Related Party Contract Margin] QUOTED SERVICES [Related Party Contract Expenditure] QUOTED SERVICES [Related Party Contract Margin] REPLACEMENT [Related Party Contract Expenditure] REPLACEMENT [Related Party Contract Margin] Pole top structures [Related Party Contract Expenditure] Pole top structures [Related Party Contract Margin] Overhead conductors [Related Party Contract Expenditure] Overhead conductors [Related Party Contract Margin] Underground cables [Related Party Contract Expenditure] Underground cables [Related Party Contract Margin] Service lines [Related Party Contract Expenditure] Service lines [Related Party Contract Margin] Transformers [Related Party Contract Expenditure] Transformers [Related Party Contract Margin] Switchgear [Related Party Contract Expenditure] Switchgear [Related Party Contract Margin] Public lighting [Related Party Contract Expenditure] Public lighting [Related Party Contract Margin] SCADA network control and protection systems [Related Party Contract Expenditure] SCADA network control and protection systems [Related Party Contract Margin] Other [Related Party Contract Expenditure]

Citipower – Basis of Preparation – CA 84
Other [Related Party Contract Margin] NON-NETWORK EXPENDITURE [Related Party Contract Expenditure] NON-NETWORK EXPENDITURE [Related Party Contract Margin] Motor vehicles [Related Party Contract Expenditure] Motor vehicles [Related Party Contract Margin] Buildings and property [Related Party Contract Expenditure] Buildings and property [Related Party Contract Margin] Other [Related Party Contract Expenditure] Other [Related Party Contract Margin]
CACP4.1BOP1 4.1 Public Lighting TABLE 4.1.1 - DESCRIPTOR METRICS OVER YEAR
Actual CURRENT POPULATION OF LIGHTS The source data was extracted from GIS system listing all billable lights on the last day of the reportable year.
N/A Methodology - Per definition of 'light type' only in service and billable lights were extracted from GIS. - Asset quantities were allocated across light types based on the definition listed above. Assumptions
Only in service and billable lights were reported, Metal Halide lights were combined where the wattage was the same.
With regard to the Final Distribution Category Analysis RIN 4.1.1 Current Population of Lights by light type. We have provided data that complies with the instructions and definitions specified in the requirements of the notice as follows: 17. PUBLIC LIGHTING ALTERNATIVE CONTROL SERVICES 17.1 not applicable 17.2 not applicable 17.3 not applicable 17.4 not applicable 17.5 we have provided data for non-contestable, regulated public lighting services 17.6 not applicable 17.7 not applicable 17.8 not applicable
CACP4.1BOP2 4.1 Public Lighting TABLE 4.1.2 - DESCRIPTOR METRICS ANNUALLY LIGHT INSTALLATION [Volumes and Expenditure] Minor road light installation (volume) [Volumes and Expenditure] Number of poles installed [Volumes and Expenditure]
Estimated MAJOR ROAD LIGHT INSTALLATION VOLUME (0'S) The source data was extracted from GIS system listing all billable lights on the last day of the reportable year. MINOR ROAD LIGHT INSTALLATION VOLUME (0'S) The source data was extracted from GIS system listing all billable lights on the last day of the reportable year. NUMBER OF POLES INSTALLED (0'S) The source data was extracted from a report completed for the Annual RIN - Asset Age Profile for distribution system assets - Public Lighting Poles. TOTAL COST ($0'S) The source data was extracted from SAP Finance based on function code allocation for each reportable year.
MAJOR ROAD LIGHT INSTALLATION VOLUME (0'S) - Business does not currently record number of new lights installed. - The only usable data available was calculating the net difference between the current reportable year and the preceding year. This is not reflective of actual new public lights, only the change from year to year. MINOR ROAD LIGHT INSTALLATION VOLUME (0'S) - Business does not currently record number of new lights installed. - The only usable data available was calculating the net difference between the current reportable year and the preceding year. This is not reflective of actual new public lights, only the change from year to year. NUMBER OF POLES
MAJOR ROAD LIGHT INSTALLATION VOLUME (0'S) METHODOLOGY - Per definition, light installation on a major or minor road for the purpose of establishing new: Luminaires, including associated components such as bracket and lamp - Per definition, major road lights is based on 'Cost Sharing' not equal to '1' ASSUMPTIONS - Assumption made that total light installed for reported year was the net difference between the reportable year and the preceding year. - Major road data available in 2008 was not consistent with following years, however the total population was consistent. By calculating the variation between 2008 and 2009 for total lights, this percentage was then used to calculate the change in Major/Minor Lights MINOR ROAD LIGHT INSTALLATION VOLUME (0'S) METHODOLOGY - Per definition, light installation on a major or minor road for the purpose of establishing new: Luminaires, including associated components such as bracket and lamp. - Per definition, minor road lights is based on 'Cost Sharing' equal to '1' ASSUMPTIONS - Assumption made that total light installed for reported year was the net difference between the reportable year and the preceding year. - Minor road data available in 2008 was not consistent with following years, however the total population was consistent. By calculating the
N/A With regard to the Final Distribution Category Analysis RIN, 4.1.1 Current Population of Lights by light type. We have provided data that complies with the instructions and definitions specified in the requirements of the notice as follows: 17. PUBLIC LIGHTING ALTERNATIVE CONTROL SERVICES 17.1 the data provided for public lighting services reconcile to internal planning models 17.2 not applicable 17.3 not applicable 17.4 we have reported total expenditure data as a gross amount 17.5 we have provided data for non-contestable, regulated public lighting services 17.6 not applicable 17.7 not applicable 17.8 not applicable
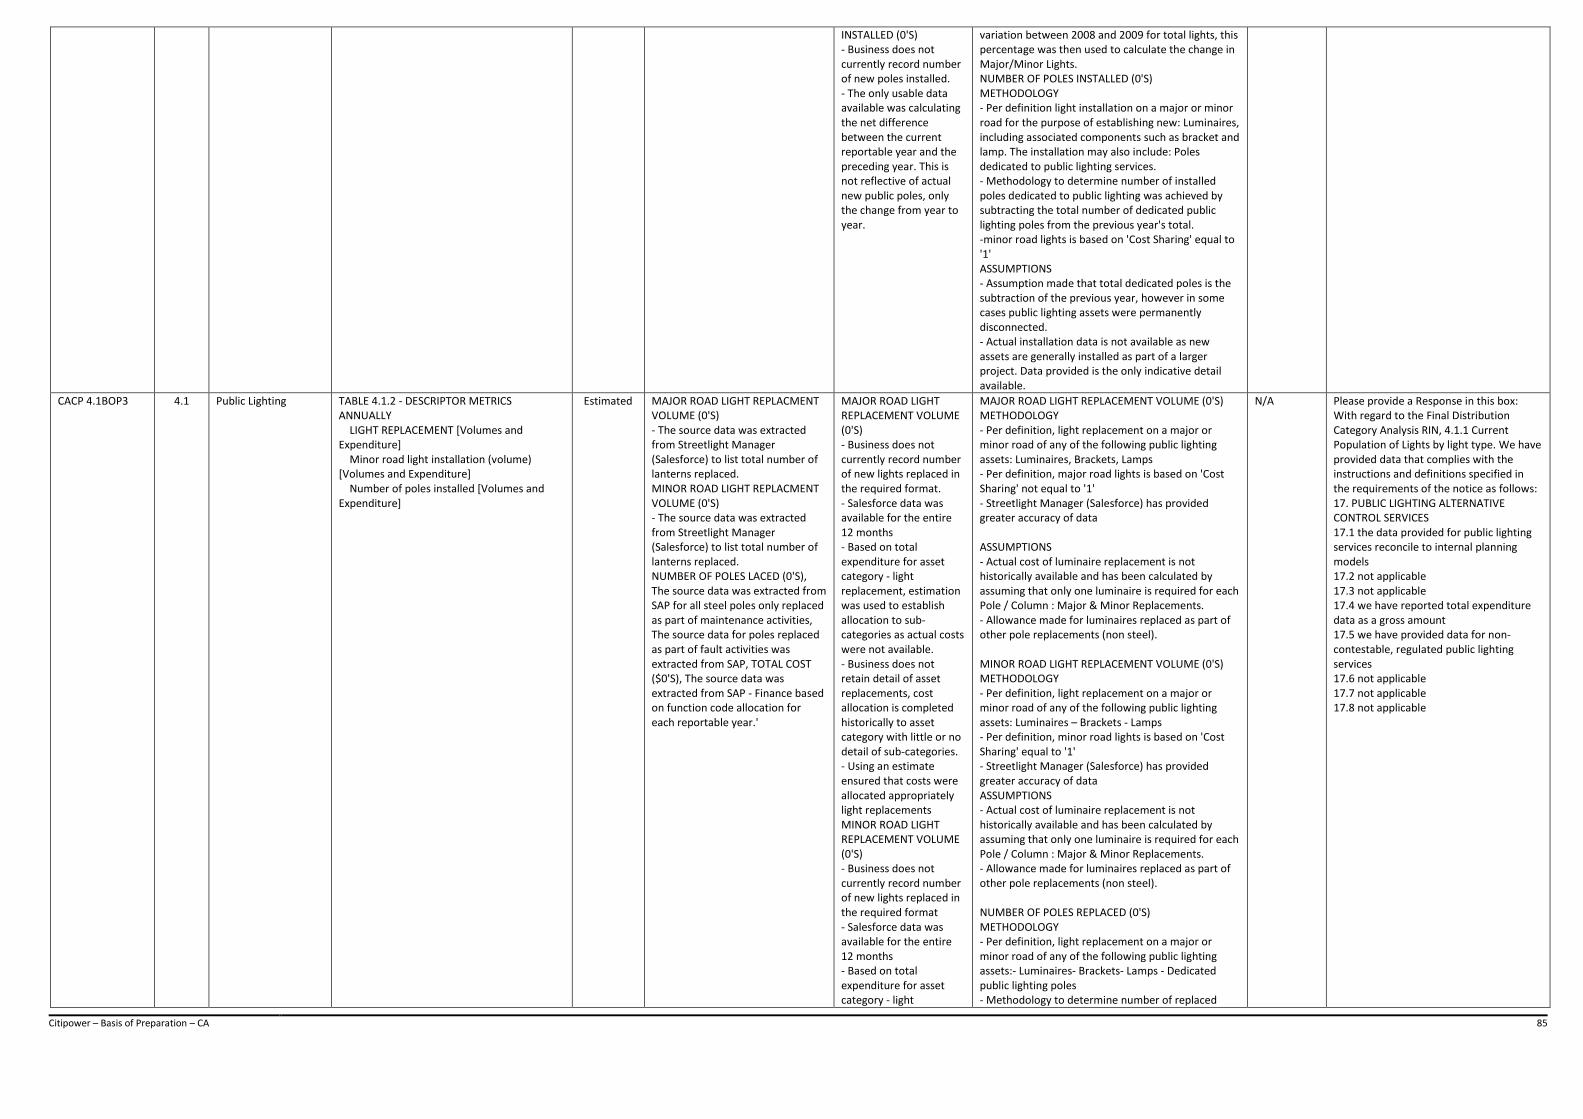
Citipower – Basis of Preparation – CA 85
INSTALLED (0'S) - Business does not currently record number of new poles installed. - The only usable data available was calculating the net difference between the current reportable year and the preceding year. This is not reflective of actual new public poles, only the change from year to year.
variation between 2008 and 2009 for total lights, this percentage was then used to calculate the change in Major/Minor Lights. NUMBER OF POLES INSTALLED (0'S) METHODOLOGY - Per definition light installation on a major or minor road for the purpose of establishing new: Luminaires, including associated components such as bracket and lamp. The installation may also include: Poles dedicated to public lighting services. - Methodology to determine number of installed poles dedicated to public lighting was achieved by subtracting the total number of dedicated public lighting poles from the previous year's total. -minor road lights is based on 'Cost Sharing' equal to '1' ASSUMPTIONS - Assumption made that total dedicated poles is the subtraction of the previous year, however in some cases public lighting assets were permanently disconnected. - Actual installation data is not available as new assets are generally installed as part of a larger project. Data provided is the only indicative detail available.
CACP 4.1BOP3 4.1 Public Lighting TABLE 4.1.2 - DESCRIPTOR METRICS ANNUALLY LIGHT REPLACEMENT [Volumes and Expenditure] Minor road light installation (volume) [Volumes and Expenditure] Number of poles installed [Volumes and Expenditure]
Estimated MAJOR ROAD LIGHT REPLACMENT VOLUME (0'S) - The source data was extracted from Streetlight Manager (Salesforce) to list total number of lanterns replaced. MINOR ROAD LIGHT REPLACMENT VOLUME (0'S) - The source data was extracted from Streetlight Manager (Salesforce) to list total number of lanterns replaced. NUMBER OF POLES LACED (0'S), The source data was extracted from SAP for all steel poles only replaced as part of maintenance activities, The source data for poles replaced as part of fault activities was extracted from SAP, TOTAL COST ($0'S), The source data was extracted from SAP - Finance based on function code allocation for each reportable year.'
MAJOR ROAD LIGHT REPLACEMENT VOLUME (0'S) - Business does not currently record number of new lights replaced in the required format. - Salesforce data was available for the entire 12 months - Based on total expenditure for asset category - light replacement, estimation was used to establish allocation to sub-categories as actual costs were not available. - Business does not retain detail of asset replacements, cost allocation is completed historically to asset category with little or no detail of sub-categories. - Using an estimate ensured that costs were allocated appropriately light replacements MINOR ROAD LIGHT REPLACEMENT VOLUME (0'S) - Business does not currently record number of new lights replaced in the required format - Salesforce data was available for the entire 12 months - Based on total expenditure for asset category - light
MAJOR ROAD LIGHT REPLACEMENT VOLUME (0'S) METHODOLOGY - Per definition, light replacement on a major or minor road of any of the following public lighting assets: Luminaires, Brackets, Lamps - Per definition, major road lights is based on 'Cost Sharing' not equal to '1' - Streetlight Manager (Salesforce) has provided greater accuracy of data ASSUMPTIONS - Actual cost of luminaire replacement is not historically available and has been calculated by assuming that only one luminaire is required for each Pole / Column : Major & Minor Replacements. - Allowance made for luminaires replaced as part of other pole replacements (non steel). MINOR ROAD LIGHT REPLACEMENT VOLUME (0'S) METHODOLOGY - Per definition, light replacement on a major or minor road of any of the following public lighting assets: Luminaires – Brackets - Lamps - Per definition, minor road lights is based on 'Cost Sharing' equal to '1' - Streetlight Manager (Salesforce) has provided greater accuracy of data ASSUMPTIONS - Actual cost of luminaire replacement is not historically available and has been calculated by assuming that only one luminaire is required for each Pole / Column : Major & Minor Replacements. - Allowance made for luminaires replaced as part of other pole replacements (non steel). NUMBER OF POLES REPLACED (0'S) METHODOLOGY - Per definition, light replacement on a major or minor road of any of the following public lighting assets:- Luminaires- Brackets- Lamps - Dedicated public lighting poles - Methodology to determine number of replaced
N/A Please provide a Response in this box: With regard to the Final Distribution Category Analysis RIN, 4.1.1 Current Population of Lights by light type. We have provided data that complies with the instructions and definitions specified in the requirements of the notice as follows: 17. PUBLIC LIGHTING ALTERNATIVE CONTROL SERVICES 17.1 the data provided for public lighting services reconcile to internal planning models 17.2 not applicable 17.3 not applicable 17.4 we have reported total expenditure data as a gross amount 17.5 we have provided data for non-contestable, regulated public lighting services 17.6 not applicable 17.7 not applicable 17.8 not applicable

Citipower – Basis of Preparation – CA 86
replacement, estimation was used to establish allocation to sub-categories as actual costs were not available. - Business does not retain detail of asset replacements, cost allocation is completed historically to asset category with little or no detail of sub-categories. - Using an estimate ensured that costs were allocated appropriately light replacements NUMBER OF POLES REPLACED (0'S) - Business does not currently record number of new poles replaced in the required format. - Salesforce data was available for the entire 12 months - Based on total expenditure for asset category - light replacement, estimation was used to establish allocation to sub-categories as actual costs were not available. - Business does not retain detail of asset replacements, cost allocation is completed historically to asset category with little or no detail of sub-categories. TOTAL COST ($0'S) Data was not estimated
poles dedicated to public lighting was achieved by total asset replacements and asset failure volumes. - Streetlight Manager (Salesforce) has provided greater accuracy of data ASSUMPTIONS - Assumption that only steel poles are dedicated to Public Lighting with regard to replacements. (Other poles dedicated to public lighting were unable to be identified.)
CACP 4.1BOP4 4.1 Public Lighting TABLE 4.1.2 - DESCRIPTOR METRICS ANNUALLY LIGHT MAINTENANCE [Volumes and Expenditure] Minor road light installation (volume) [Volumes and Expenditure] Number of poles installed [Volumes and Expenditure]
Estimated MAJOR ROAD LIGHT MAINENANCE VOLUME (0'S), The source data was extracted from Streetlight Manager (Salesforce) to list total number of maintenance activities completed. MINOR ROAD LIGHT MAINTENANCE VOLUME (0'S) The source data was extracted from Streetlight Manager (Salesforce) to list total number of maintenance activities completed. NUMBER OF POLES MAINTENANCE (0'S) Poles are replaced as part of replacement only TOTAL COST ($0'S) The source data was extracted from SAP Finance based on function code allocation for each reportable year.
MAJOR ROAD LIGHT REPLACEMENT VOLUME (0'S) - Business does not currently record number of new lights replaced in the required format. - Salesforce data was available for the entire 12 months - Based on total expenditure for asset category - light replacement, estimation was used to establish allocation to sub-categories as actual costs were not available. - Business does not retain detail of asset replacements, cost allocation is completed historically to asset category with little or no detail of sub-categories.
MAJOR ROAD LIGHT MAINTENANCE VOLUME (0'S) METHODOLOGY - Per definition, light maintenance on a major or minor road of any of the following public lighting assets: Luminaires, Brackets, Lamps, Per definition, major road lights is based on 'Cost Sharing' not equal to '1' ASSUMPTIONS Actual volume of luminaire maintenance has been calculated using data extracted from Streetlight Manager (Salesforce) MINOR ROAD LIGHT MAINTENANCE VOLUME (0'S) METHODOLOGY - Per definition, light maintenance on a major or minor road of any of the following public lighting assets: Luminaires, Brackets, Lamps - Per definition, minor road lights is based on 'Cost Sharing' equal to '1', ASSUMPTIONS, Actual volume of luminaire maintenance has been calculated using data extracted from Streetlight Manager (Salesforce) NUMBER OF POLES MAINTENANCE (0'S) METHODOLOGY - Poles are part of Light Replacement and not included in Light Maintenance
N/A With regard to the Final Distribution Category Analysis RIN, 4.1.1 Current Population of Lights by light type. We have provided data that complies with the instructions and definitions specified in the requirements of the notice as follows: 17. PUBLIC LIGHTING ALTERNATIVE CONTROL SERVICES 17.1 the data provided for public lighting services reconcile to internal planning models 17.2 not applicable 17.3 not applicable 17.4 we have reported total expenditure data as a gross amount 17.5 we have provided data for non-contestable, regulated public lighting services 17.6 not applicable 17.7 not applicable 17.8 not applicable
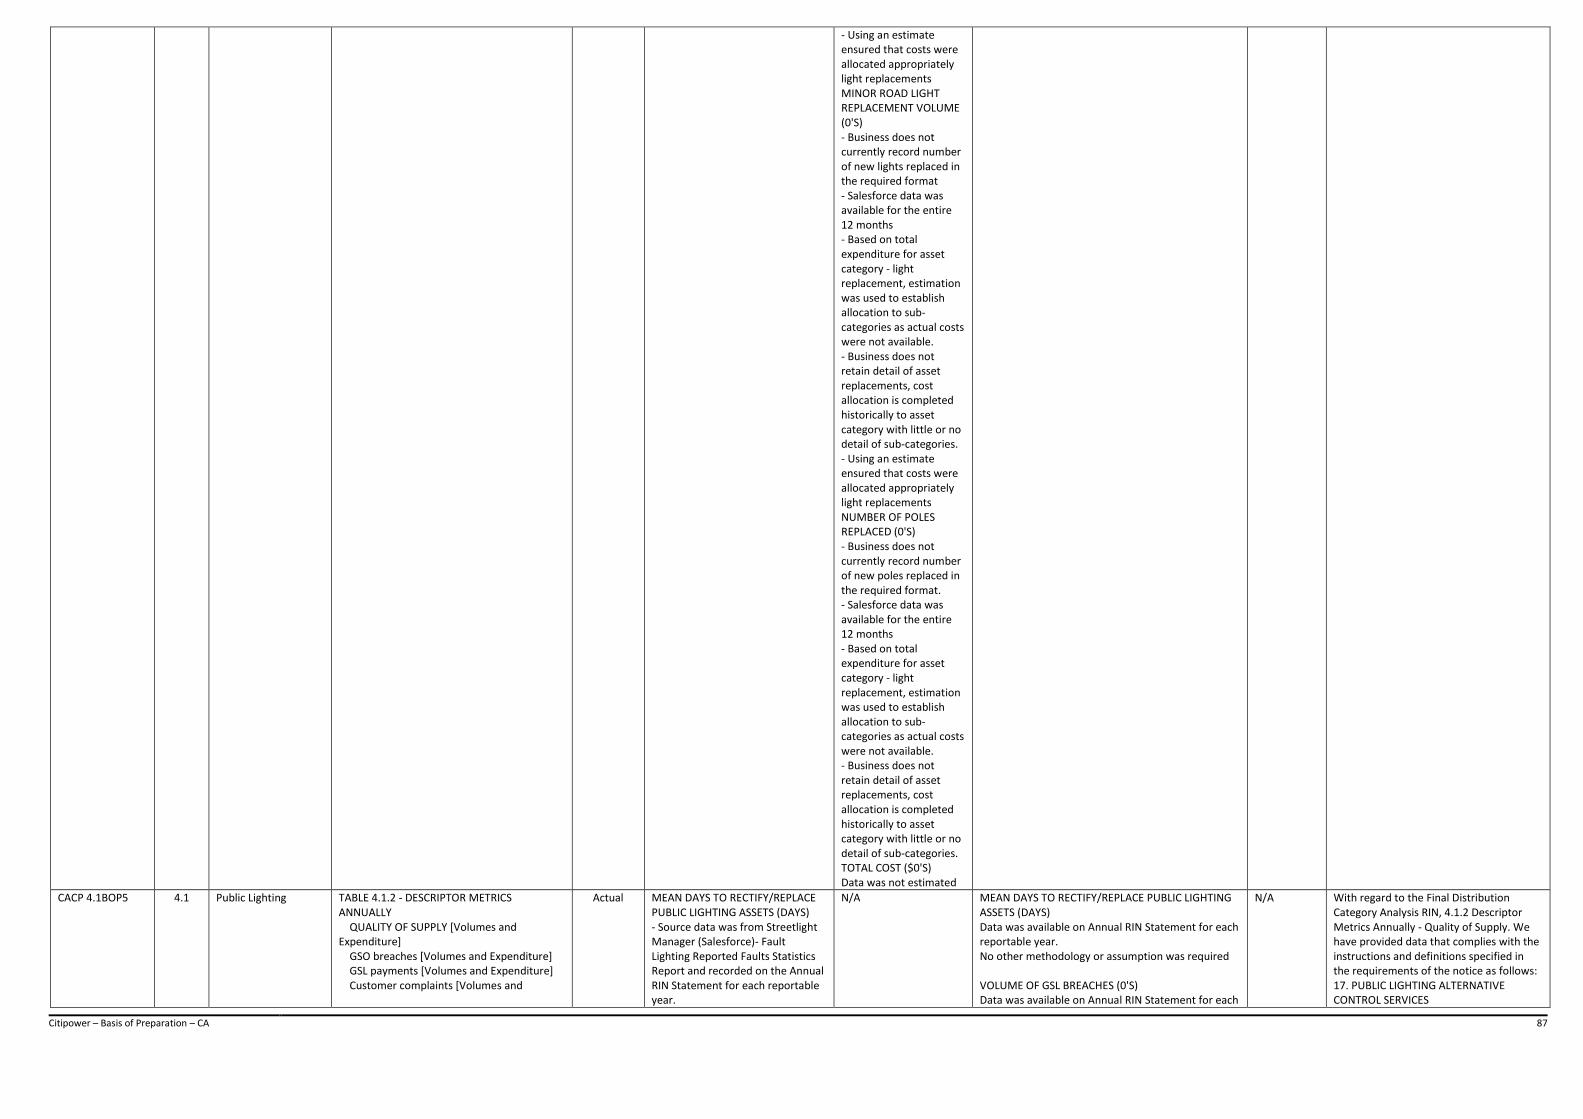
Citipower – Basis of Preparation – CA 87
- Using an estimate ensured that costs were allocated appropriately light replacements MINOR ROAD LIGHT REPLACEMENT VOLUME (0'S) - Business does not currently record number of new lights replaced in the required format - Salesforce data was available for the entire 12 months - Based on total expenditure for asset category - light replacement, estimation was used to establish allocation to sub-categories as actual costs were not available. - Business does not retain detail of asset replacements, cost allocation is completed historically to asset category with little or no detail of sub-categories. - Using an estimate ensured that costs were allocated appropriately light replacements NUMBER OF POLES REPLACED (0'S) - Business does not currently record number of new poles replaced in the required format. - Salesforce data was available for the entire 12 months - Based on total expenditure for asset category - light replacement, estimation was used to establish allocation to sub-categories as actual costs were not available. - Business does not retain detail of asset replacements, cost allocation is completed historically to asset category with little or no detail of sub-categories. TOTAL COST ($0'S) Data was not estimated
CACP 4.1BOP5 4.1 Public Lighting TABLE 4.1.2 - DESCRIPTOR METRICS ANNUALLY QUALITY OF SUPPLY [Volumes and Expenditure] GSO breaches [Volumes and Expenditure] GSL payments [Volumes and Expenditure] Customer complaints [Volumes and
Actual MEAN DAYS TO RECTIFY/REPLACE PUBLIC LIGHTING ASSETS (DAYS) - Source data was from Streetlight Manager (Salesforce)- Fault Lighting Reported Faults Statistics Report and recorded on the Annual RIN Statement for each reportable year.
N/A MEAN DAYS TO RECTIFY/REPLACE PUBLIC LIGHTING ASSETS (DAYS) Data was available on Annual RIN Statement for each reportable year. No other methodology or assumption was required VOLUME OF GSL BREACHES (0'S) Data was available on Annual RIN Statement for each
N/A With regard to the Final Distribution Category Analysis RIN, 4.1.2 Descriptor Metrics Annually - Quality of Supply. We have provided data that complies with the instructions and definitions specified in the requirements of the notice as follows: 17. PUBLIC LIGHTING ALTERNATIVE CONTROL SERVICES
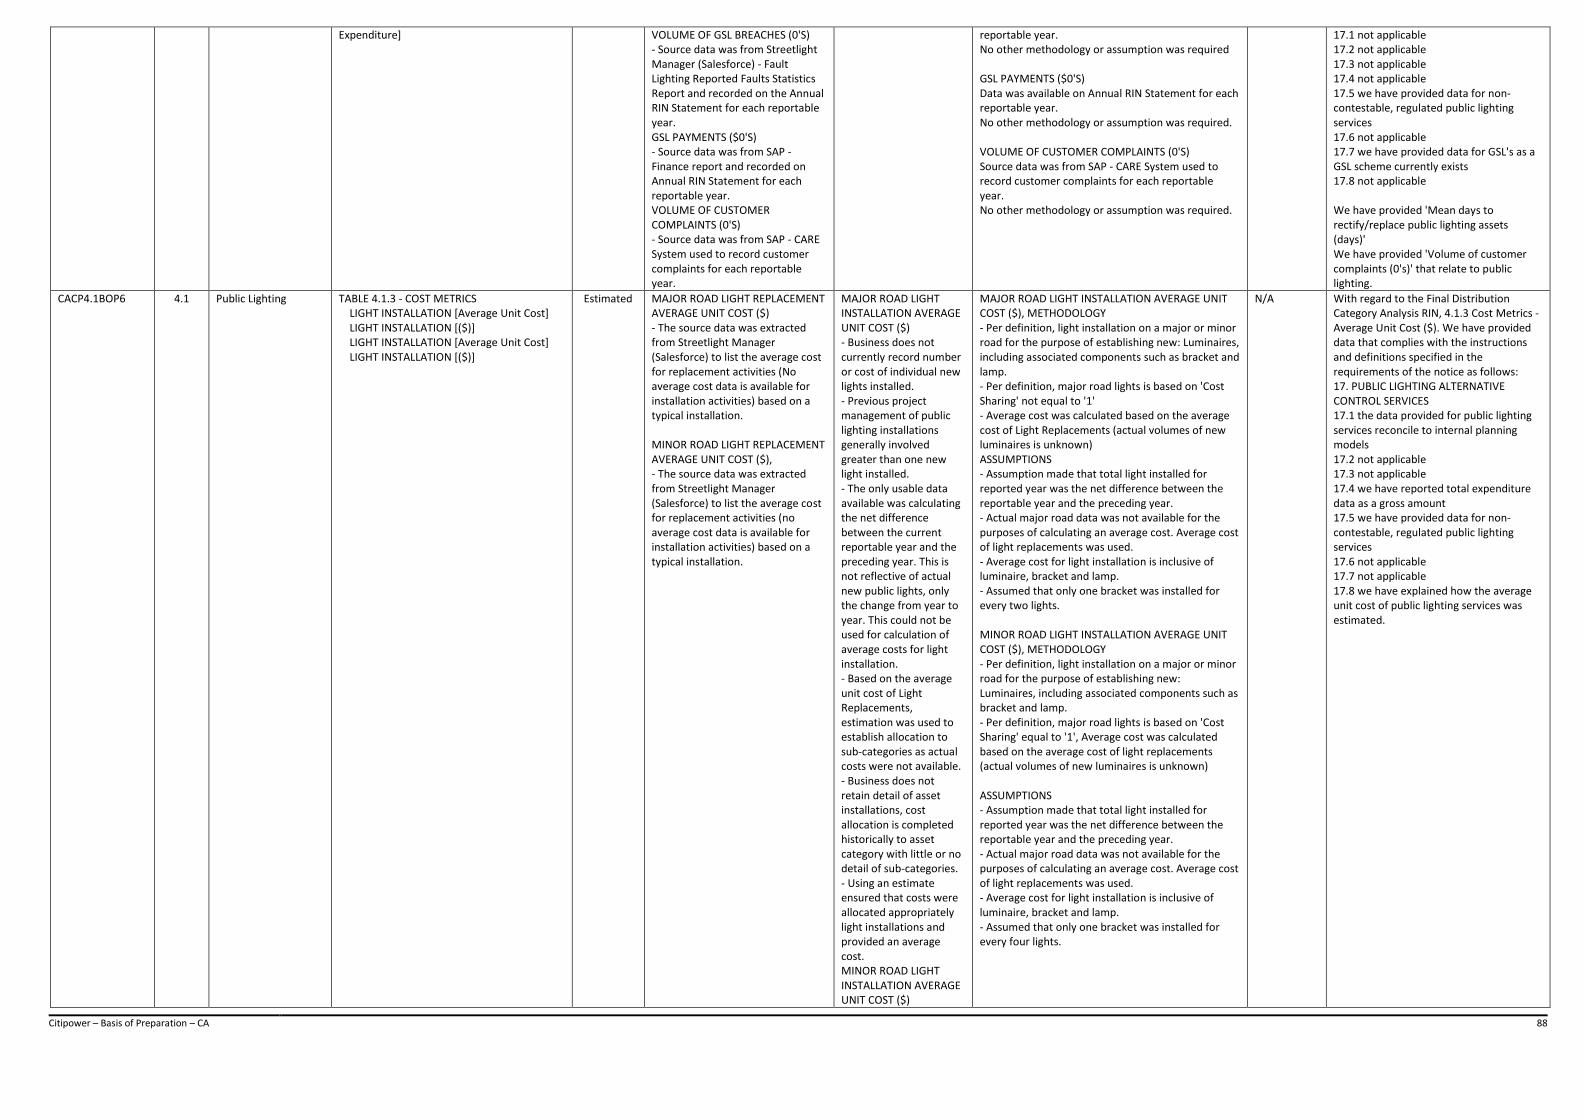
Citipower – Basis of Preparation – CA 88
Expenditure] VOLUME OF GSL BREACHES (0'S) - Source data was from Streetlight Manager (Salesforce) - Fault Lighting Reported Faults Statistics Report and recorded on the Annual RIN Statement for each reportable year. GSL PAYMENTS ($0'S) - Source data was from SAP - Finance report and recorded on Annual RIN Statement for each reportable year. VOLUME OF CUSTOMER COMPLAINTS (0'S) - Source data was from SAP - CARE System used to record customer complaints for each reportable year.
reportable year. No other methodology or assumption was required GSL PAYMENTS ($0'S) Data was available on Annual RIN Statement for each reportable year. No other methodology or assumption was required. VOLUME OF CUSTOMER COMPLAINTS (0'S) Source data was from SAP - CARE System used to record customer complaints for each reportable year. No other methodology or assumption was required.
17.1 not applicable 17.2 not applicable 17.3 not applicable 17.4 not applicable 17.5 we have provided data for non-contestable, regulated public lighting services 17.6 not applicable 17.7 we have provided data for GSL's as a GSL scheme currently exists 17.8 not applicable We have provided 'Mean days to rectify/replace public lighting assets (days)' We have provided 'Volume of customer complaints (0's)' that relate to public lighting.
CACP4.1BOP6 4.1 Public Lighting TABLE 4.1.3 - COST METRICS LIGHT INSTALLATION [Average Unit Cost] LIGHT INSTALLATION [($)] LIGHT INSTALLATION [Average Unit Cost] LIGHT INSTALLATION [($)]
Estimated MAJOR ROAD LIGHT REPLACEMENT AVERAGE UNIT COST ($) - The source data was extracted from Streetlight Manager (Salesforce) to list the average cost for replacement activities (No average cost data is available for installation activities) based on a typical installation. MINOR ROAD LIGHT REPLACEMENT AVERAGE UNIT COST ($), - The source data was extracted from Streetlight Manager (Salesforce) to list the average cost for replacement activities (no average cost data is available for installation activities) based on a typical installation.
MAJOR ROAD LIGHT INSTALLATION AVERAGE UNIT COST ($) - Business does not currently record number or cost of individual new lights installed. - Previous project management of public lighting installations generally involved greater than one new light installed. - The only usable data available was calculating the net difference between the current reportable year and the preceding year. This is not reflective of actual new public lights, only the change from year to year. This could not be used for calculation of average costs for light installation. - Based on the average unit cost of Light Replacements, estimation was used to establish allocation to sub-categories as actual costs were not available. - Business does not retain detail of asset installations, cost allocation is completed historically to asset category with little or no detail of sub-categories. - Using an estimate ensured that costs were allocated appropriately light installations and provided an average cost. MINOR ROAD LIGHT INSTALLATION AVERAGE UNIT COST ($)
MAJOR ROAD LIGHT INSTALLATION AVERAGE UNIT COST ($), METHODOLOGY - Per definition, light installation on a major or minor road for the purpose of establishing new: Luminaires, including associated components such as bracket and lamp. - Per definition, major road lights is based on 'Cost Sharing' not equal to '1' - Average cost was calculated based on the average cost of Light Replacements (actual volumes of new luminaires is unknown) ASSUMPTIONS - Assumption made that total light installed for reported year was the net difference between the reportable year and the preceding year. - Actual major road data was not available for the purposes of calculating an average cost. Average cost of light replacements was used. - Average cost for light installation is inclusive of luminaire, bracket and lamp. - Assumed that only one bracket was installed for every two lights. MINOR ROAD LIGHT INSTALLATION AVERAGE UNIT COST ($), METHODOLOGY - Per definition, light installation on a major or minor road for the purpose of establishing new: Luminaires, including associated components such as bracket and lamp. - Per definition, major road lights is based on 'Cost Sharing' equal to '1', Average cost was calculated based on the average cost of light replacements (actual volumes of new luminaires is unknown) ASSUMPTIONS - Assumption made that total light installed for reported year was the net difference between the reportable year and the preceding year. - Actual major road data was not available for the purposes of calculating an average cost. Average cost of light replacements was used. - Average cost for light installation is inclusive of luminaire, bracket and lamp. - Assumed that only one bracket was installed for every four lights.
N/A With regard to the Final Distribution Category Analysis RIN, 4.1.3 Cost Metrics - Average Unit Cost ($). We have provided data that complies with the instructions and definitions specified in the requirements of the notice as follows: 17. PUBLIC LIGHTING ALTERNATIVE CONTROL SERVICES 17.1 the data provided for public lighting services reconcile to internal planning models 17.2 not applicable 17.3 not applicable 17.4 we have reported total expenditure data as a gross amount 17.5 we have provided data for non-contestable, regulated public lighting services 17.6 not applicable 17.7 not applicable 17.8 we have explained how the average unit cost of public lighting services was estimated.
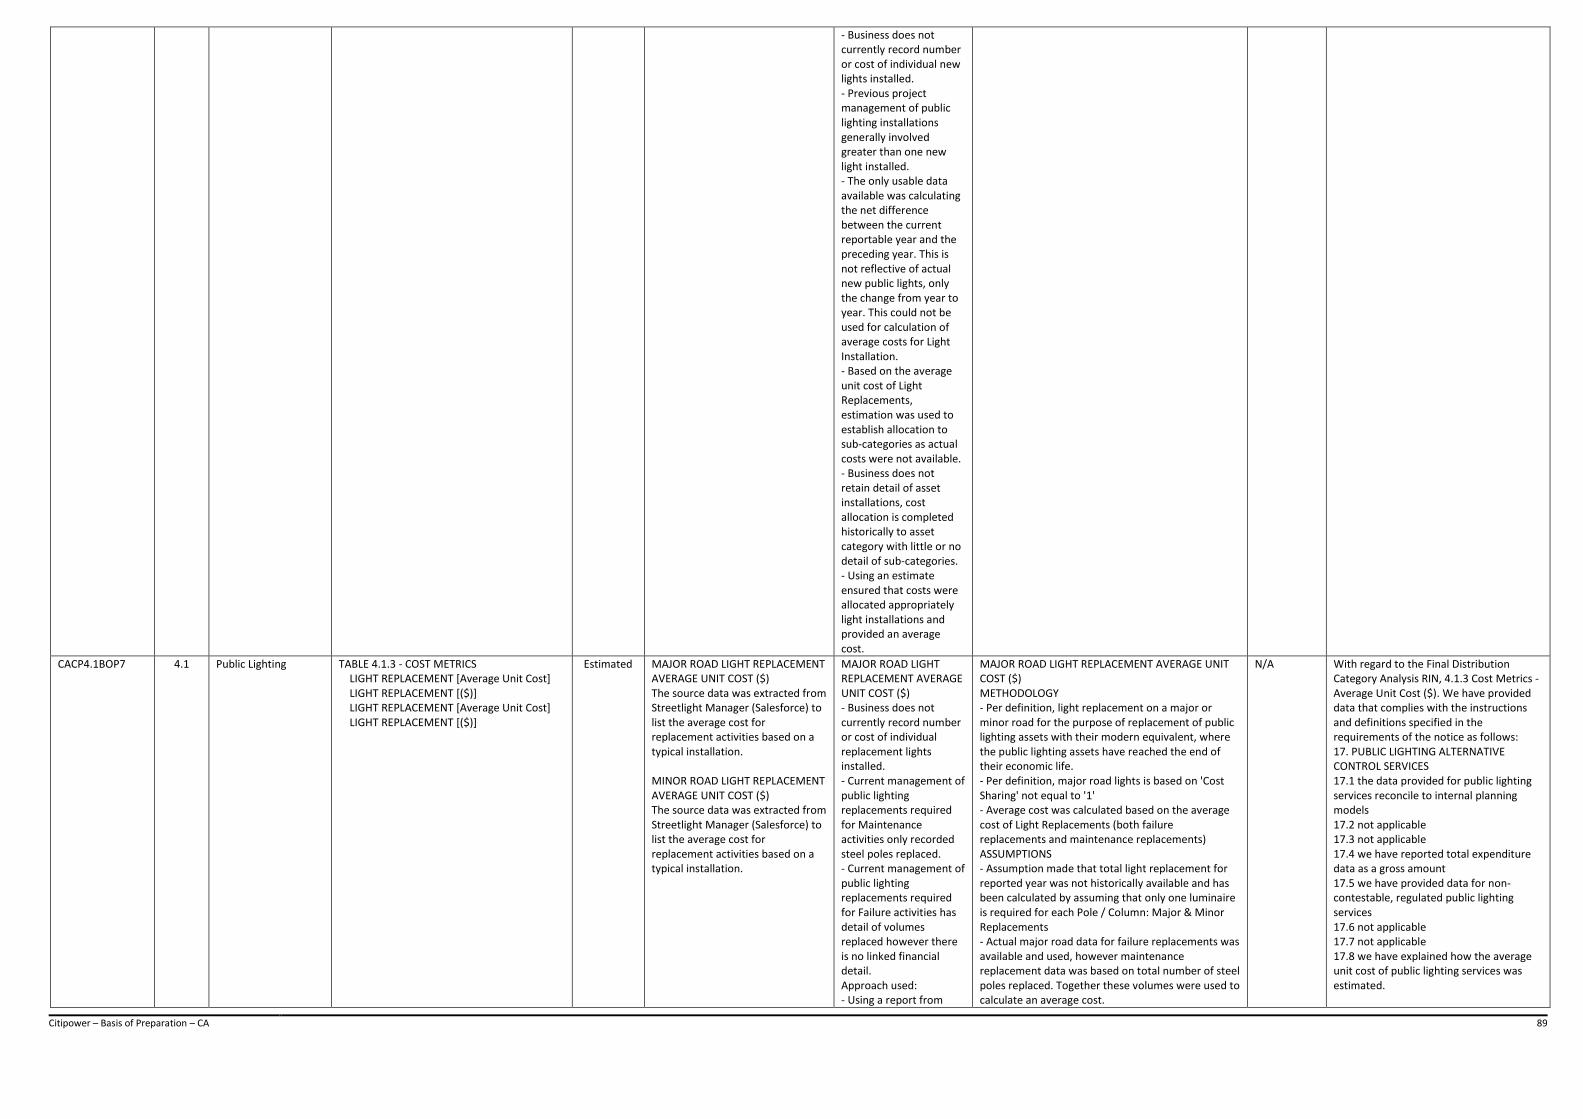
Citipower – Basis of Preparation – CA 89
- Business does not currently record number or cost of individual new lights installed. - Previous project management of public lighting installations generally involved greater than one new light installed. - The only usable data available was calculating the net difference between the current reportable year and the preceding year. This is not reflective of actual new public lights, only the change from year to year. This could not be used for calculation of average costs for Light Installation. - Based on the average unit cost of Light Replacements, estimation was used to establish allocation to sub-categories as actual costs were not available. - Business does not retain detail of asset installations, cost allocation is completed historically to asset category with little or no detail of sub-categories. - Using an estimate ensured that costs were allocated appropriately light installations and provided an average cost.
CACP4.1BOP7 4.1 Public Lighting TABLE 4.1.3 - COST METRICS LIGHT REPLACEMENT [Average Unit Cost] LIGHT REPLACEMENT [($)] LIGHT REPLACEMENT [Average Unit Cost] LIGHT REPLACEMENT [($)]
Estimated MAJOR ROAD LIGHT REPLACEMENT AVERAGE UNIT COST ($) The source data was extracted from Streetlight Manager (Salesforce) to list the average cost for replacement activities based on a typical installation. MINOR ROAD LIGHT REPLACEMENT AVERAGE UNIT COST ($) The source data was extracted from Streetlight Manager (Salesforce) to list the average cost for replacement activities based on a typical installation.
MAJOR ROAD LIGHT REPLACEMENT AVERAGE UNIT COST ($) - Business does not currently record number or cost of individual replacement lights installed. - Current management of public lighting replacements required for Maintenance activities only recorded steel poles replaced. - Current management of public lighting replacements required for Failure activities has detail of volumes replaced however there is no linked financial detail. Approach used: - Using a report from
MAJOR ROAD LIGHT REPLACEMENT AVERAGE UNIT COST ($) METHODOLOGY - Per definition, light replacement on a major or minor road for the purpose of replacement of public lighting assets with their modern equivalent, where the public lighting assets have reached the end of their economic life. - Per definition, major road lights is based on 'Cost Sharing' not equal to '1' - Average cost was calculated based on the average cost of Light Replacements (both failure replacements and maintenance replacements) ASSUMPTIONS - Assumption made that total light replacement for reported year was not historically available and has been calculated by assuming that only one luminaire is required for each Pole / Column: Major & Minor Replacements - Actual major road data for failure replacements was available and used, however maintenance replacement data was based on total number of steel poles replaced. Together these volumes were used to calculate an average cost.
N/A With regard to the Final Distribution Category Analysis RIN, 4.1.3 Cost Metrics - Average Unit Cost ($). We have provided data that complies with the instructions and definitions specified in the requirements of the notice as follows: 17. PUBLIC LIGHTING ALTERNATIVE CONTROL SERVICES 17.1 the data provided for public lighting services reconcile to internal planning models 17.2 not applicable 17.3 not applicable 17.4 we have reported total expenditure data as a gross amount 17.5 we have provided data for non-contestable, regulated public lighting services 17.6 not applicable 17.7 not applicable 17.8 we have explained how the average unit cost of public lighting services was estimated.

Citipower – Basis of Preparation – CA 90
Streetlight Manager (Salesforce) to list typical activities ensured that costs were allocated appropriately to light replacements and provided an average cost. - Business does not retain detail of asset replacement for maintenance activities, cost allocation is completed historically by a percentage allocation to asset category with little or no detail of sub-categories. - Business does retain some detail of asset replacement for failure activities, however cost allocation is completed historically by allocation to asset category with little or no detail of sub-categories.
- Average cost for light replacement is inclusive of luminaire and lamp. It is assumed that the bracket would be re-used. - Assumed that only one light was installed per replacement, regardless of bracket used. MINOR ROAD LIGHT REPLACEMENT AVERAGE UNIT COST ($) METHODOLOGY - Per definition, light replacement on a major or minor road for the purpose of replacement of public lighting assets with their modern equivalent, where the public lighting assets have reached the end of their economic life. - Per definition, minor road lights is based on 'Cost Sharing' equal to '1' - Average cost was calculated based on the average cost of Light Replacements (both failure replacements and maintenance replacements) ASSUMPTIONS - Assumption made that total light replacement for reported year was not historically available and has been calculated by assuming that only one luminaire is required for each Pole/ Column Major & Minor Replacements - Actual minor road data for failure replacements was available and used, however maintenance replacement data was based on total number of lanterns replaced. Together these volumes were used to calculate an average cost. - Average cost for light replacement is inclusive of luminaire and lamp. It is assumed that the bracket would be re-used. - Assumed that only one light was installed per replacement, regardless of bracket used.
CACP 4.1BOP8 4.1 Public Lighting TABLE 4.1.3 - COST METRICS LIGHT MAINTENANCE [Average Unit Cost] LIGHT MAINTENANCE [($)] LIGHT MAINTENANCE [Average Unit Cost] LIGHT MAINTENANCE [($)]
Estimated RROUTINE MAINTENANCE AVERAGE UNIT COST ($) - The source data was extracted from Streetlight Manager (Salesforce) via report the average cost for routine and non-routine maintenance. NON-ROUTINE MAINTENANCE AVERAGE UNIT COST ($) - The source data was extracted from Streetlight Manager (Salesforce) via report the average cost for routine and non-routine maintenance.
ROUTINE MAINTENANCE AVERAGE UNIT COST ($) - Business does not currently record number or cost of bulk lamp replacement or pole inspections on an individual basis. - Management of public lighting bulk lamp replacement programs are issued as a package of work based on municipality. - The only usable data available was calculating the average number of lamps replaced in a given year based on a four yearly cycle. - Based on total expenditure for asset category - routine maintenance. - Business does not retain detail of routine maintenance, cost allocation is completed historically to asset category with little or no detail of sub-categories. - Using an estimate
ROUTINE MAINTENANCE AVERAGE UNIT COST ($) METHODOLOGY - Per definition, light maintenance should include the operational repairs and inspection of the public lighting assets, not including capital expenditure. - Average costs were based on activities relating to routine maintenance in each reportable year. ASSUMPTIONS - Actual volume of luminaire routine maintenance has been calculated using data extracted from Salesforce (Streetlight Manager) and an allocation method for bulk lamp replacement of the total lamp population. NON-ROUTINE MAINTENANCE AVERAGE UNIT COST ($) METHODOLOGY - Per definition, light maintenance should include the operational repairs and inspection of the public lighting assets, not including capital expenditure. - Average costs were based on activities relating to routine maintenance in each reportable year. ASSUMPTIONS - Actual volume of luminaire routine maintenance has been calculated using data extracted from Salesforce (Streetlight Manager) and an allocation method for bulk lamp replacement of the total lamp population.
N/A With regard to the Final Distribution Category Analysis RIN, 4.1.3 Cost Metrics - Average Unit Cost ($). We have provided data that complies with the instructions and definitions specified in the requirements of the notice as follows: 17. PUBLIC LIGHTING ALTERNATIVE CONTROL SERVICES 17.1 the data provided for public lighting services reconcile to internal planning models 17.2 not applicable 17.3 not applicable 17.4 we have reported total expenditure data as a gross amount 17.5 we have provided data for non-contestable, regulated public lighting services 17.6 not applicable 17.7 not applicable 17.8 we have explained how the average unit cost of public lighting services was estimated.

Citipower – Basis of Preparation – CA 91
ensured that costs were allocated appropriately routine maintenance average cost. NON-ROUTINE MAINTENANCE AVERAGE UNIT COST ($) - Business currently records the volume of non-routine maintenance which is inclusive of all non-capital activities - Management of public lighting non-routine maintenance generally involves lamp and PE cell replacement, however other operational expenses such as faulty cables, vandalism etc. are also included - Based on total expenditure for asset category - non-routine maintenance. - Business does not retain detail of asset maintenance, cost allocation is completed historically to asset category with little or no detail of sub-categories. - Using an estimate ensured that costs were allocated appropriately non-routine maintenance average cost.
CACP4.1BOP9 4.1 Public Lighting TABLE 4.1.2 - DESCRIPTOR METRICS ANNUALLY Total cost ($'s) [Volumes and Expenditure] Total cost ($'s) [Volumes and Expenditure] Total cost ($'s) [Volumes and Expenditure]
Actual TOTAL COST ($0'S) The source data was extracted from SAP Finance based on function code allocation for each reportable year.
N/A TOTAL COST ($0'S) METHODOLOGY - This balance was extracted directly from SAP based on the identification of function codes 313, 380 and 450 which are applicable for public lighting maintenance. - A percentage of direct costs was also allocated using total public lighting as a percentage of total expenditure. This cost allocation method was considered appropriate by the AER in the Financial RIN and is in accordance with CitiPower's cost allocation methodology. - No assumptions required.
N/A With regard to the Final Distribution Category Analysis RIN, 4.1.1 Current Population of Lights by light type. We have provided data that complies with the instructions and definitions specified in the requirements of the notice as follows: 17. PUBLIC LIGHTING ALTERNATIVE CONTROL SERVICES 17.1 the data provided for public lighting services reconcile to internal planning models 17.2 not applicable 17.3 not applicable 17.4 we have reported total expenditure data as a gross amount 17.5 we have provided data for non-contestable, regulated public lighting services 17.6 not applicable 17.7 not applicable 17.8 not applicable
CACP4.2BOP1 4.2 Metering TABLE 4.2.1 - METERING DESCRIPTOR METRIC Actual All volumes are originally obtained from CIS and have been previously provided to the AER as outlined below: Based on unaudited regulatory accounts, which have been derived from reports from CIS.
N/A Volumes calculated using actual previous year closing balance volumes provided in the Annual RIN.
N/A This template is compliant to the definitions specified in the CA RIN as outlined in section A above. Average meter volumes in this template are calculated using audited data previously provided to the AER and excludes any contestable metering volumes and
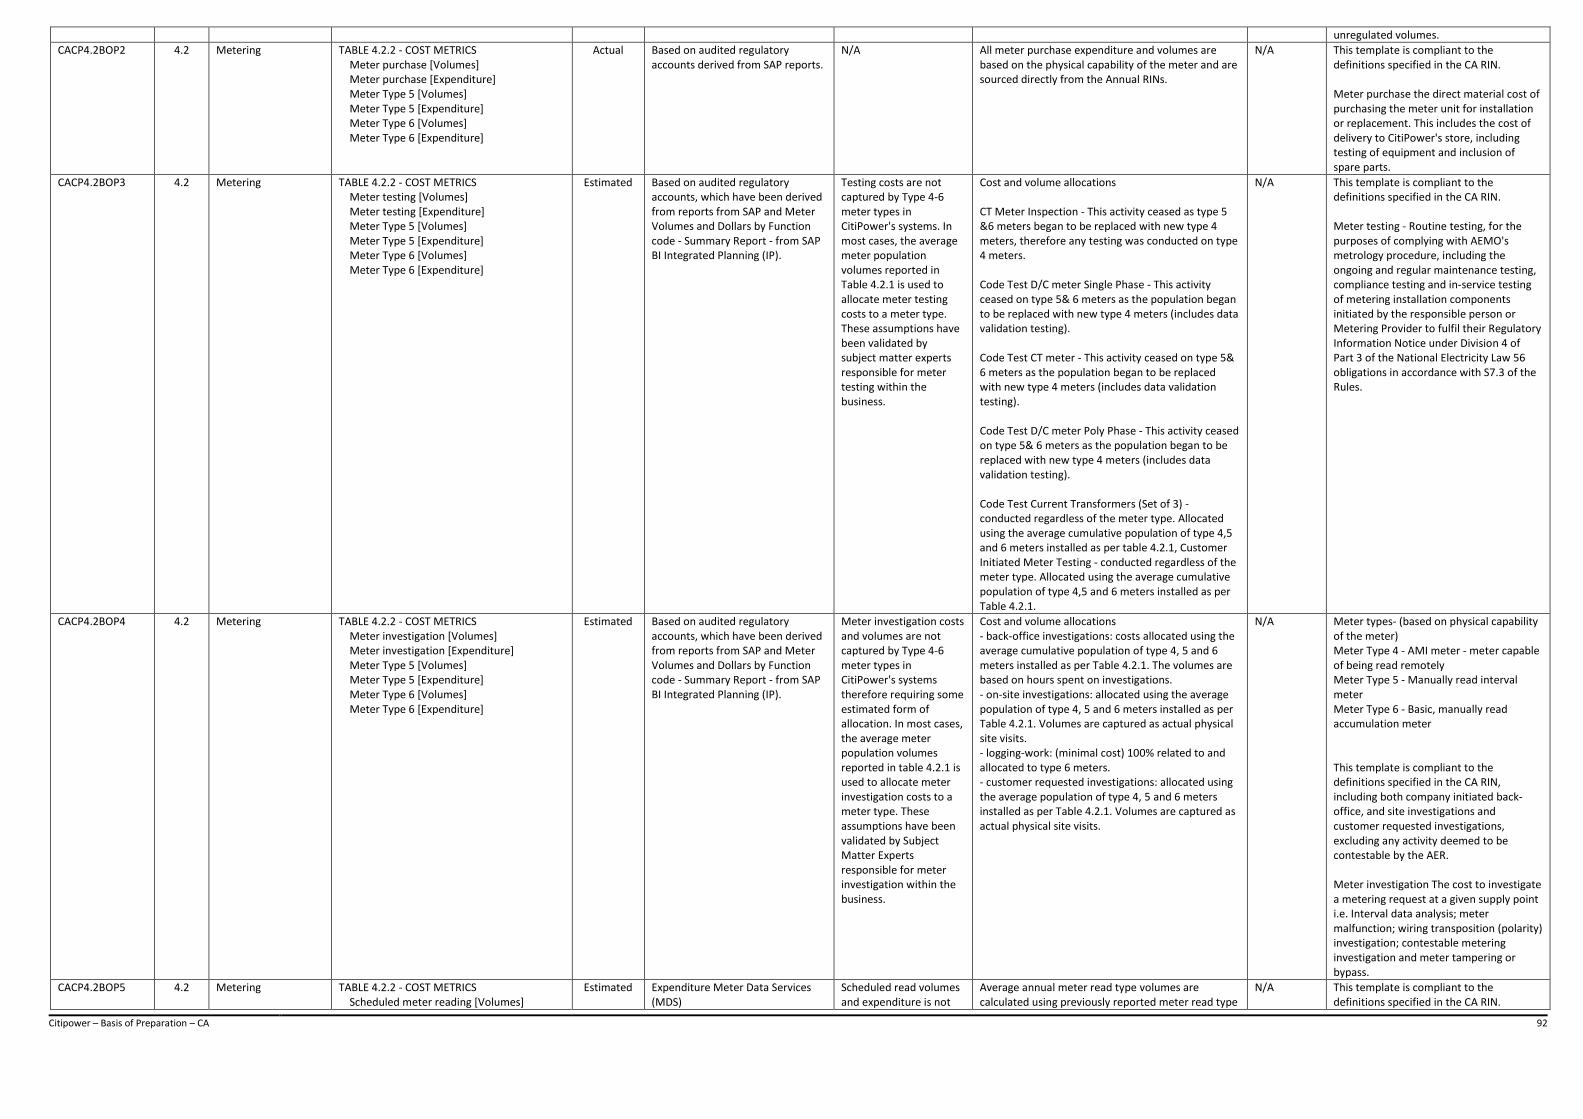
Citipower – Basis of Preparation – CA 92
unregulated volumes.
CACP4.2BOP2 4.2 Metering TABLE 4.2.2 - COST METRICS Meter purchase [Volumes] Meter purchase [Expenditure] Meter Type 5 [Volumes] Meter Type 5 [Expenditure] Meter Type 6 [Volumes] Meter Type 6 [Expenditure]
Actual Based on audited regulatory accounts derived from SAP reports.
N/A All meter purchase expenditure and volumes are based on the physical capability of the meter and are sourced directly from the Annual RINs.
N/A This template is compliant to the definitions specified in the CA RIN. Meter purchase the direct material cost of purchasing the meter unit for installation or replacement. This includes the cost of delivery to CitiPower's store, including testing of equipment and inclusion of spare parts.
CACP4.2BOP3 4.2 Metering TABLE 4.2.2 - COST METRICS Meter testing [Volumes] Meter testing [Expenditure] Meter Type 5 [Volumes] Meter Type 5 [Expenditure] Meter Type 6 [Volumes] Meter Type 6 [Expenditure]
Estimated Based on audited regulatory accounts, which have been derived from reports from SAP and Meter Volumes and Dollars by Function code - Summary Report - from SAP BI Integrated Planning (IP).
Testing costs are not captured by Type 4-6 meter types in CitiPower's systems. In most cases, the average meter population volumes reported in Table 4.2.1 is used to allocate meter testing costs to a meter type. These assumptions have been validated by subject matter experts responsible for meter testing within the business.
Cost and volume allocations CT Meter Inspection - This activity ceased as type 5 &6 meters began to be replaced with new type 4 meters, therefore any testing was conducted on type 4 meters. Code Test D/C meter Single Phase - This activity ceased on type 5& 6 meters as the population began to be replaced with new type 4 meters (includes data validation testing). Code Test CT meter - This activity ceased on type 5& 6 meters as the population began to be replaced with new type 4 meters (includes data validation testing). Code Test D/C meter Poly Phase - This activity ceased on type 5& 6 meters as the population began to be replaced with new type 4 meters (includes data validation testing). Code Test Current Transformers (Set of 3) - conducted regardless of the meter type. Allocated using the average cumulative population of type 4,5 and 6 meters installed as per table 4.2.1, Customer Initiated Meter Testing - conducted regardless of the meter type. Allocated using the average cumulative population of type 4,5 and 6 meters installed as per Table 4.2.1.
N/A This template is compliant to the definitions specified in the CA RIN. Meter testing - Routine testing, for the purposes of complying with AEMO's metrology procedure, including the ongoing and regular maintenance testing, compliance testing and in-service testing of metering installation components initiated by the responsible person or Metering Provider to fulfil their Regulatory Information Notice under Division 4 of Part 3 of the National Electricity Law 56 obligations in accordance with S7.3 of the Rules.
CACP4.2BOP4 4.2 Metering TABLE 4.2.2 - COST METRICS Meter investigation [Volumes] Meter investigation [Expenditure] Meter Type 5 [Volumes] Meter Type 5 [Expenditure] Meter Type 6 [Volumes] Meter Type 6 [Expenditure]
Estimated Based on audited regulatory accounts, which have been derived from reports from SAP and Meter Volumes and Dollars by Function code - Summary Report - from SAP BI Integrated Planning (IP).
Meter investigation costs and volumes are not captured by Type 4-6 meter types in CitiPower's systems therefore requiring some estimated form of allocation. In most cases, the average meter population volumes reported in table 4.2.1 is used to allocate meter investigation costs to a meter type. These assumptions have been validated by Subject Matter Experts responsible for meter investigation within the business.
Cost and volume allocations - back-office investigations: costs allocated using the average cumulative population of type 4, 5 and 6 meters installed as per Table 4.2.1. The volumes are based on hours spent on investigations. - on-site investigations: allocated using the average population of type 4, 5 and 6 meters installed as per Table 4.2.1. Volumes are captured as actual physical site visits. - logging-work: (minimal cost) 100% related to and allocated to type 6 meters. - customer requested investigations: allocated using the average population of type 4, 5 and 6 meters installed as per Table 4.2.1. Volumes are captured as actual physical site visits.
N/A Meter types- (based on physical capability of the meter) Meter Type 4 - AMI meter - meter capable of being read remotely Meter Type 5 - Manually read interval meter Meter Type 6 - Basic, manually read accumulation meter This template is compliant to the definitions specified in the CA RIN, including both company initiated back-office, and site investigations and customer requested investigations, excluding any activity deemed to be contestable by the AER. Meter investigation The cost to investigate a metering request at a given supply point i.e. Interval data analysis; meter malfunction; wiring transposition (polarity) investigation; contestable metering investigation and meter tampering or bypass.
CACP4.2BOP5 4.2 Metering TABLE 4.2.2 - COST METRICS Scheduled meter reading [Volumes]
Estimated Expenditure Meter Data Services (MDS)
Scheduled read volumes and expenditure is not
Average annual meter read type volumes are calculated using previously reported meter read type
N/A This template is compliant to the definitions specified in the CA RIN.
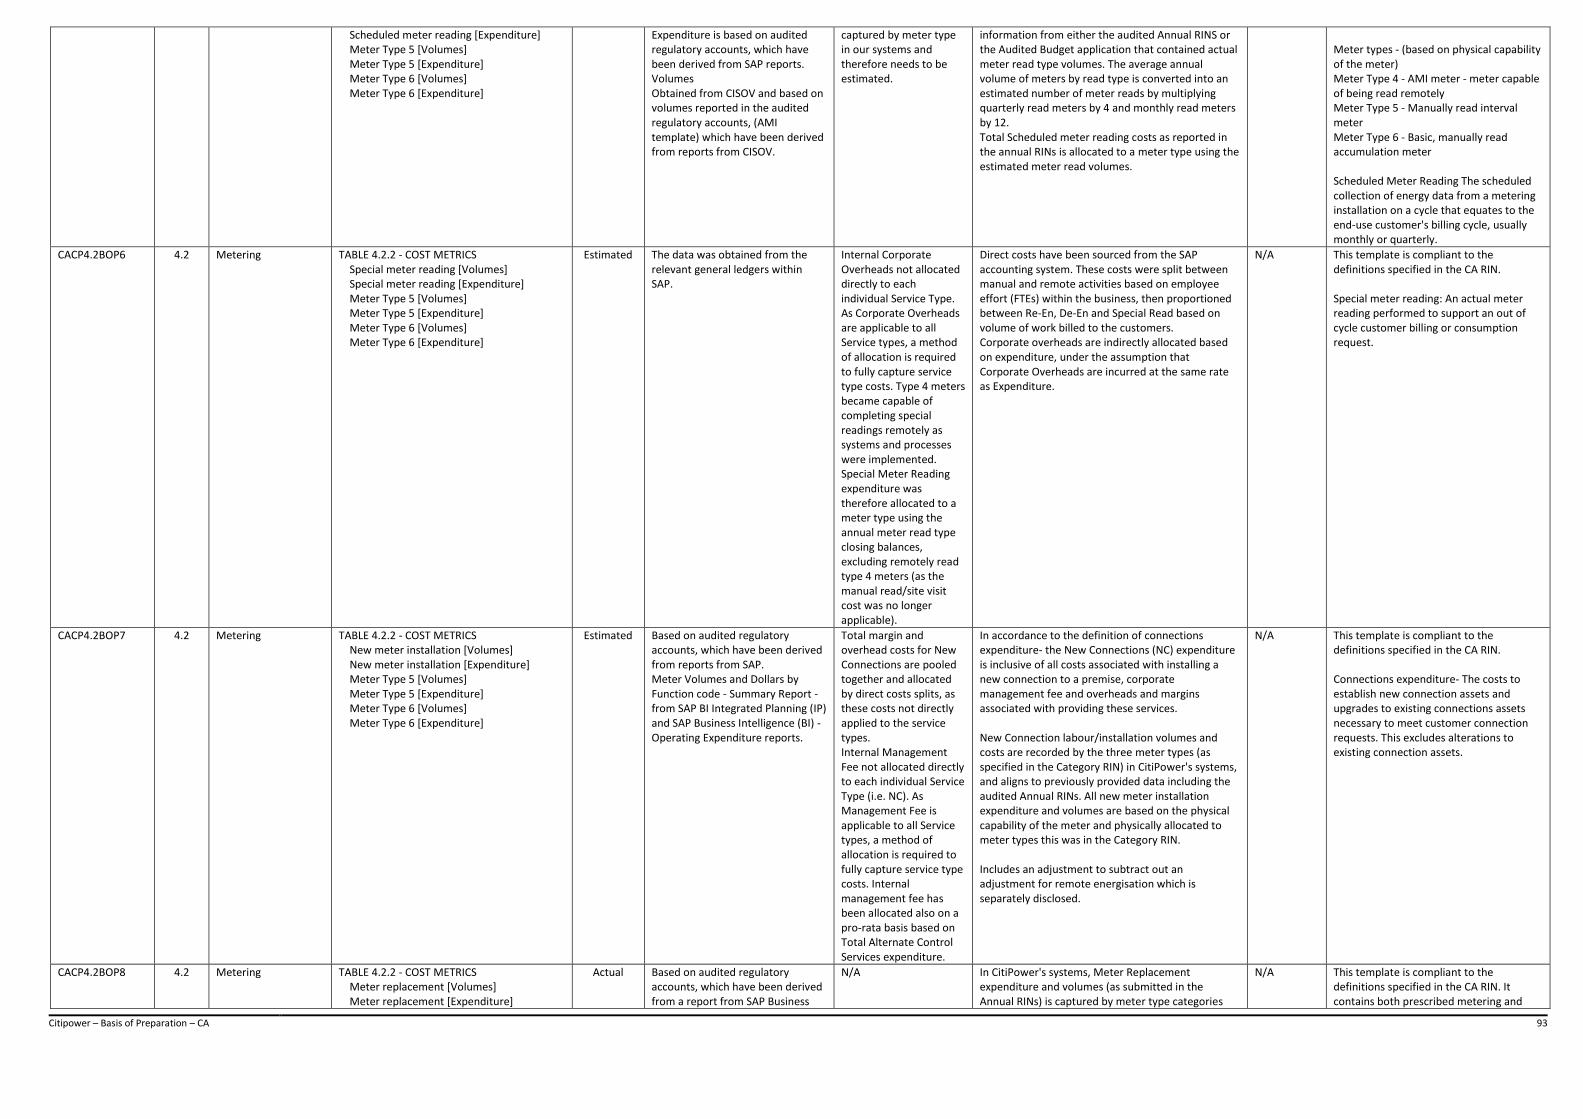
Citipower – Basis of Preparation – CA 93
Scheduled meter reading [Expenditure] Meter Type 5 [Volumes] Meter Type 5 [Expenditure] Meter Type 6 [Volumes] Meter Type 6 [Expenditure]
Expenditure is based on audited regulatory accounts, which have been derived from SAP reports. Volumes Obtained from CISOV and based on volumes reported in the audited regulatory accounts, (AMI template) which have been derived from reports from CISOV.
captured by meter type in our systems and therefore needs to be estimated.
information from either the audited Annual RINS or the Audited Budget application that contained actual meter read type volumes. The average annual volume of meters by read type is converted into an estimated number of meter reads by multiplying quarterly read meters by 4 and monthly read meters by 12. Total Scheduled meter reading costs as reported in the annual RINs is allocated to a meter type using the estimated meter read volumes.
Meter types - (based on physical capability of the meter) Meter Type 4 - AMI meter - meter capable of being read remotely Meter Type 5 - Manually read interval meter Meter Type 6 - Basic, manually read accumulation meter Scheduled Meter Reading The scheduled collection of energy data from a metering installation on a cycle that equates to the end-use customer's billing cycle, usually monthly or quarterly.
CACP4.2BOP6 4.2 Metering TABLE 4.2.2 - COST METRICS Special meter reading [Volumes] Special meter reading [Expenditure] Meter Type 5 [Volumes] Meter Type 5 [Expenditure] Meter Type 6 [Volumes] Meter Type 6 [Expenditure]
Estimated The data was obtained from the relevant general ledgers within SAP.
Internal Corporate Overheads not allocated directly to each individual Service Type. As Corporate Overheads are applicable to all Service types, a method of allocation is required to fully capture service type costs. Type 4 meters became capable of completing special readings remotely as systems and processes were implemented. Special Meter Reading expenditure was therefore allocated to a meter type using the annual meter read type closing balances, excluding remotely read type 4 meters (as the manual read/site visit cost was no longer applicable).
Direct costs have been sourced from the SAP accounting system. These costs were split between manual and remote activities based on employee effort (FTEs) within the business, then proportioned between Re-En, De-En and Special Read based on volume of work billed to the customers. Corporate overheads are indirectly allocated based on expenditure, under the assumption that Corporate Overheads are incurred at the same rate as Expenditure.
N/A This template is compliant to the definitions specified in the CA RIN. Special meter reading: An actual meter reading performed to support an out of cycle customer billing or consumption request.
CACP4.2BOP7 4.2 Metering TABLE 4.2.2 - COST METRICS New meter installation [Volumes] New meter installation [Expenditure] Meter Type 5 [Volumes] Meter Type 5 [Expenditure] Meter Type 6 [Volumes] Meter Type 6 [Expenditure]
Estimated Based on audited regulatory accounts, which have been derived from reports from SAP. Meter Volumes and Dollars by Function code - Summary Report - from SAP BI Integrated Planning (IP) and SAP Business Intelligence (BI) - Operating Expenditure reports.
Total margin and overhead costs for New Connections are pooled together and allocated by direct costs splits, as these costs not directly applied to the service types. Internal Management Fee not allocated directly to each individual Service Type (i.e. NC). As Management Fee is applicable to all Service types, a method of allocation is required to fully capture service type costs. Internal management fee has been allocated also on a pro-rata basis based on Total Alternate Control Services expenditure.
In accordance to the definition of connections expenditure- the New Connections (NC) expenditure is inclusive of all costs associated with installing a new connection to a premise, corporate management fee and overheads and margins associated with providing these services. New Connection labour/installation volumes and costs are recorded by the three meter types (as specified in the Category RIN) in CitiPower's systems, and aligns to previously provided data including the audited Annual RINs. All new meter installation expenditure and volumes are based on the physical capability of the meter and physically allocated to meter types this was in the Category RIN. Includes an adjustment to subtract out an adjustment for remote energisation which is separately disclosed.
N/A This template is compliant to the definitions specified in the CA RIN. Connections expenditure- The costs to establish new connection assets and upgrades to existing connections assets necessary to meet customer connection requests. This excludes alterations to existing connection assets.
CACP4.2BOP8 4.2 Metering TABLE 4.2.2 - COST METRICS Meter replacement [Volumes] Meter replacement [Expenditure]
Actual Based on audited regulatory accounts, which have been derived from a report from SAP Business
N/A In CitiPower's systems, Meter Replacement expenditure and volumes (as submitted in the Annual RINs) is captured by meter type categories
N/A This template is compliant to the definitions specified in the CA RIN. It contains both prescribed metering and
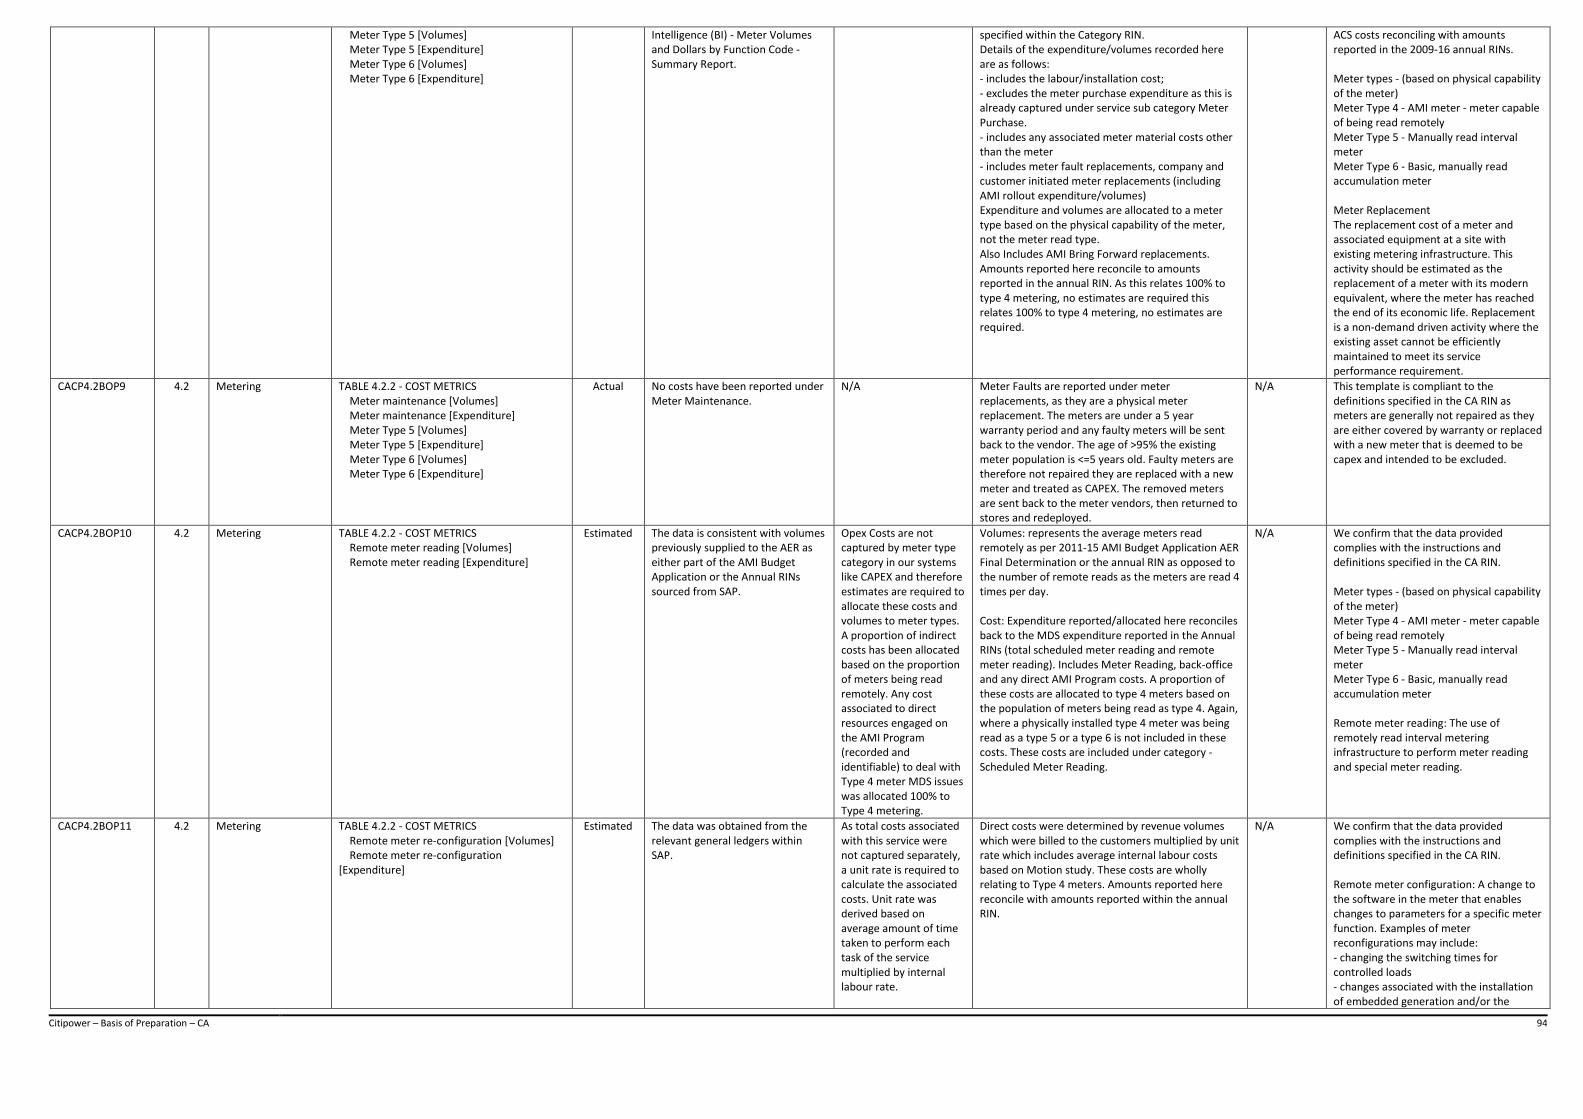
Citipower – Basis of Preparation – CA 94
Meter Type 5 [Volumes] Meter Type 5 [Expenditure] Meter Type 6 [Volumes] Meter Type 6 [Expenditure]
Intelligence (BI) - Meter Volumes and Dollars by Function Code - Summary Report.
specified within the Category RIN. Details of the expenditure/volumes recorded here are as follows: - includes the labour/installation cost; - excludes the meter purchase expenditure as this is already captured under service sub category Meter Purchase. - includes any associated meter material costs other than the meter - includes meter fault replacements, company and customer initiated meter replacements (including AMI rollout expenditure/volumes) Expenditure and volumes are allocated to a meter type based on the physical capability of the meter, not the meter read type. Also Includes AMI Bring Forward replacements. Amounts reported here reconcile to amounts reported in the annual RIN. As this relates 100% to type 4 metering, no estimates are required this relates 100% to type 4 metering, no estimates are required.
ACS costs reconciling with amounts reported in the 2009-16 annual RINs. Meter types - (based on physical capability of the meter) Meter Type 4 - AMI meter - meter capable of being read remotely Meter Type 5 - Manually read interval meter Meter Type 6 - Basic, manually read accumulation meter Meter Replacement The replacement cost of a meter and associated equipment at a site with existing metering infrastructure. This activity should be estimated as the replacement of a meter with its modern equivalent, where the meter has reached the end of its economic life. Replacement is a non-demand driven activity where the existing asset cannot be efficiently maintained to meet its service performance requirement.
CACP4.2BOP9 4.2 Metering TABLE 4.2.2 - COST METRICS Meter maintenance [Volumes] Meter maintenance [Expenditure] Meter Type 5 [Volumes] Meter Type 5 [Expenditure] Meter Type 6 [Volumes] Meter Type 6 [Expenditure]
Actual No costs have been reported under Meter Maintenance.
N/A Meter Faults are reported under meter replacements, as they are a physical meter replacement. The meters are under a 5 year warranty period and any faulty meters will be sent back to the vendor. The age of >95% the existing meter population is <=5 years old. Faulty meters are therefore not repaired they are replaced with a new meter and treated as CAPEX. The removed meters are sent back to the meter vendors, then returned to stores and redeployed.
N/A This template is compliant to the definitions specified in the CA RIN as meters are generally not repaired as they are either covered by warranty or replaced with a new meter that is deemed to be capex and intended to be excluded.
CACP4.2BOP10 4.2 Metering TABLE 4.2.2 - COST METRICS Remote meter reading [Volumes] Remote meter reading [Expenditure]
Estimated The data is consistent with volumes previously supplied to the AER as either part of the AMI Budget Application or the Annual RINs sourced from SAP.
Opex Costs are not captured by meter type category in our systems like CAPEX and therefore estimates are required to allocate these costs and volumes to meter types. A proportion of indirect costs has been allocated based on the proportion of meters being read remotely. Any cost associated to direct resources engaged on the AMI Program (recorded and identifiable) to deal with Type 4 meter MDS issues was allocated 100% to Type 4 metering.
Volumes: represents the average meters read remotely as per 2011-15 AMI Budget Application AER Final Determination or the annual RIN as opposed to the number of remote reads as the meters are read 4 times per day. Cost: Expenditure reported/allocated here reconciles back to the MDS expenditure reported in the Annual RINs (total scheduled meter reading and remote meter reading). Includes Meter Reading, back-office and any direct AMI Program costs. A proportion of these costs are allocated to type 4 meters based on the population of meters being read as type 4. Again, where a physically installed type 4 meter was being read as a type 5 or a type 6 is not included in these costs. These costs are included under category - Scheduled Meter Reading.
N/A We confirm that the data provided complies with the instructions and definitions specified in the CA RIN. Meter types - (based on physical capability of the meter) Meter Type 4 - AMI meter - meter capable of being read remotely Meter Type 5 - Manually read interval meter Meter Type 6 - Basic, manually read accumulation meter Remote meter reading: The use of remotely read interval metering infrastructure to perform meter reading and special meter reading.
CACP4.2BOP11 4.2 Metering TABLE 4.2.2 - COST METRICS Remote meter re-configuration [Volumes] Remote meter re-configuration [Expenditure]
Estimated The data was obtained from the relevant general ledgers within SAP.
As total costs associated with this service were not captured separately, a unit rate is required to calculate the associated costs. Unit rate was derived based on average amount of time taken to perform each task of the service multiplied by internal labour rate.
Direct costs were determined by revenue volumes which were billed to the customers multiplied by unit rate which includes average internal labour costs based on Motion study. These costs are wholly relating to Type 4 meters. Amounts reported here reconcile with amounts reported within the annual RIN.
N/A We confirm that the data provided complies with the instructions and definitions specified in the CA RIN. Remote meter configuration: A change to the software in the meter that enables changes to parameters for a specific meter function. Examples of meter reconfigurations may include: - changing the switching times for controlled loads - changes associated with the installation of embedded generation and/or the

Citipower – Basis of Preparation – CA 95
premium feed-in tariff
CACP4.2BOP12 4.2 Metering TABLE 4.2.2 - COST METRICS Other metering [Volumes] Meter Type 5 [Volumes] Meter Type 6 [Volumes] Meter Type 7 [Volumes]
Estimated Based on audited regulatory accounts, which have been derived from reports from SAP Business Intelligence (BI) Depreciation report and SAP BI Capital report.
Other costs are easily identifiable and previously reported within the annual RINs. These costs are not however recorded by meter type and therefore an estimate is required to report them this way. Cost reported as 'other metering' mostly relates to: - Company Initiated Meter Replacements or Abolishments (non-customer requested activity) - allocated using average Type 4-6 meter population in table 4.2.1 Meter Program and/or Time-switch resets - 100% Type 4 meters - meter reprograming/resets A pro rata assumption has been made for Service truck and wasted truck visits not billed via eConnect, which have been identified using Lend lease, SAP and eConnect data.
In CitiPower's systems, there are a number of Operating expenditure (Opex) items that do not fit into the required categories in table 4.2.2. These costs as reported in the Annual RIN's however are not captured by meter type categories used within the Category RIN.
N/A This template is compliant to the definitions specified in the CA RIN. Other costs (metering) - The costs of performing metering services which are not already included in the following meter services: - Meter purchase - Meter testing - Meter investigation - Scheduled meter reading - Special meter reading - New meter installation - Meter replacement - Meter maintenance Costs for meter data services, which apply to meter types 4-7 should be reported in the meter associated works category
CACP4.2BOP13 4.2 Metering TABLE 4.2.2 - COST METRICS IT infrastructure capex [Volumes]
Actual All data from Business Intelligence reports containing Data form SAP reconciling to amounts reported in the Annual RINs.
N/A For CAPEX we have used BI Capital report for functions codes 205 (IT METERING ASSETS). All amounts in this BI report sourced from SAP are related to type 4 IT system development as part of the AMI program.
N/A This template is compliant to the definitions specified in the CA RIN. Non-network IT & Communications Expenditure Is all non-network expenditure directly attributable to IT and communications assets including replacement, installation, operation, maintenance, licensing, and leasing costs but excluding all costs associated with SCADA and Network Control Expenditure that exist beyond gateway devices (routers, bridges etc.) at corporate offices. IT & Communications Expenditure includes: - costs associated with SCADA and Network Control that exist at the Corporate office side of gateway devices (routers, bridges etc.). For example, this would include cost associated with SCADA master systems/control room and directly related equipment - IT & Communications Expenditure related to management, dispatching and coordination, etc. of network work crews (e.g. phones, radios etc.). - any common costs shared between the SCADA and Network Control Expenditure and IT & Communications
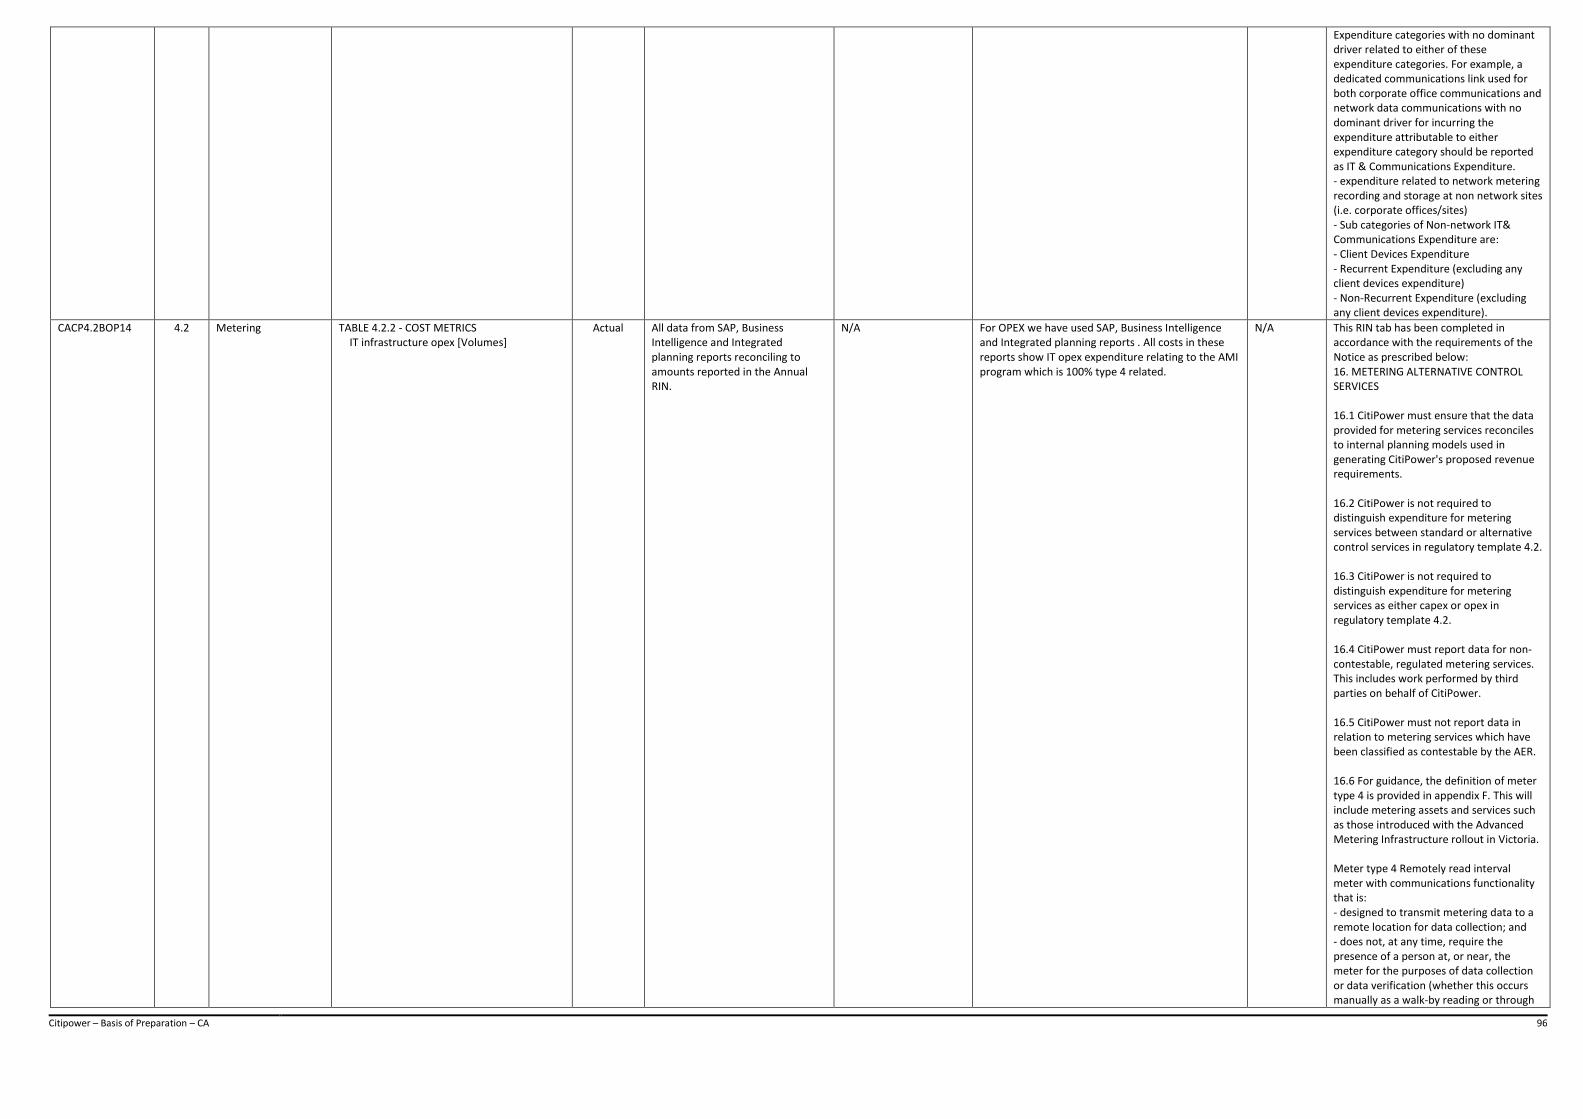
Citipower – Basis of Preparation – CA 96
Expenditure categories with no dominant driver related to either of these expenditure categories. For example, a dedicated communications link used for both corporate office communications and network data communications with no dominant driver for incurring the expenditure attributable to either expenditure category should be reported as IT & Communications Expenditure. - expenditure related to network metering recording and storage at non network sites (i.e. corporate offices/sites) - Sub categories of Non-network IT& Communications Expenditure are: - Client Devices Expenditure - Recurrent Expenditure (excluding any client devices expenditure) - Non-Recurrent Expenditure (excluding any client devices expenditure).
CACP4.2BOP14 4.2 Metering TABLE 4.2.2 - COST METRICS IT infrastructure opex [Volumes]
Actual All data from SAP, Business Intelligence and Integrated planning reports reconciling to amounts reported in the Annual RIN.
N/A For OPEX we have used SAP, Business Intelligence and Integrated planning reports . All costs in these reports show IT opex expenditure relating to the AMI program which is 100% type 4 related.
N/A This RIN tab has been completed in accordance with the requirements of the Notice as prescribed below: 16. METERING ALTERNATIVE CONTROL SERVICES 16.1 CitiPower must ensure that the data provided for metering services reconciles to internal planning models used in generating CitiPower's proposed revenue requirements. 16.2 CitiPower is not required to distinguish expenditure for metering services between standard or alternative control services in regulatory template 4.2. 16.3 CitiPower is not required to distinguish expenditure for metering services as either capex or opex in regulatory template 4.2. 16.4 CitiPower must report data for non-contestable, regulated metering services. This includes work performed by third parties on behalf of CitiPower. 16.5 CitiPower must not report data in relation to metering services which have been classified as contestable by the AER. 16.6 For guidance, the definition of meter type 4 is provided in appendix F. This will include metering assets and services such as those introduced with the Advanced Metering Infrastructure rollout in Victoria. Meter type 4 Remotely read interval meter with communications functionality that is: - designed to transmit metering data to a remote location for data collection; and - does not, at any time, require the presence of a person at, or near, the meter for the purposes of data collection or data verification (whether this occurs manually as a walk-by reading or through
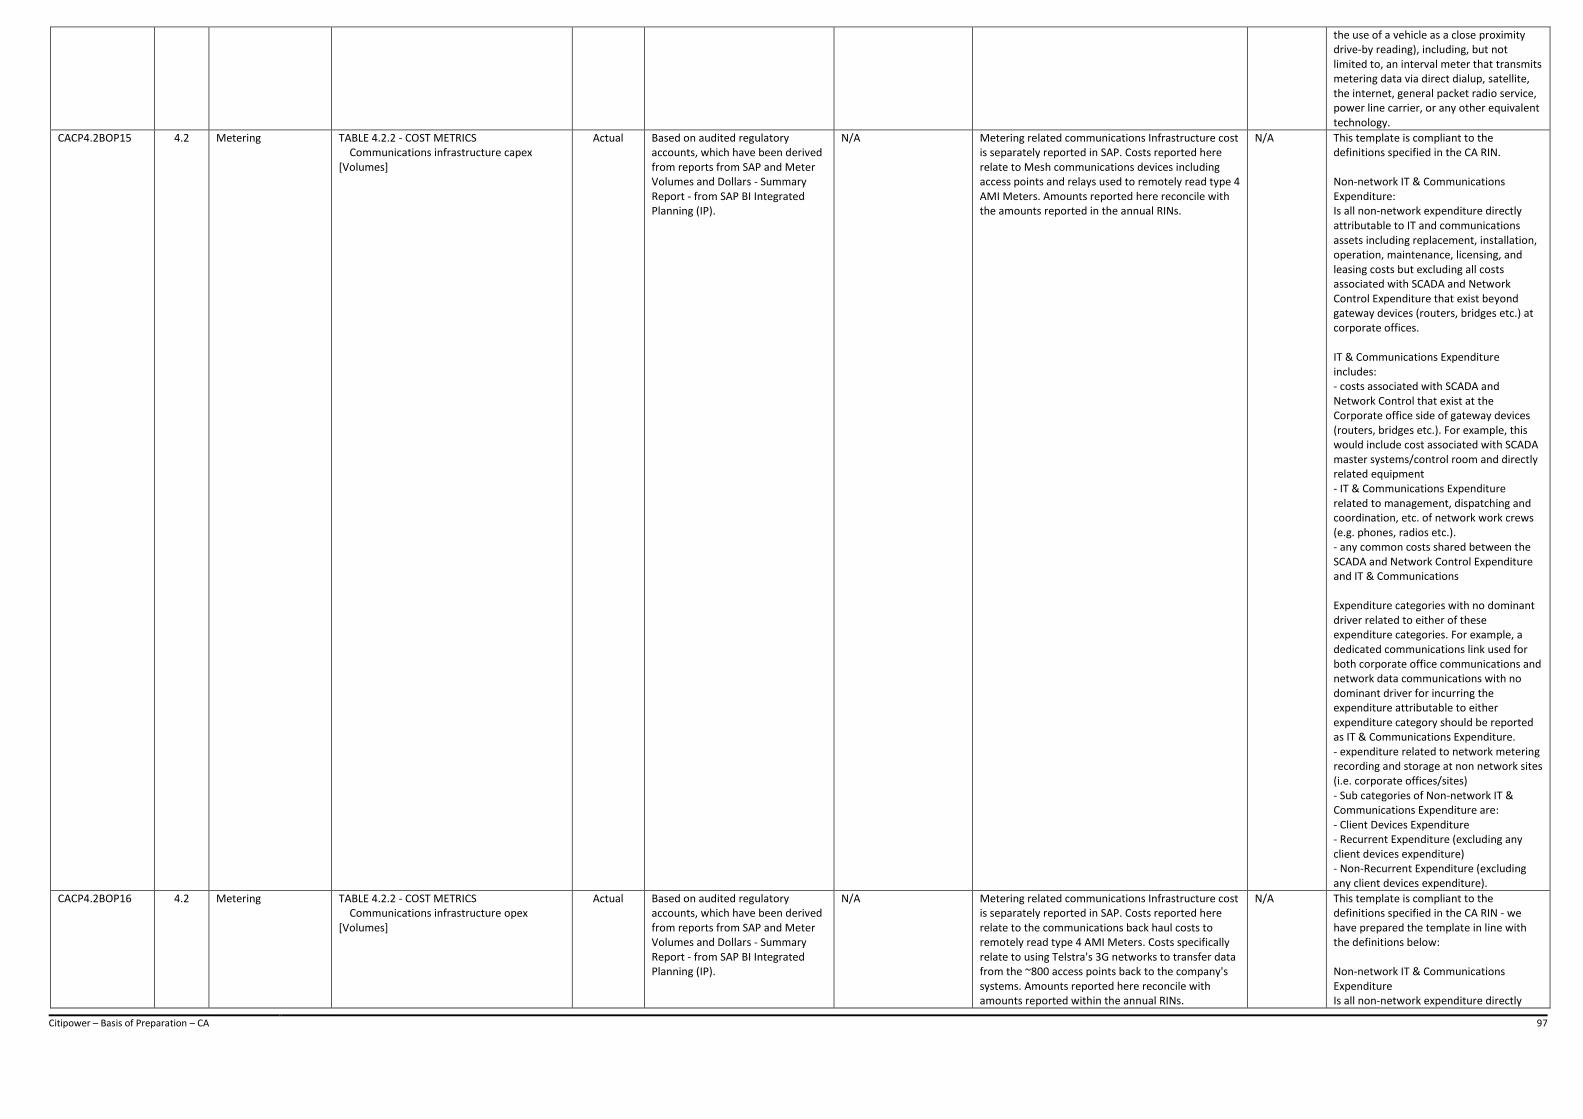
Citipower – Basis of Preparation – CA 97
the use of a vehicle as a close proximity drive-by reading), including, but not limited to, an interval meter that transmits metering data via direct dialup, satellite, the internet, general packet radio service, power line carrier, or any other equivalent technology.
CACP4.2BOP15 4.2 Metering TABLE 4.2.2 - COST METRICS Communications infrastructure capex [Volumes]
Actual Based on audited regulatory accounts, which have been derived from reports from SAP and Meter Volumes and Dollars - Summary Report - from SAP BI Integrated Planning (IP).
N/A Metering related communications Infrastructure cost is separately reported in SAP. Costs reported here relate to Mesh communications devices including access points and relays used to remotely read type 4 AMI Meters. Amounts reported here reconcile with the amounts reported in the annual RINs.
N/A This template is compliant to the definitions specified in the CA RIN. Non-network IT & Communications Expenditure: Is all non-network expenditure directly attributable to IT and communications assets including replacement, installation, operation, maintenance, licensing, and leasing costs but excluding all costs associated with SCADA and Network Control Expenditure that exist beyond gateway devices (routers, bridges etc.) at corporate offices. IT & Communications Expenditure includes: - costs associated with SCADA and Network Control that exist at the Corporate office side of gateway devices (routers, bridges etc.). For example, this would include cost associated with SCADA master systems/control room and directly related equipment - IT & Communications Expenditure related to management, dispatching and coordination, etc. of network work crews (e.g. phones, radios etc.). - any common costs shared between the SCADA and Network Control Expenditure and IT & Communications Expenditure categories with no dominant driver related to either of these expenditure categories. For example, a dedicated communications link used for both corporate office communications and network data communications with no dominant driver for incurring the expenditure attributable to either expenditure category should be reported as IT & Communications Expenditure. - expenditure related to network metering recording and storage at non network sites (i.e. corporate offices/sites) - Sub categories of Non-network IT & Communications Expenditure are: - Client Devices Expenditure - Recurrent Expenditure (excluding any client devices expenditure) - Non-Recurrent Expenditure (excluding any client devices expenditure).
CACP4.2BOP16 4.2 Metering TABLE 4.2.2 - COST METRICS Communications infrastructure opex [Volumes]
Actual Based on audited regulatory accounts, which have been derived from reports from SAP and Meter Volumes and Dollars - Summary Report - from SAP BI Integrated Planning (IP).
N/A Metering related communications Infrastructure cost is separately reported in SAP. Costs reported here relate to the communications back haul costs to remotely read type 4 AMI Meters. Costs specifically relate to using Telstra's 3G networks to transfer data from the ~800 access points back to the company's systems. Amounts reported here reconcile with amounts reported within the annual RINs.
N/A This template is compliant to the definitions specified in the CA RIN - we have prepared the template in line with the definitions below: Non-network IT & Communications Expenditure Is all non-network expenditure directly
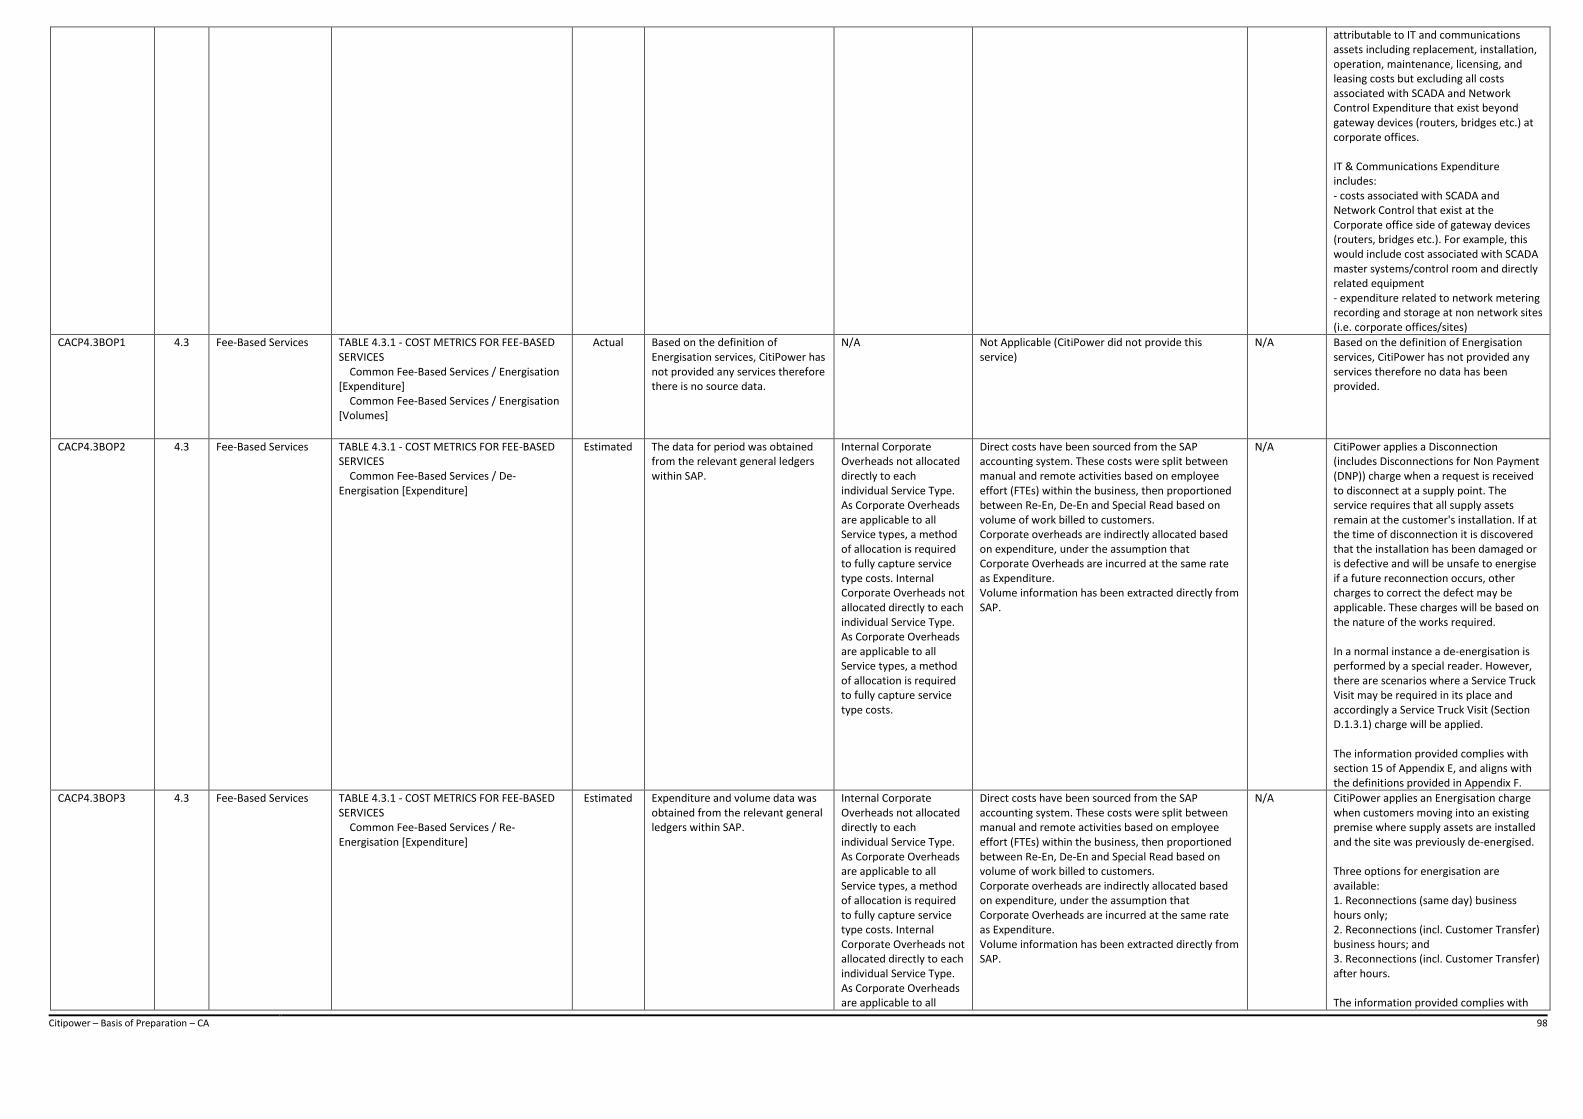
Citipower – Basis of Preparation – CA 98
attributable to IT and communications assets including replacement, installation, operation, maintenance, licensing, and leasing costs but excluding all costs associated with SCADA and Network Control Expenditure that exist beyond gateway devices (routers, bridges etc.) at corporate offices. IT & Communications Expenditure includes: - costs associated with SCADA and Network Control that exist at the Corporate office side of gateway devices (routers, bridges etc.). For example, this would include cost associated with SCADA master systems/control room and directly related equipment - expenditure related to network metering recording and storage at non network sites (i.e. corporate offices/sites)
CACP4.3BOP1 4.3 Fee-Based Services TABLE 4.3.1 - COST METRICS FOR FEE-BASED SERVICES Common Fee-Based Services / Energisation [Expenditure] Common Fee-Based Services / Energisation [Volumes]
Actual Based on the definition of Energisation services, CitiPower has not provided any services therefore there is no source data.
N/A Not Applicable (CitiPower did not provide this service)
N/A Based on the definition of Energisation services, CitiPower has not provided any services therefore no data has been provided.
CACP4.3BOP2 4.3 Fee-Based Services TABLE 4.3.1 - COST METRICS FOR FEE-BASED SERVICES Common Fee-Based Services / De-Energisation [Expenditure]
Estimated The data for period was obtained from the relevant general ledgers within SAP.
Internal Corporate Overheads not allocated directly to each individual Service Type. As Corporate Overheads are applicable to all Service types, a method of allocation is required to fully capture service type costs. Internal Corporate Overheads not allocated directly to each individual Service Type. As Corporate Overheads are applicable to all Service types, a method of allocation is required to fully capture service type costs.
Direct costs have been sourced from the SAP accounting system. These costs were split between manual and remote activities based on employee effort (FTEs) within the business, then proportioned between Re-En, De-En and Special Read based on volume of work billed to customers. Corporate overheads are indirectly allocated based on expenditure, under the assumption that Corporate Overheads are incurred at the same rate as Expenditure. Volume information has been extracted directly from SAP.
N/A CitiPower applies a Disconnection (includes Disconnections for Non Payment (DNP)) charge when a request is received to disconnect at a supply point. The service requires that all supply assets remain at the customer's installation. If at the time of disconnection it is discovered that the installation has been damaged or is defective and will be unsafe to energise if a future reconnection occurs, other charges to correct the defect may be applicable. These charges will be based on the nature of the works required. In a normal instance a de-energisation is performed by a special reader. However, there are scenarios where a Service Truck Visit may be required in its place and accordingly a Service Truck Visit (Section D.1.3.1) charge will be applied. The information provided complies with section 15 of Appendix E, and aligns with the definitions provided in Appendix F.
CACP4.3BOP3 4.3 Fee-Based Services TABLE 4.3.1 - COST METRICS FOR FEE-BASED SERVICES Common Fee-Based Services / Re-Energisation [Expenditure]
Estimated Expenditure and volume data was obtained from the relevant general ledgers within SAP.
Internal Corporate Overheads not allocated directly to each individual Service Type. As Corporate Overheads are applicable to all Service types, a method of allocation is required to fully capture service type costs. Internal Corporate Overheads not allocated directly to each individual Service Type. As Corporate Overheads are applicable to all
Direct costs have been sourced from the SAP accounting system. These costs were split between manual and remote activities based on employee effort (FTEs) within the business, then proportioned between Re-En, De-En and Special Read based on volume of work billed to customers. Corporate overheads are indirectly allocated based on expenditure, under the assumption that Corporate Overheads are incurred at the same rate as Expenditure. Volume information has been extracted directly from SAP.
N/A CitiPower applies an Energisation charge when customers moving into an existing premise where supply assets are installed and the site was previously de-energised. Three options for energisation are available: 1. Reconnections (same day) business hours only; 2. Reconnections (incl. Customer Transfer) business hours; and 3. Reconnections (incl. Customer Transfer) after hours. The information provided complies with
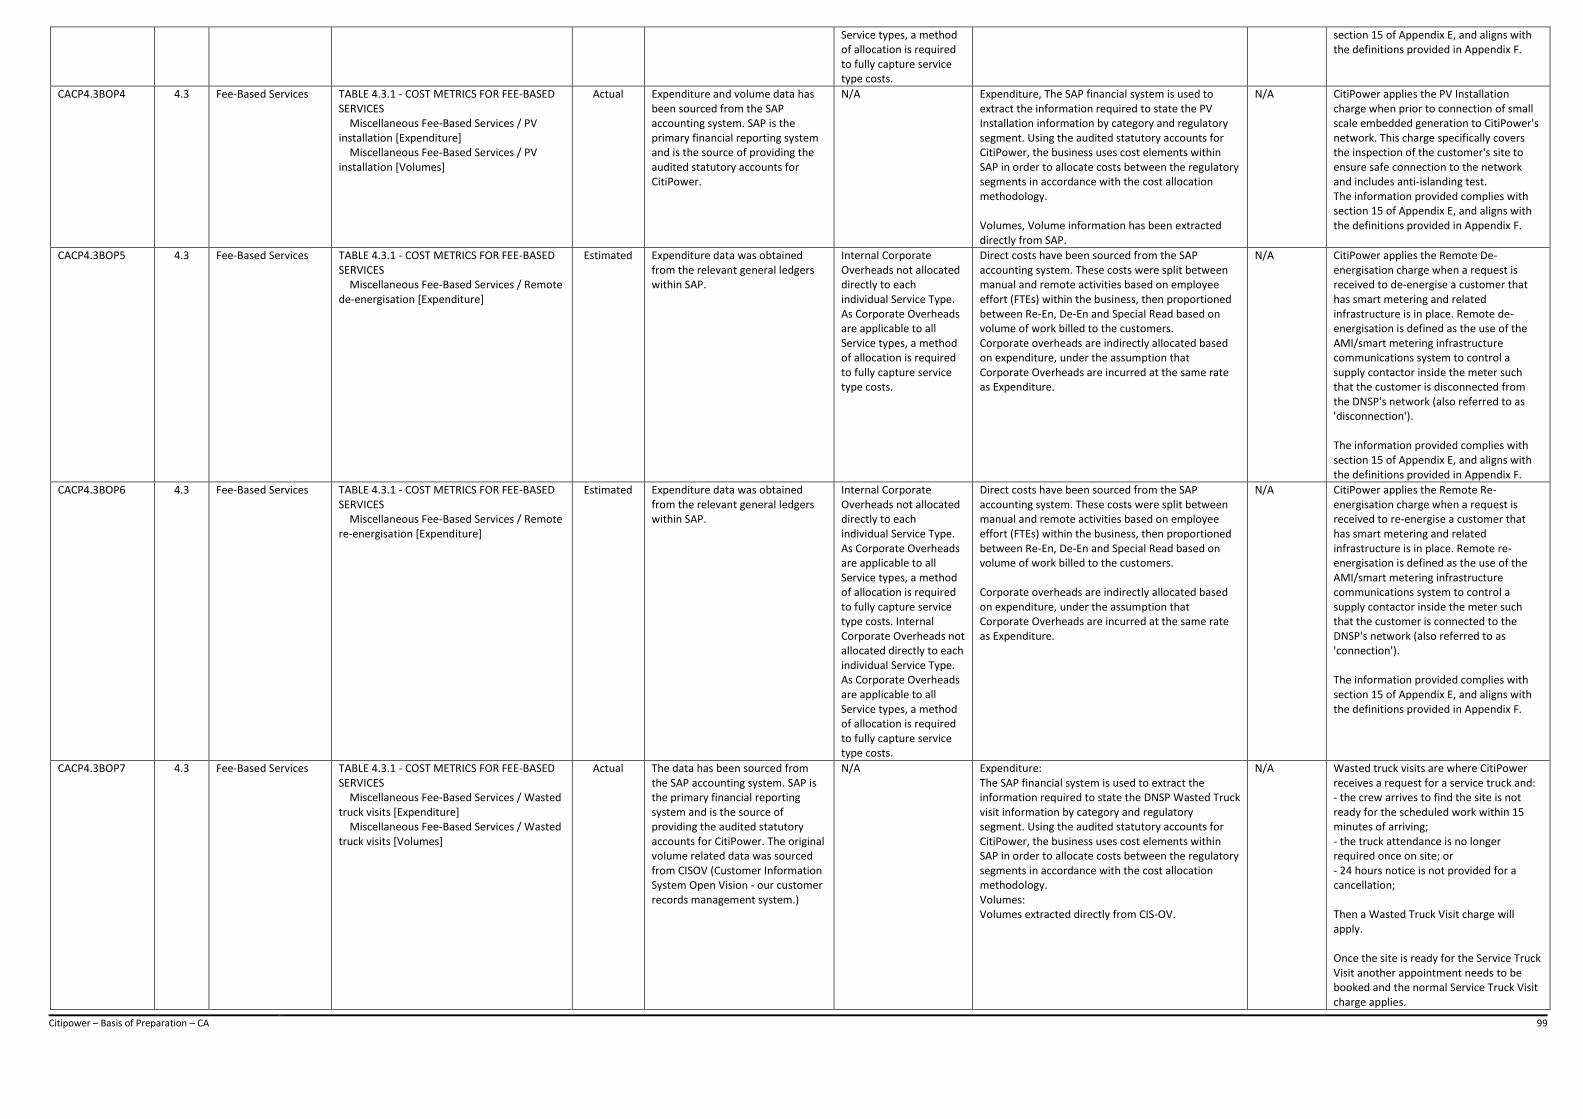
Citipower – Basis of Preparation – CA 99
Service types, a method of allocation is required to fully capture service type costs.
section 15 of Appendix E, and aligns with the definitions provided in Appendix F.
CACP4.3BOP4 4.3 Fee-Based Services TABLE 4.3.1 - COST METRICS FOR FEE-BASED SERVICES Miscellaneous Fee-Based Services / PV installation [Expenditure] Miscellaneous Fee-Based Services / PV installation [Volumes]
Actual Expenditure and volume data has been sourced from the SAP accounting system. SAP is the primary financial reporting system and is the source of providing the audited statutory accounts for CitiPower.
N/A Expenditure, The SAP financial system is used to extract the information required to state the PV Installation information by category and regulatory segment. Using the audited statutory accounts for CitiPower, the business uses cost elements within SAP in order to allocate costs between the regulatory segments in accordance with the cost allocation methodology. Volumes, Volume information has been extracted directly from SAP.
N/A CitiPower applies the PV Installation charge when prior to connection of small scale embedded generation to CitiPower's network. This charge specifically covers the inspection of the customer's site to ensure safe connection to the network and includes anti-islanding test. The information provided complies with section 15 of Appendix E, and aligns with the definitions provided in Appendix F.
CACP4.3BOP5 4.3 Fee-Based Services TABLE 4.3.1 - COST METRICS FOR FEE-BASED SERVICES Miscellaneous Fee-Based Services / Remote de-energisation [Expenditure]
Estimated Expenditure data was obtained from the relevant general ledgers within SAP.
Internal Corporate Overheads not allocated directly to each individual Service Type. As Corporate Overheads are applicable to all Service types, a method of allocation is required to fully capture service type costs.
Direct costs have been sourced from the SAP accounting system. These costs were split between manual and remote activities based on employee effort (FTEs) within the business, then proportioned between Re-En, De-En and Special Read based on volume of work billed to the customers. Corporate overheads are indirectly allocated based on expenditure, under the assumption that Corporate Overheads are incurred at the same rate as Expenditure.
N/A CitiPower applies the Remote De-energisation charge when a request is received to de-energise a customer that has smart metering and related infrastructure is in place. Remote de-energisation is defined as the use of the AMI/smart metering infrastructure communications system to control a supply contactor inside the meter such that the customer is disconnected from the DNSP's network (also referred to as 'disconnection'). The information provided complies with section 15 of Appendix E, and aligns with the definitions provided in Appendix F.
CACP4.3BOP6 4.3 Fee-Based Services TABLE 4.3.1 - COST METRICS FOR FEE-BASED SERVICES Miscellaneous Fee-Based Services / Remote re-energisation [Expenditure]
Estimated Expenditure data was obtained from the relevant general ledgers within SAP.
Internal Corporate Overheads not allocated directly to each individual Service Type. As Corporate Overheads are applicable to all Service types, a method of allocation is required to fully capture service type costs. Internal Corporate Overheads not allocated directly to each individual Service Type. As Corporate Overheads are applicable to all Service types, a method of allocation is required to fully capture service type costs.
Direct costs have been sourced from the SAP accounting system. These costs were split between manual and remote activities based on employee effort (FTEs) within the business, then proportioned between Re-En, De-En and Special Read based on volume of work billed to the customers. Corporate overheads are indirectly allocated based on expenditure, under the assumption that Corporate Overheads are incurred at the same rate as Expenditure.
N/A CitiPower applies the Remote Re-energisation charge when a request is received to re-energise a customer that has smart metering and related infrastructure is in place. Remote re-energisation is defined as the use of the AMI/smart metering infrastructure communications system to control a supply contactor inside the meter such that the customer is connected to the DNSP's network (also referred to as 'connection'). The information provided complies with section 15 of Appendix E, and aligns with the definitions provided in Appendix F.
CACP4.3BOP7 4.3 Fee-Based Services TABLE 4.3.1 - COST METRICS FOR FEE-BASED SERVICES Miscellaneous Fee-Based Services / Wasted truck visits [Expenditure] Miscellaneous Fee-Based Services / Wasted truck visits [Volumes]
Actual The data has been sourced from the SAP accounting system. SAP is the primary financial reporting system and is the source of providing the audited statutory accounts for CitiPower. The original volume related data was sourced from CISOV (Customer Information System Open Vision - our customer records management system.)
N/A Expenditure: The SAP financial system is used to extract the information required to state the DNSP Wasted Truck visit information by category and regulatory segment. Using the audited statutory accounts for CitiPower, the business uses cost elements within SAP in order to allocate costs between the regulatory segments in accordance with the cost allocation methodology. Volumes: Volumes extracted directly from CIS-OV.
N/A Wasted truck visits are where CitiPower receives a request for a service truck and: - the crew arrives to find the site is not ready for the scheduled work within 15 minutes of arriving; - the truck attendance is no longer required once on site; or - 24 hours notice is not provided for a cancellation; Then a Wasted Truck Visit charge will apply. Once the site is ready for the Service Truck Visit another appointment needs to be booked and the normal Service Truck Visit charge applies.
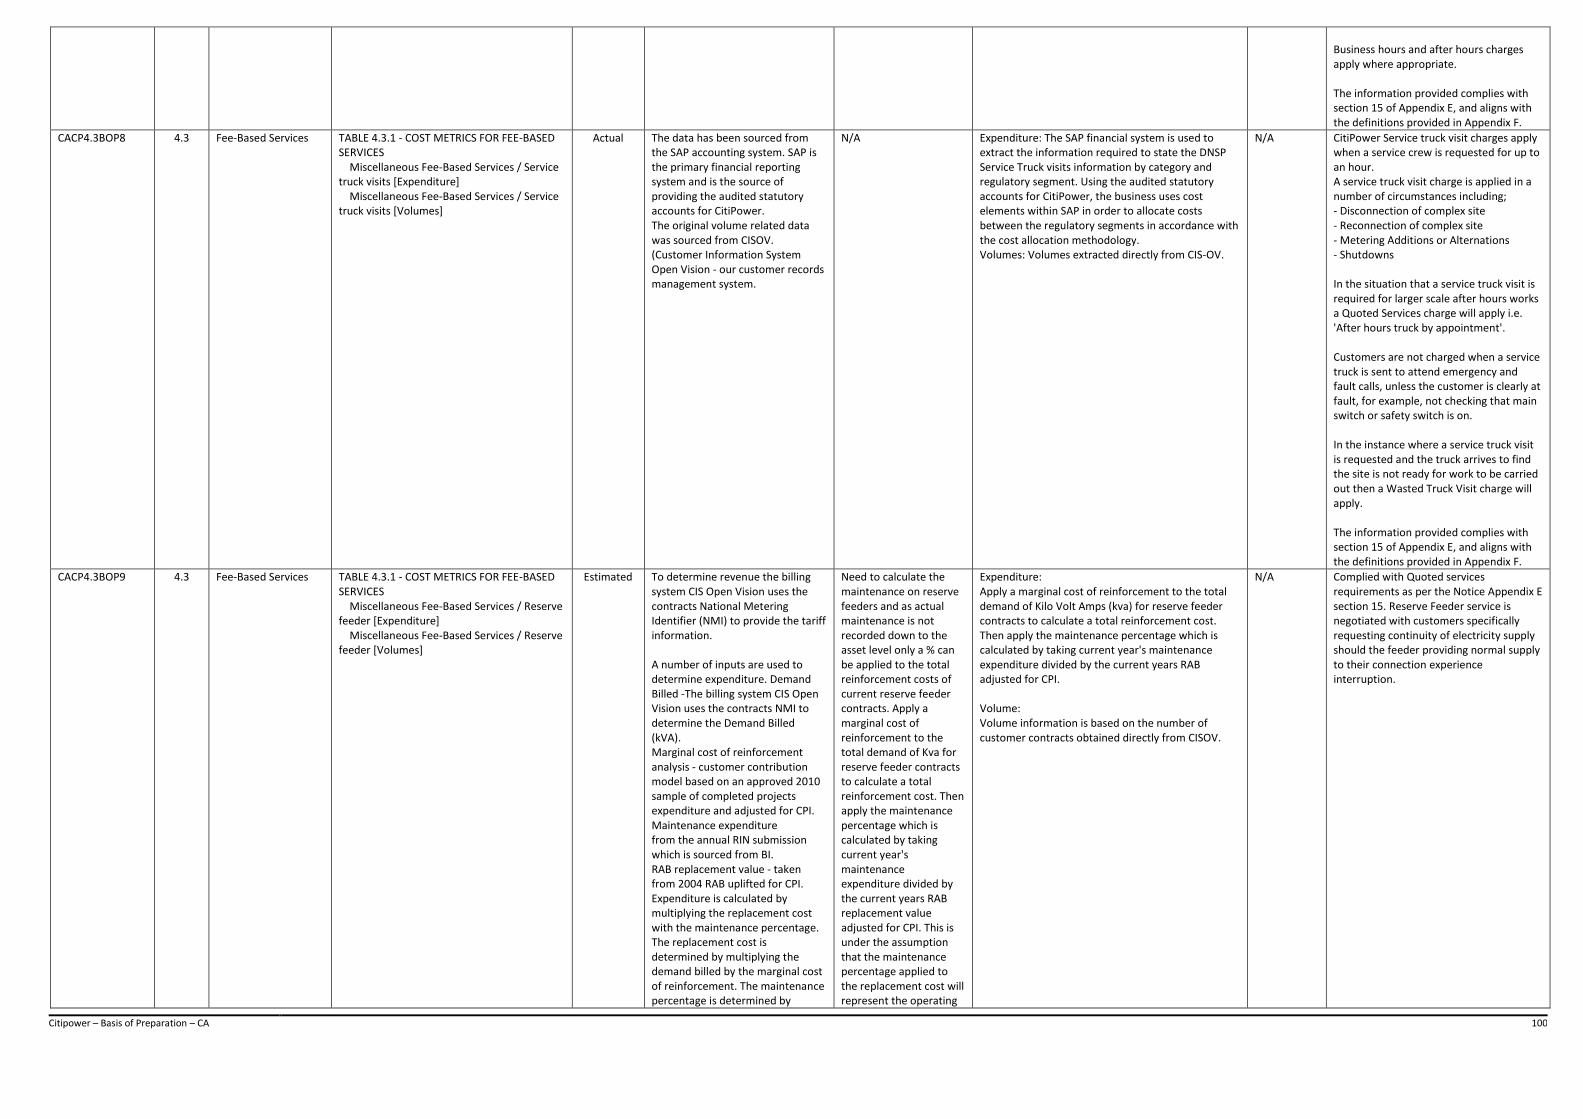
Citipower – Basis of Preparation – CA 100
Business hours and after hours charges apply where appropriate. The information provided complies with section 15 of Appendix E, and aligns with the definitions provided in Appendix F.
CACP4.3BOP8 4.3 Fee-Based Services TABLE 4.3.1 - COST METRICS FOR FEE-BASED SERVICES Miscellaneous Fee-Based Services / Service truck visits [Expenditure] Miscellaneous Fee-Based Services / Service truck visits [Volumes]
Actual The data has been sourced from the SAP accounting system. SAP is the primary financial reporting system and is the source of providing the audited statutory accounts for CitiPower. The original volume related data was sourced from CISOV. (Customer Information System Open Vision - our customer records management system.
N/A Expenditure: The SAP financial system is used to extract the information required to state the DNSP Service Truck visits information by category and regulatory segment. Using the audited statutory accounts for CitiPower, the business uses cost elements within SAP in order to allocate costs between the regulatory segments in accordance with the cost allocation methodology. Volumes: Volumes extracted directly from CIS-OV.
N/A CitiPower Service truck visit charges apply when a service crew is requested for up to an hour. A service truck visit charge is applied in a number of circumstances including; - Disconnection of complex site - Reconnection of complex site - Metering Additions or Alternations - Shutdowns In the situation that a service truck visit is required for larger scale after hours works a Quoted Services charge will apply i.e. 'After hours truck by appointment'. Customers are not charged when a service truck is sent to attend emergency and fault calls, unless the customer is clearly at fault, for example, not checking that main switch or safety switch is on. In the instance where a service truck visit is requested and the truck arrives to find the site is not ready for work to be carried out then a Wasted Truck Visit charge will apply. The information provided complies with section 15 of Appendix E, and aligns with the definitions provided in Appendix F.
CACP4.3BOP9 4.3 Fee-Based Services TABLE 4.3.1 - COST METRICS FOR FEE-BASED SERVICES Miscellaneous Fee-Based Services / Reserve feeder [Expenditure] Miscellaneous Fee-Based Services / Reserve feeder [Volumes]
Estimated To determine revenue the billing system CIS Open Vision uses the contracts National Metering Identifier (NMI) to provide the tariff information. A number of inputs are used to determine expenditure. Demand Billed -The billing system CIS Open Vision uses the contracts NMI to determine the Demand Billed (kVA). Marginal cost of reinforcement analysis - customer contribution model based on an approved 2010 sample of completed projects expenditure and adjusted for CPI. Maintenance expenditure from the annual RIN submission which is sourced from BI. RAB replacement value - taken from 2004 RAB uplifted for CPI. Expenditure is calculated by multiplying the replacement cost with the maintenance percentage. The replacement cost is determined by multiplying the demand billed by the marginal cost of reinforcement. The maintenance percentage is determined by
Need to calculate the maintenance on reserve feeders and as actual maintenance is not recorded down to the asset level only a % can be applied to the total reinforcement costs of current reserve feeder contracts. Apply a marginal cost of reinforcement to the total demand of Kva for reserve feeder contracts to calculate a total reinforcement cost. Then apply the maintenance percentage which is calculated by taking current year's maintenance expenditure divided by the current years RAB replacement value adjusted for CPI. This is under the assumption that the maintenance percentage applied to the replacement cost will represent the operating
Expenditure: Apply a marginal cost of reinforcement to the total demand of Kilo Volt Amps (kva) for reserve feeder contracts to calculate a total reinforcement cost. Then apply the maintenance percentage which is calculated by taking current year's maintenance expenditure divided by the current years RAB adjusted for CPI. Volume: Volume information is based on the number of customer contracts obtained directly from CISOV.
N/A Complied with Quoted services requirements as per the Notice Appendix E section 15. Reserve Feeder service is negotiated with customers specifically requesting continuity of electricity supply should the feeder providing normal supply to their connection experience interruption.

Citipower – Basis of Preparation – CA 101
calculating the maintenance expenditure as a percentage of the total RAB replacement value.
and maintenance expenditure for reserve feeder.
CACP4.3BOP10 4.3 Fee-Based Services TABLE 4.3.1 - COST METRICS FOR FEE-BASED SERVICES Common Fee-Based Services / De-Energisation [Volumes]
Actual Volume data was obtained from the relevant general ledgers within SAP.
N/A Volume information has been extracted directly from SAP.
N/A N/A
CACP4.3BOP11 4.3 Fee-Based Services TABLE 4.3.1 - COST METRICS FOR FEE-BASED SERVICES Common Fee-Based Services / Re-Energisation [Volumes]
Actual Volume data was obtained from the relevant general ledgers within SAP.
N/A Volume information has been extracted directly from SAP.
N/A N/A
CACP4.3BOP12 4.3 Fee-Based Services TABLE 4.3.1 - COST METRICS FOR FEE-BASED SERVICES Miscellaneous Fee-Based Services / Remote de-energisation [Volumes]
Actual Volume data was obtained from the relevant general ledgers within SAP.
N/A Volume information has been extracted directly from SAP.
N/A CitiPower applies the Remote De-energisation charge when a request is received to de-energise a customer that has smart metering and related infrastructure is in place. Remote de-energisation is defined as the use of the AMI/smart metering infrastructure communications system to control a supply contactor inside the meter such that the customer is disconnected from the DNSP's network (also referred to as 'disconnection'). The information provided complies with section 15 of Appendix E, and aligns with the definitions provided in Appendix F.
CACP4.3BOP13 4.3 Fee-Based Services TABLE 4.3.1 - COST METRICS FOR FEE-BASED SERVICES Miscellaneous Fee-Based Services / Remote re-energisation [Volumes]
Actual Volume data was obtained from the relevant general ledgers within SAP.
N/A Volume information has been extracted directly from SAP.
N/A CitiPower applies the Remote Re-energisation charge when a request is received to re-energise a customer that has smart metering and related infrastructure is in place. Remote re-energisation is defined as the use of the AMI/smart metering infrastructure communications system to control a supply contactor inside the meter such that the customer is connected to the DNSP's network (also referred to as 'connection'). The information provided complies with section 15 of Appendix E, and aligns with the definitions provided in Appendix F.
CACP4.4BOP1 4.4 Quoted Services TABLE 4.4.1 - COST METRICS FOR QUOTED SERVICES Recoverable Works - Connections [Expenditure]
Actual Source expenditure was from the Regulatory RIN. The source average unit price was from SAP Business Intelligence report for Customer Projects. The volume was estimated from the combination of the total expenditure and unit price.
N/A 1. Recoverable works (asset relocations) is the work completed by CitiPower following a customer request to alter or rearrange the distribution assets. This work is not normally part of a supply project where an electricity supply is made available to a customer. 2. CitiPower function codes 116 relates to customer requests for recoverable works including asset relocations. 3. The Regulatory RIN report was used for the direct expenditure for function code 116. 4. The SAP CPM BI report provided average direct costs of completed projects within function code 116. Note this does not include capture of all projects so is a sample only. Percentage capture was of the total reported regulation RIN was considered to be a fair indication of the average cost per project. 5. The average unit cost from the SAP CPM Business Intelligence report have been used to calculate the number of physicals required to align with the regulation RIN expenditure.
N/A 15.1 Not applicable to CitiPower as per AER advice 15.2 Not applicable. Recoverable Works was standard control under G14 15.3 Complies 15.4 Complies 15.5 Complies - Recoverable works was capex under G14
CACP4.4BOP2 4.4 Quoted Services TABLE 4.4.1 - COST METRICS FOR QUOTED Actual Expenditure - customer orders N/A Expenditure is based on actual data sourced from N/A Complied with Quoted services
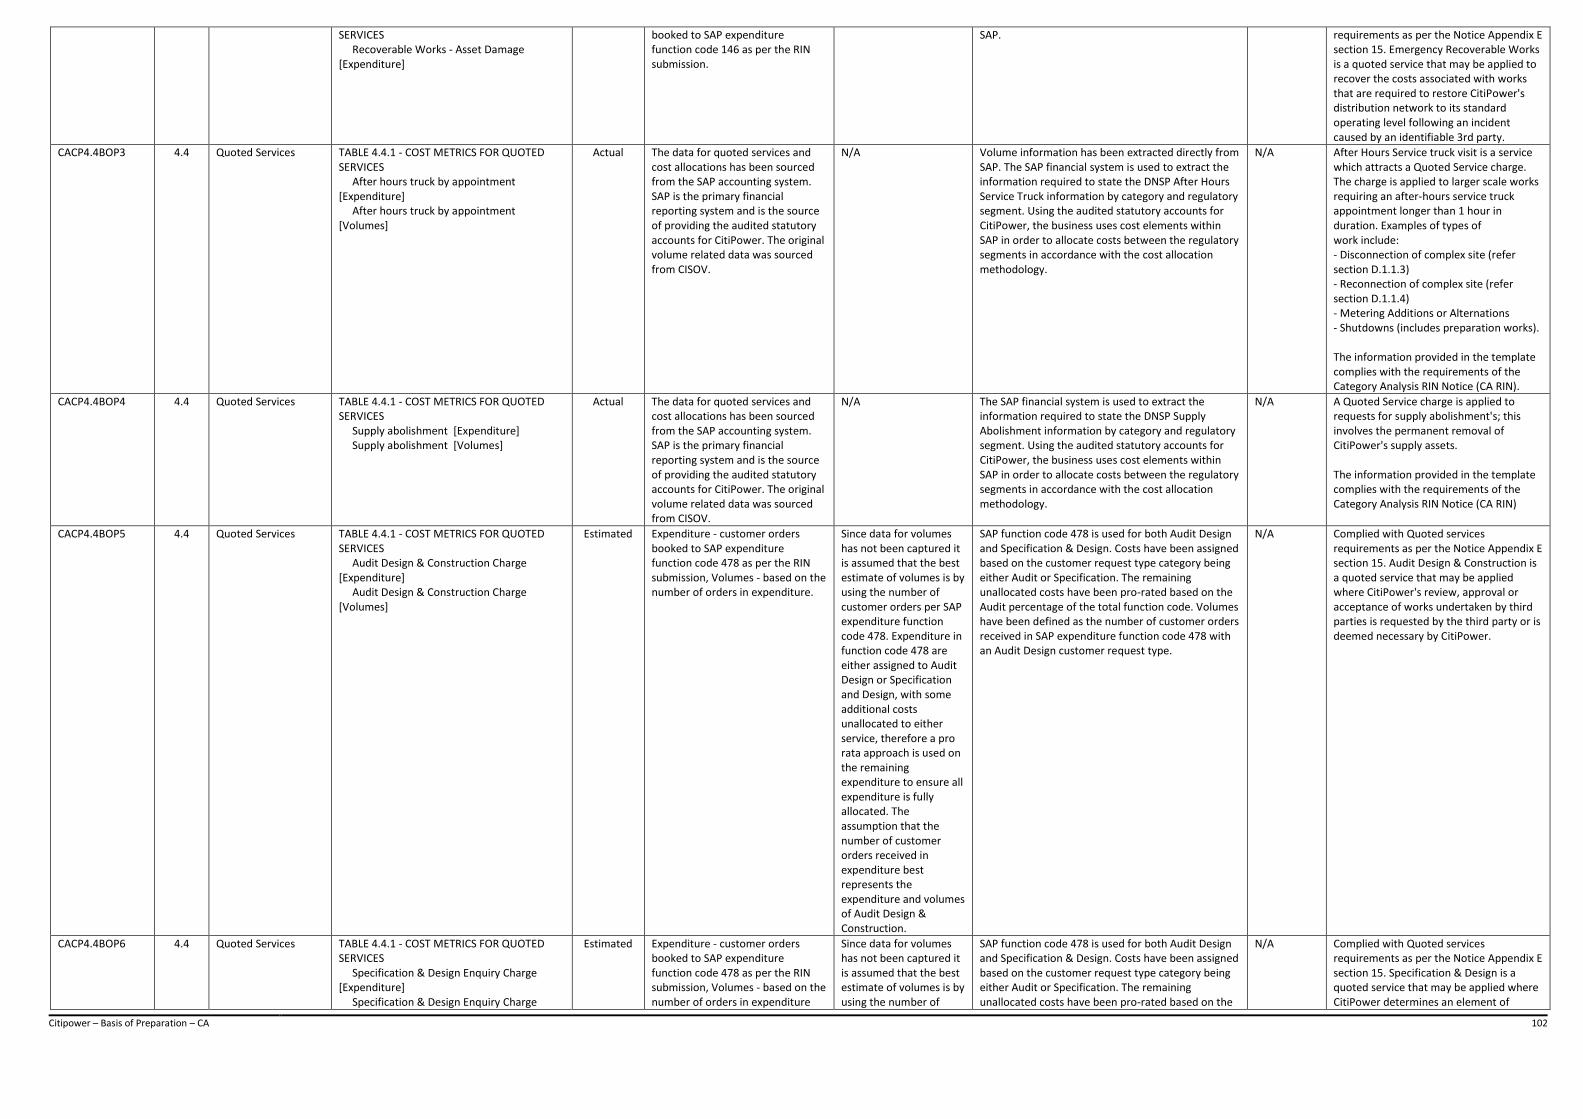
Citipower – Basis of Preparation – CA 102
SERVICES Recoverable Works - Asset Damage [Expenditure]
booked to SAP expenditure function code 146 as per the RIN submission.
SAP. requirements as per the Notice Appendix E section 15. Emergency Recoverable Works is a quoted service that may be applied to recover the costs associated with works that are required to restore CitiPower's distribution network to its standard operating level following an incident caused by an identifiable 3rd party.
CACP4.4BOP3 4.4 Quoted Services TABLE 4.4.1 - COST METRICS FOR QUOTED SERVICES After hours truck by appointment [Expenditure] After hours truck by appointment [Volumes]
Actual The data for quoted services and cost allocations has been sourced from the SAP accounting system. SAP is the primary financial reporting system and is the source of providing the audited statutory accounts for CitiPower. The original volume related data was sourced from CISOV.
N/A Volume information has been extracted directly from SAP. The SAP financial system is used to extract the information required to state the DNSP After Hours Service Truck information by category and regulatory segment. Using the audited statutory accounts for CitiPower, the business uses cost elements within SAP in order to allocate costs between the regulatory segments in accordance with the cost allocation methodology.
N/A After Hours Service truck visit is a service which attracts a Quoted Service charge. The charge is applied to larger scale works requiring an after-hours service truck appointment longer than 1 hour in duration. Examples of types of work include: - Disconnection of complex site (refer section D.1.1.3) - Reconnection of complex site (refer section D.1.1.4) - Metering Additions or Alternations - Shutdowns (includes preparation works). The information provided in the template complies with the requirements of the Category Analysis RIN Notice (CA RIN).
CACP4.4BOP4 4.4 Quoted Services TABLE 4.4.1 - COST METRICS FOR QUOTED SERVICES Supply abolishment [Expenditure] Supply abolishment [Volumes]
Actual The data for quoted services and cost allocations has been sourced from the SAP accounting system. SAP is the primary financial reporting system and is the source of providing the audited statutory accounts for CitiPower. The original volume related data was sourced from CISOV.
N/A The SAP financial system is used to extract the information required to state the DNSP Supply Abolishment information by category and regulatory segment. Using the audited statutory accounts for CitiPower, the business uses cost elements within SAP in order to allocate costs between the regulatory segments in accordance with the cost allocation methodology.
N/A A Quoted Service charge is applied to requests for supply abolishment's; this involves the permanent removal of CitiPower's supply assets. The information provided in the template complies with the requirements of the Category Analysis RIN Notice (CA RIN)
CACP4.4BOP5 4.4 Quoted Services TABLE 4.4.1 - COST METRICS FOR QUOTED SERVICES Audit Design & Construction Charge [Expenditure] Audit Design & Construction Charge [Volumes]
Estimated Expenditure - customer orders booked to SAP expenditure function code 478 as per the RIN submission, Volumes - based on the number of orders in expenditure.
Since data for volumes has not been captured it is assumed that the best estimate of volumes is by using the number of customer orders per SAP expenditure function code 478. Expenditure in function code 478 are either assigned to Audit Design or Specification and Design, with some additional costs unallocated to either service, therefore a pro rata approach is used on the remaining expenditure to ensure all expenditure is fully allocated. The assumption that the number of customer orders received in expenditure best represents the expenditure and volumes of Audit Design & Construction.
SAP function code 478 is used for both Audit Design and Specification & Design. Costs have been assigned based on the customer request type category being either Audit or Specification. The remaining unallocated costs have been pro-rated based on the Audit percentage of the total function code. Volumes have been defined as the number of customer orders received in SAP expenditure function code 478 with an Audit Design customer request type.
N/A Complied with Quoted services requirements as per the Notice Appendix E section 15. Audit Design & Construction is a quoted service that may be applied where CitiPower's review, approval or acceptance of works undertaken by third parties is requested by the third party or is deemed necessary by CitiPower.
CACP4.4BOP6 4.4 Quoted Services TABLE 4.4.1 - COST METRICS FOR QUOTED SERVICES Specification & Design Enquiry Charge [Expenditure] Specification & Design Enquiry Charge
Estimated Expenditure - customer orders booked to SAP expenditure function code 478 as per the RIN submission, Volumes - based on the number of orders in expenditure
Since data for volumes has not been captured it is assumed that the best estimate of volumes is by using the number of
SAP function code 478 is used for both Audit Design and Specification & Design. Costs have been assigned based on the customer request type category being either Audit or Specification. The remaining unallocated costs have been pro-rated based on the
N/A Complied with Quoted services requirements as per the Notice Appendix E section 15. Specification & Design is a quoted service that may be applied where CitiPower determines an element of
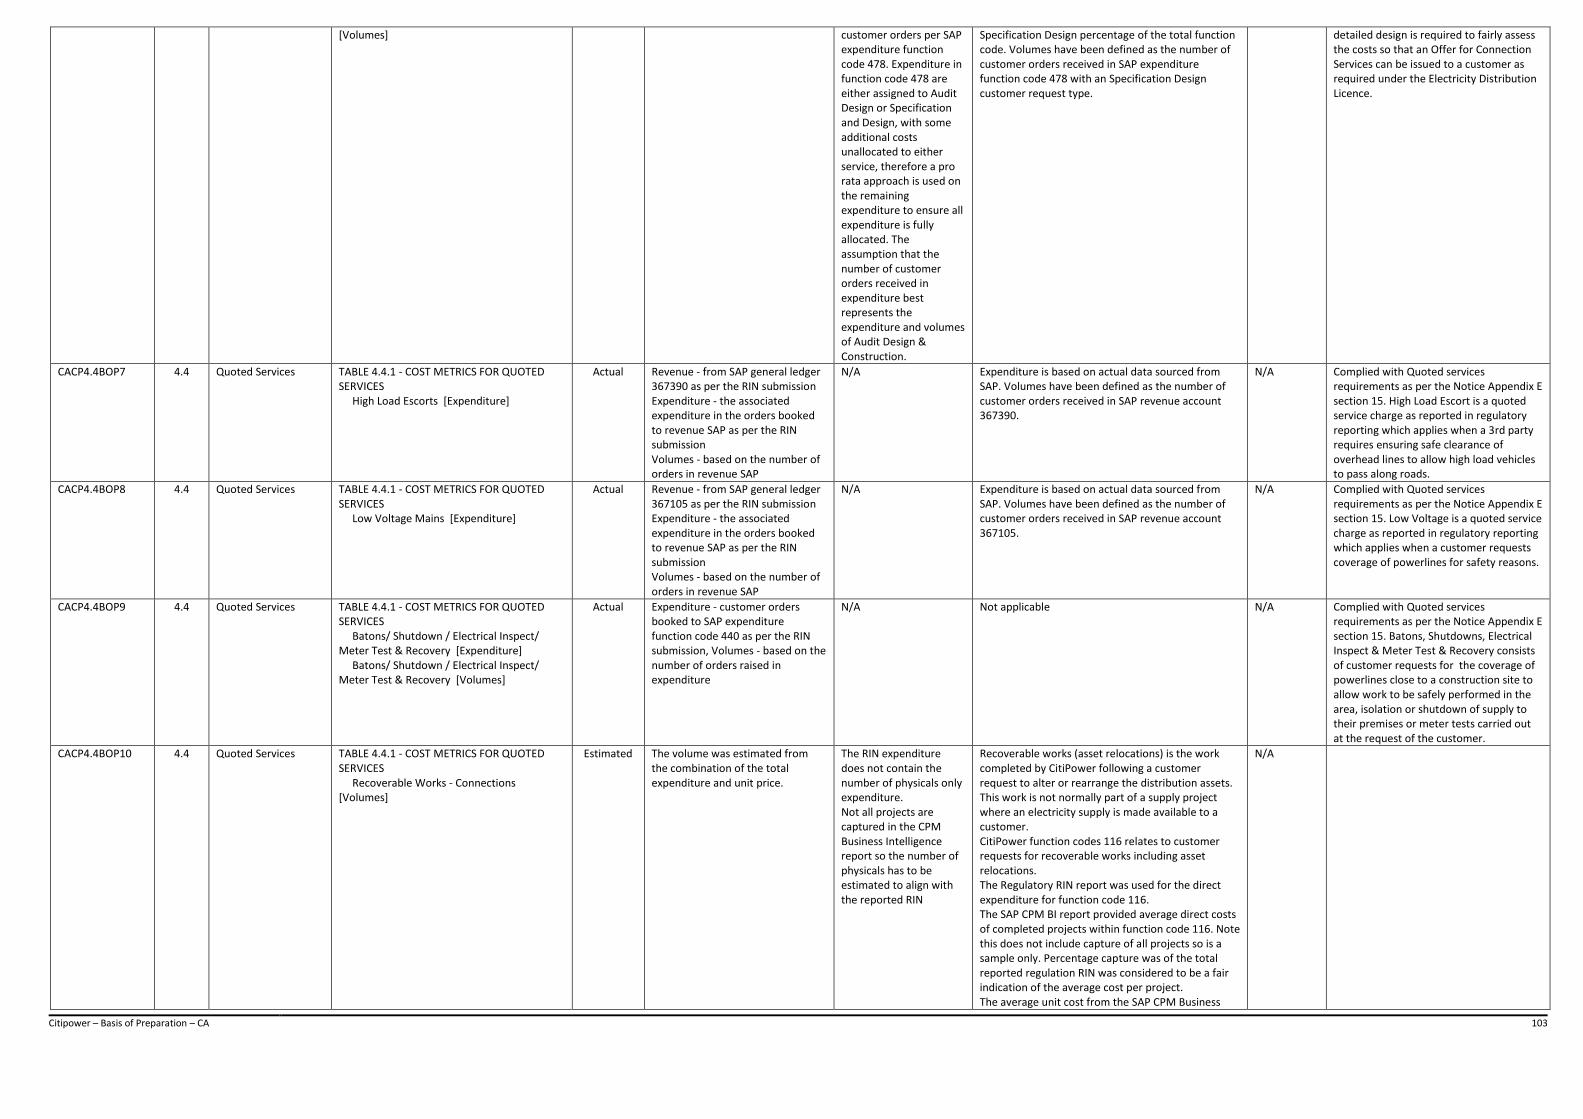
Citipower – Basis of Preparation – CA 103
[Volumes] customer orders per SAP expenditure function code 478. Expenditure in function code 478 are either assigned to Audit Design or Specification and Design, with some additional costs unallocated to either service, therefore a pro rata approach is used on the remaining expenditure to ensure all expenditure is fully allocated. The assumption that the number of customer orders received in expenditure best represents the expenditure and volumes of Audit Design & Construction.
Specification Design percentage of the total function code. Volumes have been defined as the number of customer orders received in SAP expenditure function code 478 with an Specification Design customer request type.
detailed design is required to fairly assess the costs so that an Offer for Connection Services can be issued to a customer as required under the Electricity Distribution Licence.
CACP4.4BOP7 4.4 Quoted Services TABLE 4.4.1 - COST METRICS FOR QUOTED SERVICES High Load Escorts [Expenditure]
Actual Revenue - from SAP general ledger 367390 as per the RIN submission Expenditure - the associated expenditure in the orders booked to revenue SAP as per the RIN submission Volumes - based on the number of orders in revenue SAP
N/A Expenditure is based on actual data sourced from SAP. Volumes have been defined as the number of customer orders received in SAP revenue account 367390.
N/A Complied with Quoted services requirements as per the Notice Appendix E section 15. High Load Escort is a quoted service charge as reported in regulatory reporting which applies when a 3rd party requires ensuring safe clearance of overhead lines to allow high load vehicles to pass along roads.
CACP4.4BOP8 4.4 Quoted Services TABLE 4.4.1 - COST METRICS FOR QUOTED SERVICES Low Voltage Mains [Expenditure]
Actual Revenue - from SAP general ledger 367105 as per the RIN submission Expenditure - the associated expenditure in the orders booked to revenue SAP as per the RIN submission Volumes - based on the number of orders in revenue SAP
N/A Expenditure is based on actual data sourced from SAP. Volumes have been defined as the number of customer orders received in SAP revenue account 367105.
N/A Complied with Quoted services requirements as per the Notice Appendix E section 15. Low Voltage is a quoted service charge as reported in regulatory reporting which applies when a customer requests coverage of powerlines for safety reasons.
CACP4.4BOP9 4.4 Quoted Services TABLE 4.4.1 - COST METRICS FOR QUOTED SERVICES Batons/ Shutdown / Electrical Inspect/ Meter Test & Recovery [Expenditure] Batons/ Shutdown / Electrical Inspect/ Meter Test & Recovery [Volumes]
Actual Expenditure - customer orders booked to SAP expenditure function code 440 as per the RIN submission, Volumes - based on the number of orders raised in expenditure
N/A Not applicable N/A Complied with Quoted services requirements as per the Notice Appendix E section 15. Batons, Shutdowns, Electrical Inspect & Meter Test & Recovery consists of customer requests for the coverage of powerlines close to a construction site to allow work to be safely performed in the area, isolation or shutdown of supply to their premises or meter tests carried out at the request of the customer.
CACP4.4BOP10 4.4 Quoted Services TABLE 4.4.1 - COST METRICS FOR QUOTED SERVICES Recoverable Works - Connections [Volumes]
Estimated The volume was estimated from the combination of the total expenditure and unit price.
The RIN expenditure does not contain the number of physicals only expenditure. Not all projects are captured in the CPM Business Intelligence report so the number of physicals has to be estimated to align with the reported RIN
Recoverable works (asset relocations) is the work completed by CitiPower following a customer request to alter or rearrange the distribution assets. This work is not normally part of a supply project where an electricity supply is made available to a customer. CitiPower function codes 116 relates to customer requests for recoverable works including asset relocations. The Regulatory RIN report was used for the direct expenditure for function code 116. The SAP CPM BI report provided average direct costs of completed projects within function code 116. Note this does not include capture of all projects so is a sample only. Percentage capture was of the total reported regulation RIN was considered to be a fair indication of the average cost per project. The average unit cost from the SAP CPM Business
N/A
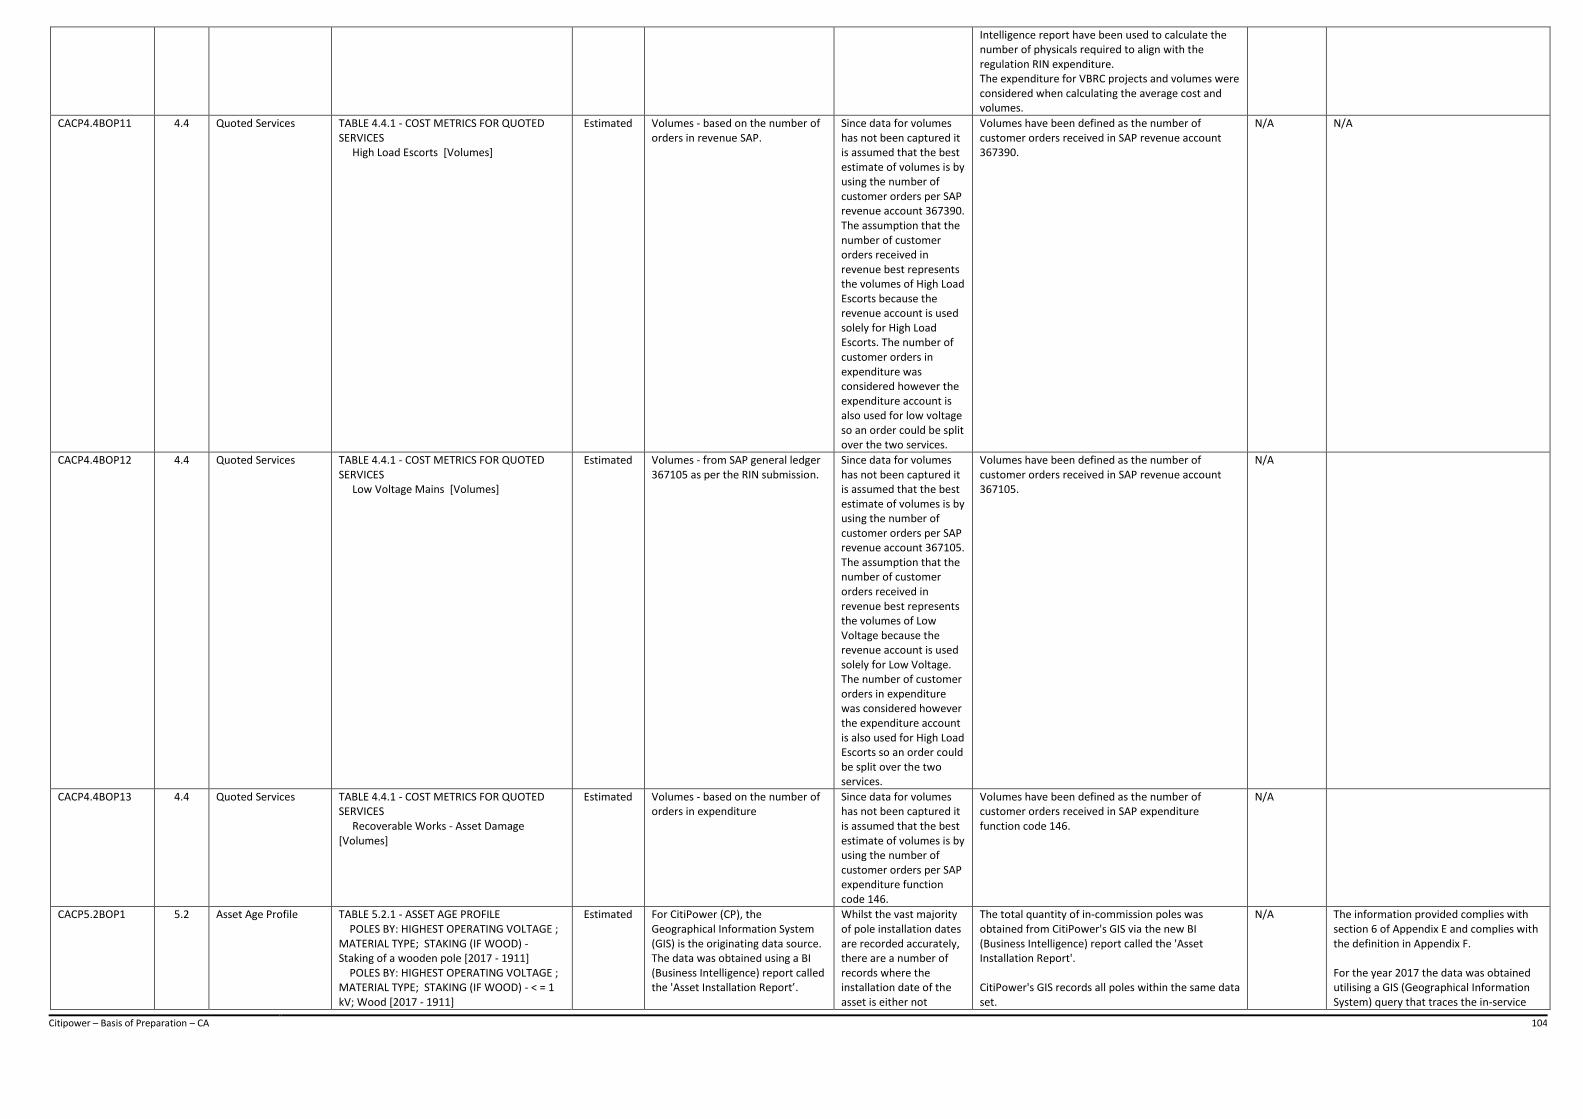
Citipower – Basis of Preparation – CA 104
Intelligence report have been used to calculate the number of physicals required to align with the regulation RIN expenditure. The expenditure for VBRC projects and volumes were considered when calculating the average cost and volumes.
CACP4.4BOP11 4.4 Quoted Services TABLE 4.4.1 - COST METRICS FOR QUOTED SERVICES High Load Escorts [Volumes]
Estimated Volumes - based on the number of orders in revenue SAP.
Since data for volumes has not been captured it is assumed that the best estimate of volumes is by using the number of customer orders per SAP revenue account 367390. The assumption that the number of customer orders received in revenue best represents the volumes of High Load Escorts because the revenue account is used solely for High Load Escorts. The number of customer orders in expenditure was considered however the expenditure account is also used for low voltage so an order could be split over the two services.
Volumes have been defined as the number of customer orders received in SAP revenue account 367390.
N/A N/A
CACP4.4BOP12 4.4 Quoted Services TABLE 4.4.1 - COST METRICS FOR QUOTED SERVICES Low Voltage Mains [Volumes]
Estimated Volumes - from SAP general ledger 367105 as per the RIN submission.
Since data for volumes has not been captured it is assumed that the best estimate of volumes is by using the number of customer orders per SAP revenue account 367105. The assumption that the number of customer orders received in revenue best represents the volumes of Low Voltage because the revenue account is used solely for Low Voltage. The number of customer orders in expenditure was considered however the expenditure account is also used for High Load Escorts so an order could be split over the two services.
Volumes have been defined as the number of customer orders received in SAP revenue account 367105.
N/A
CACP4.4BOP13 4.4 Quoted Services TABLE 4.4.1 - COST METRICS FOR QUOTED SERVICES Recoverable Works - Asset Damage [Volumes]
Estimated Volumes - based on the number of orders in expenditure
Since data for volumes has not been captured it is assumed that the best estimate of volumes is by using the number of customer orders per SAP expenditure function code 146.
Volumes have been defined as the number of customer orders received in SAP expenditure function code 146.
N/A
CACP5.2BOP1 5.2 Asset Age Profile TABLE 5.2.1 - ASSET AGE PROFILE POLES BY: HIGHEST OPERATING VOLTAGE ; MATERIAL TYPE; STAKING (IF WOOD) - Staking of a wooden pole [2017 - 1911] POLES BY: HIGHEST OPERATING VOLTAGE ; MATERIAL TYPE; STAKING (IF WOOD) - < = 1 kV; Wood [2017 - 1911]
Estimated For CitiPower (CP), the Geographical Information System (GIS) is the originating data source. The data was obtained using a BI (Business Intelligence) report called the 'Asset Installation Report’.
Whilst the vast majority of pole installation dates are recorded accurately, there are a number of records where the installation date of the asset is either not
The total quantity of in-commission poles was obtained from CitiPower's GIS via the new BI (Business Intelligence) report called the 'Asset Installation Report'. CitiPower's GIS records all poles within the same data set.
N/A The information provided complies with section 6 of Appendix E and complies with the definition in Appendix F. For the year 2017 the data was obtained utilising a GIS (Geographical Information System) query that traces the in-service
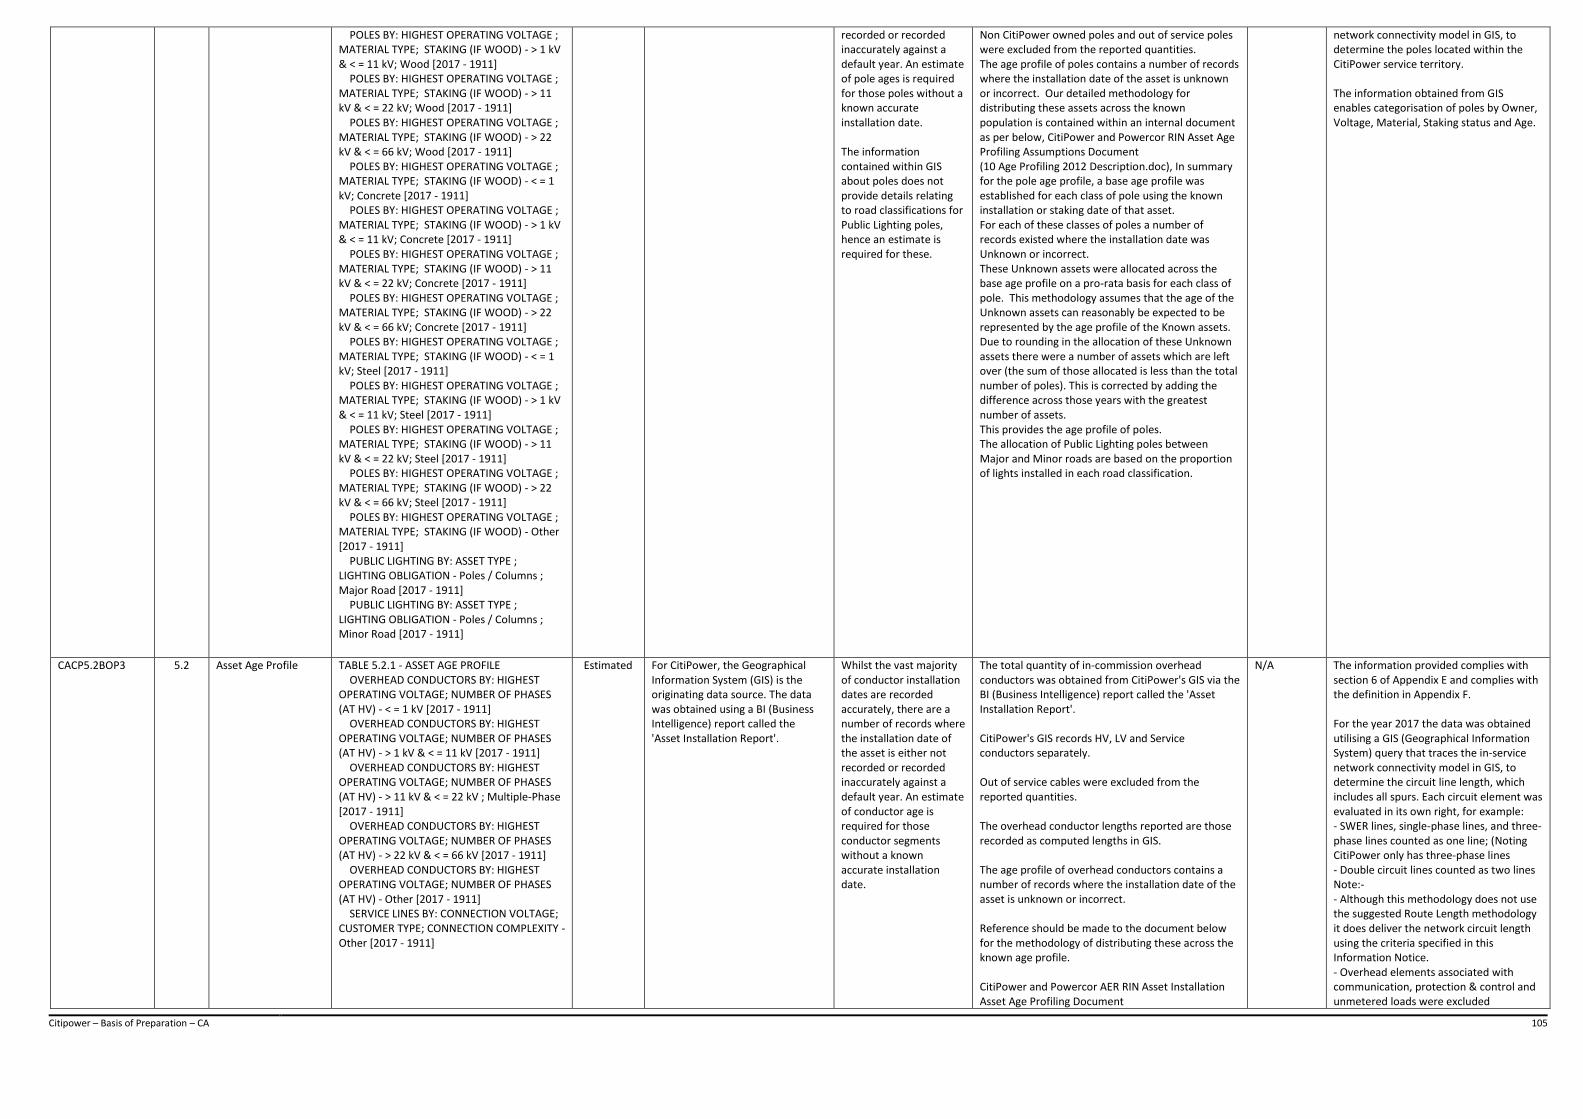
Citipower – Basis of Preparation – CA 105
POLES BY: HIGHEST OPERATING VOLTAGE ; MATERIAL TYPE; STAKING (IF WOOD) - > 1 kV & < = 11 kV; Wood [2017 - 1911] POLES BY: HIGHEST OPERATING VOLTAGE ; MATERIAL TYPE; STAKING (IF WOOD) - > 11 kV & < = 22 kV; Wood [2017 - 1911] POLES BY: HIGHEST OPERATING VOLTAGE ; MATERIAL TYPE; STAKING (IF WOOD) - > 22 kV & < = 66 kV; Wood [2017 - 1911] POLES BY: HIGHEST OPERATING VOLTAGE ; MATERIAL TYPE; STAKING (IF WOOD) - < = 1 kV; Concrete [2017 - 1911] POLES BY: HIGHEST OPERATING VOLTAGE ; MATERIAL TYPE; STAKING (IF WOOD) - > 1 kV & < = 11 kV; Concrete [2017 - 1911] POLES BY: HIGHEST OPERATING VOLTAGE ; MATERIAL TYPE; STAKING (IF WOOD) - > 11 kV & < = 22 kV; Concrete [2017 - 1911] POLES BY: HIGHEST OPERATING VOLTAGE ; MATERIAL TYPE; STAKING (IF WOOD) - > 22 kV & < = 66 kV; Concrete [2017 - 1911] POLES BY: HIGHEST OPERATING VOLTAGE ; MATERIAL TYPE; STAKING (IF WOOD) - < = 1 kV; Steel [2017 - 1911] POLES BY: HIGHEST OPERATING VOLTAGE ; MATERIAL TYPE; STAKING (IF WOOD) - > 1 kV & < = 11 kV; Steel [2017 - 1911] POLES BY: HIGHEST OPERATING VOLTAGE ; MATERIAL TYPE; STAKING (IF WOOD) - > 11 kV & < = 22 kV; Steel [2017 - 1911] POLES BY: HIGHEST OPERATING VOLTAGE ; MATERIAL TYPE; STAKING (IF WOOD) - > 22 kV & < = 66 kV; Steel [2017 - 1911] POLES BY: HIGHEST OPERATING VOLTAGE ; MATERIAL TYPE; STAKING (IF WOOD) - Other [2017 - 1911] PUBLIC LIGHTING BY: ASSET TYPE ; LIGHTING OBLIGATION - Poles / Columns ; Major Road [2017 - 1911] PUBLIC LIGHTING BY: ASSET TYPE ; LIGHTING OBLIGATION - Poles / Columns ; Minor Road [2017 - 1911]
recorded or recorded inaccurately against a default year. An estimate of pole ages is required for those poles without a known accurate installation date. The information contained within GIS about poles does not provide details relating to road classifications for Public Lighting poles, hence an estimate is required for these.
Non CitiPower owned poles and out of service poles were excluded from the reported quantities. The age profile of poles contains a number of records where the installation date of the asset is unknown or incorrect. Our detailed methodology for distributing these assets across the known population is contained within an internal document as per below, CitiPower and Powercor RIN Asset Age Profiling Assumptions Document (10 Age Profiling 2012 Description.doc), In summary for the pole age profile, a base age profile was established for each class of pole using the known installation or staking date of that asset. For each of these classes of poles a number of records existed where the installation date was Unknown or incorrect. These Unknown assets were allocated across the base age profile on a pro-rata basis for each class of pole. This methodology assumes that the age of the Unknown assets can reasonably be expected to be represented by the age profile of the Known assets. Due to rounding in the allocation of these Unknown assets there were a number of assets which are left over (the sum of those allocated is less than the total number of poles). This is corrected by adding the difference across those years with the greatest number of assets. This provides the age profile of poles. The allocation of Public Lighting poles between Major and Minor roads are based on the proportion of lights installed in each road classification.
network connectivity model in GIS, to determine the poles located within the CitiPower service territory. The information obtained from GIS enables categorisation of poles by Owner, Voltage, Material, Staking status and Age.
CACP5.2BOP3 5.2 Asset Age Profile TABLE 5.2.1 - ASSET AGE PROFILE OVERHEAD CONDUCTORS BY: HIGHEST OPERATING VOLTAGE; NUMBER OF PHASES (AT HV) - < = 1 kV [2017 - 1911] OVERHEAD CONDUCTORS BY: HIGHEST OPERATING VOLTAGE; NUMBER OF PHASES (AT HV) - > 1 kV & < = 11 kV [2017 - 1911] OVERHEAD CONDUCTORS BY: HIGHEST OPERATING VOLTAGE; NUMBER OF PHASES (AT HV) - > 11 kV & < = 22 kV ; Multiple-Phase [2017 - 1911] OVERHEAD CONDUCTORS BY: HIGHEST OPERATING VOLTAGE; NUMBER OF PHASES (AT HV) - > 22 kV & < = 66 kV [2017 - 1911] OVERHEAD CONDUCTORS BY: HIGHEST OPERATING VOLTAGE; NUMBER OF PHASES (AT HV) - Other [2017 - 1911] SERVICE LINES BY: CONNECTION VOLTAGE; CUSTOMER TYPE; CONNECTION COMPLEXITY - Other [2017 - 1911]
Estimated For CitiPower, the Geographical Information System (GIS) is the originating data source. The data was obtained using a BI (Business Intelligence) report called the 'Asset Installation Report'.
Whilst the vast majority of conductor installation dates are recorded accurately, there are a number of records where the installation date of the asset is either not recorded or recorded inaccurately against a default year. An estimate of conductor age is required for those conductor segments without a known accurate installation date.
The total quantity of in-commission overhead conductors was obtained from CitiPower's GIS via the BI (Business Intelligence) report called the 'Asset Installation Report'. CitiPower's GIS records HV, LV and Service conductors separately. Out of service cables were excluded from the reported quantities. The overhead conductor lengths reported are those recorded as computed lengths in GIS. The age profile of overhead conductors contains a number of records where the installation date of the asset is unknown or incorrect. Reference should be made to the document below for the methodology of distributing these across the known age profile. CitiPower and Powercor AER RIN Asset Installation Asset Age Profiling Document
N/A The information provided complies with section 6 of Appendix E and complies with the definition in Appendix F. For the year 2017 the data was obtained utilising a GIS (Geographical Information System) query that traces the in-service network connectivity model in GIS, to determine the circuit line length, which includes all spurs. Each circuit element was evaluated in its own right, for example: - SWER lines, single-phase lines, and three-phase lines counted as one line; (Noting CitiPower only has three-phase lines - Double circuit lines counted as two lines Note:- - Although this methodology does not use the suggested Route Length methodology it does deliver the network circuit length using the criteria specified in this Information Notice. - Overhead elements associated with communication, protection & control and unmetered loads were excluded
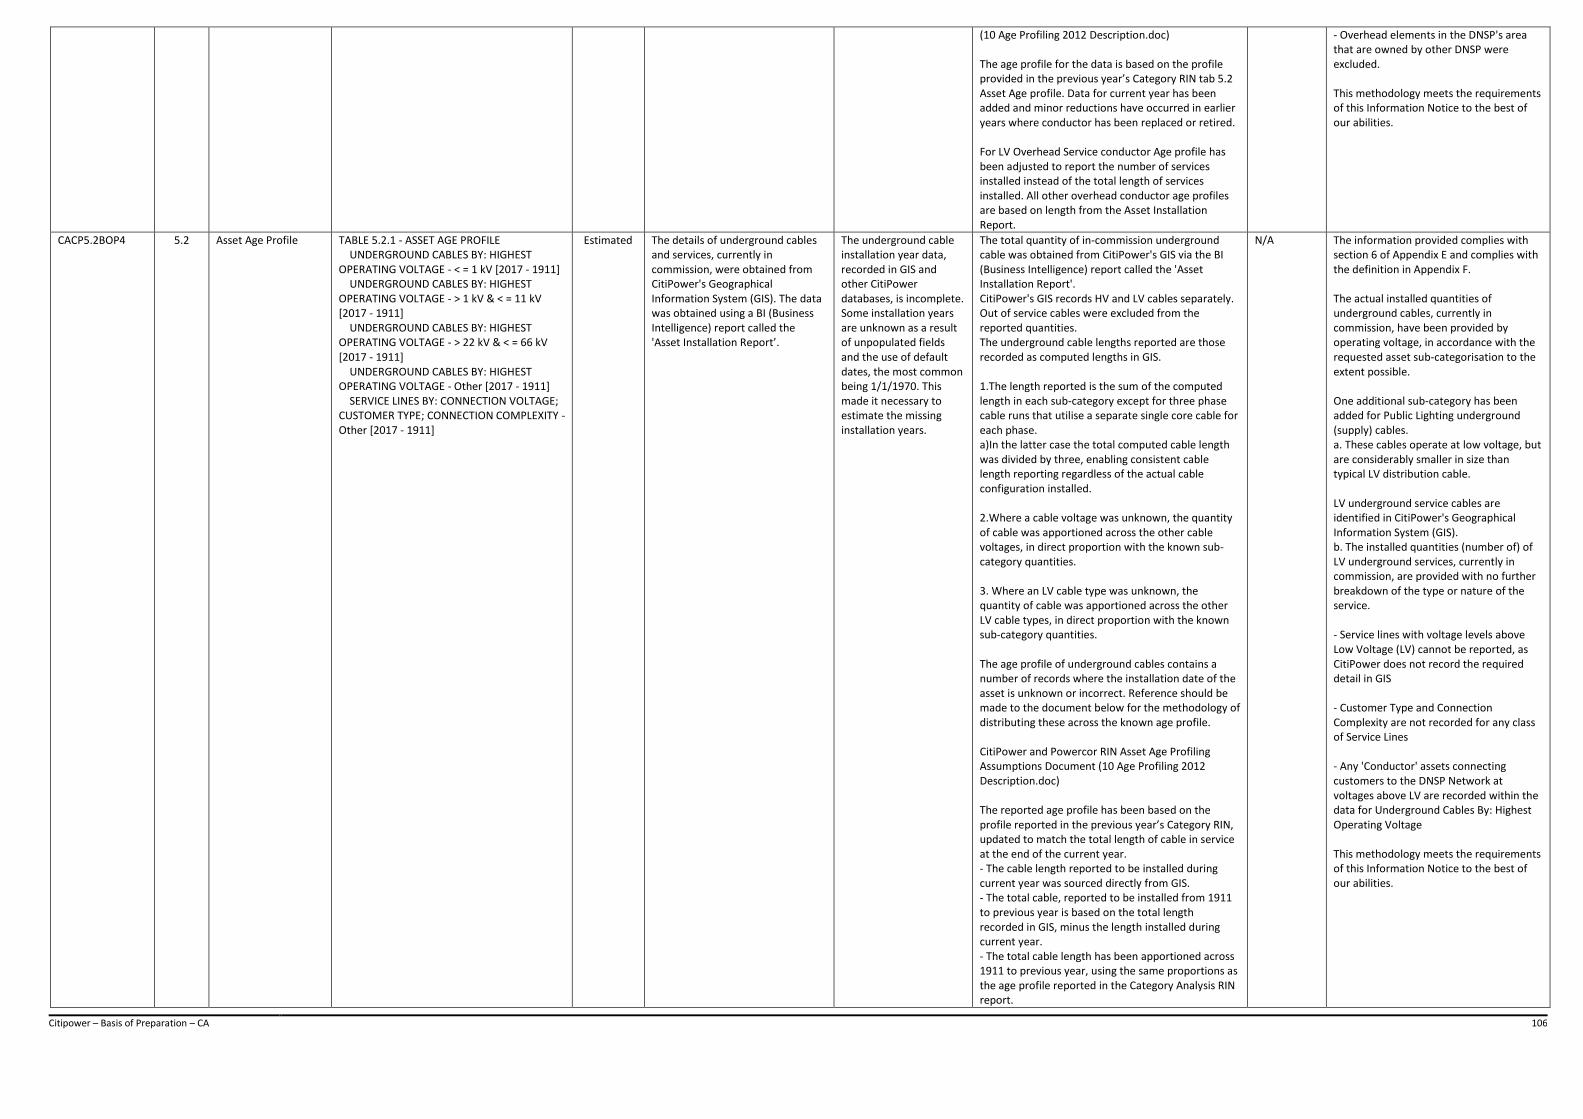
Citipower – Basis of Preparation – CA 106
(10 Age Profiling 2012 Description.doc) The age profile for the data is based on the profile provided in the previous year’s Category RIN tab 5.2 Asset Age profile. Data for current year has been added and minor reductions have occurred in earlier years where conductor has been replaced or retired. For LV Overhead Service conductor Age profile has been adjusted to report the number of services installed instead of the total length of services installed. All other overhead conductor age profiles are based on length from the Asset Installation Report.
- Overhead elements in the DNSP's area that are owned by other DNSP were excluded. This methodology meets the requirements of this Information Notice to the best of our abilities.
CACP5.2BOP4 5.2 Asset Age Profile TABLE 5.2.1 - ASSET AGE PROFILE UNDERGROUND CABLES BY: HIGHEST OPERATING VOLTAGE - < = 1 kV [2017 - 1911] UNDERGROUND CABLES BY: HIGHEST OPERATING VOLTAGE - > 1 kV & < = 11 kV [2017 - 1911] UNDERGROUND CABLES BY: HIGHEST OPERATING VOLTAGE - > 22 kV & < = 66 kV [2017 - 1911] UNDERGROUND CABLES BY: HIGHEST OPERATING VOLTAGE - Other [2017 - 1911] SERVICE LINES BY: CONNECTION VOLTAGE; CUSTOMER TYPE; CONNECTION COMPLEXITY - Other [2017 - 1911]
Estimated The details of underground cables and services, currently in commission, were obtained from CitiPower's Geographical Information System (GIS). The data was obtained using a BI (Business Intelligence) report called the 'Asset Installation Report’.
The underground cable installation year data, recorded in GIS and other CitiPower databases, is incomplete. Some installation years are unknown as a result of unpopulated fields and the use of default dates, the most common being 1/1/1970. This made it necessary to estimate the missing installation years.
The total quantity of in-commission underground cable was obtained from CitiPower's GIS via the BI (Business Intelligence) report called the 'Asset Installation Report'. CitiPower's GIS records HV and LV cables separately. Out of service cables were excluded from the reported quantities. The underground cable lengths reported are those recorded as computed lengths in GIS. 1.The length reported is the sum of the computed length in each sub-category except for three phase cable runs that utilise a separate single core cable for each phase. a)In the latter case the total computed cable length was divided by three, enabling consistent cable length reporting regardless of the actual cable configuration installed. 2.Where a cable voltage was unknown, the quantity of cable was apportioned across the other cable voltages, in direct proportion with the known sub-category quantities. 3. Where an LV cable type was unknown, the quantity of cable was apportioned across the other LV cable types, in direct proportion with the known sub-category quantities. The age profile of underground cables contains a number of records where the installation date of the asset is unknown or incorrect. Reference should be made to the document below for the methodology of distributing these across the known age profile. CitiPower and Powercor RIN Asset Age Profiling Assumptions Document (10 Age Profiling 2012 Description.doc) The reported age profile has been based on the profile reported in the previous year’s Category RIN, updated to match the total length of cable in service at the end of the current year. - The cable length reported to be installed during current year was sourced directly from GIS. - The total cable, reported to be installed from 1911 to previous year is based on the total length recorded in GIS, minus the length installed during current year. - The total cable length has been apportioned across 1911 to previous year, using the same proportions as the age profile reported in the Category Analysis RIN report.
N/A The information provided complies with section 6 of Appendix E and complies with the definition in Appendix F. The actual installed quantities of underground cables, currently in commission, have been provided by operating voltage, in accordance with the requested asset sub-categorisation to the extent possible. One additional sub-category has been added for Public Lighting underground (supply) cables. a. These cables operate at low voltage, but are considerably smaller in size than typical LV distribution cable. LV underground service cables are identified in CitiPower's Geographical Information System (GIS). b. The installed quantities (number of) of LV underground services, currently in commission, are provided with no further breakdown of the type or nature of the service. - Service lines with voltage levels above Low Voltage (LV) cannot be reported, as CitiPower does not record the required detail in GIS - Customer Type and Connection Complexity are not recorded for any class of Service Lines - Any 'Conductor' assets connecting customers to the DNSP Network at voltages above LV are recorded within the data for Underground Cables By: Highest Operating Voltage This methodology meets the requirements of this Information Notice to the best of our abilities.
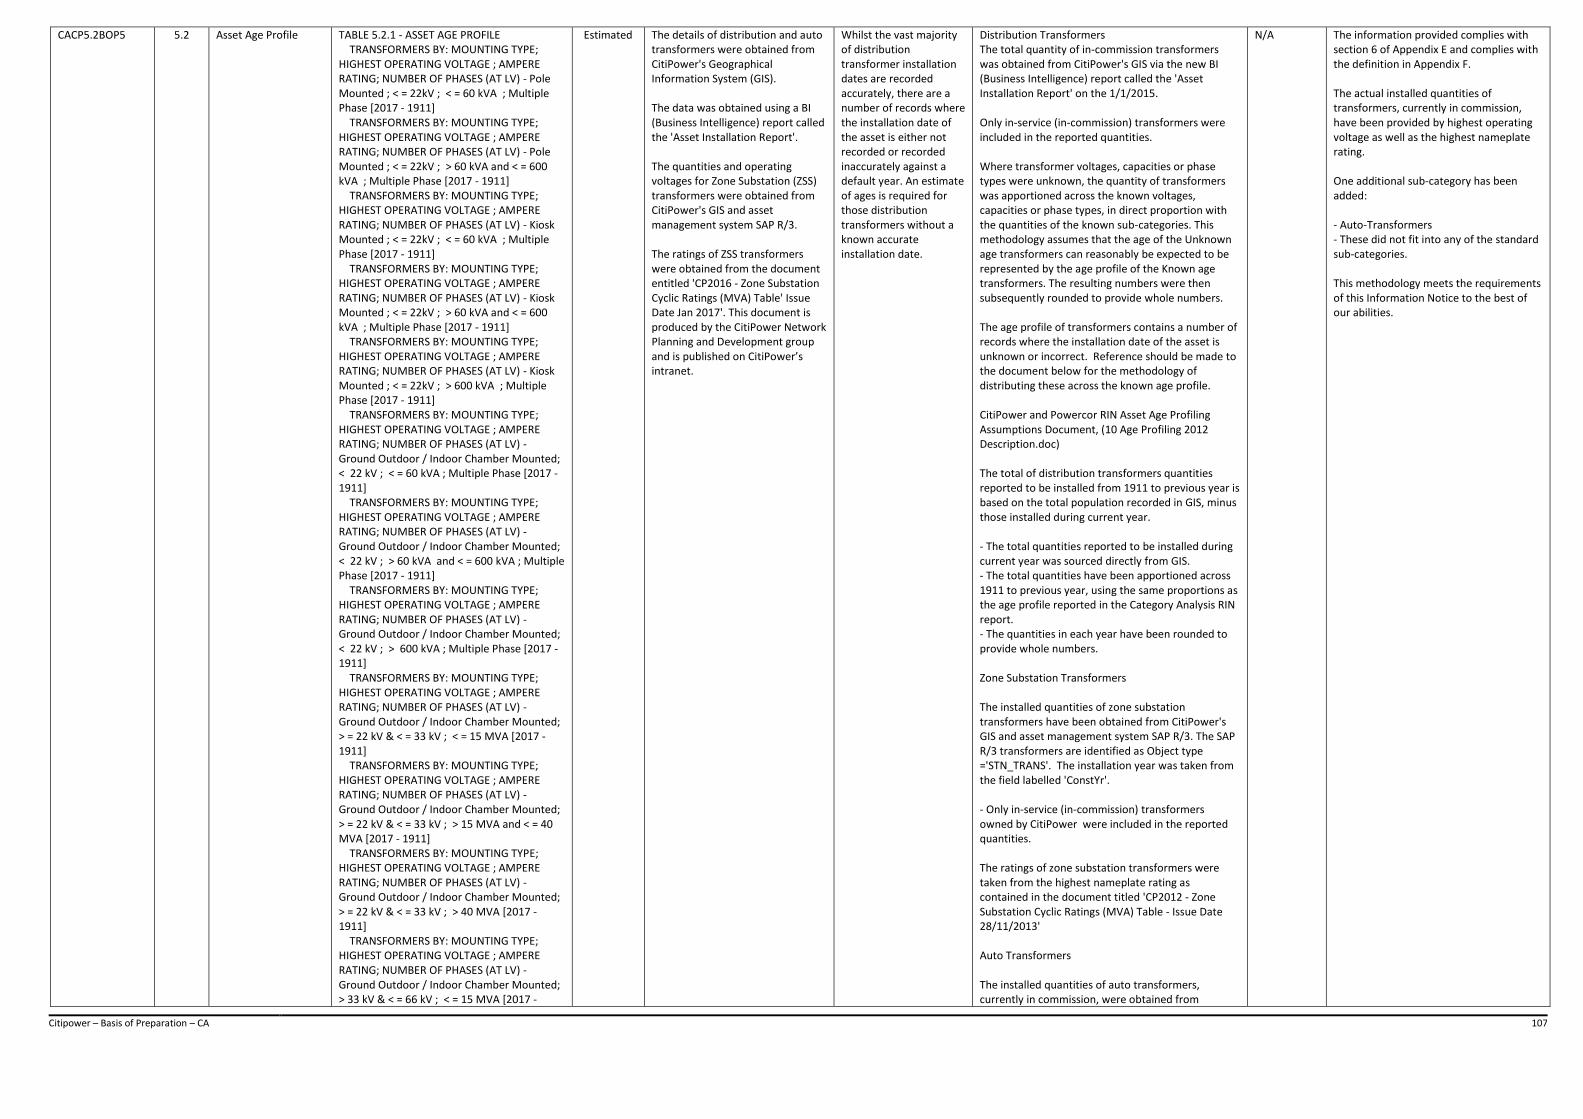
Citipower – Basis of Preparation – CA 107
CACP5.2BOP5 5.2 Asset Age Profile TABLE 5.2.1 - ASSET AGE PROFILE TRANSFORMERS BY: MOUNTING TYPE; HIGHEST OPERATING VOLTAGE ; AMPERE RATING; NUMBER OF PHASES (AT LV) - Pole Mounted ; < = 22kV ; < = 60 kVA ; Multiple Phase [2017 - 1911] TRANSFORMERS BY: MOUNTING TYPE; HIGHEST OPERATING VOLTAGE ; AMPERE RATING; NUMBER OF PHASES (AT LV) - Pole Mounted ; < = 22kV ; > 60 kVA and < = 600 kVA ; Multiple Phase [2017 - 1911] TRANSFORMERS BY: MOUNTING TYPE; HIGHEST OPERATING VOLTAGE ; AMPERE RATING; NUMBER OF PHASES (AT LV) - Kiosk Mounted ; < = 22kV ; < = 60 kVA ; Multiple Phase [2017 - 1911] TRANSFORMERS BY: MOUNTING TYPE; HIGHEST OPERATING VOLTAGE ; AMPERE RATING; NUMBER OF PHASES (AT LV) - Kiosk Mounted ; < = 22kV ; > 60 kVA and < = 600 kVA ; Multiple Phase [2017 - 1911] TRANSFORMERS BY: MOUNTING TYPE; HIGHEST OPERATING VOLTAGE ; AMPERE RATING; NUMBER OF PHASES (AT LV) - Kiosk Mounted ; < = 22kV ; > 600 kVA ; Multiple Phase [2017 - 1911] TRANSFORMERS BY: MOUNTING TYPE; HIGHEST OPERATING VOLTAGE ; AMPERE RATING; NUMBER OF PHASES (AT LV) - Ground Outdoor / Indoor Chamber Mounted; < 22 kV ; < = 60 kVA ; Multiple Phase [2017 - 1911] TRANSFORMERS BY: MOUNTING TYPE; HIGHEST OPERATING VOLTAGE ; AMPERE RATING; NUMBER OF PHASES (AT LV) - Ground Outdoor / Indoor Chamber Mounted; < 22 kV ; > 60 kVA and < = 600 kVA ; Multiple Phase [2017 - 1911] TRANSFORMERS BY: MOUNTING TYPE; HIGHEST OPERATING VOLTAGE ; AMPERE RATING; NUMBER OF PHASES (AT LV) - Ground Outdoor / Indoor Chamber Mounted; < 22 kV ; > 600 kVA ; Multiple Phase [2017 - 1911] TRANSFORMERS BY: MOUNTING TYPE; HIGHEST OPERATING VOLTAGE ; AMPERE RATING; NUMBER OF PHASES (AT LV) - Ground Outdoor / Indoor Chamber Mounted; > = 22 kV & < = 33 kV ; < = 15 MVA [2017 - 1911] TRANSFORMERS BY: MOUNTING TYPE; HIGHEST OPERATING VOLTAGE ; AMPERE RATING; NUMBER OF PHASES (AT LV) - Ground Outdoor / Indoor Chamber Mounted; > = 22 kV & < = 33 kV ; > 15 MVA and < = 40 MVA [2017 - 1911] TRANSFORMERS BY: MOUNTING TYPE; HIGHEST OPERATING VOLTAGE ; AMPERE RATING; NUMBER OF PHASES (AT LV) - Ground Outdoor / Indoor Chamber Mounted; > = 22 kV & < = 33 kV ; > 40 MVA [2017 - 1911] TRANSFORMERS BY: MOUNTING TYPE; HIGHEST OPERATING VOLTAGE ; AMPERE RATING; NUMBER OF PHASES (AT LV) - Ground Outdoor / Indoor Chamber Mounted; > 33 kV & < = 66 kV ; < = 15 MVA [2017 -
Estimated The details of distribution and auto transformers were obtained from CitiPower's Geographical Information System (GIS). The data was obtained using a BI (Business Intelligence) report called the 'Asset Installation Report'. The quantities and operating voltages for Zone Substation (ZSS) transformers were obtained from CitiPower's GIS and asset management system SAP R/3. The ratings of ZSS transformers were obtained from the document entitled 'CP2016 - Zone Substation Cyclic Ratings (MVA) Table' Issue Date Jan 2017'. This document is produced by the CitiPower Network Planning and Development group and is published on CitiPower’s intranet.
Whilst the vast majority of distribution transformer installation dates are recorded accurately, there are a number of records where the installation date of the asset is either not recorded or recorded inaccurately against a default year. An estimate of ages is required for those distribution transformers without a known accurate installation date.
Distribution Transformers The total quantity of in-commission transformers was obtained from CitiPower's GIS via the new BI (Business Intelligence) report called the 'Asset Installation Report' on the 1/1/2015. Only in-service (in-commission) transformers were included in the reported quantities. Where transformer voltages, capacities or phase types were unknown, the quantity of transformers was apportioned across the known voltages, capacities or phase types, in direct proportion with the quantities of the known sub-categories. This methodology assumes that the age of the Unknown age transformers can reasonably be expected to be represented by the age profile of the Known age transformers. The resulting numbers were then subsequently rounded to provide whole numbers. The age profile of transformers contains a number of records where the installation date of the asset is unknown or incorrect. Reference should be made to the document below for the methodology of distributing these across the known age profile. CitiPower and Powercor RIN Asset Age Profiling Assumptions Document, (10 Age Profiling 2012 Description.doc) The total of distribution transformers quantities reported to be installed from 1911 to previous year is based on the total population recorded in GIS, minus those installed during current year. - The total quantities reported to be installed during current year was sourced directly from GIS. - The total quantities have been apportioned across 1911 to previous year, using the same proportions as the age profile reported in the Category Analysis RIN report. - The quantities in each year have been rounded to provide whole numbers. Zone Substation Transformers The installed quantities of zone substation transformers have been obtained from CitiPower's GIS and asset management system SAP R/3. The SAP R/3 transformers are identified as Object type ='STN_TRANS'. The installation year was taken from the field labelled 'ConstYr'. - Only in-service (in-commission) transformers owned by CitiPower were included in the reported quantities. The ratings of zone substation transformers were taken from the highest nameplate rating as contained in the document titled 'CP2012 - Zone Substation Cyclic Ratings (MVA) Table - Issue Date 28/11/2013' Auto Transformers The installed quantities of auto transformers, currently in commission, were obtained from
N/A The information provided complies with section 6 of Appendix E and complies with the definition in Appendix F. The actual installed quantities of transformers, currently in commission, have been provided by highest operating voltage as well as the highest nameplate rating. One additional sub-category has been added: - Auto-Transformers - These did not fit into any of the standard sub-categories. This methodology meets the requirements of this Information Notice to the best of our abilities.
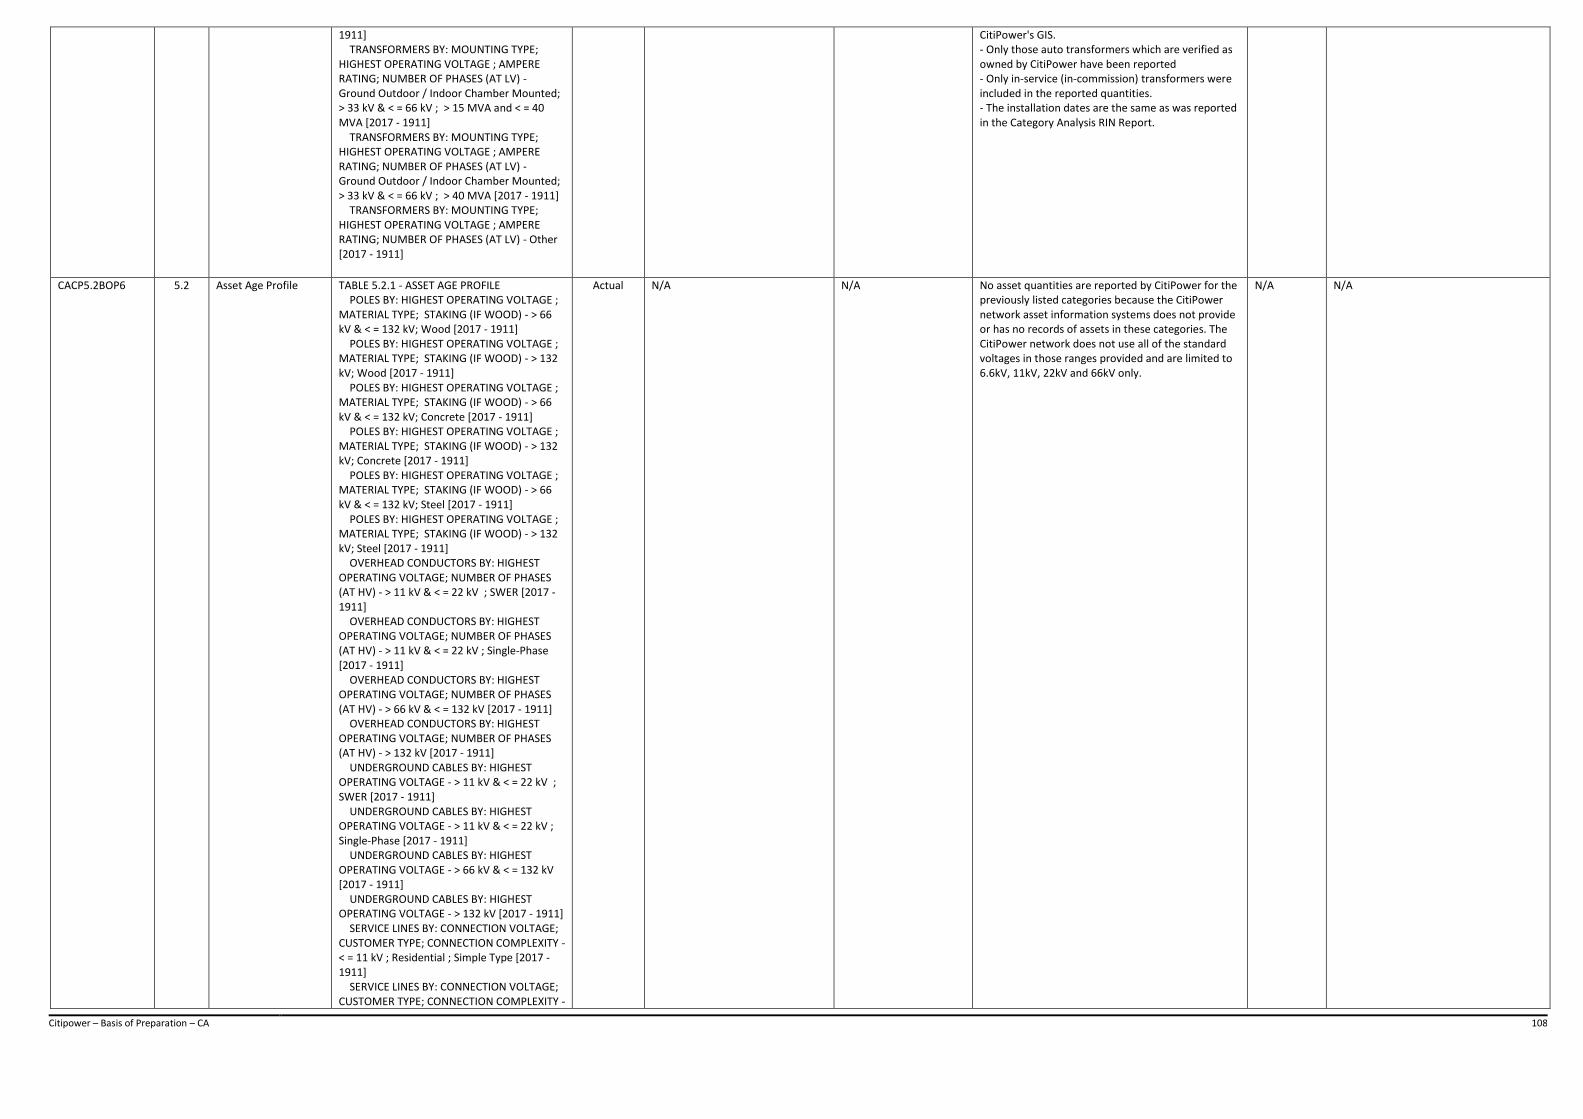
Citipower – Basis of Preparation – CA 108
1911] TRANSFORMERS BY: MOUNTING TYPE; HIGHEST OPERATING VOLTAGE ; AMPERE RATING; NUMBER OF PHASES (AT LV) - Ground Outdoor / Indoor Chamber Mounted; > 33 kV & < = 66 kV ; > 15 MVA and < = 40 MVA [2017 - 1911] TRANSFORMERS BY: MOUNTING TYPE; HIGHEST OPERATING VOLTAGE ; AMPERE RATING; NUMBER OF PHASES (AT LV) - Ground Outdoor / Indoor Chamber Mounted; > 33 kV & < = 66 kV ; > 40 MVA [2017 - 1911] TRANSFORMERS BY: MOUNTING TYPE; HIGHEST OPERATING VOLTAGE ; AMPERE RATING; NUMBER OF PHASES (AT LV) - Other [2017 - 1911]
CitiPower's GIS. - Only those auto transformers which are verified as owned by CitiPower have been reported - Only in-service (in-commission) transformers were included in the reported quantities. - The installation dates are the same as was reported in the Category Analysis RIN Report.
CACP5.2BOP6 5.2 Asset Age Profile TABLE 5.2.1 - ASSET AGE PROFILE POLES BY: HIGHEST OPERATING VOLTAGE ; MATERIAL TYPE; STAKING (IF WOOD) - > 66 kV & < = 132 kV; Wood [2017 - 1911] POLES BY: HIGHEST OPERATING VOLTAGE ; MATERIAL TYPE; STAKING (IF WOOD) - > 132 kV; Wood [2017 - 1911] POLES BY: HIGHEST OPERATING VOLTAGE ; MATERIAL TYPE; STAKING (IF WOOD) - > 66 kV & < = 132 kV; Concrete [2017 - 1911] POLES BY: HIGHEST OPERATING VOLTAGE ; MATERIAL TYPE; STAKING (IF WOOD) - > 132 kV; Concrete [2017 - 1911] POLES BY: HIGHEST OPERATING VOLTAGE ; MATERIAL TYPE; STAKING (IF WOOD) - > 66 kV & < = 132 kV; Steel [2017 - 1911] POLES BY: HIGHEST OPERATING VOLTAGE ; MATERIAL TYPE; STAKING (IF WOOD) - > 132 kV; Steel [2017 - 1911] OVERHEAD CONDUCTORS BY: HIGHEST OPERATING VOLTAGE; NUMBER OF PHASES (AT HV) - > 11 kV & < = 22 kV ; SWER [2017 - 1911] OVERHEAD CONDUCTORS BY: HIGHEST OPERATING VOLTAGE; NUMBER OF PHASES (AT HV) - > 11 kV & < = 22 kV ; Single-Phase [2017 - 1911] OVERHEAD CONDUCTORS BY: HIGHEST OPERATING VOLTAGE; NUMBER OF PHASES (AT HV) - > 66 kV & < = 132 kV [2017 - 1911] OVERHEAD CONDUCTORS BY: HIGHEST OPERATING VOLTAGE; NUMBER OF PHASES (AT HV) - > 132 kV [2017 - 1911] UNDERGROUND CABLES BY: HIGHEST OPERATING VOLTAGE - > 11 kV & < = 22 kV ; SWER [2017 - 1911] UNDERGROUND CABLES BY: HIGHEST OPERATING VOLTAGE - > 11 kV & < = 22 kV ; Single-Phase [2017 - 1911] UNDERGROUND CABLES BY: HIGHEST OPERATING VOLTAGE - > 66 kV & < = 132 kV [2017 - 1911] UNDERGROUND CABLES BY: HIGHEST OPERATING VOLTAGE - > 132 kV [2017 - 1911] SERVICE LINES BY: CONNECTION VOLTAGE; CUSTOMER TYPE; CONNECTION COMPLEXITY - < = 11 kV ; Residential ; Simple Type [2017 - 1911] SERVICE LINES BY: CONNECTION VOLTAGE; CUSTOMER TYPE; CONNECTION COMPLEXITY -
Actual N/A N/A No asset quantities are reported by CitiPower for the previously listed categories because the CitiPower network asset information systems does not provide or has no records of assets in these categories. The CitiPower network does not use all of the standard voltages in those ranges provided and are limited to 6.6kV, 11kV, 22kV and 66kV only.
N/A N/A
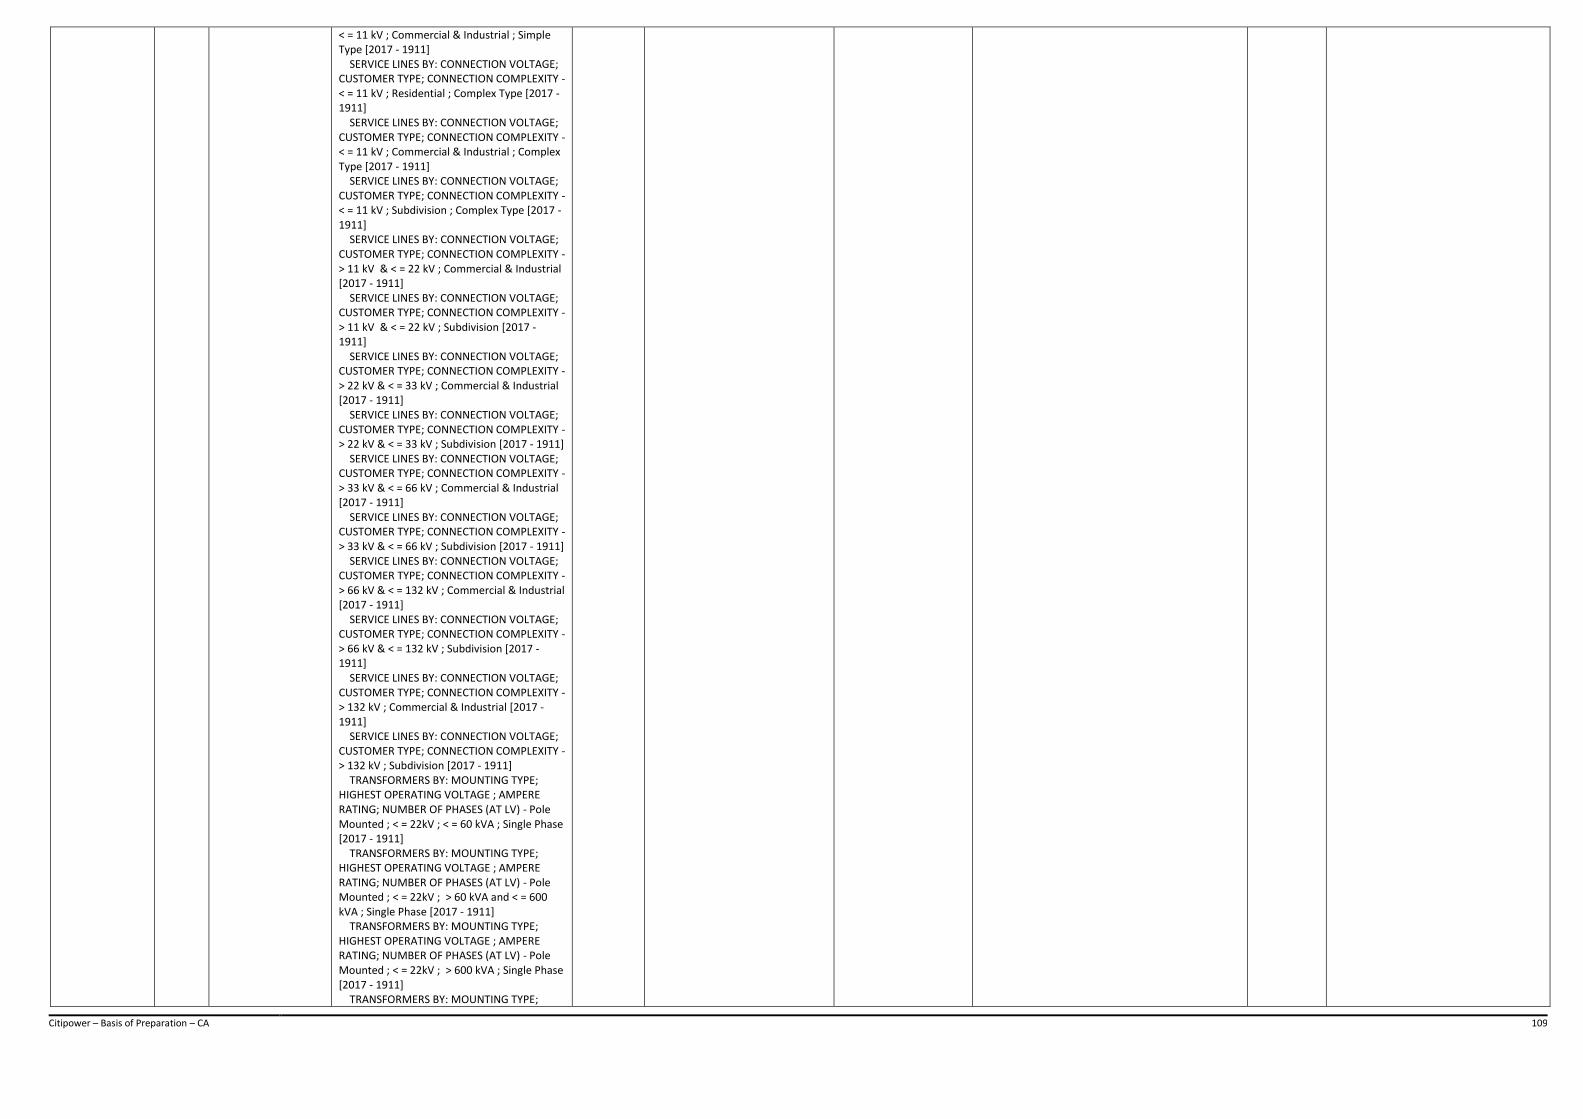
Citipower – Basis of Preparation – CA 109
< = 11 kV ; Commercial & Industrial ; Simple Type [2017 - 1911] SERVICE LINES BY: CONNECTION VOLTAGE; CUSTOMER TYPE; CONNECTION COMPLEXITY - < = 11 kV ; Residential ; Complex Type [2017 - 1911] SERVICE LINES BY: CONNECTION VOLTAGE; CUSTOMER TYPE; CONNECTION COMPLEXITY - < = 11 kV ; Commercial & Industrial ; Complex Type [2017 - 1911] SERVICE LINES BY: CONNECTION VOLTAGE; CUSTOMER TYPE; CONNECTION COMPLEXITY - < = 11 kV ; Subdivision ; Complex Type [2017 - 1911] SERVICE LINES BY: CONNECTION VOLTAGE; CUSTOMER TYPE; CONNECTION COMPLEXITY - > 11 kV & < = 22 kV ; Commercial & Industrial [2017 - 1911] SERVICE LINES BY: CONNECTION VOLTAGE; CUSTOMER TYPE; CONNECTION COMPLEXITY - > 11 kV & < = 22 kV ; Subdivision [2017 - 1911] SERVICE LINES BY: CONNECTION VOLTAGE; CUSTOMER TYPE; CONNECTION COMPLEXITY - > 22 kV & < = 33 kV ; Commercial & Industrial [2017 - 1911] SERVICE LINES BY: CONNECTION VOLTAGE; CUSTOMER TYPE; CONNECTION COMPLEXITY - > 22 kV & < = 33 kV ; Subdivision [2017 - 1911] SERVICE LINES BY: CONNECTION VOLTAGE; CUSTOMER TYPE; CONNECTION COMPLEXITY - > 33 kV & < = 66 kV ; Commercial & Industrial [2017 - 1911] SERVICE LINES BY: CONNECTION VOLTAGE; CUSTOMER TYPE; CONNECTION COMPLEXITY - > 33 kV & < = 66 kV ; Subdivision [2017 - 1911] SERVICE LINES BY: CONNECTION VOLTAGE; CUSTOMER TYPE; CONNECTION COMPLEXITY - > 66 kV & < = 132 kV ; Commercial & Industrial [2017 - 1911] SERVICE LINES BY: CONNECTION VOLTAGE; CUSTOMER TYPE; CONNECTION COMPLEXITY - > 66 kV & < = 132 kV ; Subdivision [2017 - 1911] SERVICE LINES BY: CONNECTION VOLTAGE; CUSTOMER TYPE; CONNECTION COMPLEXITY - > 132 kV ; Commercial & Industrial [2017 - 1911] SERVICE LINES BY: CONNECTION VOLTAGE; CUSTOMER TYPE; CONNECTION COMPLEXITY - > 132 kV ; Subdivision [2017 - 1911] TRANSFORMERS BY: MOUNTING TYPE; HIGHEST OPERATING VOLTAGE ; AMPERE RATING; NUMBER OF PHASES (AT LV) - Pole Mounted ; < = 22kV ; < = 60 kVA ; Single Phase [2017 - 1911] TRANSFORMERS BY: MOUNTING TYPE; HIGHEST OPERATING VOLTAGE ; AMPERE RATING; NUMBER OF PHASES (AT LV) - Pole Mounted ; < = 22kV ; > 60 kVA and < = 600 kVA ; Single Phase [2017 - 1911] TRANSFORMERS BY: MOUNTING TYPE; HIGHEST OPERATING VOLTAGE ; AMPERE RATING; NUMBER OF PHASES (AT LV) - Pole Mounted ; < = 22kV ; > 600 kVA ; Single Phase [2017 - 1911] TRANSFORMERS BY: MOUNTING TYPE;

Citipower – Basis of Preparation – CA 110
HIGHEST OPERATING VOLTAGE ; AMPERE RATING; NUMBER OF PHASES (AT LV) - Pole Mounted ; < = 22kV ; > 600 kVA ; Multiple Phase [2017 - 1911] TRANSFORMERS BY: MOUNTING TYPE; HIGHEST OPERATING VOLTAGE ; AMPERE RATING; NUMBER OF PHASES (AT LV) - Kiosk Mounted ; < = 22kV ; < = 60 kVA ; Single Phase [2017 - 1911] TRANSFORMERS BY: MOUNTING TYPE; HIGHEST OPERATING VOLTAGE ; AMPERE RATING; NUMBER OF PHASES (AT LV) - Kiosk Mounted ; < = 22kV ; > 60 kVA and < = 600 kVA ; Single Phase [2017 - 1911] TRANSFORMERS BY: MOUNTING TYPE; HIGHEST OPERATING VOLTAGE ; AMPERE RATING; NUMBER OF PHASES (AT LV) - Kiosk Mounted ; < = 22kV ; > 600 kVA ; Single Phase [2017 - 1911] TRANSFORMERS BY: MOUNTING TYPE; HIGHEST OPERATING VOLTAGE ; AMPERE RATING; NUMBER OF PHASES (AT LV) - Ground Outdoor / Indoor Chamber Mounted; < 22 kV ; < = 60 kVA ; Single Phase [2017 - 1911] TRANSFORMERS BY: MOUNTING TYPE; HIGHEST OPERATING VOLTAGE ; AMPERE RATING; NUMBER OF PHASES (AT LV) - Ground Outdoor / Indoor Chamber Mounted; < 22 kV ; > 60 kVA and < = 600 kVA ; Single Phase [2017 - 1911] TRANSFORMERS BY: MOUNTING TYPE; HIGHEST OPERATING VOLTAGE ; AMPERE RATING; NUMBER OF PHASES (AT LV) - Ground Outdoor / Indoor Chamber Mounted; < 22 kV ; > 600 kVA ; Single Phase [2017 - 1911] TRANSFORMERS BY: MOUNTING TYPE; HIGHEST OPERATING VOLTAGE ; AMPERE RATING; NUMBER OF PHASES (AT LV) - Ground Outdoor / Indoor Chamber Mounted; > 66 kV & < = 132 kV ; < = 100 MVA [2017 - 1911] TRANSFORMERS BY: MOUNTING TYPE; HIGHEST OPERATING VOLTAGE ; AMPERE RATING; NUMBER OF PHASES (AT LV) - Ground Outdoor / Indoor Chamber Mounted; > 66 kV & < = 132 kV ; > 100 MVA [2017 - 1911] TRANSFORMERS BY: MOUNTING TYPE; HIGHEST OPERATING VOLTAGE ; AMPERE RATING; NUMBER OF PHASES (AT LV) - Ground Outdoor / Indoor Chamber Mounted; > 132 kV ; < = 100 MVA [2017 - 1911] TRANSFORMERS BY: MOUNTING TYPE; HIGHEST OPERATING VOLTAGE ; AMPERE RATING; NUMBER OF PHASES (AT LV) - Ground Outdoor / Indoor Chamber Mounted; > 132 kV ; > 100 MVA [2017 - 1911]
CACP5.2BOP7 5.2 Asset Age Profile TABLE 5.2.1 - ASSET AGE PROFILE SWITCHGEAR BY: HIGHEST OPERATING VOLTAGE ; SWITCH FUNCTION - < = 11 kV ; Switch [2017 - 1911] SWITCHGEAR BY: HIGHEST OPERATING VOLTAGE ; SWITCH FUNCTION - < = 11 kV ; Circuit Breaker [2017 - 1911]
Estimate Raw equipment data extracted from SAP by Query including Object Type: ACR, Step Switch, Station Earth Switch, Station Link, Station Switch, Circuit Breaker, Raw equipment data extracted from GIS by Query
For those assets with blank Construct year - Blank Construct year data indicates that the data was not available in the SAP asset management system.
Methodology was to extract data from the SAP / GIS systems to locate and identify the type and construction year of the required assets. Some of these assets will not have a known construct year and require approximation to populate the age profile. This was achieved by firstly, for assets created after
N/A a) Not applicable b) Not applicable c) Sub categorisation not applicable to this asset category d) Sub categorisation not applicable to this asset category
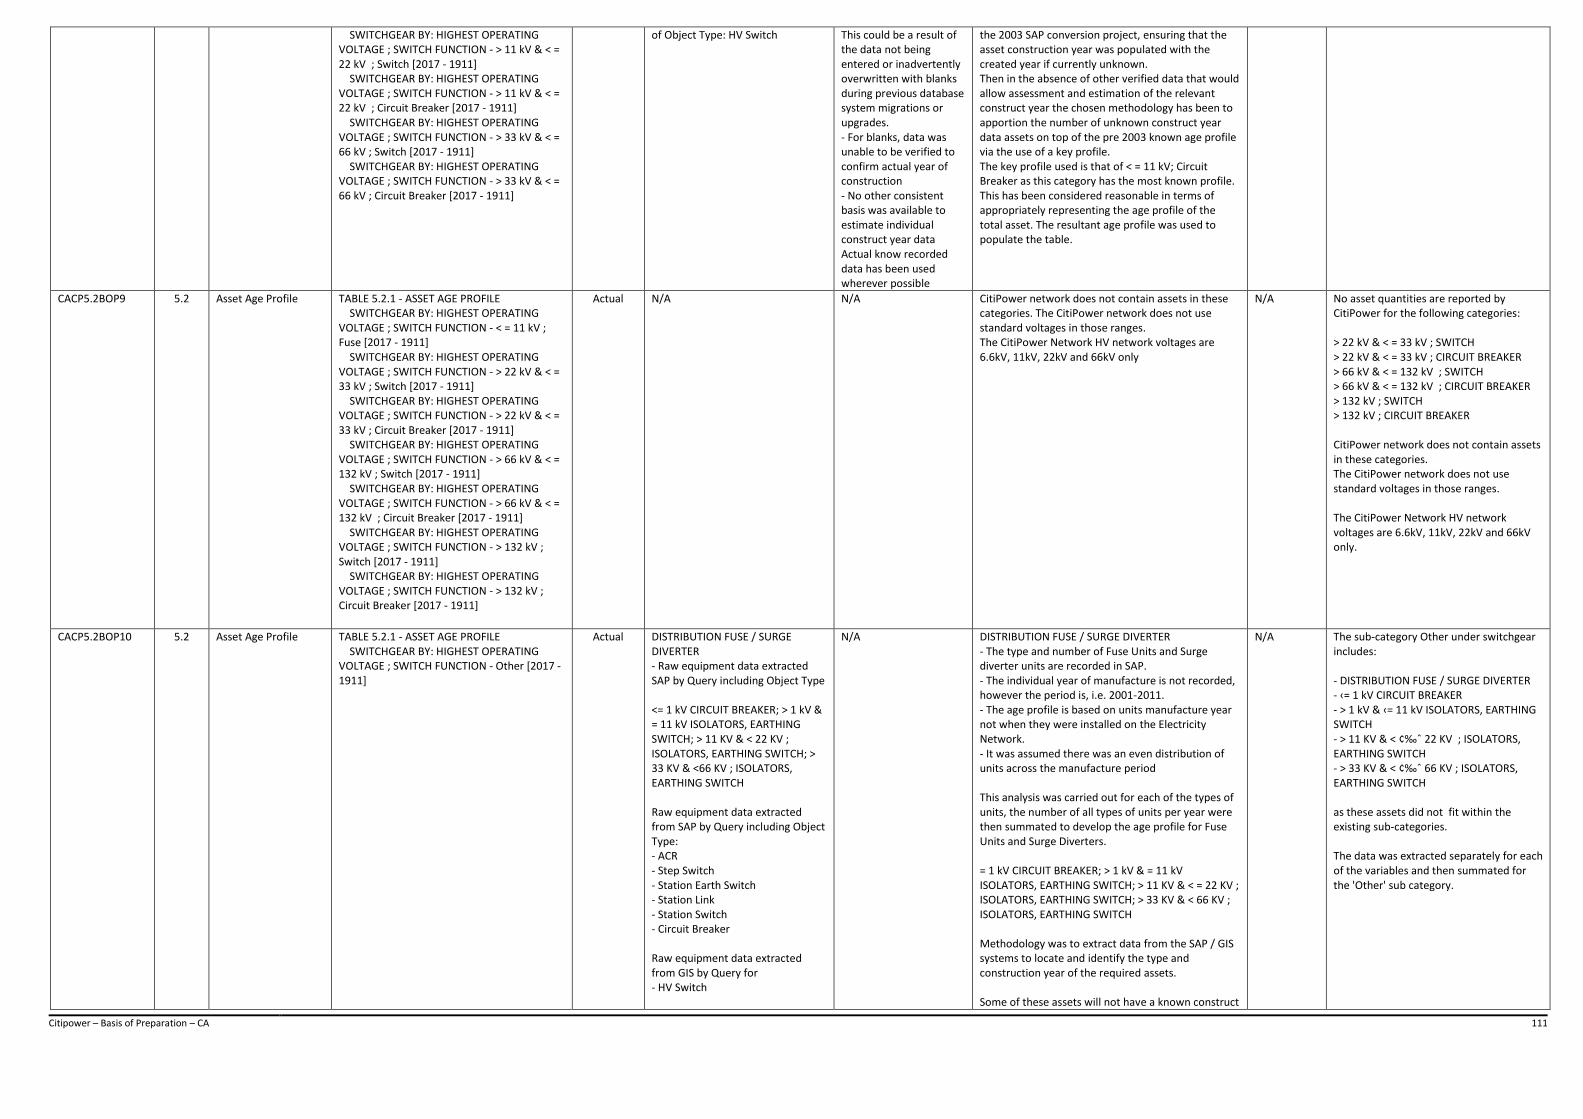
Citipower – Basis of Preparation – CA 111
SWITCHGEAR BY: HIGHEST OPERATING VOLTAGE ; SWITCH FUNCTION - > 11 kV & < = 22 kV ; Switch [2017 - 1911] SWITCHGEAR BY: HIGHEST OPERATING VOLTAGE ; SWITCH FUNCTION - > 11 kV & < = 22 kV ; Circuit Breaker [2017 - 1911] SWITCHGEAR BY: HIGHEST OPERATING VOLTAGE ; SWITCH FUNCTION - > 33 kV & < = 66 kV ; Switch [2017 - 1911] SWITCHGEAR BY: HIGHEST OPERATING VOLTAGE ; SWITCH FUNCTION - > 33 kV & < = 66 kV ; Circuit Breaker [2017 - 1911]
of Object Type: HV Switch This could be a result of the data not being entered or inadvertently overwritten with blanks during previous database system migrations or upgrades. - For blanks, data was unable to be verified to confirm actual year of construction - No other consistent basis was available to estimate individual construct year data Actual know recorded data has been used wherever possible
the 2003 SAP conversion project, ensuring that the asset construction year was populated with the created year if currently unknown. Then in the absence of other verified data that would allow assessment and estimation of the relevant construct year the chosen methodology has been to apportion the number of unknown construct year data assets on top of the pre 2003 known age profile via the use of a key profile. The key profile used is that of < = 11 kV; Circuit Breaker as this category has the most known profile. This has been considered reasonable in terms of appropriately representing the age profile of the total asset. The resultant age profile was used to populate the table.
CACP5.2BOP9 5.2 Asset Age Profile TABLE 5.2.1 - ASSET AGE PROFILE SWITCHGEAR BY: HIGHEST OPERATING VOLTAGE ; SWITCH FUNCTION - < = 11 kV ; Fuse [2017 - 1911] SWITCHGEAR BY: HIGHEST OPERATING VOLTAGE ; SWITCH FUNCTION - > 22 kV & < = 33 kV ; Switch [2017 - 1911] SWITCHGEAR BY: HIGHEST OPERATING VOLTAGE ; SWITCH FUNCTION - > 22 kV & < = 33 kV ; Circuit Breaker [2017 - 1911] SWITCHGEAR BY: HIGHEST OPERATING VOLTAGE ; SWITCH FUNCTION - > 66 kV & < = 132 kV ; Switch [2017 - 1911] SWITCHGEAR BY: HIGHEST OPERATING VOLTAGE ; SWITCH FUNCTION - > 66 kV & < = 132 kV ; Circuit Breaker [2017 - 1911] SWITCHGEAR BY: HIGHEST OPERATING VOLTAGE ; SWITCH FUNCTION - > 132 kV ; Switch [2017 - 1911] SWITCHGEAR BY: HIGHEST OPERATING VOLTAGE ; SWITCH FUNCTION - > 132 kV ; Circuit Breaker [2017 - 1911]
Actual N/A N/A CitiPower network does not contain assets in these categories. The CitiPower network does not use standard voltages in those ranges. The CitiPower Network HV network voltages are 6.6kV, 11kV, 22kV and 66kV only
N/A No asset quantities are reported by CitiPower for the following categories: > 22 kV & < = 33 kV ; SWITCH > 22 kV & < = 33 kV ; CIRCUIT BREAKER > 66 kV & < = 132 kV ; SWITCH > 66 kV & < = 132 kV ; CIRCUIT BREAKER > 132 kV ; SWITCH > 132 kV ; CIRCUIT BREAKER CitiPower network does not contain assets in these categories. The CitiPower network does not use standard voltages in those ranges. The CitiPower Network HV network voltages are 6.6kV, 11kV, 22kV and 66kV only.
CACP5.2BOP10 5.2 Asset Age Profile TABLE 5.2.1 - ASSET AGE PROFILE SWITCHGEAR BY: HIGHEST OPERATING VOLTAGE ; SWITCH FUNCTION - Other [2017 - 1911]
Actual DISTRIBUTION FUSE / SURGE DIVERTER - Raw equipment data extracted SAP by Query including Object Type <= 1 kV CIRCUIT BREAKER; > 1 kV & = 11 kV ISOLATORS, EARTHING SWITCH; > 11 KV & < 22 KV ; ISOLATORS, EARTHING SWITCH; > 33 KV & <66 KV ; ISOLATORS, EARTHING SWITCH Raw equipment data extracted from SAP by Query including Object Type: - ACR - Step Switch - Station Earth Switch - Station Link - Station Switch - Circuit Breaker Raw equipment data extracted from GIS by Query for - HV Switch
N/A DISTRIBUTION FUSE / SURGE DIVERTER - The type and number of Fuse Units and Surge diverter units are recorded in SAP. - The individual year of manufacture is not recorded, however the period is, i.e. 2001-2011. - The age profile is based on units manufacture year not when they were installed on the Electricity Network. - It was assumed there was an even distribution of units across the manufacture period This analysis was carried out for each of the types of units, the number of all types of units per year were then summated to develop the age profile for Fuse Units and Surge Diverters. = 1 kV CIRCUIT BREAKER; > 1 kV & = 11 kV ISOLATORS, EARTHING SWITCH; > 11 KV & < = 22 KV ; ISOLATORS, EARTHING SWITCH; > 33 KV & < 66 KV ; ISOLATORS, EARTHING SWITCH Methodology was to extract data from the SAP / GIS systems to locate and identify the type and construction year of the required assets. Some of these assets will not have a known construct
N/A The sub-category Other under switchgear includes: - DISTRIBUTION FUSE / SURGE DIVERTER - ‹= 1 kV CIRCUIT BREAKER - > 1 kV & ‹= 11 kV ISOLATORS, EARTHING SWITCH - > 11 KV & < ¢‰ˆ 22 KV ; ISOLATORS, EARTHING SWITCH - > 33 KV & < ¢‰ˆ 66 KV ; ISOLATORS, EARTHING SWITCH as these assets did not fit within the existing sub-categories. The data was extracted separately for each of the variables and then summated for the 'Other' sub category.

Citipower – Basis of Preparation – CA 112
year and require approximation to populate the age profile. This was achieved by firstly, for assets created after the 2003 SAP conversion project, ensuring that the asset construction year was populated with the created year if currently unknown. Then in the absence of other verified data that would allow assessment and estimation of the relevant construct year the chosen methodology has been to apportion the number of unknown construct year data assets on top of the pre 2003 known age profile via the use of a key profile. The key profile used is that of >11 kV = 22 kV; Circuit Breaker as this category has a known profile. This has been considered reasonable in terms of appropriately representing the age profile of the total asset. The resultant age profile was used to populate the table.
CACP5.2BOP11 5.2 Asset Age Profile TABLE 5.2.1 - ASSET AGE PROFILE PUBLIC LIGHTING BY: ASSET TYPE ; LIGHTING OBLIGATION - PUBLIC LIGHTING BY: ASSET TYPE ; LIGHTING OBLIGATION [2017 - 1911] PUBLIC LIGHTING BY: ASSET TYPE ; LIGHTING OBLIGATION - Luminaires ; Minor Road [2017 - 1911] PUBLIC LIGHTING BY: ASSET TYPE ; LIGHTING OBLIGATION - Brackets ; Major Road [2017 - 1911] PUBLIC LIGHTING BY: ASSET TYPE ; LIGHTING OBLIGATION - Brackets ; Minor Road [2017 - 1911] PUBLIC LIGHTING BY: ASSET TYPE ; LIGHTING OBLIGATION - Lamps ; Major Road [2017 - 1911] PUBLIC LIGHTING BY: ASSET TYPE ; LIGHTING OBLIGATION - Lamps ; Minor Road [2017 - 1911] PUBLIC LIGHTING BY: ASSET TYPE ; LIGHTING OBLIGATION - Other [2017 - 1911]
Estimated LUMINAIRES ; MAJOR/MINOR ROAD ; STANDARD CONTROL: - Based on data extracted from GIS (asset management system) from log listing all in service and billable luminaire details for CitiPower and Powercor. BRACKETS ; MAJOR/MINOR ROAD ; STANDARD CONTROL - No data is available (see F. No data provided) LAMPS ; MAJOR/MINOR ROAD ; STANDARD CONTROL - Based on data extracted from GIS (asset management system) from log listing all in service and billable luminaire details for CitiPower and Powercor.
LUMINAIRES ; MAJOR/MINOR ROAD ; STANDARD CONTROL : Significant data was unusable due to 'default' dates being used for 'Date Lantern Changed' such as '1/01/1960', '1/01/1970' & '1/08/2001'. A separate field was also available 'Year Lantern Manufactured', this year was also compromised as it appeared that it had not been maintained throughout the time period. - Data was unable to be verified to confirm actual year of replacement due to data migration to GIS. - Data entered has not been consistently validated to ensure that accuracy was correctly entered. - Assumptions listed above were used to provide a slightly more accurate age profile of Luminaires, however there are still large gaps and default dates still used that distorts the data. BRACKETS ; MAJOR/MINOR ROAD ; STANDARD CONTROL - The business has not historically retained any data on brackets. We are
LUMINAIRES ; MAJOR/MINOR ROAD ; STANDARD CONTROL, Methodology, - Per definition of 'assets in commission' only in service and billable lights as at 1/1/15 were extracted from GIS. - Asset quantity recorded were allocated across the years 1910 - 2014 using information recorded relating to 'year lantern manufactured' or 'year lantern changed'. Assumptions - Only in service and billable lights were reported, - 'Cost Share Status' was used to separate between Major Road ('Cost Shared (4/10)(6/10)') and Minor Road ('Full Cost (Municipality)') in order to meet the definition of major/minor roads per the RIN. - Where 'Year Lantern Changed' = 1960, 1970 & 2001 and 'Year Lantern Manufactured' varied, 'Year Lantern Manufactured was used in preference to 'Year Lantern Changed' - Where 'Year Lantern Changed' 1960, 1970 & 2001, no change was made and 'Year Lantern Changed' was taken to represent the year the asset was commissioned. BRACKETS ; MAJOR/MINOR ROAD ; STANDARD CONTROL, -No data is available LAMPS ; MAJOR/MINOR ROAD ; STANDARD CONTROL, Methodology - Per definition of 'assets in commission' only in service and billable lights as at 1/1/15 were extracted from GIS. - Asset quantities recorded were allocated across the years 1910 - 2014 using information recorded relating to 'year lamp changed'. Assumptions - 'Cost Share Status' was used to separate between Major Road ('Cost Shared (4/10)(6/10)') and Minor Road ('Full Cost (Municipality)') in order to meet the definition of major/minor roads per the RIN.
N/A With regard to the Final Distribution Category Analysis RIN, 5.2.1 Asset Age Profile by asset category for Public Lighting. We have provided data that complies with the instructions and definitions specified in the requirements of the notice as follows: 6.1(a) We have provided asset sub-categories corresponding to the prescribed asset categories in Table 2.2.1. (b) not applicable (c) not applicable (d) not applicable
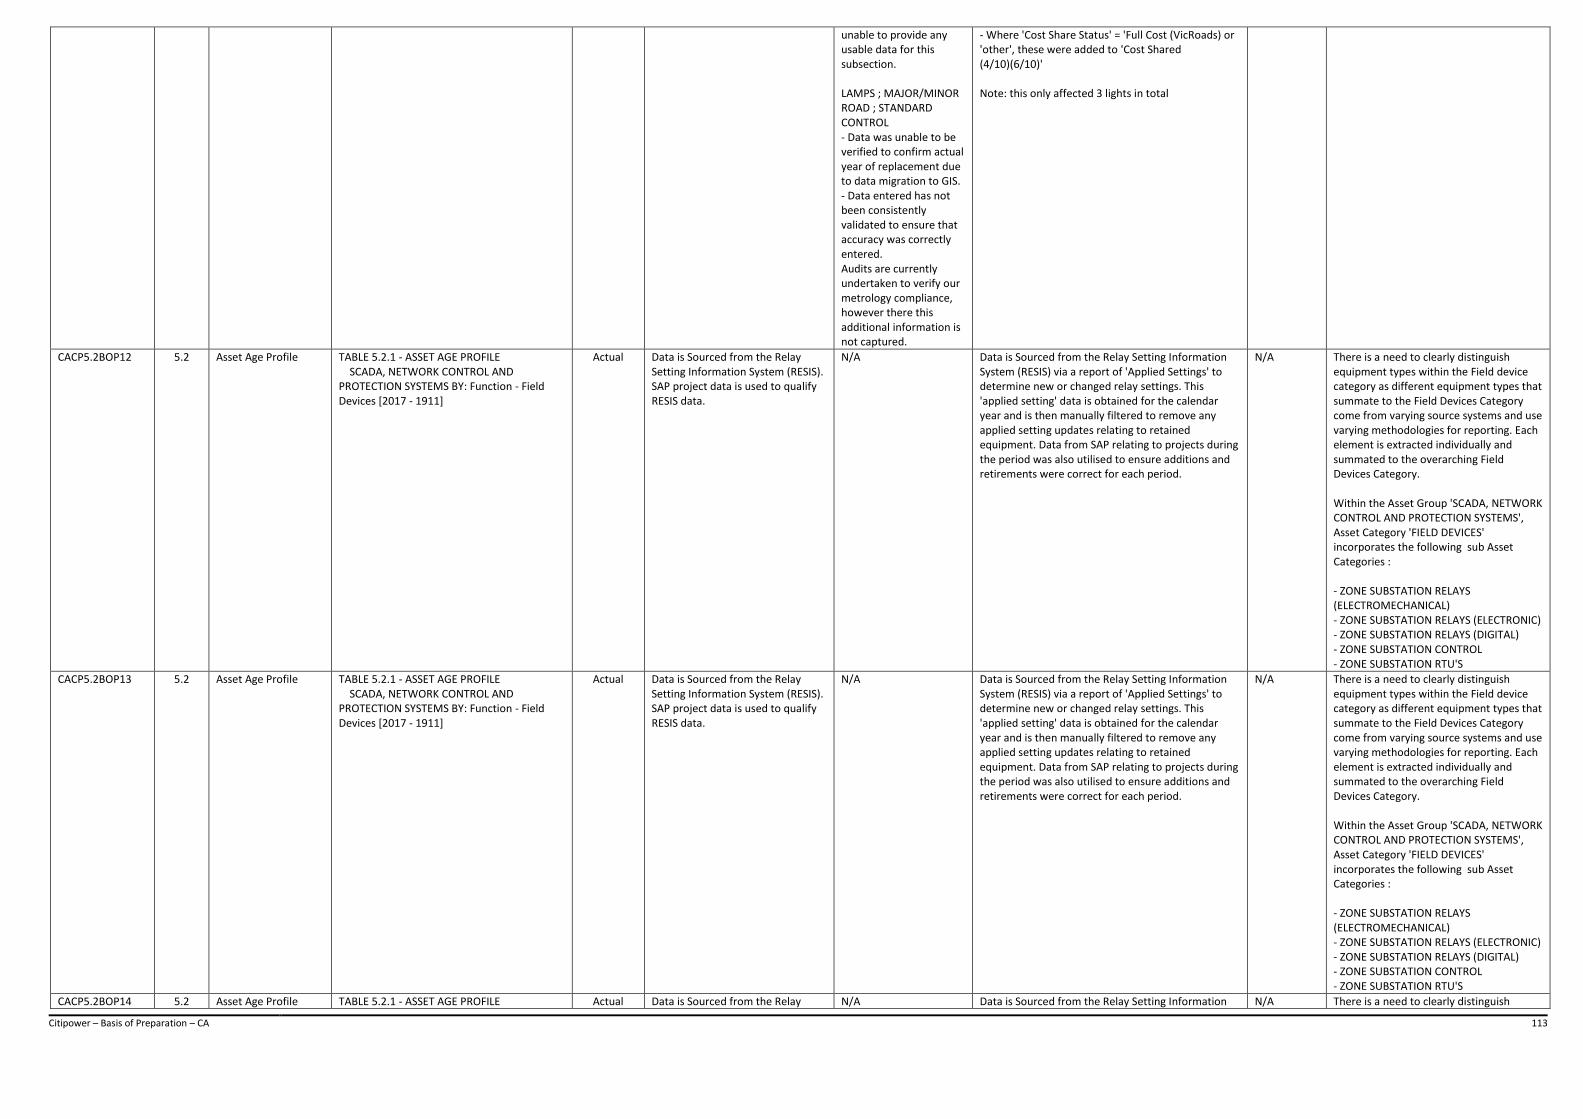
Citipower – Basis of Preparation – CA 113
unable to provide any usable data for this subsection. LAMPS ; MAJOR/MINOR ROAD ; STANDARD CONTROL - Data was unable to be verified to confirm actual year of replacement due to data migration to GIS. - Data entered has not been consistently validated to ensure that accuracy was correctly entered. Audits are currently undertaken to verify our metrology compliance, however there this additional information is not captured.
- Where 'Cost Share Status' = 'Full Cost (VicRoads) or 'other', these were added to 'Cost Shared (4/10)(6/10)' Note: this only affected 3 lights in total
CACP5.2BOP12 5.2 Asset Age Profile TABLE 5.2.1 - ASSET AGE PROFILE SCADA, NETWORK CONTROL AND PROTECTION SYSTEMS BY: Function - Field Devices [2017 - 1911]
Actual Data is Sourced from the Relay Setting Information System (RESIS). SAP project data is used to qualify RESIS data.
N/A Data is Sourced from the Relay Setting Information System (RESIS) via a report of 'Applied Settings' to determine new or changed relay settings. This 'applied setting' data is obtained for the calendar year and is then manually filtered to remove any applied setting updates relating to retained equipment. Data from SAP relating to projects during the period was also utilised to ensure additions and retirements were correct for each period.
N/A There is a need to clearly distinguish equipment types within the Field device category as different equipment types that summate to the Field Devices Category come from varying source systems and use varying methodologies for reporting. Each element is extracted individually and summated to the overarching Field Devices Category. Within the Asset Group 'SCADA, NETWORK CONTROL AND PROTECTION SYSTEMS', Asset Category 'FIELD DEVICES' incorporates the following sub Asset Categories : - ZONE SUBSTATION RELAYS (ELECTROMECHANICAL) - ZONE SUBSTATION RELAYS (ELECTRONIC) - ZONE SUBSTATION RELAYS (DIGITAL) - ZONE SUBSTATION CONTROL - ZONE SUBSTATION RTU'S
CACP5.2BOP13 5.2 Asset Age Profile TABLE 5.2.1 - ASSET AGE PROFILE SCADA, NETWORK CONTROL AND PROTECTION SYSTEMS BY: Function - Field Devices [2017 - 1911]
Actual Data is Sourced from the Relay Setting Information System (RESIS). SAP project data is used to qualify RESIS data.
N/A Data is Sourced from the Relay Setting Information System (RESIS) via a report of 'Applied Settings' to determine new or changed relay settings. This 'applied setting' data is obtained for the calendar year and is then manually filtered to remove any applied setting updates relating to retained equipment. Data from SAP relating to projects during the period was also utilised to ensure additions and retirements were correct for each period.
N/A There is a need to clearly distinguish equipment types within the Field device category as different equipment types that summate to the Field Devices Category come from varying source systems and use varying methodologies for reporting. Each element is extracted individually and summated to the overarching Field Devices Category. Within the Asset Group 'SCADA, NETWORK CONTROL AND PROTECTION SYSTEMS', Asset Category 'FIELD DEVICES' incorporates the following sub Asset Categories : - ZONE SUBSTATION RELAYS (ELECTROMECHANICAL) - ZONE SUBSTATION RELAYS (ELECTRONIC) - ZONE SUBSTATION RELAYS (DIGITAL) - ZONE SUBSTATION CONTROL - ZONE SUBSTATION RTU'S
CACP5.2BOP14 5.2 Asset Age Profile TABLE 5.2.1 - ASSET AGE PROFILE Actual Data is Sourced from the Relay N/A Data is Sourced from the Relay Setting Information N/A There is a need to clearly distinguish

Citipower – Basis of Preparation – CA 114
SCADA, NETWORK CONTROL AND PROTECTION SYSTEMS BY: Function - Field Devices [2017 - 1911]
Setting Information System (RESIS). SAP project data is used to qualify RESIS data.
System (RESIS) via a report of 'Applied Settings' to determine new or changed relay settings. This 'applied setting' data is obtained for the calendar year and is then manually filtered to remove any applied setting updates relating to retained equipment. Data from SAP relating to projects during the period was also utilised to ensure additions and retirements were correct for each period.
equipment types within the Field device category as different equipment types that summate to the Field Devices Category come from varying source systems and use varying methodologies for reporting. Each element is extracted individually and summated to the overarching Field Devices Category. Within the Asset Group 'SCADA, NETWORK CONTROL AND PROTECTION SYSTEMS', Asset Category 'FIELD DEVICES' incorporates the following sub Asset Categories : - ZONE SUBSTATION RELAYS (ELECTROMECHANICAL) - ZONE SUBSTATION RELAYS (ELECTRONIC) - ZONE SUBSTATION RELAYS (DIGITAL) - ZONE SUBSTATION CONTROL - ZONE SUBSTATION RTU'S
CACP5.2BOP15 5.2 Asset Age Profile TABLE 5.2.1 - ASSET AGE PROFILE SCADA, NETWORK CONTROL AND PROTECTION SYSTEMS BY: Function - Field Devices [2017 - 1911]
Estimated Data is Sourced from the Relay Setting Information System (RESIS) and Zone Substation Drawing system (ProjectWise). Autodesk Vault from 2017.
Asset data in RESIS does not provide installation dates for all assets in this category and hence Autodesk Vault drawings were the only available record with approximate dates.
Asset details and quantities are obtained from the report of 'Applied Settings' for control equipment run from RESIS or through details gathered from zone substation drawings in Autodesk Vault (note, not all control equipment has a setting in RESIS and therefore Vault drawings are used). Assets are allocated across the years based on the drawing dates from Autodesk Vault. Project/drawing dates were considered approximate to the year of installation.
N/A There is a need to clearly distinguish equipment types within the Field device category as different equipment types that summate to the Field Devices Category come from varying source systems and use varying methodologies for reporting. Each element is extracted individually and summated to the overarching Field Devices Category. Within the Asset Group 'SCADA, NETWORK CONTROL AND PROTECTION SYSTEMS', Asset Category 'FIELD DEVICES' incorporates the following sub Asset Categories: - ZONE SUBSTATION RELAYS (ELECTROMECHANICAL) - ZONE SUBSTATION RELAYS (ELECTRONIC) - ZONE SUBSTATION RELAYS (DIGITAL) - ZONE SUBSTATION CONTROL - ZONE SUBSTATION RTU'S
CACP5.2BOP16 5.2 Asset Age Profile TABLE 5.2.1 - ASSET AGE PROFILE SCADA, NETWORK CONTROL AND PROTECTION SYSTEMS BY: Function - Field Devices [2017 - 1911]
Actual Data has been sourced from SCADA (PowerOn Fusion) via reports of all connected field devices.
N/A Based on SCADA Report of connected Field Devices run as at 31 Dec. Using information included in the reports, allocate field devices as either relating CitiPower or CitiPower and zone substations or distribution stations. The data as at 31 Dec is then compared to the same report from the previous year to identify the assets added in the year.
N/A There is a need to clearly distinguish equipment types within the Field device category as different equipment types that summate to the Field Devices Category come from varying source systems and use varying methodologies for reporting. Each element is extracted individually and summated to the overarching Field Devices Category. Within the Asset Group 'SCADA, NETWORK CONTROL AND PROTECTION SYSTEMS', Asset Category 'FIELD DEVICES' incorporates the following sub Asset Categories: - ZONE SUBSTATION RELAYS (ELECTROMECHANICAL) - ZONE SUBSTATION RELAYS (ELECTRONIC) - ZONE SUBSTATION RELAYS (DIGITAL) - ZONE SUBSTATION CONTROL - ZONE SUBSTATION RTU'S
CACP5.2BOP17 5.2 Asset Age Profile TABLE 5.2.1 - ASSET AGE PROFILE SCADA, NETWORK CONTROL AND
Actual Data has been sourced from SCADA (PowerOn Fusion) via reports of all
N/A Based on SCADA Report of Connected Field devices run as at 15 Feb 2018. Using information included in
N/A There has been a notable drop in specific legacy equipment types because of the

Citipower – Basis of Preparation – CA 115
PROTECTION SYSTEMS BY: Function - Communications Network Assets [2017 - 1911]
connected field devices. SAP project data is used to qualify SCADA reports for 2011 and earlier.
the reports field devices are allocated as either relating to CitiPower or Powercor and zone substations or distribution stations. The data as at 15 Feb 2018 is then compared to the same report from the previous year to identify the assets added in each year.
ongoing modernisation program. The mandated change from Telstra 2G to 3G has seen replacements in the last of TMR communications along with the removal of discarded RTU equipment in CitiPower. These reductions are complemented with growth in present generation equipment denoted at 'Switch CAB (Cabinet)' in the CitiPower counts. Similarly so with Collector RTUs. There is a need to clearly distinguish equipment types within the Communication Network Assets category as different equipment types that summate to the Communication Network Assets Category come from varying source systems and use varying methodologies for reporting. Each element is extracted individually and summated to the overarching Communication Network Assets Category. Within the Asset Group 'SCADA, NETWORK CONTROL AND PROTECTION SYSTEMS', Asset Category 'COMMUNICATION NETWORK ASSETS' incorporates the following sub Asset Categories: - DISTRIBUTION RTU'S - DISTRIBUTION FIELD DEVICE COMMUNICATIONS
CACP5.2BOP18 5.2 Asset Age Profile TABLE 5.2.1 - ASSET AGE PROFILE SCADA, NETWORK CONTROL AND PROTECTION SYSTEMS BY: Function - Local Network Wiring Assets [2017 - 1911] SCADA, NETWORK CONTROL AND PROTECTION SYSTEMS BY: Function - AFLC [2017 - 1911] SCADA, NETWORK CONTROL AND PROTECTION SYSTEMS BY: Function - Other [2017 - 1911]
Actual CitiPower does not collect this data in any system. Local Network Wiring is always associated with Protection or Control systems and tested and replaced with these systems and is not replaced in isolation.
N/A CitiPower does not collect this data in any system. Local Network Wiring is always associated with Protection or Control systems and tested and replaced with these systems and is not replaced in isolation.
N/A CitiPower does not record separately identifiable data relating to Local Network Wiring Assets within SCADA, Network, Control and Protection Systems as wiring components are included within other asset types e.g. RTUs and Relays. Further, estimation techniques were considered impossible due to the lack of data and immeasurable number of assumptions required. CitiPower does not record separately identifiable data relating to AFLC assets.
CACP5.2BOP19 5.2 Asset Age Profile TABLE 5.2.1 - ASSET AGE PROFILE SCADA, NETWORK CONTROL AND PROTECTION SYSTEMS BY: Function - Communications Site Infrastructure [2017 - 1911]
Actual Data has been sourced from drawings within ProjectWise drawing management system for historical data. In the case of cable based Analogue communications, a data base is used to track and manage change. This system is interrogated for each annual report.
N/A Details of all zone substation equipment and equipment types relating to this asset category were extracted from ProjectWise and the Cable Data base. For Radio equipment Purchase dates for equipment types were established from ProjectWise or engineering experience. For Analogue cable plant the database is used to manage all change and is interrogated each year and compared to the previous year to identify change. Equipment has been allocated for earlier years based on the equipment types and known purchase dates. Where equipment types were purchased over a time period the middle date of the period was used as an install date. Additional projects were tracked for subsequent years and updated as required.
N/A There is a need to clearly distinguish equipment types within the Communications Site Infrastructure category as different equipment types that summate to Communications Site Infrastructure Category come from varying source systems and use varying methodologies for reporting. Each element is extracted individually and summated to the overarching Communications Site Infrastructure Category. Within the Asset Group 'SCADA, NETWORK CONTROL AND PROTECTION SYSTEMS', Asset Category 'COMMUNICATIONS SITE INFRASTRUCTURE' incorporates the following sub Asset Categories: - ZONE SUBSTATION ANALOGUE COMMUNICATION - ZONE SUBSTATION DIGITAL COMMUNICATION
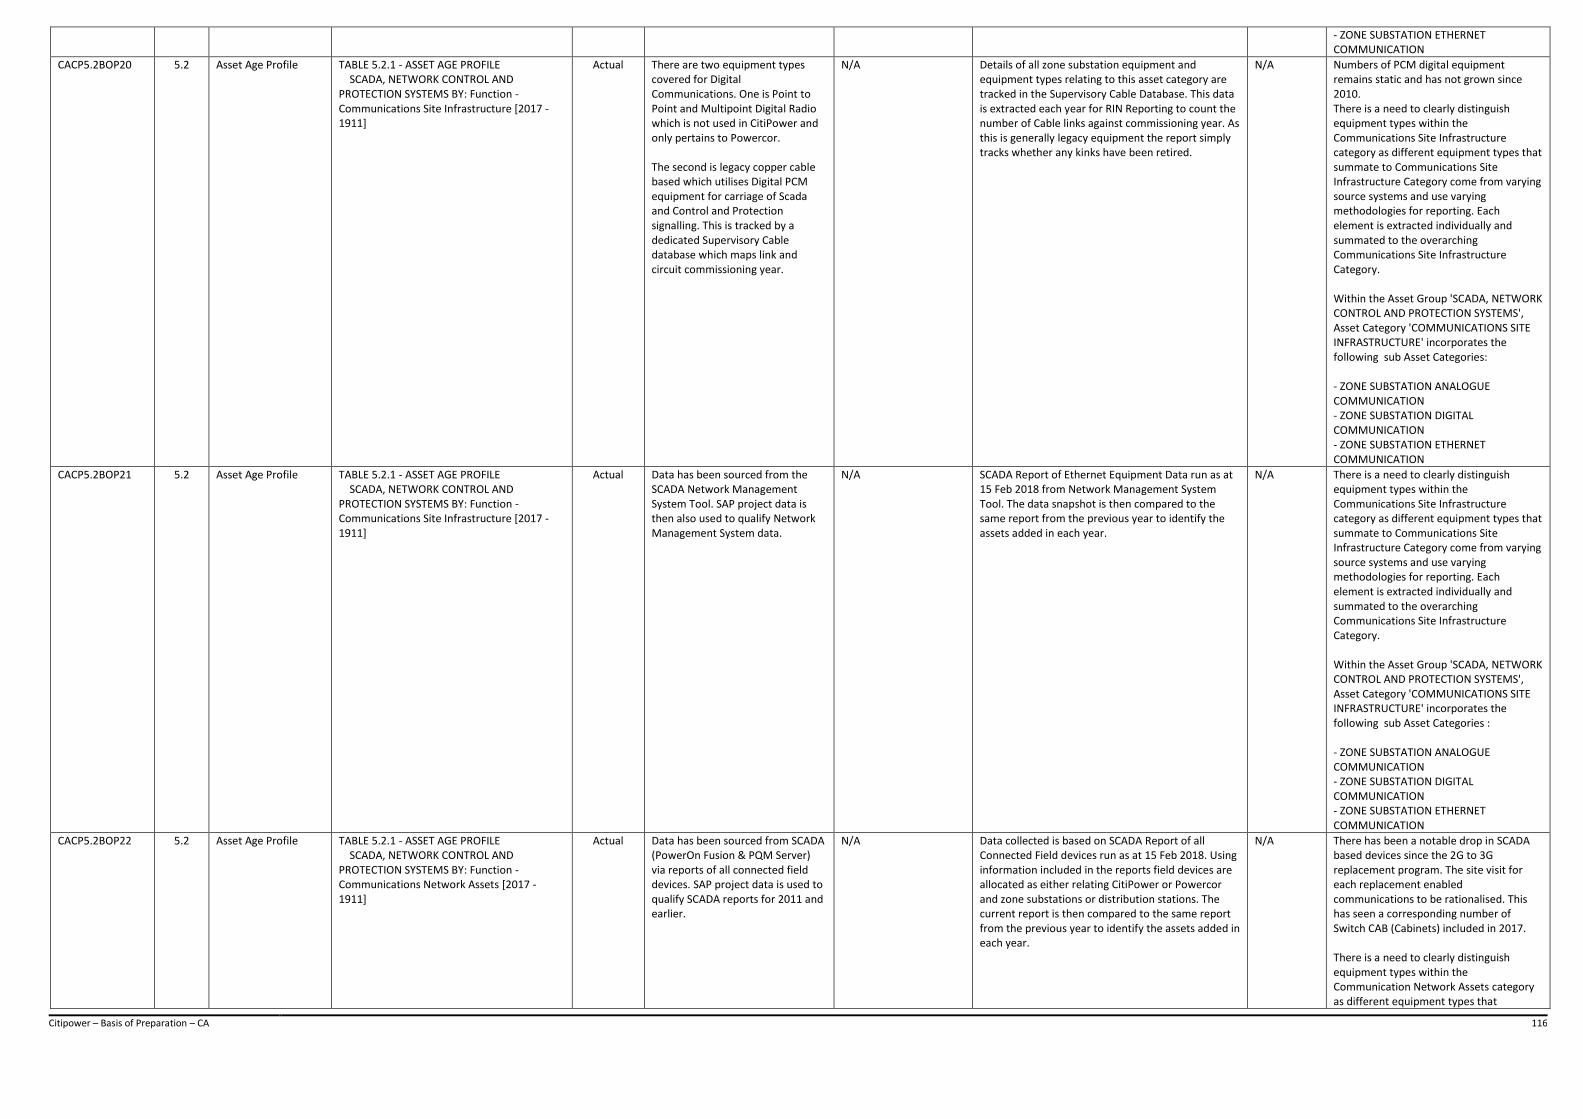
Citipower – Basis of Preparation – CA 116
- ZONE SUBSTATION ETHERNET COMMUNICATION
CACP5.2BOP20 5.2 Asset Age Profile TABLE 5.2.1 - ASSET AGE PROFILE SCADA, NETWORK CONTROL AND PROTECTION SYSTEMS BY: Function - Communications Site Infrastructure [2017 - 1911]
Actual There are two equipment types covered for Digital Communications. One is Point to Point and Multipoint Digital Radio which is not used in CitiPower and only pertains to Powercor. The second is legacy copper cable based which utilises Digital PCM equipment for carriage of Scada and Control and Protection signalling. This is tracked by a dedicated Supervisory Cable database which maps link and circuit commissioning year.
N/A Details of all zone substation equipment and equipment types relating to this asset category are tracked in the Supervisory Cable Database. This data is extracted each year for RIN Reporting to count the number of Cable links against commissioning year. As this is generally legacy equipment the report simply tracks whether any kinks have been retired.
N/A Numbers of PCM digital equipment remains static and has not grown since 2010. There is a need to clearly distinguish equipment types within the Communications Site Infrastructure category as different equipment types that summate to Communications Site Infrastructure Category come from varying source systems and use varying methodologies for reporting. Each element is extracted individually and summated to the overarching Communications Site Infrastructure Category. Within the Asset Group 'SCADA, NETWORK CONTROL AND PROTECTION SYSTEMS', Asset Category 'COMMUNICATIONS SITE INFRASTRUCTURE' incorporates the following sub Asset Categories: - ZONE SUBSTATION ANALOGUE COMMUNICATION - ZONE SUBSTATION DIGITAL COMMUNICATION - ZONE SUBSTATION ETHERNET COMMUNICATION
CACP5.2BOP21 5.2 Asset Age Profile TABLE 5.2.1 - ASSET AGE PROFILE SCADA, NETWORK CONTROL AND PROTECTION SYSTEMS BY: Function - Communications Site Infrastructure [2017 - 1911]
Actual Data has been sourced from the SCADA Network Management System Tool. SAP project data is then also used to qualify Network Management System data.
N/A SCADA Report of Ethernet Equipment Data run as at 15 Feb 2018 from Network Management System Tool. The data snapshot is then compared to the same report from the previous year to identify the assets added in each year.
N/A There is a need to clearly distinguish equipment types within the Communications Site Infrastructure category as different equipment types that summate to Communications Site Infrastructure Category come from varying source systems and use varying methodologies for reporting. Each element is extracted individually and summated to the overarching Communications Site Infrastructure Category. Within the Asset Group 'SCADA, NETWORK CONTROL AND PROTECTION SYSTEMS', Asset Category 'COMMUNICATIONS SITE INFRASTRUCTURE' incorporates the following sub Asset Categories : - ZONE SUBSTATION ANALOGUE COMMUNICATION - ZONE SUBSTATION DIGITAL COMMUNICATION - ZONE SUBSTATION ETHERNET COMMUNICATION
CACP5.2BOP22 5.2 Asset Age Profile TABLE 5.2.1 - ASSET AGE PROFILE SCADA, NETWORK CONTROL AND PROTECTION SYSTEMS BY: Function - Communications Network Assets [2017 - 1911]
Actual Data has been sourced from SCADA (PowerOn Fusion & PQM Server) via reports of all connected field devices. SAP project data is used to qualify SCADA reports for 2011 and earlier.
N/A Data collected is based on SCADA Report of all Connected Field devices run as at 15 Feb 2018. Using information included in the reports field devices are allocated as either relating CitiPower or Powercor and zone substations or distribution stations. The current report is then compared to the same report from the previous year to identify the assets added in each year.
N/A There has been a notable drop in SCADA based devices since the 2G to 3G replacement program. The site visit for each replacement enabled communications to be rationalised. This has seen a corresponding number of Switch CAB (Cabinets) included in 2017. There is a need to clearly distinguish equipment types within the Communication Network Assets category as different equipment types that
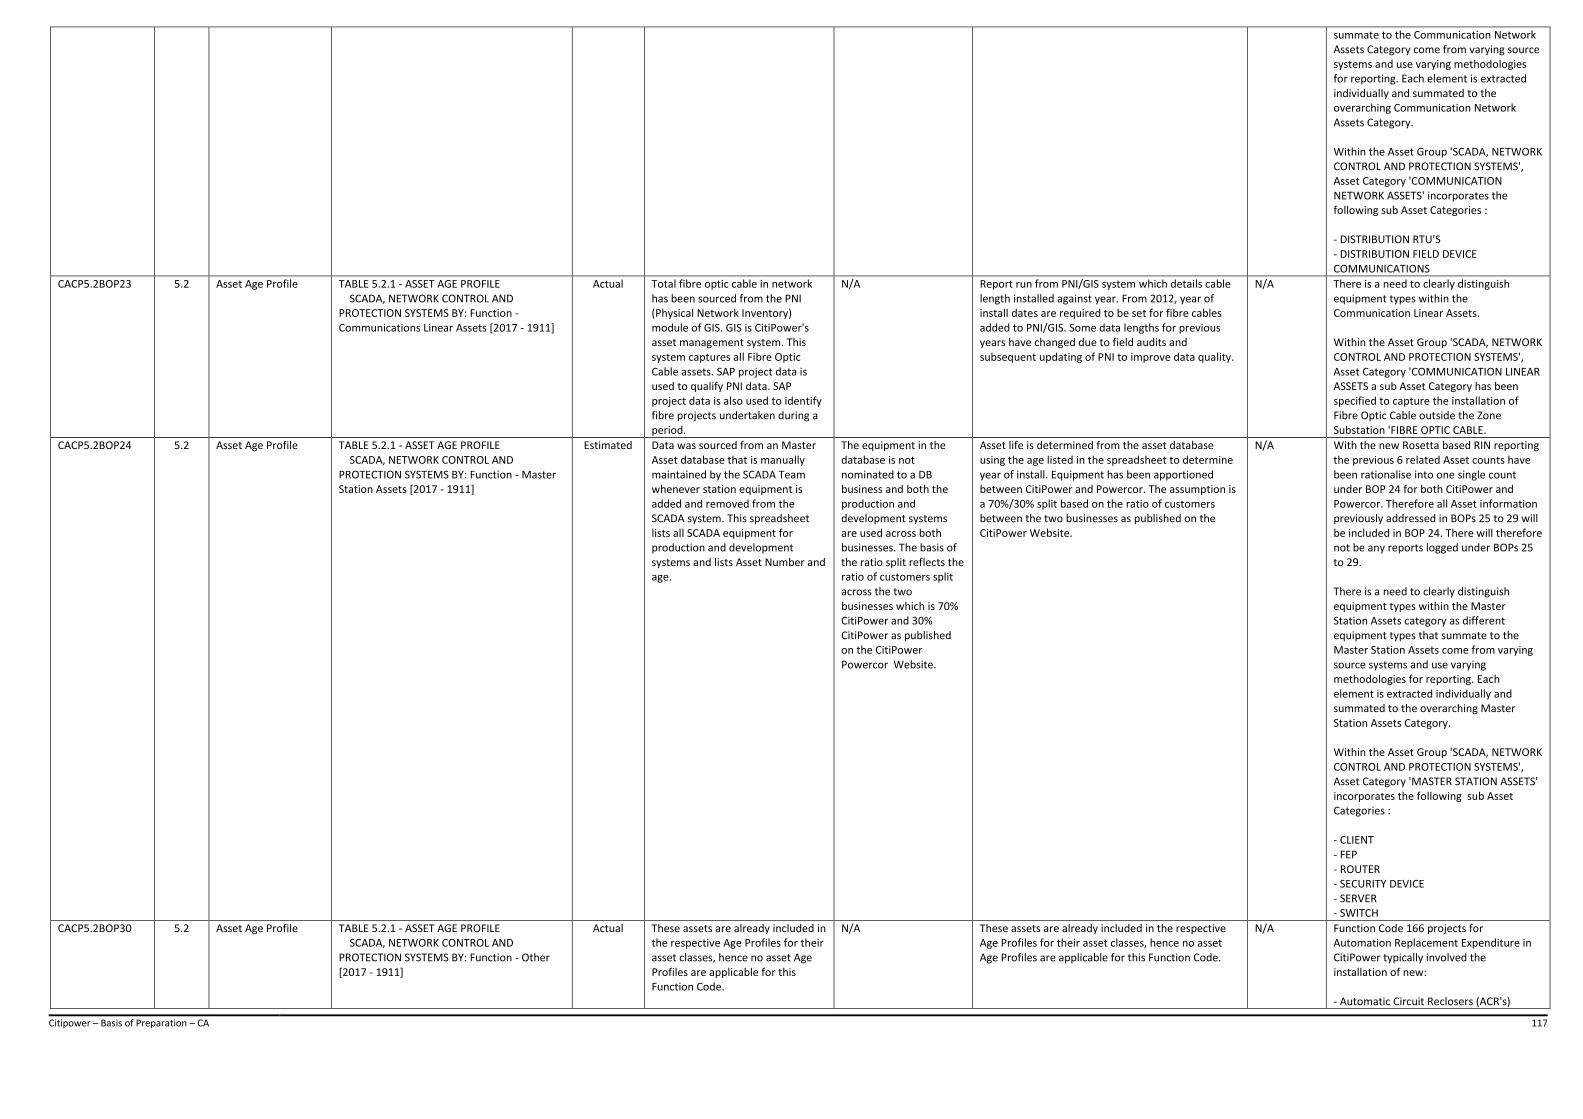
Citipower – Basis of Preparation – CA 117
summate to the Communication Network Assets Category come from varying source systems and use varying methodologies for reporting. Each element is extracted individually and summated to the overarching Communication Network Assets Category. Within the Asset Group 'SCADA, NETWORK CONTROL AND PROTECTION SYSTEMS', Asset Category 'COMMUNICATION NETWORK ASSETS' incorporates the following sub Asset Categories : - DISTRIBUTION RTU'S - DISTRIBUTION FIELD DEVICE COMMUNICATIONS
CACP5.2BOP23 5.2 Asset Age Profile TABLE 5.2.1 - ASSET AGE PROFILE SCADA, NETWORK CONTROL AND PROTECTION SYSTEMS BY: Function - Communications Linear Assets [2017 - 1911]
Actual Total fibre optic cable in network has been sourced from the PNI (Physical Network Inventory) module of GIS. GIS is CitiPower's asset management system. This system captures all Fibre Optic Cable assets. SAP project data is used to qualify PNI data. SAP project data is also used to identify fibre projects undertaken during a period.
N/A Report run from PNI/GIS system which details cable length installed against year. From 2012, year of install dates are required to be set for fibre cables added to PNI/GIS. Some data lengths for previous years have changed due to field audits and subsequent updating of PNI to improve data quality.
N/A There is a need to clearly distinguish equipment types within the Communication Linear Assets. Within the Asset Group 'SCADA, NETWORK CONTROL AND PROTECTION SYSTEMS', Asset Category 'COMMUNICATION LINEAR ASSETS a sub Asset Category has been specified to capture the installation of Fibre Optic Cable outside the Zone Substation 'FIBRE OPTIC CABLE.
CACP5.2BOP24 5.2 Asset Age Profile TABLE 5.2.1 - ASSET AGE PROFILE SCADA, NETWORK CONTROL AND PROTECTION SYSTEMS BY: Function - Master Station Assets [2017 - 1911]
Estimated Data was sourced from an Master Asset database that is manually maintained by the SCADA Team whenever station equipment is added and removed from the SCADA system. This spreadsheet lists all SCADA equipment for production and development systems and lists Asset Number and age.
The equipment in the database is not nominated to a DB business and both the production and development systems are used across both businesses. The basis of the ratio split reflects the ratio of customers split across the two businesses which is 70% CitiPower and 30% CitiPower as published on the CitiPower Powercor Website.
Asset life is determined from the asset database using the age listed in the spreadsheet to determine year of install. Equipment has been apportioned between CitiPower and Powercor. The assumption is a 70%/30% split based on the ratio of customers between the two businesses as published on the CitiPower Website.
N/A With the new Rosetta based RIN reporting the previous 6 related Asset counts have been rationalise into one single count under BOP 24 for both CitiPower and Powercor. Therefore all Asset information previously addressed in BOPs 25 to 29 will be included in BOP 24. There will therefore not be any reports logged under BOPs 25 to 29. There is a need to clearly distinguish equipment types within the Master Station Assets category as different equipment types that summate to the Master Station Assets come from varying source systems and use varying methodologies for reporting. Each element is extracted individually and summated to the overarching Master Station Assets Category. Within the Asset Group 'SCADA, NETWORK CONTROL AND PROTECTION SYSTEMS', Asset Category 'MASTER STATION ASSETS' incorporates the following sub Asset Categories : - CLIENT - FEP - ROUTER - SECURITY DEVICE - SERVER - SWITCH
CACP5.2BOP30 5.2 Asset Age Profile TABLE 5.2.1 - ASSET AGE PROFILE SCADA, NETWORK CONTROL AND PROTECTION SYSTEMS BY: Function - Other [2017 - 1911]
Actual These assets are already included in the respective Age Profiles for their asset classes, hence no asset Age Profiles are applicable for this Function Code.
N/A These assets are already included in the respective Age Profiles for their asset classes, hence no asset Age Profiles are applicable for this Function Code.
N/A Function Code 166 projects for Automation Replacement Expenditure in CitiPower typically involved the installation of new: - Automatic Circuit Reclosers (ACR's)
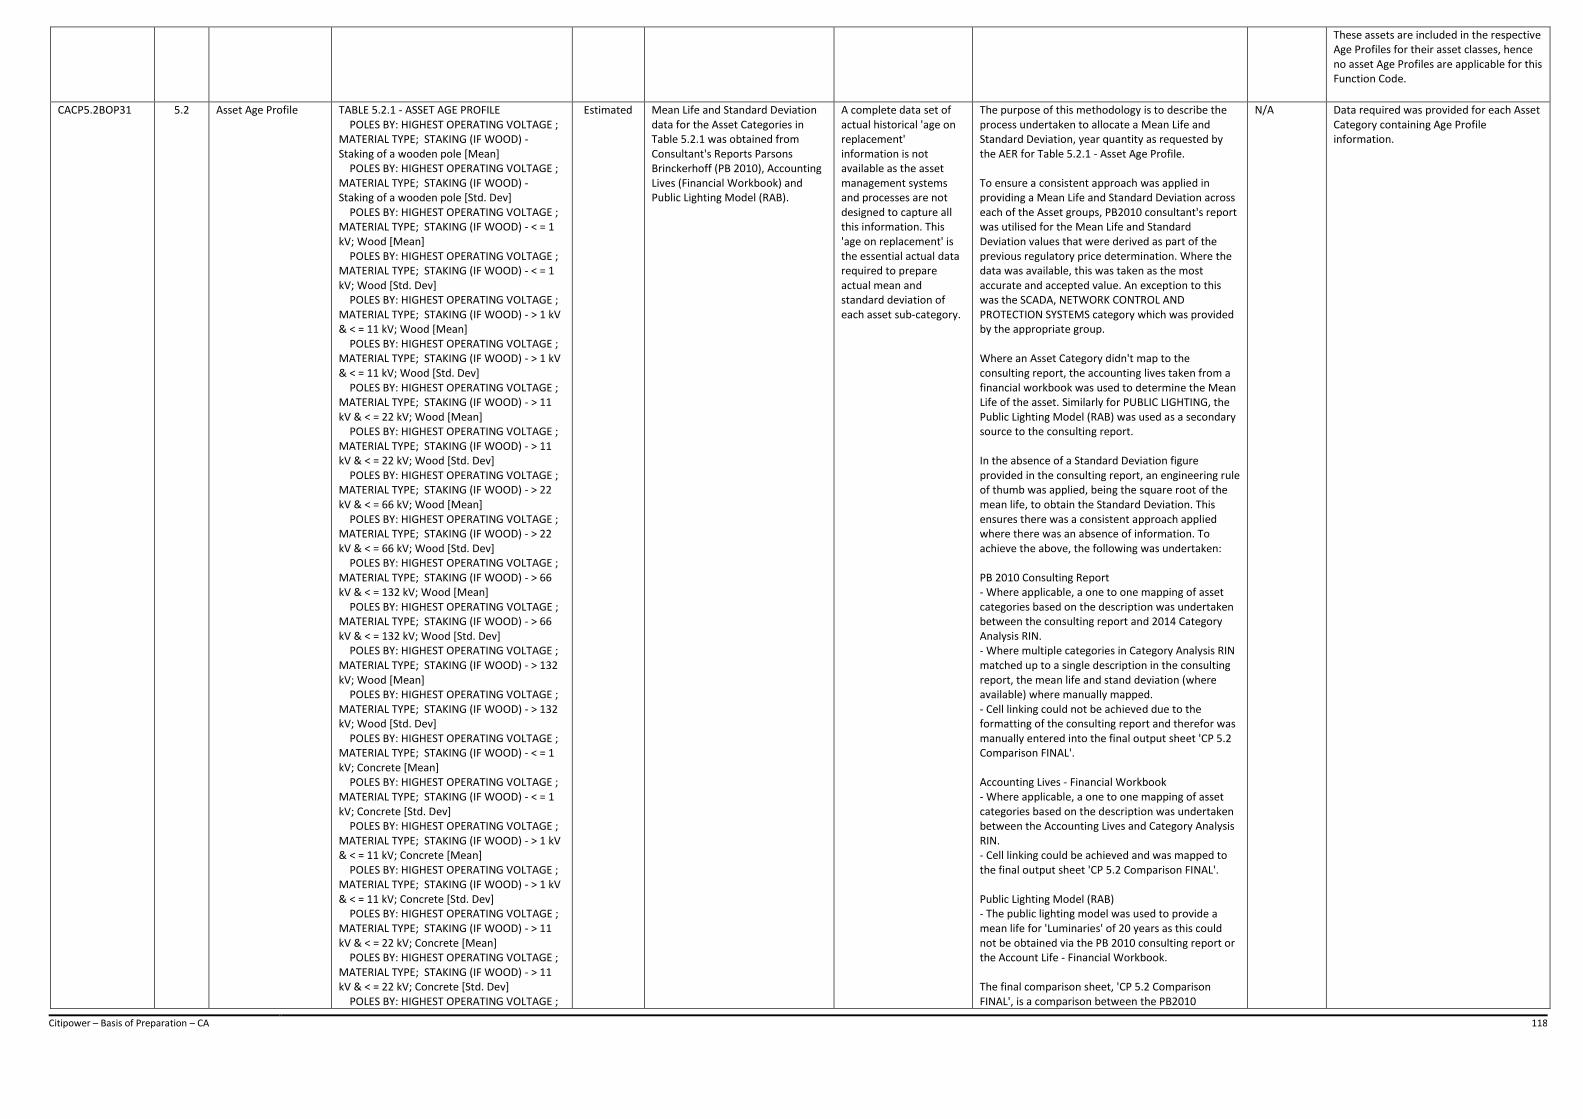
Citipower – Basis of Preparation – CA 118
These assets are included in the respective Age Profiles for their asset classes, hence no asset Age Profiles are applicable for this Function Code.
CACP5.2BOP31 5.2 Asset Age Profile TABLE 5.2.1 - ASSET AGE PROFILE POLES BY: HIGHEST OPERATING VOLTAGE ; MATERIAL TYPE; STAKING (IF WOOD) - Staking of a wooden pole [Mean] POLES BY: HIGHEST OPERATING VOLTAGE ; MATERIAL TYPE; STAKING (IF WOOD) - Staking of a wooden pole [Std. Dev] POLES BY: HIGHEST OPERATING VOLTAGE ; MATERIAL TYPE; STAKING (IF WOOD) - < = 1 kV; Wood [Mean] POLES BY: HIGHEST OPERATING VOLTAGE ; MATERIAL TYPE; STAKING (IF WOOD) - < = 1 kV; Wood [Std. Dev] POLES BY: HIGHEST OPERATING VOLTAGE ; MATERIAL TYPE; STAKING (IF WOOD) - > 1 kV & < = 11 kV; Wood [Mean] POLES BY: HIGHEST OPERATING VOLTAGE ; MATERIAL TYPE; STAKING (IF WOOD) - > 1 kV & < = 11 kV; Wood [Std. Dev] POLES BY: HIGHEST OPERATING VOLTAGE ; MATERIAL TYPE; STAKING (IF WOOD) - > 11 kV & < = 22 kV; Wood [Mean] POLES BY: HIGHEST OPERATING VOLTAGE ; MATERIAL TYPE; STAKING (IF WOOD) - > 11 kV & < = 22 kV; Wood [Std. Dev] POLES BY: HIGHEST OPERATING VOLTAGE ; MATERIAL TYPE; STAKING (IF WOOD) - > 22 kV & < = 66 kV; Wood [Mean] POLES BY: HIGHEST OPERATING VOLTAGE ; MATERIAL TYPE; STAKING (IF WOOD) - > 22 kV & < = 66 kV; Wood [Std. Dev] POLES BY: HIGHEST OPERATING VOLTAGE ; MATERIAL TYPE; STAKING (IF WOOD) - > 66 kV & < = 132 kV; Wood [Mean] POLES BY: HIGHEST OPERATING VOLTAGE ; MATERIAL TYPE; STAKING (IF WOOD) - > 66 kV & < = 132 kV; Wood [Std. Dev] POLES BY: HIGHEST OPERATING VOLTAGE ; MATERIAL TYPE; STAKING (IF WOOD) - > 132 kV; Wood [Mean] POLES BY: HIGHEST OPERATING VOLTAGE ; MATERIAL TYPE; STAKING (IF WOOD) - > 132 kV; Wood [Std. Dev] POLES BY: HIGHEST OPERATING VOLTAGE ; MATERIAL TYPE; STAKING (IF WOOD) - < = 1 kV; Concrete [Mean] POLES BY: HIGHEST OPERATING VOLTAGE ; MATERIAL TYPE; STAKING (IF WOOD) - < = 1 kV; Concrete [Std. Dev] POLES BY: HIGHEST OPERATING VOLTAGE ; MATERIAL TYPE; STAKING (IF WOOD) - > 1 kV & < = 11 kV; Concrete [Mean] POLES BY: HIGHEST OPERATING VOLTAGE ; MATERIAL TYPE; STAKING (IF WOOD) - > 1 kV & < = 11 kV; Concrete [Std. Dev] POLES BY: HIGHEST OPERATING VOLTAGE ; MATERIAL TYPE; STAKING (IF WOOD) - > 11 kV & < = 22 kV; Concrete [Mean] POLES BY: HIGHEST OPERATING VOLTAGE ; MATERIAL TYPE; STAKING (IF WOOD) - > 11 kV & < = 22 kV; Concrete [Std. Dev] POLES BY: HIGHEST OPERATING VOLTAGE ;
Estimated Mean Life and Standard Deviation data for the Asset Categories in Table 5.2.1 was obtained from Consultant's Reports Parsons Brinckerhoff (PB 2010), Accounting Lives (Financial Workbook) and Public Lighting Model (RAB).
A complete data set of actual historical 'age on replacement' information is not available as the asset management systems and processes are not designed to capture all this information. This 'age on replacement' is the essential actual data required to prepare actual mean and standard deviation of each asset sub-category.
The purpose of this methodology is to describe the process undertaken to allocate a Mean Life and Standard Deviation, year quantity as requested by the AER for Table 5.2.1 - Asset Age Profile. To ensure a consistent approach was applied in providing a Mean Life and Standard Deviation across each of the Asset groups, PB2010 consultant's report was utilised for the Mean Life and Standard Deviation values that were derived as part of the previous regulatory price determination. Where the data was available, this was taken as the most accurate and accepted value. An exception to this was the SCADA, NETWORK CONTROL AND PROTECTION SYSTEMS category which was provided by the appropriate group. Where an Asset Category didn't map to the consulting report, the accounting lives taken from a financial workbook was used to determine the Mean Life of the asset. Similarly for PUBLIC LIGHTING, the Public Lighting Model (RAB) was used as a secondary source to the consulting report. In the absence of a Standard Deviation figure provided in the consulting report, an engineering rule of thumb was applied, being the square root of the mean life, to obtain the Standard Deviation. This ensures there was a consistent approach applied where there was an absence of information. To achieve the above, the following was undertaken: PB 2010 Consulting Report - Where applicable, a one to one mapping of asset categories based on the description was undertaken between the consulting report and 2014 Category Analysis RIN. - Where multiple categories in Category Analysis RIN matched up to a single description in the consulting report, the mean life and stand deviation (where available) where manually mapped. - Cell linking could not be achieved due to the formatting of the consulting report and therefor was manually entered into the final output sheet 'CP 5.2 Comparison FINAL'. Accounting Lives - Financial Workbook - Where applicable, a one to one mapping of asset categories based on the description was undertaken between the Accounting Lives and Category Analysis RIN. - Cell linking could be achieved and was mapped to the final output sheet 'CP 5.2 Comparison FINAL'. Public Lighting Model (RAB) - The public lighting model was used to provide a mean life for 'Luminaries' of 20 years as this could not be obtained via the PB 2010 consulting report or the Account Life - Financial Workbook. The final comparison sheet, 'CP 5.2 Comparison FINAL', is a comparison between the PB2010
N/A Data required was provided for each Asset Category containing Age Profile information.

Citipower – Basis of Preparation – CA 119
MATERIAL TYPE; STAKING (IF WOOD) - > 22 kV & < = 66 kV; Concrete [Mean] POLES BY: HIGHEST OPERATING VOLTAGE ; MATERIAL TYPE; STAKING (IF WOOD) - > 22 kV & < = 66 kV; Concrete [Std. Dev] POLES BY: HIGHEST OPERATING VOLTAGE ; MATERIAL TYPE; STAKING (IF WOOD) - > 66 kV & < = 132 kV; Concrete [Mean] POLES BY: HIGHEST OPERATING VOLTAGE ; MATERIAL TYPE; STAKING (IF WOOD) - > 66 kV & < = 132 kV; Concrete [Std. Dev] POLES BY: HIGHEST OPERATING VOLTAGE ; MATERIAL TYPE; STAKING (IF WOOD) - > 132 kV; Concrete [Mean] POLES BY: HIGHEST OPERATING VOLTAGE ; MATERIAL TYPE; STAKING (IF WOOD) - > 132 kV; Concrete [Std. Dev] POLES BY: HIGHEST OPERATING VOLTAGE ; MATERIAL TYPE; STAKING (IF WOOD) - < = 1 kV; Steel [Mean] POLES BY: HIGHEST OPERATING VOLTAGE ; MATERIAL TYPE; STAKING (IF WOOD) - < = 1 kV; Steel [Std. Dev] POLES BY: HIGHEST OPERATING VOLTAGE ; MATERIAL TYPE; STAKING (IF WOOD) - > 1 kV & < = 11 kV; Steel [Mean] POLES BY: HIGHEST OPERATING VOLTAGE ; MATERIAL TYPE; STAKING (IF WOOD) - > 1 kV & < = 11 kV; Steel [Std. Dev] POLES BY: HIGHEST OPERATING VOLTAGE ; MATERIAL TYPE; STAKING (IF WOOD) - > 11 kV & < = 22 kV; Steel [Mean] POLES BY: HIGHEST OPERATING VOLTAGE ; MATERIAL TYPE; STAKING (IF WOOD) - > 11 kV & < = 22 kV; Steel [Std. Dev] POLES BY: HIGHEST OPERATING VOLTAGE ; MATERIAL TYPE; STAKING (IF WOOD) - > 22 kV & < = 66 kV; Steel [Mean] POLES BY: HIGHEST OPERATING VOLTAGE ; MATERIAL TYPE; STAKING (IF WOOD) - > 22 kV & < = 66 kV; Steel [Std. Dev] POLES BY: HIGHEST OPERATING VOLTAGE ; MATERIAL TYPE; STAKING (IF WOOD) - > 66 kV & < = 132 kV; Steel [Mean] POLES BY: HIGHEST OPERATING VOLTAGE ; MATERIAL TYPE; STAKING (IF WOOD) - > 66 kV & < = 132 kV; Steel [Std. Dev] POLES BY: HIGHEST OPERATING VOLTAGE ; MATERIAL TYPE; STAKING (IF WOOD) - > 132 kV; Steel [Mean] POLES BY: HIGHEST OPERATING VOLTAGE ; MATERIAL TYPE; STAKING (IF WOOD) - > 132 kV; Steel [Std. Dev] POLES BY: HIGHEST OPERATING VOLTAGE ; MATERIAL TYPE; STAKING (IF WOOD) - Other [Mean] POLES BY: HIGHEST OPERATING VOLTAGE ; MATERIAL TYPE; STAKING (IF WOOD) - Other [Std. Dev] OVERHEAD CONDUCTORS BY: HIGHEST OPERATING VOLTAGE; NUMBER OF PHASES (AT HV) - < = 1 kV [Mean] OVERHEAD CONDUCTORS BY: HIGHEST OPERATING VOLTAGE; NUMBER OF PHASES (AT HV) - < = 1 kV [Std. Dev] OVERHEAD CONDUCTORS BY: HIGHEST OPERATING VOLTAGE; NUMBER OF PHASES
consulting report values and the Accounting Lives as a result of the category mapping. Column D (Mean Life) and Column E (Standard Deviation) contains a formula which selects the required value based on whether a value exists from the PB2010 consulting report. If a value didn't exist from the PB2010 consulting report, then the accounting life was selected along with the standard deviation calculated by the square root calculation.
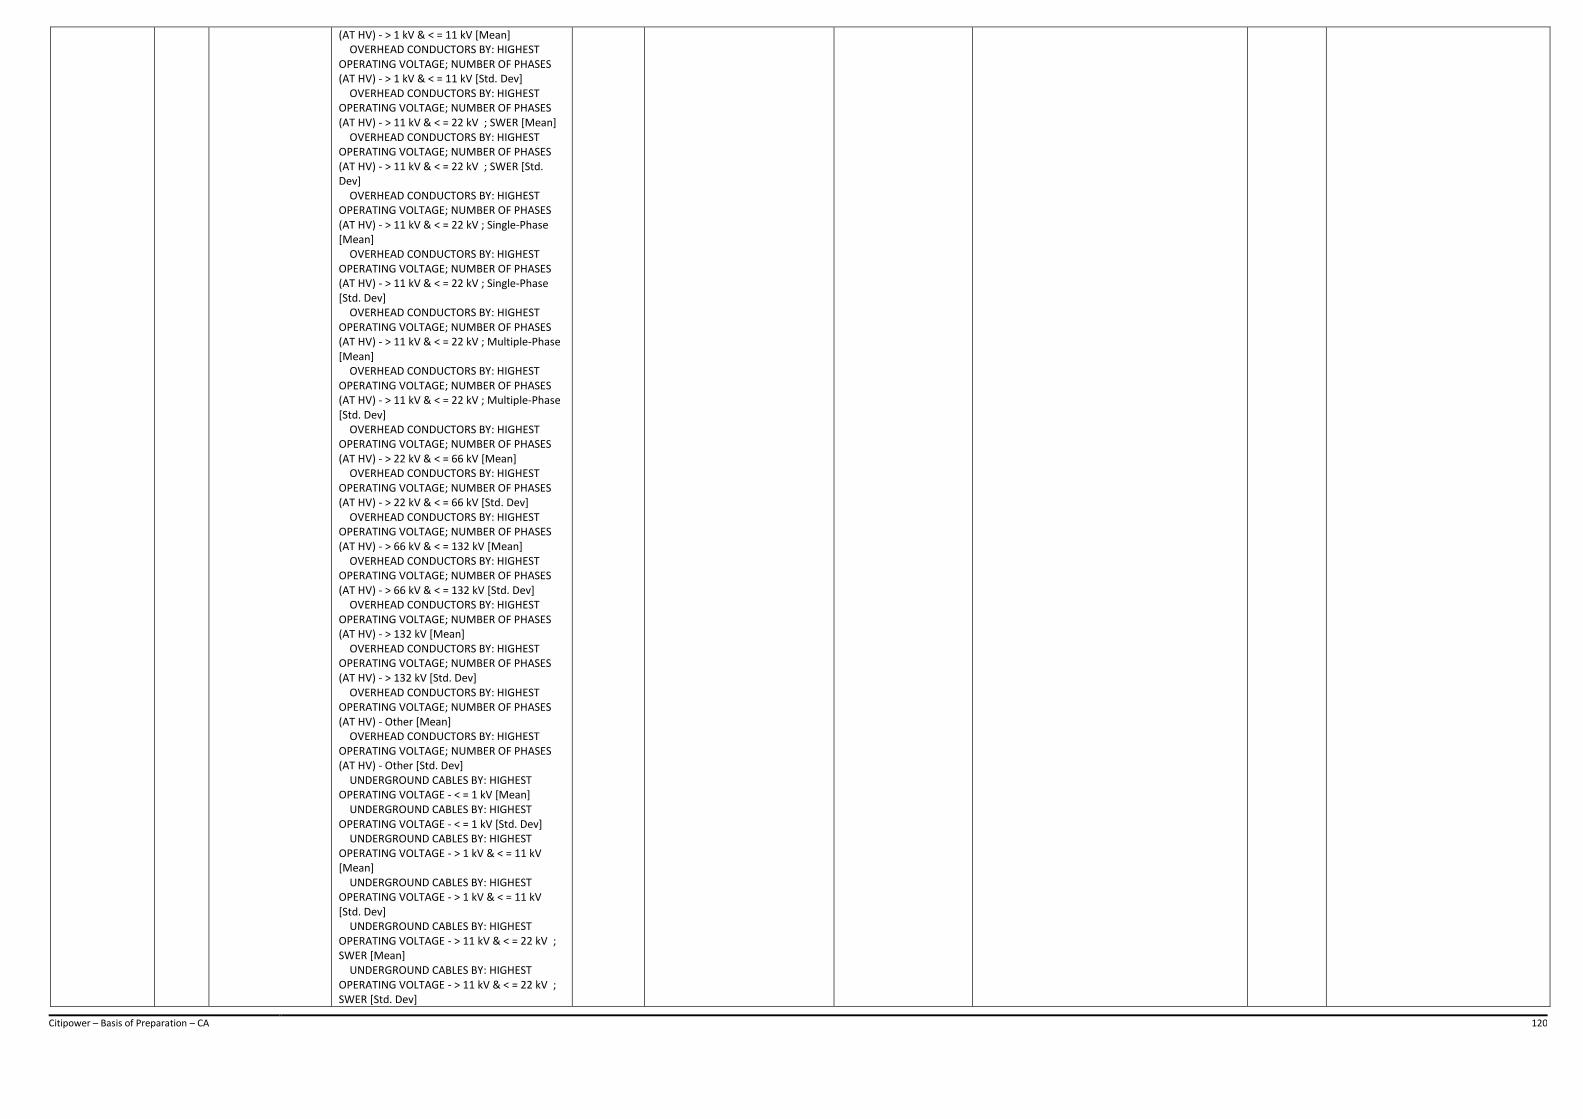
Citipower – Basis of Preparation – CA 120
(AT HV) - > 1 kV & < = 11 kV [Mean] OVERHEAD CONDUCTORS BY: HIGHEST OPERATING VOLTAGE; NUMBER OF PHASES (AT HV) - > 1 kV & < = 11 kV [Std. Dev] OVERHEAD CONDUCTORS BY: HIGHEST OPERATING VOLTAGE; NUMBER OF PHASES (AT HV) - > 11 kV & < = 22 kV ; SWER [Mean] OVERHEAD CONDUCTORS BY: HIGHEST OPERATING VOLTAGE; NUMBER OF PHASES (AT HV) - > 11 kV & < = 22 kV ; SWER [Std. Dev] OVERHEAD CONDUCTORS BY: HIGHEST OPERATING VOLTAGE; NUMBER OF PHASES (AT HV) - > 11 kV & < = 22 kV ; Single-Phase [Mean] OVERHEAD CONDUCTORS BY: HIGHEST OPERATING VOLTAGE; NUMBER OF PHASES (AT HV) - > 11 kV & < = 22 kV ; Single-Phase [Std. Dev] OVERHEAD CONDUCTORS BY: HIGHEST OPERATING VOLTAGE; NUMBER OF PHASES (AT HV) - > 11 kV & < = 22 kV ; Multiple-Phase [Mean] OVERHEAD CONDUCTORS BY: HIGHEST OPERATING VOLTAGE; NUMBER OF PHASES (AT HV) - > 11 kV & < = 22 kV ; Multiple-Phase [Std. Dev] OVERHEAD CONDUCTORS BY: HIGHEST OPERATING VOLTAGE; NUMBER OF PHASES (AT HV) - > 22 kV & < = 66 kV [Mean] OVERHEAD CONDUCTORS BY: HIGHEST OPERATING VOLTAGE; NUMBER OF PHASES (AT HV) - > 22 kV & < = 66 kV [Std. Dev] OVERHEAD CONDUCTORS BY: HIGHEST OPERATING VOLTAGE; NUMBER OF PHASES (AT HV) - > 66 kV & < = 132 kV [Mean] OVERHEAD CONDUCTORS BY: HIGHEST OPERATING VOLTAGE; NUMBER OF PHASES (AT HV) - > 66 kV & < = 132 kV [Std. Dev] OVERHEAD CONDUCTORS BY: HIGHEST OPERATING VOLTAGE; NUMBER OF PHASES (AT HV) - > 132 kV [Mean] OVERHEAD CONDUCTORS BY: HIGHEST OPERATING VOLTAGE; NUMBER OF PHASES (AT HV) - > 132 kV [Std. Dev] OVERHEAD CONDUCTORS BY: HIGHEST OPERATING VOLTAGE; NUMBER OF PHASES (AT HV) - Other [Mean] OVERHEAD CONDUCTORS BY: HIGHEST OPERATING VOLTAGE; NUMBER OF PHASES (AT HV) - Other [Std. Dev] UNDERGROUND CABLES BY: HIGHEST OPERATING VOLTAGE - < = 1 kV [Mean] UNDERGROUND CABLES BY: HIGHEST OPERATING VOLTAGE - < = 1 kV [Std. Dev] UNDERGROUND CABLES BY: HIGHEST OPERATING VOLTAGE - > 1 kV & < = 11 kV [Mean] UNDERGROUND CABLES BY: HIGHEST OPERATING VOLTAGE - > 1 kV & < = 11 kV [Std. Dev] UNDERGROUND CABLES BY: HIGHEST OPERATING VOLTAGE - > 11 kV & < = 22 kV ; SWER [Mean] UNDERGROUND CABLES BY: HIGHEST OPERATING VOLTAGE - > 11 kV & < = 22 kV ; SWER [Std. Dev]
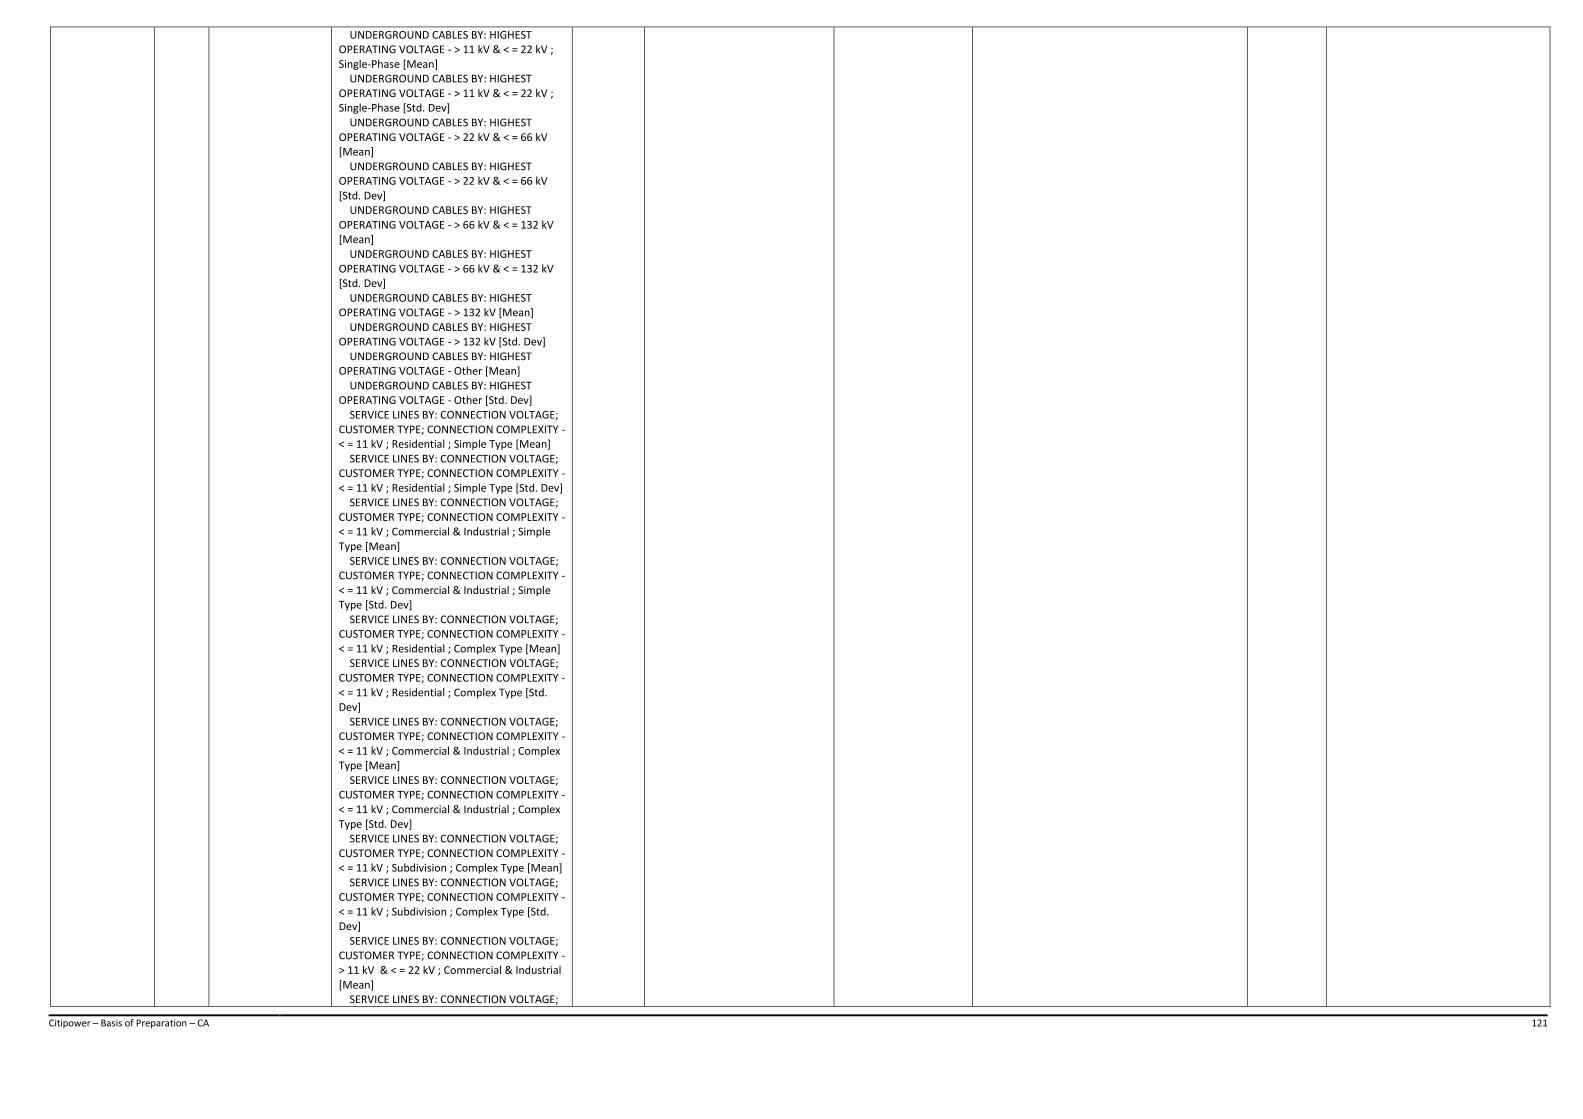
Citipower – Basis of Preparation – CA 121
UNDERGROUND CABLES BY: HIGHEST OPERATING VOLTAGE - > 11 kV & < = 22 kV ; Single-Phase [Mean] UNDERGROUND CABLES BY: HIGHEST OPERATING VOLTAGE - > 11 kV & < = 22 kV ; Single-Phase [Std. Dev] UNDERGROUND CABLES BY: HIGHEST OPERATING VOLTAGE - > 22 kV & < = 66 kV [Mean] UNDERGROUND CABLES BY: HIGHEST OPERATING VOLTAGE - > 22 kV & < = 66 kV [Std. Dev] UNDERGROUND CABLES BY: HIGHEST OPERATING VOLTAGE - > 66 kV & < = 132 kV [Mean] UNDERGROUND CABLES BY: HIGHEST OPERATING VOLTAGE - > 66 kV & < = 132 kV [Std. Dev] UNDERGROUND CABLES BY: HIGHEST OPERATING VOLTAGE - > 132 kV [Mean] UNDERGROUND CABLES BY: HIGHEST OPERATING VOLTAGE - > 132 kV [Std. Dev] UNDERGROUND CABLES BY: HIGHEST OPERATING VOLTAGE - Other [Mean] UNDERGROUND CABLES BY: HIGHEST OPERATING VOLTAGE - Other [Std. Dev] SERVICE LINES BY: CONNECTION VOLTAGE; CUSTOMER TYPE; CONNECTION COMPLEXITY - < = 11 kV ; Residential ; Simple Type [Mean] SERVICE LINES BY: CONNECTION VOLTAGE; CUSTOMER TYPE; CONNECTION COMPLEXITY - < = 11 kV ; Residential ; Simple Type [Std. Dev] SERVICE LINES BY: CONNECTION VOLTAGE; CUSTOMER TYPE; CONNECTION COMPLEXITY - < = 11 kV ; Commercial & Industrial ; Simple Type [Mean] SERVICE LINES BY: CONNECTION VOLTAGE; CUSTOMER TYPE; CONNECTION COMPLEXITY - < = 11 kV ; Commercial & Industrial ; Simple Type [Std. Dev] SERVICE LINES BY: CONNECTION VOLTAGE; CUSTOMER TYPE; CONNECTION COMPLEXITY - < = 11 kV ; Residential ; Complex Type [Mean] SERVICE LINES BY: CONNECTION VOLTAGE; CUSTOMER TYPE; CONNECTION COMPLEXITY - < = 11 kV ; Residential ; Complex Type [Std. Dev] SERVICE LINES BY: CONNECTION VOLTAGE; CUSTOMER TYPE; CONNECTION COMPLEXITY - < = 11 kV ; Commercial & Industrial ; Complex Type [Mean] SERVICE LINES BY: CONNECTION VOLTAGE; CUSTOMER TYPE; CONNECTION COMPLEXITY - < = 11 kV ; Commercial & Industrial ; Complex Type [Std. Dev] SERVICE LINES BY: CONNECTION VOLTAGE; CUSTOMER TYPE; CONNECTION COMPLEXITY - < = 11 kV ; Subdivision ; Complex Type [Mean] SERVICE LINES BY: CONNECTION VOLTAGE; CUSTOMER TYPE; CONNECTION COMPLEXITY - < = 11 kV ; Subdivision ; Complex Type [Std. Dev] SERVICE LINES BY: CONNECTION VOLTAGE; CUSTOMER TYPE; CONNECTION COMPLEXITY - > 11 kV & < = 22 kV ; Commercial & Industrial [Mean] SERVICE LINES BY: CONNECTION VOLTAGE;
Citipower – Basis of Preparation – CA 122
CUSTOMER TYPE; CONNECTION COMPLEXITY - > 11 kV & < = 22 kV ; Commercial & Industrial [Std. Dev] SERVICE LINES BY: CONNECTION VOLTAGE; CUSTOMER TYPE; CONNECTION COMPLEXITY - > 11 kV & < = 22 kV ; Subdivision [Mean] SERVICE LINES BY: CONNECTION VOLTAGE; CUSTOMER TYPE; CONNECTION COMPLEXITY - > 11 kV & < = 22 kV ; Subdivision [Std. Dev] SERVICE LINES BY: CONNECTION VOLTAGE; CUSTOMER TYPE; CONNECTION COMPLEXITY - > 22 kV & < = 33 kV ; Commercial & Industrial [Mean] SERVICE LINES BY: CONNECTION VOLTAGE; CUSTOMER TYPE; CONNECTION COMPLEXITY - > 22 kV & < = 33 kV ; Commercial & Industrial [Std. Dev] SERVICE LINES BY: CONNECTION VOLTAGE; CUSTOMER TYPE; CONNECTION COMPLEXITY - > 22 kV & < = 33 kV ; Subdivision [Mean] SERVICE LINES BY: CONNECTION VOLTAGE; CUSTOMER TYPE; CONNECTION COMPLEXITY - > 22 kV & < = 33 kV ; Subdivision [Std. Dev] SERVICE LINES BY: CONNECTION VOLTAGE; CUSTOMER TYPE; CONNECTION COMPLEXITY - > 33 kV & < = 66 kV ; Commercial & Industrial [Mean] SERVICE LINES BY: CONNECTION VOLTAGE; CUSTOMER TYPE; CONNECTION COMPLEXITY - > 33 kV & < = 66 kV ; Commercial & Industrial [Std. Dev] SERVICE LINES BY: CONNECTION VOLTAGE; CUSTOMER TYPE; CONNECTION COMPLEXITY - > 33 kV & < = 66 kV ; Subdivision [Mean] SERVICE LINES BY: CONNECTION VOLTAGE; CUSTOMER TYPE; CONNECTION COMPLEXITY - > 33 kV & < = 66 kV ; Subdivision [Std. Dev] SERVICE LINES BY: CONNECTION VOLTAGE; CUSTOMER TYPE; CONNECTION COMPLEXITY - > 66 kV & < = 132 kV ; Commercial & Industrial [Mean] SERVICE LINES BY: CONNECTION VOLTAGE; CUSTOMER TYPE; CONNECTION COMPLEXITY - > 66 kV & < = 132 kV ; Commercial & Industrial [Std. Dev] SERVICE LINES BY: CONNECTION VOLTAGE; CUSTOMER TYPE; CONNECTION COMPLEXITY - > 66 kV & < = 132 kV ; Subdivision [Mean] SERVICE LINES BY: CONNECTION VOLTAGE; CUSTOMER TYPE; CONNECTION COMPLEXITY - > 66 kV & < = 132 kV ; Subdivision [Std. Dev] SERVICE LINES BY: CONNECTION VOLTAGE; CUSTOMER TYPE; CONNECTION COMPLEXITY - > 132 kV ; Commercial & Industrial [Mean] SERVICE LINES BY: CONNECTION VOLTAGE; CUSTOMER TYPE; CONNECTION COMPLEXITY - > 132 kV ; Commercial & Industrial [Std. Dev] SERVICE LINES BY: CONNECTION VOLTAGE; CUSTOMER TYPE; CONNECTION COMPLEXITY - > 132 kV ; Subdivision [Mean] SERVICE LINES BY: CONNECTION VOLTAGE; CUSTOMER TYPE; CONNECTION COMPLEXITY - > 132 kV ; Subdivision [Std. Dev] SERVICE LINES BY: CONNECTION VOLTAGE; CUSTOMER TYPE; CONNECTION COMPLEXITY - Other [Mean] SERVICE LINES BY: CONNECTION VOLTAGE;

Citipower – Basis of Preparation – CA 123
CUSTOMER TYPE; CONNECTION COMPLEXITY - Other [Std. Dev] TRANSFORMERS BY: MOUNTING TYPE; HIGHEST OPERATING VOLTAGE ; AMPERE RATING; NUMBER OF PHASES (AT LV) - Pole Mounted ; < = 22kV ; < = 60 kVA ; Single Phase [Mean] TRANSFORMERS BY: MOUNTING TYPE; HIGHEST OPERATING VOLTAGE ; AMPERE RATING; NUMBER OF PHASES (AT LV) - Pole Mounted ; < = 22kV ; < = 60 kVA ; Single Phase [Std. Dev] TRANSFORMERS BY: MOUNTING TYPE; HIGHEST OPERATING VOLTAGE ; AMPERE RATING; NUMBER OF PHASES (AT LV) - Pole Mounted ; < = 22kV ; > 60 kVA and < = 600 kVA ; Single Phase [Mean] TRANSFORMERS BY: MOUNTING TYPE; HIGHEST OPERATING VOLTAGE ; AMPERE RATING; NUMBER OF PHASES (AT LV) - Pole Mounted ; < = 22kV ; > 60 kVA and < = 600 kVA ; Single Phase [Std. Dev] TRANSFORMERS BY: MOUNTING TYPE; HIGHEST OPERATING VOLTAGE ; AMPERE RATING; NUMBER OF PHASES (AT LV) - Pole Mounted ; < = 22kV ; > 600 kVA ; Single Phase [Mean] TRANSFORMERS BY: MOUNTING TYPE; HIGHEST OPERATING VOLTAGE ; AMPERE RATING; NUMBER OF PHASES (AT LV) - Pole Mounted ; < = 22kV ; > 600 kVA ; Single Phase [Std. Dev] TRANSFORMERS BY: MOUNTING TYPE; HIGHEST OPERATING VOLTAGE ; AMPERE RATING; NUMBER OF PHASES (AT LV) - Pole Mounted ; < = 22kV ; < = 60 kVA ; Multiple Phase [Mean] TRANSFORMERS BY: MOUNTING TYPE; HIGHEST OPERATING VOLTAGE ; AMPERE RATING; NUMBER OF PHASES (AT LV) - Pole Mounted ; < = 22kV ; < = 60 kVA ; Multiple Phase [Std. Dev] TRANSFORMERS BY: MOUNTING TYPE; HIGHEST OPERATING VOLTAGE ; AMPERE RATING; NUMBER OF PHASES (AT LV) - Pole Mounted ; < = 22kV ; > 60 kVA and < = 600 kVA ; Multiple Phase [Mean] TRANSFORMERS BY: MOUNTING TYPE; HIGHEST OPERATING VOLTAGE ; AMPERE RATING; NUMBER OF PHASES (AT LV) - Pole Mounted ; < = 22kV ; > 60 kVA and < = 600 kVA ; Multiple Phase [Std. Dev] TRANSFORMERS BY: MOUNTING TYPE; HIGHEST OPERATING VOLTAGE ; AMPERE RATING; NUMBER OF PHASES (AT LV) - Pole Mounted ; < = 22kV ; > 600 kVA ; Multiple Phase [Mean] TRANSFORMERS BY: MOUNTING TYPE; HIGHEST OPERATING VOLTAGE ; AMPERE RATING; NUMBER OF PHASES (AT LV) - Pole Mounted ; < = 22kV ; > 600 kVA ; Multiple Phase [Std. Dev] TRANSFORMERS BY: MOUNTING TYPE; HIGHEST OPERATING VOLTAGE ; AMPERE RATING; NUMBER OF PHASES (AT LV) - Kiosk Mounted ; < = 22kV ; < = 60 kVA ; Single Phase [Mean]
Citipower – Basis of Preparation – CA 124
TRANSFORMERS BY: MOUNTING TYPE; HIGHEST OPERATING VOLTAGE ; AMPERE RATING; NUMBER OF PHASES (AT LV) - Kiosk Mounted ; < = 22kV ; < = 60 kVA ; Single Phase [Std. Dev] TRANSFORMERS BY: MOUNTING TYPE; HIGHEST OPERATING VOLTAGE ; AMPERE RATING; NUMBER OF PHASES (AT LV) - Kiosk Mounted ; < = 22kV ; > 60 kVA and < = 600 kVA ; Single Phase [Mean] TRANSFORMERS BY: MOUNTING TYPE; HIGHEST OPERATING VOLTAGE ; AMPERE RATING; NUMBER OF PHASES (AT LV) - Kiosk Mounted ; < = 22kV ; > 60 kVA and < = 600 kVA ; Single Phase [Std. Dev] TRANSFORMERS BY: MOUNTING TYPE; HIGHEST OPERATING VOLTAGE ; AMPERE RATING; NUMBER OF PHASES (AT LV) - Kiosk Mounted ; < = 22kV ; > 600 kVA ; Single Phase [Mean] TRANSFORMERS BY: MOUNTING TYPE; HIGHEST OPERATING VOLTAGE ; AMPERE RATING; NUMBER OF PHASES (AT LV) - Kiosk Mounted ; < = 22kV ; > 600 kVA ; Single Phase [Std. Dev] TRANSFORMERS BY: MOUNTING TYPE; HIGHEST OPERATING VOLTAGE ; AMPERE RATING; NUMBER OF PHASES (AT LV) - Kiosk Mounted ; < = 22kV ; < = 60 kVA ; Multiple Phase [Mean] TRANSFORMERS BY: MOUNTING TYPE; HIGHEST OPERATING VOLTAGE ; AMPERE RATING; NUMBER OF PHASES (AT LV) - Kiosk Mounted ; < = 22kV ; < = 60 kVA ; Multiple Phase [Std. Dev] TRANSFORMERS BY: MOUNTING TYPE; HIGHEST OPERATING VOLTAGE ; AMPERE RATING; NUMBER OF PHASES (AT LV) - Kiosk Mounted ; < = 22kV ; > 60 kVA and < = 600 kVA ; Multiple Phase [Mean] TRANSFORMERS BY: MOUNTING TYPE; HIGHEST OPERATING VOLTAGE ; AMPERE RATING; NUMBER OF PHASES (AT LV) - Kiosk Mounted ; < = 22kV ; > 60 kVA and < = 600 kVA ; Multiple Phase [Std. Dev] TRANSFORMERS BY: MOUNTING TYPE; HIGHEST OPERATING VOLTAGE ; AMPERE RATING; NUMBER OF PHASES (AT LV) - Kiosk Mounted ; < = 22kV ; > 600 kVA ; Multiple Phase [Mean] TRANSFORMERS BY: MOUNTING TYPE; HIGHEST OPERATING VOLTAGE ; AMPERE RATING; NUMBER OF PHASES (AT LV) - Kiosk Mounted ; < = 22kV ; > 600 kVA ; Multiple Phase [Std. Dev] TRANSFORMERS BY: MOUNTING TYPE; HIGHEST OPERATING VOLTAGE ; AMPERE RATING; NUMBER OF PHASES (AT LV) - Ground Outdoor / Indoor Chamber Mounted; < 22 kV ; < = 60 kVA ; Single Phase [Mean] TRANSFORMERS BY: MOUNTING TYPE; HIGHEST OPERATING VOLTAGE ; AMPERE RATING; NUMBER OF PHASES (AT LV) - Ground Outdoor / Indoor Chamber Mounted; < 22 kV ; < = 60 kVA ; Single Phase [Std. Dev] TRANSFORMERS BY: MOUNTING TYPE; HIGHEST OPERATING VOLTAGE ; AMPERE
Citipower – Basis of Preparation – CA 125
RATING; NUMBER OF PHASES (AT LV) - Ground Outdoor / Indoor Chamber Mounted; < 22 kV ; > 60 kVA and < = 600 kVA ; Single Phase [Mean] TRANSFORMERS BY: MOUNTING TYPE; HIGHEST OPERATING VOLTAGE ; AMPERE RATING; NUMBER OF PHASES (AT LV) - Ground Outdoor / Indoor Chamber Mounted; < 22 kV ; > 60 kVA and < = 600 kVA ; Single Phase [Std. Dev] TRANSFORMERS BY: MOUNTING TYPE; HIGHEST OPERATING VOLTAGE ; AMPERE RATING; NUMBER OF PHASES (AT LV) - Ground Outdoor / Indoor Chamber Mounted; < 22 kV ; > 600 kVA ; Single Phase [Mean] TRANSFORMERS BY: MOUNTING TYPE; HIGHEST OPERATING VOLTAGE ; AMPERE RATING; NUMBER OF PHASES (AT LV) - Ground Outdoor / Indoor Chamber Mounted; < 22 kV ; > 600 kVA ; Single Phase [Std. Dev] TRANSFORMERS BY: MOUNTING TYPE; HIGHEST OPERATING VOLTAGE ; AMPERE RATING; NUMBER OF PHASES (AT LV) - Ground Outdoor / Indoor Chamber Mounted; < 22 kV ; < = 60 kVA ; Multiple Phase [Mean] TRANSFORMERS BY: MOUNTING TYPE; HIGHEST OPERATING VOLTAGE ; AMPERE RATING; NUMBER OF PHASES (AT LV) - Ground Outdoor / Indoor Chamber Mounted; < 22 kV ; < = 60 kVA ; Multiple Phase [Std. Dev] TRANSFORMERS BY: MOUNTING TYPE; HIGHEST OPERATING VOLTAGE ; AMPERE RATING; NUMBER OF PHASES (AT LV) - Ground Outdoor / Indoor Chamber Mounted; < 22 kV ; > 60 kVA and < = 600 kVA ; Multiple Phase [Mean] TRANSFORMERS BY: MOUNTING TYPE; HIGHEST OPERATING VOLTAGE ; AMPERE RATING; NUMBER OF PHASES (AT LV) - Ground Outdoor / Indoor Chamber Mounted; < 22 kV ; > 60 kVA and < = 600 kVA ; Multiple Phase [Std. Dev] TRANSFORMERS BY: MOUNTING TYPE; HIGHEST OPERATING VOLTAGE ; AMPERE RATING; NUMBER OF PHASES (AT LV) - Ground Outdoor / Indoor Chamber Mounted; < 22 kV ; > 600 kVA ; Multiple Phase [Mean] TRANSFORMERS BY: MOUNTING TYPE; HIGHEST OPERATING VOLTAGE ; AMPERE RATING; NUMBER OF PHASES (AT LV) - Ground Outdoor / Indoor Chamber Mounted; < 22 kV ; > 600 kVA ; Multiple Phase [Std. Dev] TRANSFORMERS BY: MOUNTING TYPE; HIGHEST OPERATING VOLTAGE ; AMPERE RATING; NUMBER OF PHASES (AT LV) - Ground Outdoor / Indoor Chamber Mounted; > = 22 kV & < = 33 kV ; < = 15 MVA [Mean] TRANSFORMERS BY: MOUNTING TYPE; HIGHEST OPERATING VOLTAGE ; AMPERE RATING; NUMBER OF PHASES (AT LV) - Ground Outdoor / Indoor Chamber Mounted; > = 22 kV & < = 33 kV ; < = 15 MVA [Std. Dev] TRANSFORMERS BY: MOUNTING TYPE; HIGHEST OPERATING VOLTAGE ; AMPERE RATING; NUMBER OF PHASES (AT LV) -
Citipower – Basis of Preparation – CA 126
Ground Outdoor / Indoor Chamber Mounted; > = 22 kV & < = 33 kV ; > 15 MVA and < = 40 MVA [Mean] TRANSFORMERS BY: MOUNTING TYPE; HIGHEST OPERATING VOLTAGE ; AMPERE RATING; NUMBER OF PHASES (AT LV) - Ground Outdoor / Indoor Chamber Mounted; > = 22 kV & < = 33 kV ; > 15 MVA and < = 40 MVA [Std. Dev] TRANSFORMERS BY: MOUNTING TYPE; HIGHEST OPERATING VOLTAGE ; AMPERE RATING; NUMBER OF PHASES (AT LV) - Ground Outdoor / Indoor Chamber Mounted; > = 22 kV & < = 33 kV ; > 40 MVA [Mean] TRANSFORMERS BY: MOUNTING TYPE; HIGHEST OPERATING VOLTAGE ; AMPERE RATING; NUMBER OF PHASES (AT LV) - Ground Outdoor / Indoor Chamber Mounted; > = 22 kV & < = 33 kV ; > 40 MVA [Std. Dev] TRANSFORMERS BY: MOUNTING TYPE; HIGHEST OPERATING VOLTAGE ; AMPERE RATING; NUMBER OF PHASES (AT LV) - Ground Outdoor / Indoor Chamber Mounted; > 33 kV & < = 66 kV ; < = 15 MVA [Mean] TRANSFORMERS BY: MOUNTING TYPE; HIGHEST OPERATING VOLTAGE ; AMPERE RATING; NUMBER OF PHASES (AT LV) - Ground Outdoor / Indoor Chamber Mounted; > 33 kV & < = 66 kV ; < = 15 MVA [Std. Dev] TRANSFORMERS BY: MOUNTING TYPE; HIGHEST OPERATING VOLTAGE ; AMPERE RATING; NUMBER OF PHASES (AT LV) - Ground Outdoor / Indoor Chamber Mounted; > 33 kV & < = 66 kV ; > 15 MVA and < = 40 MVA [Mean] TRANSFORMERS BY: MOUNTING TYPE; HIGHEST OPERATING VOLTAGE ; AMPERE RATING; NUMBER OF PHASES (AT LV) - Ground Outdoor / Indoor Chamber Mounted; > 33 kV & < = 66 kV ; > 15 MVA and < = 40 MVA [Std. Dev] TRANSFORMERS BY: MOUNTING TYPE; HIGHEST OPERATING VOLTAGE ; AMPERE RATING; NUMBER OF PHASES (AT LV) - Ground Outdoor / Indoor Chamber Mounted; > 33 kV & < = 66 kV ; > 40 MVA [Mean] TRANSFORMERS BY: MOUNTING TYPE; HIGHEST OPERATING VOLTAGE ; AMPERE RATING; NUMBER OF PHASES (AT LV) - Ground Outdoor / Indoor Chamber Mounted; > 33 kV & < = 66 kV ; > 40 MVA [Std. Dev] TRANSFORMERS BY: MOUNTING TYPE; HIGHEST OPERATING VOLTAGE ; AMPERE RATING; NUMBER OF PHASES (AT LV) - Ground Outdoor / Indoor Chamber Mounted; > 66 kV & < = 132 kV ; < = 100 MVA [Mean] TRANSFORMERS BY: MOUNTING TYPE; HIGHEST OPERATING VOLTAGE ; AMPERE RATING; NUMBER OF PHASES (AT LV) - Ground Outdoor / Indoor Chamber Mounted; > 66 kV & < = 132 kV ; < = 100 MVA [Std. Dev] TRANSFORMERS BY: MOUNTING TYPE; HIGHEST OPERATING VOLTAGE ; AMPERE RATING; NUMBER OF PHASES (AT LV) - Ground Outdoor / Indoor Chamber Mounted; > 66 kV & < = 132 kV ; > 100 MVA [Mean] TRANSFORMERS BY: MOUNTING TYPE;

Citipower – Basis of Preparation – CA 127
HIGHEST OPERATING VOLTAGE ; AMPERE RATING; NUMBER OF PHASES (AT LV) - Ground Outdoor / Indoor Chamber Mounted; > 66 kV & < = 132 kV ; > 100 MVA [Std. Dev] TRANSFORMERS BY: MOUNTING TYPE; HIGHEST OPERATING VOLTAGE ; AMPERE RATING; NUMBER OF PHASES (AT LV) - Ground Outdoor / Indoor Chamber Mounted; > 132 kV ; < = 100 MVA [Mean] TRANSFORMERS BY: MOUNTING TYPE; HIGHEST OPERATING VOLTAGE ; AMPERE RATING; NUMBER OF PHASES (AT LV) - Ground Outdoor / Indoor Chamber Mounted; > 132 kV ; < = 100 MVA [Std. Dev] TRANSFORMERS BY: MOUNTING TYPE; HIGHEST OPERATING VOLTAGE ; AMPERE RATING; NUMBER OF PHASES (AT LV) - Ground Outdoor / Indoor Chamber Mounted; > 132 kV ; > 100 MVA [Mean] TRANSFORMERS BY: MOUNTING TYPE; HIGHEST OPERATING VOLTAGE ; AMPERE RATING; NUMBER OF PHASES (AT LV) - Ground Outdoor / Indoor Chamber Mounted; > 132 kV ; > 100 MVA [Std. Dev] TRANSFORMERS BY: MOUNTING TYPE; HIGHEST OPERATING VOLTAGE ; AMPERE RATING; NUMBER OF PHASES (AT LV) - Other [Mean] TRANSFORMERS BY: MOUNTING TYPE; HIGHEST OPERATING VOLTAGE ; AMPERE RATING; NUMBER OF PHASES (AT LV) - Other [Std. Dev] SWITCHGEAR BY: HIGHEST OPERATING VOLTAGE ; SWITCH FUNCTION - < = 11 kV ; Fuse [Mean] SWITCHGEAR BY: HIGHEST OPERATING VOLTAGE ; SWITCH FUNCTION - < = 11 kV ; Fuse [Std. Dev] SWITCHGEAR BY: HIGHEST OPERATING VOLTAGE ; SWITCH FUNCTION - < = 11 kV ; Switch [Mean] SWITCHGEAR BY: HIGHEST OPERATING VOLTAGE ; SWITCH FUNCTION - < = 11 kV ; Switch [Std. Dev] SWITCHGEAR BY: HIGHEST OPERATING VOLTAGE ; SWITCH FUNCTION - < = 11 kV ; Circuit Breaker [Mean] SWITCHGEAR BY: HIGHEST OPERATING VOLTAGE ; SWITCH FUNCTION - < = 11 kV ; Circuit Breaker [Std. Dev] SWITCHGEAR BY: HIGHEST OPERATING VOLTAGE ; SWITCH FUNCTION - > 11 kV & < = 22 kV ; Switch [Mean] SWITCHGEAR BY: HIGHEST OPERATING VOLTAGE ; SWITCH FUNCTION - > 11 kV & < = 22 kV ; Switch [Std. Dev] SWITCHGEAR BY: HIGHEST OPERATING VOLTAGE ; SWITCH FUNCTION - > 11 kV & < = 22 kV ; Circuit Breaker [Mean] SWITCHGEAR BY: HIGHEST OPERATING VOLTAGE ; SWITCH FUNCTION - > 11 kV & < = 22 kV ; Circuit Breaker [Std. Dev] SWITCHGEAR BY: HIGHEST OPERATING VOLTAGE ; SWITCH FUNCTION - > 22 kV & < = 33 kV ; Switch [Mean] SWITCHGEAR BY: HIGHEST OPERATING VOLTAGE ; SWITCH FUNCTION - > 22 kV & < =

Citipower – Basis of Preparation – CA 128
33 kV ; Switch [Std. Dev] SWITCHGEAR BY: HIGHEST OPERATING VOLTAGE ; SWITCH FUNCTION - > 22 kV & < = 33 kV ; Circuit Breaker [Mean] SWITCHGEAR BY: HIGHEST OPERATING VOLTAGE ; SWITCH FUNCTION - > 22 kV & < = 33 kV ; Circuit Breaker [Std. Dev] SWITCHGEAR BY: HIGHEST OPERATING VOLTAGE ; SWITCH FUNCTION - > 33 kV & < = 66 kV ; Switch [Mean] SWITCHGEAR BY: HIGHEST OPERATING VOLTAGE ; SWITCH FUNCTION - > 33 kV & < = 66 kV ; Switch [Std. Dev] SWITCHGEAR BY: HIGHEST OPERATING VOLTAGE ; SWITCH FUNCTION - > 33 kV & < = 66 kV ; Circuit Breaker [Mean] SWITCHGEAR BY: HIGHEST OPERATING VOLTAGE ; SWITCH FUNCTION - > 33 kV & < = 66 kV ; Circuit Breaker [Std. Dev] SWITCHGEAR BY: HIGHEST OPERATING VOLTAGE ; SWITCH FUNCTION - > 66 kV & < = 132 kV ; Switch [Mean] SWITCHGEAR BY: HIGHEST OPERATING VOLTAGE ; SWITCH FUNCTION - > 66 kV & < = 132 kV ; Switch [Std. Dev] SWITCHGEAR BY: HIGHEST OPERATING VOLTAGE ; SWITCH FUNCTION - > 66 kV & < = 132 kV ; Circuit Breaker [Mean] SWITCHGEAR BY: HIGHEST OPERATING VOLTAGE ; SWITCH FUNCTION - > 66 kV & < = 132 kV ; Circuit Breaker [Std. Dev] SWITCHGEAR BY: HIGHEST OPERATING VOLTAGE ; SWITCH FUNCTION - > 132 kV ; Switch [Mean] SWITCHGEAR BY: HIGHEST OPERATING VOLTAGE ; SWITCH FUNCTION - > 132 kV ; Switch [Std. Dev] SWITCHGEAR BY: HIGHEST OPERATING VOLTAGE ; SWITCH FUNCTION - > 132 kV ; Circuit Breaker [Mean] SWITCHGEAR BY: HIGHEST OPERATING VOLTAGE ; SWITCH FUNCTION - > 132 kV ; Circuit Breaker [Std. Dev] SWITCHGEAR BY: HIGHEST OPERATING VOLTAGE ; SWITCH FUNCTION - Other [Mean] SWITCHGEAR BY: HIGHEST OPERATING VOLTAGE ; SWITCH FUNCTION - Other [Std. Dev] PUBLIC LIGHTING BY: ASSET TYPE ; LIGHTING OBLIGATION - PUBLIC LIGHTING BY: ASSET TYPE ; LIGHTING OBLIGATION [Mean] PUBLIC LIGHTING BY: ASSET TYPE ; LIGHTING OBLIGATION - PUBLIC LIGHTING BY: ASSET TYPE ; LIGHTING OBLIGATION [Std. Dev] PUBLIC LIGHTING BY: ASSET TYPE ; LIGHTING OBLIGATION - Luminaires ; Minor Road [Mean] PUBLIC LIGHTING BY: ASSET TYPE ; LIGHTING OBLIGATION - Luminaires ; Minor Road [Std. Dev] PUBLIC LIGHTING BY: ASSET TYPE ; LIGHTING OBLIGATION - Brackets ; Major Road [Mean] PUBLIC LIGHTING BY: ASSET TYPE ; LIGHTING OBLIGATION - Brackets ; Major Road [Std. Dev] PUBLIC LIGHTING BY: ASSET TYPE ;
Citipower – Basis of Preparation – CA 129
LIGHTING OBLIGATION - Brackets ; Minor Road [Mean] PUBLIC LIGHTING BY: ASSET TYPE ; LIGHTING OBLIGATION - Brackets ; Minor Road [Std. Dev] PUBLIC LIGHTING BY: ASSET TYPE ; LIGHTING OBLIGATION - Lamps ; Major Road [Mean] PUBLIC LIGHTING BY: ASSET TYPE ; LIGHTING OBLIGATION - Lamps ; Major Road [Std. Dev] PUBLIC LIGHTING BY: ASSET TYPE ; LIGHTING OBLIGATION - Lamps ; Minor Road [Mean] PUBLIC LIGHTING BY: ASSET TYPE ; LIGHTING OBLIGATION - Lamps ; Minor Road [Std. Dev] PUBLIC LIGHTING BY: ASSET TYPE ; LIGHTING OBLIGATION - Poles / Columns ; Major Road [Mean] PUBLIC LIGHTING BY: ASSET TYPE ; LIGHTING OBLIGATION - Poles / Columns ; Major Road [Std. Dev] PUBLIC LIGHTING BY: ASSET TYPE ; LIGHTING OBLIGATION - Poles / Columns ; Minor Road [Mean] PUBLIC LIGHTING BY: ASSET TYPE ; LIGHTING OBLIGATION - Poles / Columns ; Minor Road [Std. Dev] PUBLIC LIGHTING BY: ASSET TYPE ; LIGHTING OBLIGATION - Other [Mean] PUBLIC LIGHTING BY: ASSET TYPE ; LIGHTING OBLIGATION - Other [Std. Dev] SCADA, NETWORK CONTROL AND PROTECTION SYSTEMS BY: Function - Local Network Wiring Assets [Mean] SCADA, NETWORK CONTROL AND PROTECTION SYSTEMS BY: Function - Local Network Wiring Assets [Std. Dev] SCADA, NETWORK CONTROL AND PROTECTION SYSTEMS BY: Function - Communications Network Assets [Mean] SCADA, NETWORK CONTROL AND PROTECTION SYSTEMS BY: Function - Communications Network Assets [Std. Dev] SCADA, NETWORK CONTROL AND PROTECTION SYSTEMS BY: Function - Communications Site Infrastructure [Mean] SCADA, NETWORK CONTROL AND PROTECTION SYSTEMS BY: Function - Communications Site Infrastructure [Std. Dev] SCADA, NETWORK CONTROL AND PROTECTION SYSTEMS BY: Function - Communications Linear Assets [Mean] SCADA, NETWORK CONTROL AND PROTECTION SYSTEMS BY: Function - Communications Linear Assets [Std. Dev] SCADA, NETWORK CONTROL AND PROTECTION SYSTEMS BY: Function - AFLC [Mean] SCADA, NETWORK CONTROL AND PROTECTION SYSTEMS BY: Function - AFLC [Std. Dev] SCADA, NETWORK CONTROL AND PROTECTION SYSTEMS BY: Function - Other [Mean] SCADA, NETWORK CONTROL AND
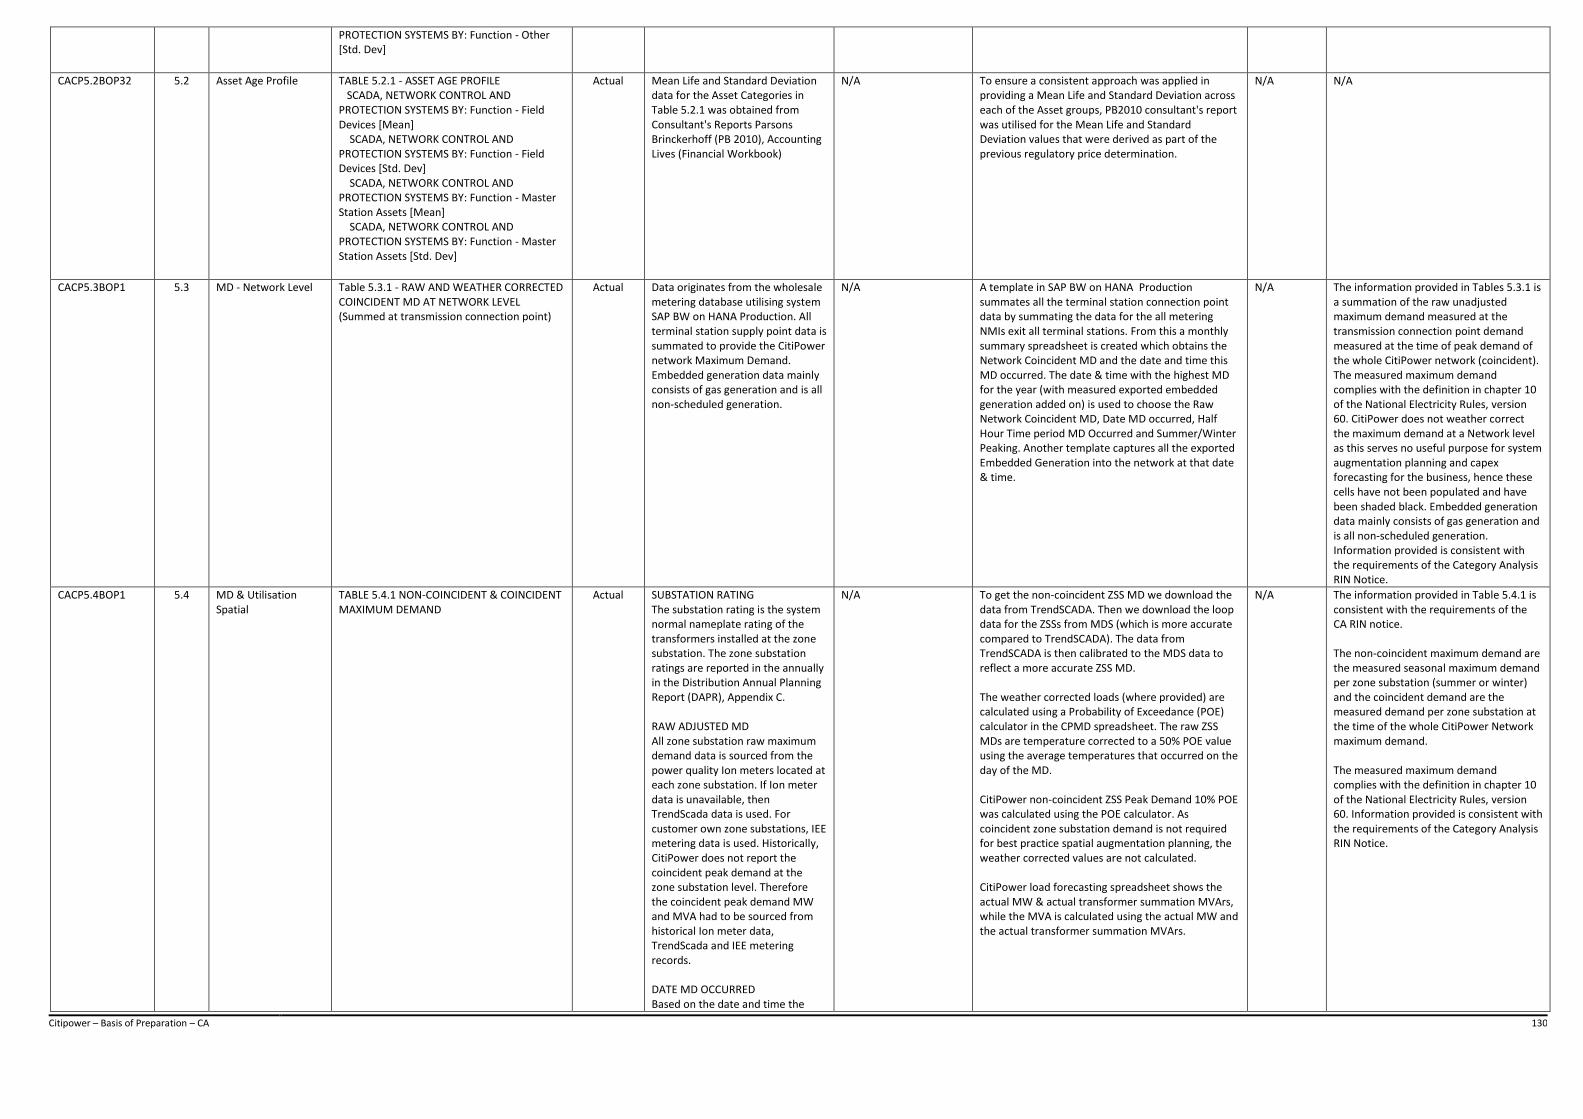
Citipower – Basis of Preparation – CA 130
PROTECTION SYSTEMS BY: Function - Other [Std. Dev]
CACP5.2BOP32 5.2 Asset Age Profile TABLE 5.2.1 - ASSET AGE PROFILE SCADA, NETWORK CONTROL AND PROTECTION SYSTEMS BY: Function - Field Devices [Mean] SCADA, NETWORK CONTROL AND PROTECTION SYSTEMS BY: Function - Field Devices [Std. Dev] SCADA, NETWORK CONTROL AND PROTECTION SYSTEMS BY: Function - Master Station Assets [Mean] SCADA, NETWORK CONTROL AND PROTECTION SYSTEMS BY: Function - Master Station Assets [Std. Dev]
Actual Mean Life and Standard Deviation data for the Asset Categories in Table 5.2.1 was obtained from Consultant's Reports Parsons Brinckerhoff (PB 2010), Accounting Lives (Financial Workbook)
N/A To ensure a consistent approach was applied in providing a Mean Life and Standard Deviation across each of the Asset groups, PB2010 consultant's report was utilised for the Mean Life and Standard Deviation values that were derived as part of the previous regulatory price determination.
N/A N/A
CACP5.3BOP1 5.3 MD - Network Level Table 5.3.1 - RAW AND WEATHER CORRECTED COINCIDENT MD AT NETWORK LEVEL (Summed at transmission connection point)
Actual Data originates from the wholesale metering database utilising system SAP BW on HANA Production. All terminal station supply point data is summated to provide the CitiPower network Maximum Demand. Embedded generation data mainly consists of gas generation and is all non-scheduled generation.
N/A A template in SAP BW on HANA Production summates all the terminal station connection point data by summating the data for the all metering NMIs exit all terminal stations. From this a monthly summary spreadsheet is created which obtains the Network Coincident MD and the date and time this MD occurred. The date & time with the highest MD for the year (with measured exported embedded generation added on) is used to choose the Raw Network Coincident MD, Date MD occurred, Half Hour Time period MD Occurred and Summer/Winter Peaking. Another template captures all the exported Embedded Generation into the network at that date & time.
N/A The information provided in Tables 5.3.1 is a summation of the raw unadjusted maximum demand measured at the transmission connection point demand measured at the time of peak demand of the whole CitiPower network (coincident). The measured maximum demand complies with the definition in chapter 10 of the National Electricity Rules, version 60. CitiPower does not weather correct the maximum demand at a Network level as this serves no useful purpose for system augmentation planning and capex forecasting for the business, hence these cells have not been populated and have been shaded black. Embedded generation data mainly consists of gas generation and is all non-scheduled generation. Information provided is consistent with the requirements of the Category Analysis RIN Notice.
CACP5.4BOP1 5.4 MD & Utilisation Spatial
TABLE 5.4.1 NON-COINCIDENT & COINCIDENT MAXIMUM DEMAND
Actual SUBSTATION RATING The substation rating is the system normal nameplate rating of the transformers installed at the zone substation. The zone substation ratings are reported in the annually in the Distribution Annual Planning Report (DAPR), Appendix C. RAW ADJUSTED MD All zone substation raw maximum demand data is sourced from the power quality Ion meters located at each zone substation. If Ion meter data is unavailable, then TrendScada data is used. For customer own zone substations, IEE metering data is used. Historically, CitiPower does not report the coincident peak demand at the zone substation level. Therefore the coincident peak demand MW and MVA had to be sourced from historical Ion meter data, TrendScada and IEE metering records. DATE MD OCCURRED Based on the date and time the
N/A To get the non-coincident ZSS MD we download the data from TrendSCADA. Then we download the loop data for the ZSSs from MDS (which is more accurate compared to TrendSCADA). The data from TrendSCADA is then calibrated to the MDS data to reflect a more accurate ZSS MD. The weather corrected loads (where provided) are calculated using a Probability of Exceedance (POE) calculator in the CPMD spreadsheet. The raw ZSS MDs are temperature corrected to a 50% POE value using the average temperatures that occurred on the day of the MD. CitiPower non-coincident ZSS Peak Demand 10% POE was calculated using the POE calculator. As coincident zone substation demand is not required for best practice spatial augmentation planning, the weather corrected values are not calculated. CitiPower load forecasting spreadsheet shows the actual MW & actual transformer summation MVArs, while the MVA is calculated using the actual MW and the actual transformer summation MVArs.
N/A The information provided in Table 5.4.1 is consistent with the requirements of the CA RIN notice. The non-coincident maximum demand are the measured seasonal maximum demand per zone substation (summer or winter) and the coincident demand are the measured demand per zone substation at the time of the whole CitiPower Network maximum demand. The measured maximum demand complies with the definition in chapter 10 of the National Electricity Rules, version 60. Information provided is consistent with the requirements of the Category Analysis RIN Notice.
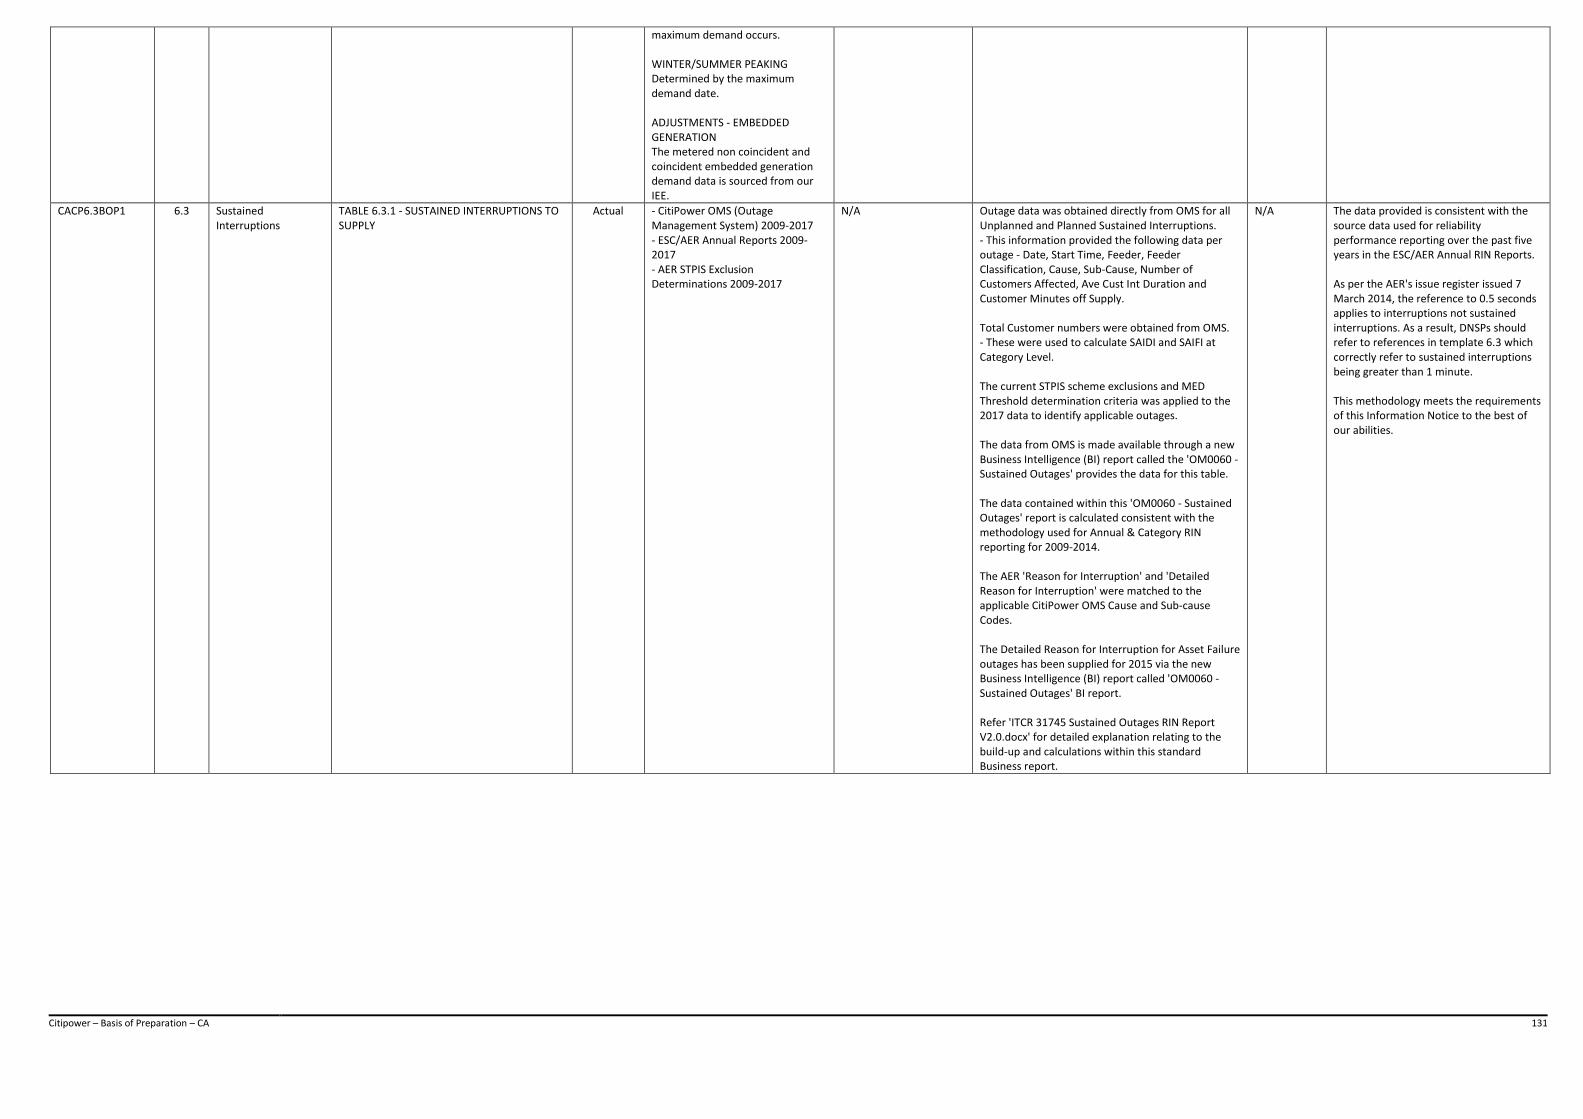
Citipower – Basis of Preparation – CA 131
maximum demand occurs. WINTER/SUMMER PEAKING Determined by the maximum demand date. ADJUSTMENTS - EMBEDDED GENERATION The metered non coincident and coincident embedded generation demand data is sourced from our IEE.
CACP6.3BOP1 6.3 Sustained Interruptions
TABLE 6.3.1 - SUSTAINED INTERRUPTIONS TO SUPPLY
Actual - CitiPower OMS (Outage Management System) 2009-2017 - ESC/AER Annual Reports 2009-2017 - AER STPIS Exclusion Determinations 2009-2017
N/A Outage data was obtained directly from OMS for all Unplanned and Planned Sustained Interruptions. - This information provided the following data per outage - Date, Start Time, Feeder, Feeder Classification, Cause, Sub-Cause, Number of Customers Affected, Ave Cust Int Duration and Customer Minutes off Supply. Total Customer numbers were obtained from OMS. - These were used to calculate SAIDI and SAIFI at Category Level. The current STPIS scheme exclusions and MED Threshold determination criteria was applied to the 2017 data to identify applicable outages. The data from OMS is made available through a new Business Intelligence (BI) report called the 'OM0060 - Sustained Outages' provides the data for this table. The data contained within this 'OM0060 - Sustained Outages' report is calculated consistent with the methodology used for Annual & Category RIN reporting for 2009-2014. The AER 'Reason for Interruption' and 'Detailed Reason for Interruption' were matched to the applicable CitiPower OMS Cause and Sub-cause Codes. The Detailed Reason for Interruption for Asset Failure outages has been supplied for 2015 via the new Business Intelligence (BI) report called 'OM0060 - Sustained Outages' BI report. Refer 'ITCR 31745 Sustained Outages RIN Report V2.0.docx' for detailed explanation relating to the build-up and calculations within this standard Business report.
N/A The data provided is consistent with the source data used for reliability performance reporting over the past five years in the ESC/AER Annual RIN Reports. As per the AER's issue register issued 7 March 2014, the reference to 0.5 seconds applies to interruptions not sustained interruptions. As a result, DNSPs should refer to references in template 6.3 which correctly refer to sustained interruptions being greater than 1 minute. This methodology meets the requirements of this Information Notice to the best of our abilities.