2017 Investor Roadshow - AIACorporate
55
2017 Investor Roadshow Building the future…
Transcript of 2017 Investor Roadshow - AIACorporate

2017 Investor Roadshow
Building the future…
2017 Investor Roadshow
Hig
hlig
hts
Com
pany
overv
iew
Str
ate
gy f
or
our
futu
re
Fin
ancia
l
Info
rmatio
nO
utlo
ok
Agenda
2
Page
1. Highlights 3
2. Company overview 6
3. Strategy for our future 17
4. Financial information 38
5. Outlook 50
2017 Investor Roadshow
Hig
hlig
hts
Com
pany
overv
iew
Str
ate
gy f
or
our
futu
re
Fin
ancia
l
Info
rmatio
nO
utlo
ok
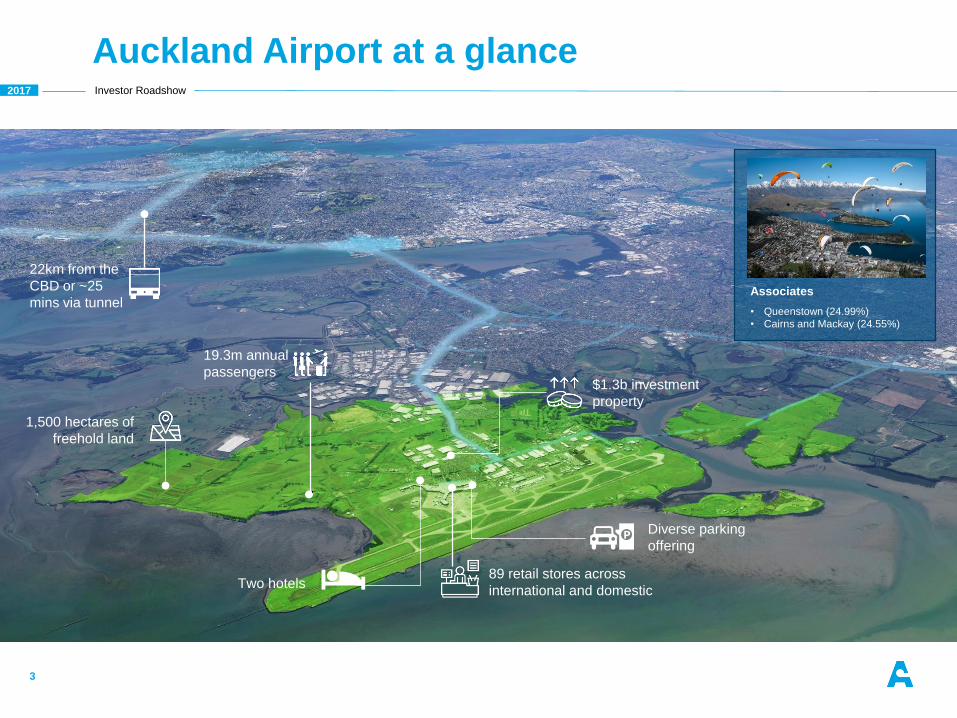
Auckland Airport at a glance
3
Associates
• Queenstown (24.99%)
• Cairns and Mackay (24.55%)
22km from the
CBD or ~25
mins via tunnel
1,500 hectares of
freehold land
Two hotels
$1.3b investment
property
19.3m annual
passengers
89 retail stores across
international and domestic
Diverse parking
offering
2017 Investor Roadshow
Hig
hlig
hts
Com
pany
overv
iew
Str
ate
gy f
or
our
futu
re
Fin
ancia
l
Info
rmatio
nO
utlo
ok
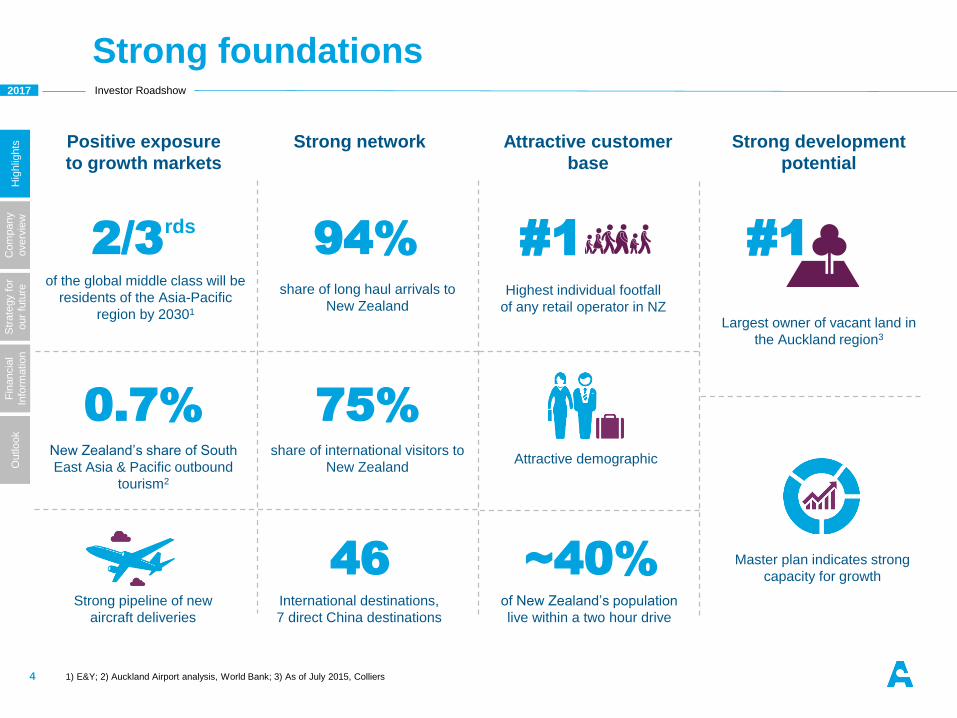
Strong foundations
4
Largest owner of vacant land in
the Auckland region3
share of long haul arrivals to
New Zealand
94% #1 #1
Strong development
potential
Attractive customer
base
Strong networkPositive exposure
to growth markets
Attractive demographicshare of international visitors to
New Zealand
75%
~40%
of New Zealand’s population
live within a two hour drive
of the global middle class will be
residents of the Asia-Pacific
region by 20301
New Zealand’s share of South
East Asia & Pacific outbound
tourism2
Strong pipeline of new
aircraft deliveries
0.7%
2/3rds
1) E&Y; 2) Auckland Airport analysis, World Bank; 3) As of July 2015, Colliers
Highest individual footfall
of any retail operator in NZ
International destinations,
7 direct China destinations
46 Master plan indicates strong
capacity for growth
2017 Investor Roadshow
Hig
hlig
hts
Com
pany
overv
iew
Str
ate
gy f
or
our
futu
re
Fin
ancia
l
Info
rmatio
nO
utlo
ok
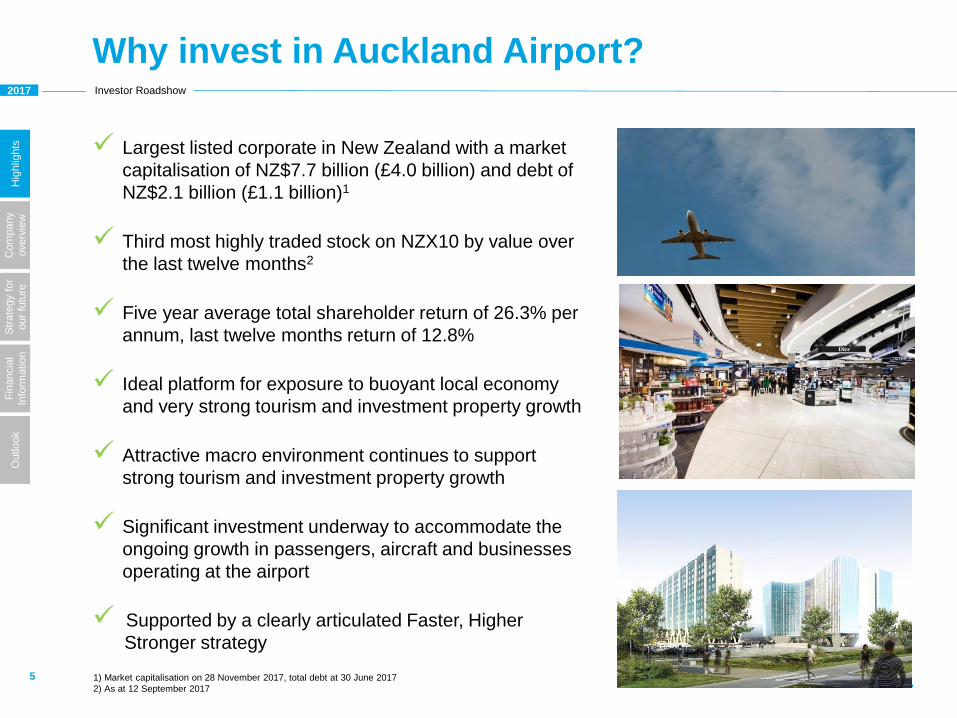
Why invest in Auckland Airport?
5
Largest listed corporate in New Zealand with a market
capitalisation of NZ$7.7 billion (£4.0 billion) and debt of
NZ$2.1 billion (£1.1 billion)1
Third most highly traded stock on NZX10 by value over
the last twelve months2
Five year average total shareholder return of 26.3% per
annum, last twelve months return of 12.8%
Ideal platform for exposure to buoyant local economy
and very strong tourism and investment property growth
Attractive macro environment continues to support
strong tourism and investment property growth
Significant investment underway to accommodate the
ongoing growth in passengers, aircraft and businesses
operating at the airport
Supported by a clearly articulated Faster, Higher
Stronger strategy
1) Market capitalisation on 28 November 2017, total debt at 30 June 2017
2) As at 12 September 2017
Com
pany
overv
iew

2017 Investor Roadshow
Hig
hlig
hts
Com
pany
overv
iew
Str
ate
gy f
or
our
futu
re
Fin
ancia
l
Info
rmatio
nO
utlo
ok
Robust momentum in the New Zealand economy
7
• The New Zealand economy has strong
momentum supported by high inward
migration, agriculture and tourism activity
combined with supportive monetary policy
settings
• At June 2017 New Zealand’s GDP grew
2.5% compared to the same quarter in
2016, ahead of most of our trade partners
• Annual average real GDP growth is
expected to be 3.2% in June 2018 and 3.7%
in 20191
• New Zealand’s population is 4.8 million2 and
the country is experiencing historic high net
migration
– net gain of 71,000 migrants in the Sep-17
year led by China, India, UK, South Africa
and the Philippines2
• Tourism sector experiencing strong growth
with total international visitor arrivals up 9%
in 2017 to 3.7 million2
1) New Zealand Treasury, 2) Statistics New Zealand Source: Statistics New Zealand
1.6%
1.7%
1.8%
2.2%
2.3%
2.4%
2.5%
3.7%
0.0% 0.5% 1.0% 1.5% 2.0% 2.5% 3.0% 3.5% 4.0%
Japan
United Kingdom
Australia
United States
Euro area (19 countries)
OECD
New Zealand
Canada
GDP % change from same quarterprevious year (as at Jun-17)
-0.2%
0.2%
0.6%
1.0%
1.4%
1.8%
2.2%
2.6%
3.0%
3.4%
Jun
-11
Dec-1
1
Jun
-12
Dec-1
2
Jun
-13
Dec-1
3
Jun
-14
Dec-1
4
Jun
-15
Dec-1
5
Jun
-16
Dec-1
6
Jun
-17
Gross domestic product (real)Quarterly growth and annual growth
Quarterly growth (LHS) Annual growth (RHS)
2017 Investor Roadshow
Hig
hlig
hts
Com
pany
overv
iew
Str
ate
gy f
or
our
futu
re
Fin
ancia
l
Info
rmatio
nO
utlo
ok
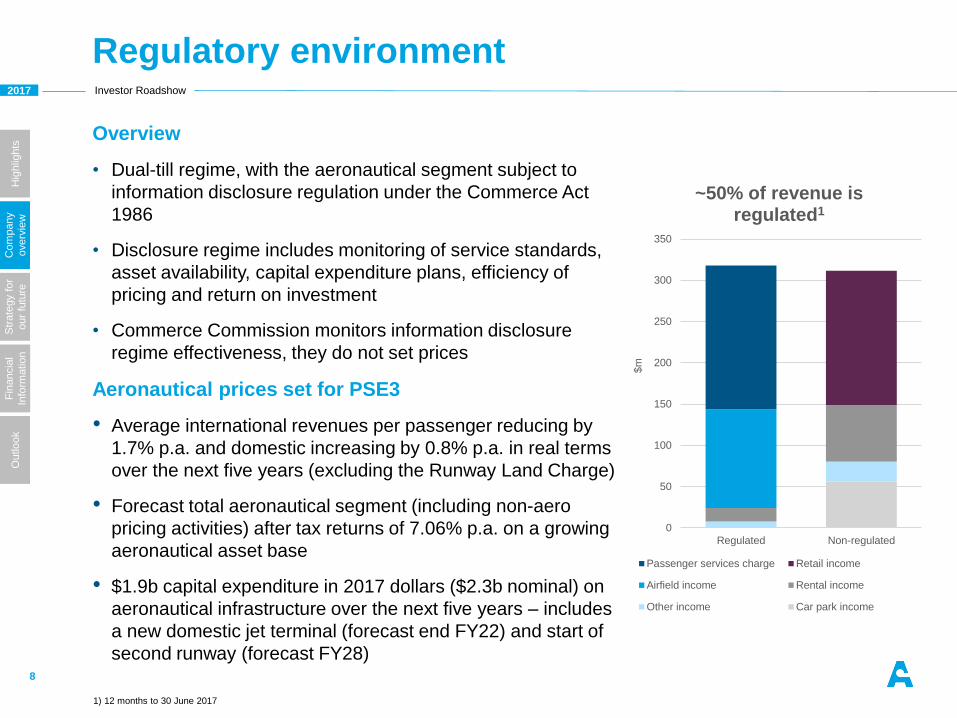
Overview
• Dual-till regime, with the aeronautical segment subject to
information disclosure regulation under the Commerce Act
1986
• Disclosure regime includes monitoring of service standards,
asset availability, capital expenditure plans, efficiency of
pricing and return on investment
• Commerce Commission monitors information disclosure
regime effectiveness, they do not set prices
Aeronautical prices set for PSE3
• Average international revenues per passenger reducing by
1.7% p.a. and domestic increasing by 0.8% p.a. in real terms
over the next five years (excluding the Runway Land Charge)
• Forecast total aeronautical segment (including non-aero
pricing activities) after tax returns of 7.06% p.a. on a growing
aeronautical asset base
• $1.9b capital expenditure in 2017 dollars ($2.3b nominal) on
aeronautical infrastructure over the next five years – includes
a new domestic jet terminal (forecast end FY22) and start of
second runway (forecast FY28)
Regulatory environment
8
1) 12 months to 30 June 2017
0
50
100
150
200
250
300
350
Regulated Non-regulated
$m
~50% of revenue is regulated1
Passenger services charge Retail income
Airfield income Rental income
Other income Car park income
2017 Investor Roadshow
Hig
hlig
hts
Com
pany
overv
iew
Str
ate
gy f
or
our
futu
re
Fin
ancia
l
Info
rmatio
nO
utlo
ok
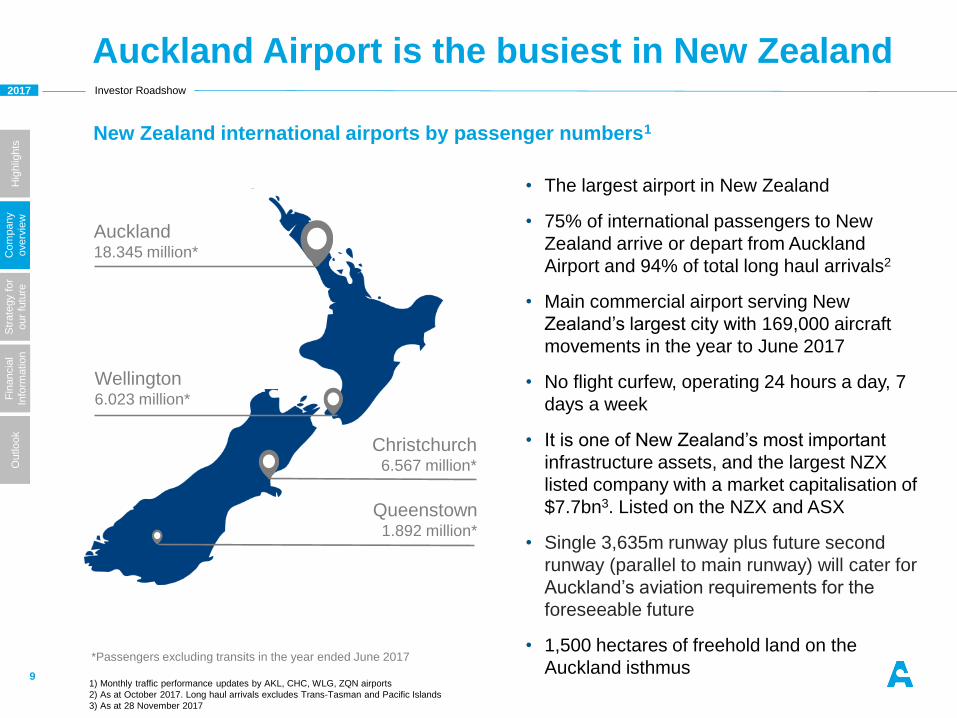
Auckland Airport is the busiest in New Zealand
9
• The largest airport in New Zealand
• 75% of international passengers to New
Zealand arrive or depart from Auckland
Airport and 94% of total long haul arrivals2
• Main commercial airport serving New
Zealand’s largest city with 169,000 aircraft
movements in the year to June 2017
• No flight curfew, operating 24 hours a day, 7
days a week
• It is one of New Zealand’s most important
infrastructure assets, and the largest NZX
listed company with a market capitalisation of
$7.7bn3. Listed on the NZX and ASX
• Single 3,635m runway plus future second
runway (parallel to main runway) will cater for
Auckland’s aviation requirements for the
foreseeable future
• 1,500 hectares of freehold land on the
Auckland isthmus*Passengers excluding transits in the year ended June 2017
1) Monthly traffic performance updates by AKL, CHC, WLG, ZQN airports
2) As at October 2017. Long haul arrivals excludes Trans-Tasman and Pacific Islands
3) As at 28 November 2017
Auckland18.345 million*
Wellington6.023 million*
Christchurch6.567 million*
Queenstown1.892 million*
New Zealand international airports by passenger numbers1
2017 Investor Roadshow
Hig
hlig
hts
Com
pany
overv
iew
Str
ate
gy f
or
our
futu
re
Fin
ancia
l
Info
rmatio
nO
utlo
ok
Doha
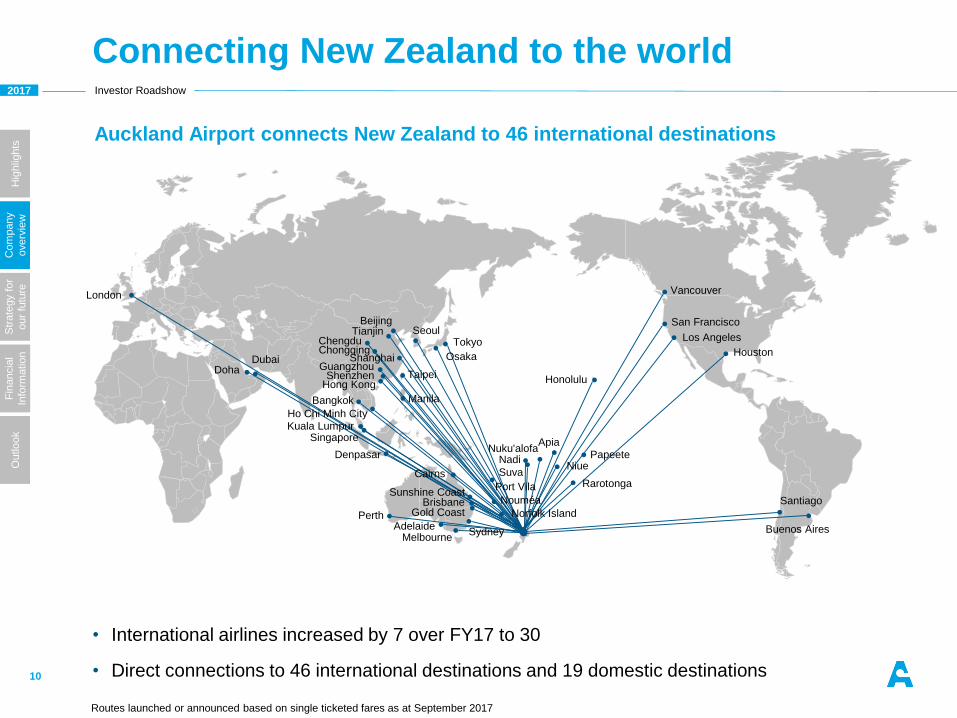
Connecting New Zealand to the world
10
Dubai
Honolulu
Guangzhou
Chongqing
Tianjin
Bangkok
Denpasar
Hong Kong
Tokyo
BeijingSeoul
London
San Francisco
Los Angeles
Vancouver
Santiago
Buenos Aires
Houston
Adelaide
Brisbane
Melbourne
Perth
Apia
Nadi
SuvaRarotonga
Auckland Airport connects New Zealand to 46 international destinations
Nouméa
Port Vila
Norfolk Island
Niue
Nuku'alofaPapeete
Singapore
Sydney
Gold Coast
• International airlines increased by 7 over FY17 to 30
• Direct connections to 46 international destinations and 19 domestic destinations
Routes launched or announced based on single ticketed fares as at September 2017
Osaka
Cairns
Sunshine Coast
Taipei
Manila
Ho Chi Minh CityKuala Lumpur
Shenzhen
Chengdu
Shanghai
2017 Investor Roadshow
Hig
hlig
hts
Com
pany
overv
iew
Str
ate
gy f
or
our
futu
re
Fin
ancia
l
Info
rmatio
nO
utlo
ok
0.0
2.0
4.0
6.0
8.0
10.0
12.0
14.0
16.0
18.0
20.0
FY00 FY01 FY02 FY03 FY04 FY05 FY06 FY07 FY08 FY09 FY10 FY11 FY12 FY13 FY14 FY15 FY16 FY17
Annual passengers
(m
)
Half 1 Half 2
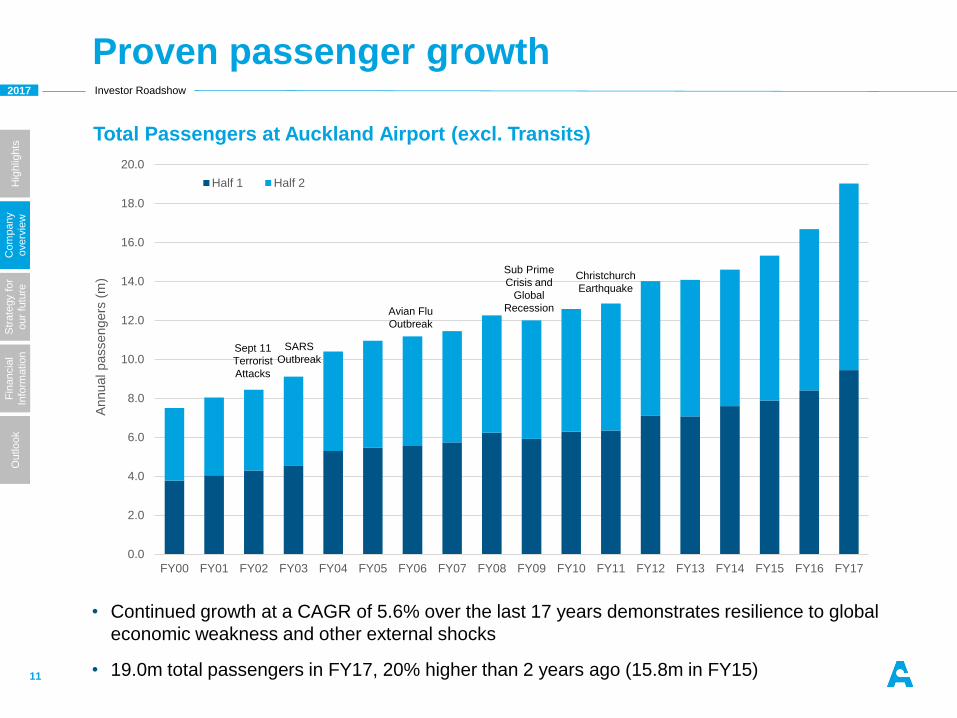
Proven passenger growth
11
• Continued growth at a CAGR of 5.6% over the last 17 years demonstrates resilience to global
economic weakness and other external shocks
• 19.0m total passengers in FY17, 20% higher than 2 years ago (15.8m in FY15)
Sept 11
Terrorist
Attacks
SARS
Outbreak
Avian Flu
Outbreak
Sub Prime
Crisis and
Global
Recession
Christchurch
Earthquake
Total Passengers at Auckland Airport (excl. Transits)
2017 Investor Roadshow
Hig
hlig
hts
Com
pany
overv
iew
Str
ate
gy f
or
our
futu
re
Fin
ancia
l
Info
rmatio
nO
utlo
ok
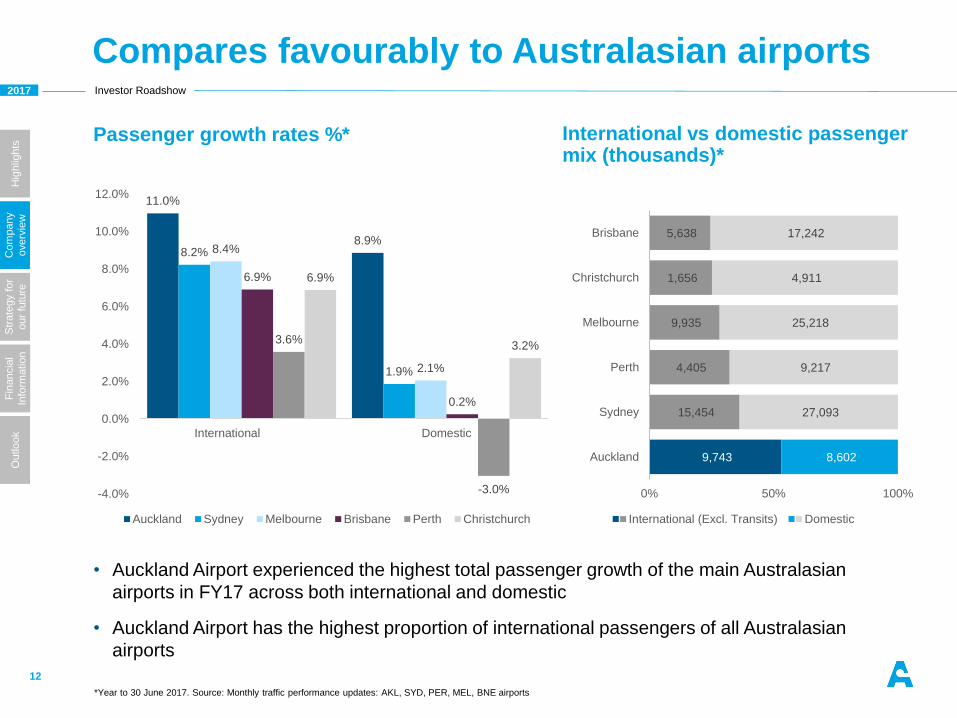
Compares favourably to Australasian airports
12
Passenger growth rates %*
• Auckland Airport experienced the highest total passenger growth of the main Australasian
airports in FY17 across both international and domestic
• Auckland Airport has the highest proportion of international passengers of all Australasian
airports
International vs domestic passenger mix (thousands)*
*Year to 30 June 2017. Source: Monthly traffic performance updates: AKL, SYD, PER, MEL, BNE airports
11.0%
8.9%8.2%
1.9%
8.4%
2.1%
6.9%
0.2%
3.6%
-3.0%
6.9%
3.2%
-4.0%
-2.0%
0.0%
2.0%
4.0%
6.0%
8.0%
10.0%
12.0%
International YOY Domestic
Auckland Sydney Melbourne Brisbane Perth Christchurch
9,743
15,454
4,405
9,935
1,656
5,638
8,602
27,093
9,217
25,218
4,911
17,242
0% 50% 100%
Auckland
Sydney
Perth
Melbourne
Christchurch
Brisbane
International (Excl. Transits) Domestic
2017 Investor Roadshow
Hig
hlig
hts
Com
pany
overv
iew
Str
ate
gy f
or
our
futu
re
Fin
ancia
l
Info
rmatio
nO
utlo
ok
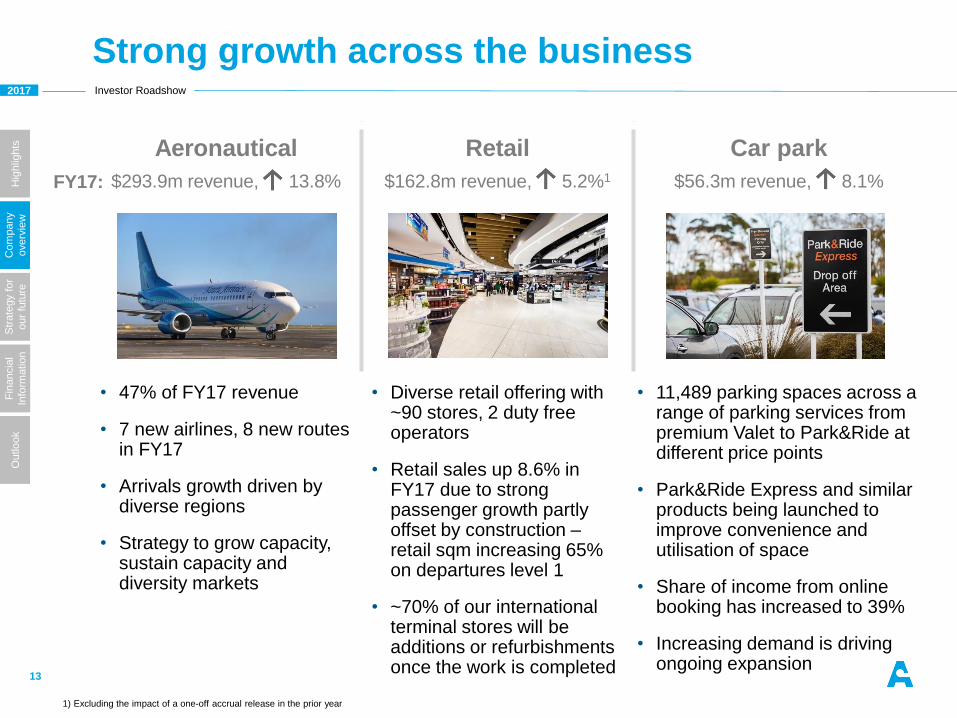
Aeronautical
$293.9m revenue, 13.8%
Retail
$162.8m revenue, 5.2%1
Car park
$56.3m revenue, 8.1%
• 47% of FY17 revenue
• 7 new airlines, 8 new routes in FY17
• Arrivals growth driven by diverse regions
• Strategy to grow capacity, sustain capacity and diversity markets
• Diverse retail offering with ~90 stores, 2 duty free operators
• Retail sales up 8.6% in FY17 due to strong passenger growth partly offset by construction –retail sqm increasing 65% on departures level 1
• ~70% of our international terminal stores will be additions or refurbishments once the work is completed
• 11,489 parking spaces across a range of parking services from premium Valet to Park&Ride at different price points
• Park&Ride Express and similar products being launched to improve convenience and utilisation of space
• Share of income from online booking has increased to 39%
• Increasing demand is driving ongoing expansion
Strong growth across the business
13
1) Excluding the impact of a one-off accrual release in the prior year
FY17:
2017 Investor Roadshow
Hig
hlig
hts
Com
pany
overv
iew
Str
ate
gy f
or
our
futu
re
Fin
ancia
l
Info
rmatio
nO
utlo
ok
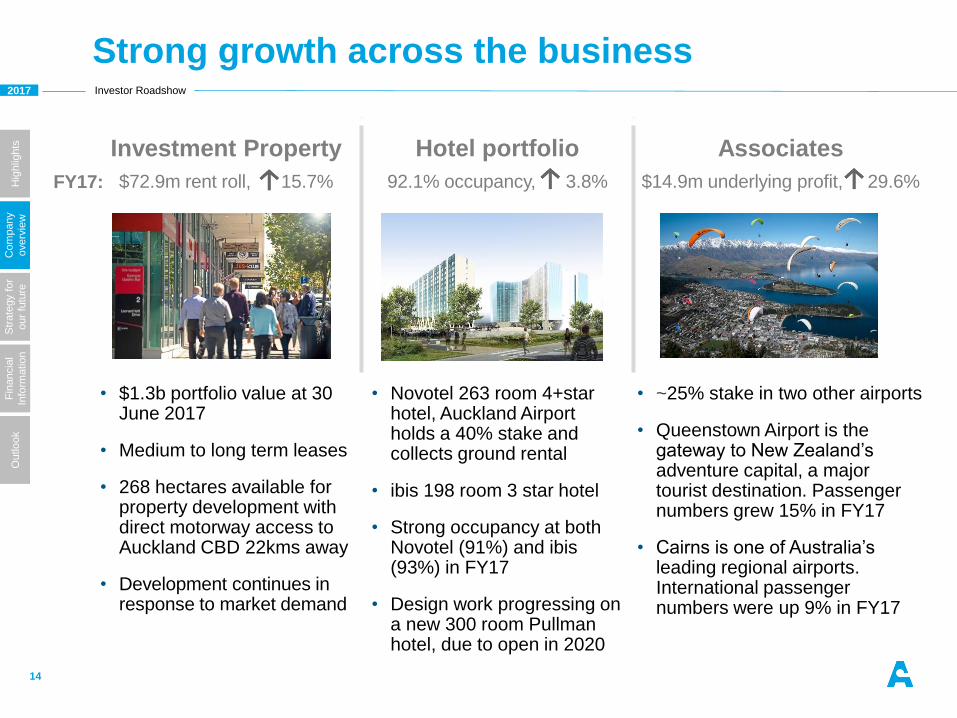
Investment Property
$72.9m rent roll, 15.7%
Hotel portfolio
92.1% occupancy, 3.8%
Associates
$14.9m underlying profit, 29.6%
• $1.3b portfolio value at 30 June 2017
• Medium to long term leases
• 268 hectares available forproperty development with direct motorway access to Auckland CBD 22kms away
• Development continues in response to market demand
• Novotel 263 room 4+star hotel, Auckland Airport holds a 40% stake and collects ground rental
• ibis 198 room 3 star hotel
• Strong occupancy at both Novotel (91%) and ibis (93%) in FY17
• Design work progressing on a new 300 room Pullman hotel, due to open in 2020
• ~25% stake in two other airports
• Queenstown Airport is thegateway to New Zealand’s adventure capital, a major tourist destination. Passenger numbers grew 15% in FY17
• Cairns is one of Australia’s leading regional airports. International passenger numbers were up 9% in FY17
Strong growth across the business
14
FY17:
2017 Investor Roadshow
Hig
hlig
hts
Com
pany
overv
iew
Str
ate
gy f
or
our
futu
re
Fin
ancia
l
Info
rmatio
nO
utlo
ok
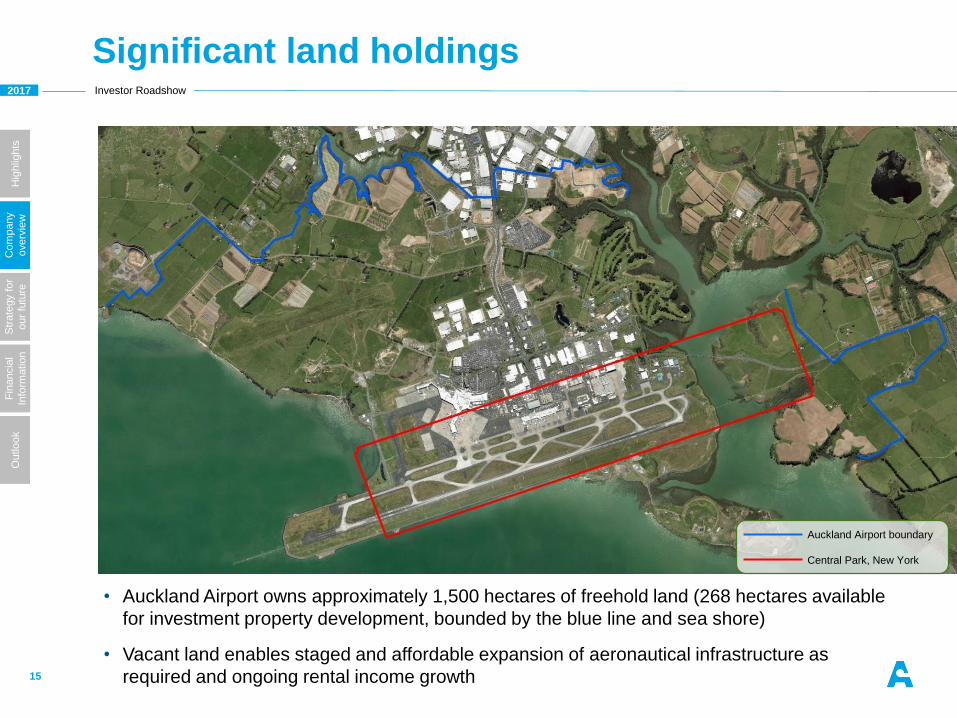
Significant land holdings
15
• Auckland Airport owns approximately 1,500 hectares of freehold land (268 hectares available
for investment property development, bounded by the blue line and sea shore)
• Vacant land enables staged and affordable expansion of aeronautical infrastructure as
required and ongoing rental income growth
Auckland Airport boundary
Central Park, New York
2017 Investor Roadshow
Hig
hlig
hts
Com
pany
overv
iew
Str
ate
gy f
or
our
futu
re
Fin
ancia
l
Info
rmatio
nO
utlo
ok
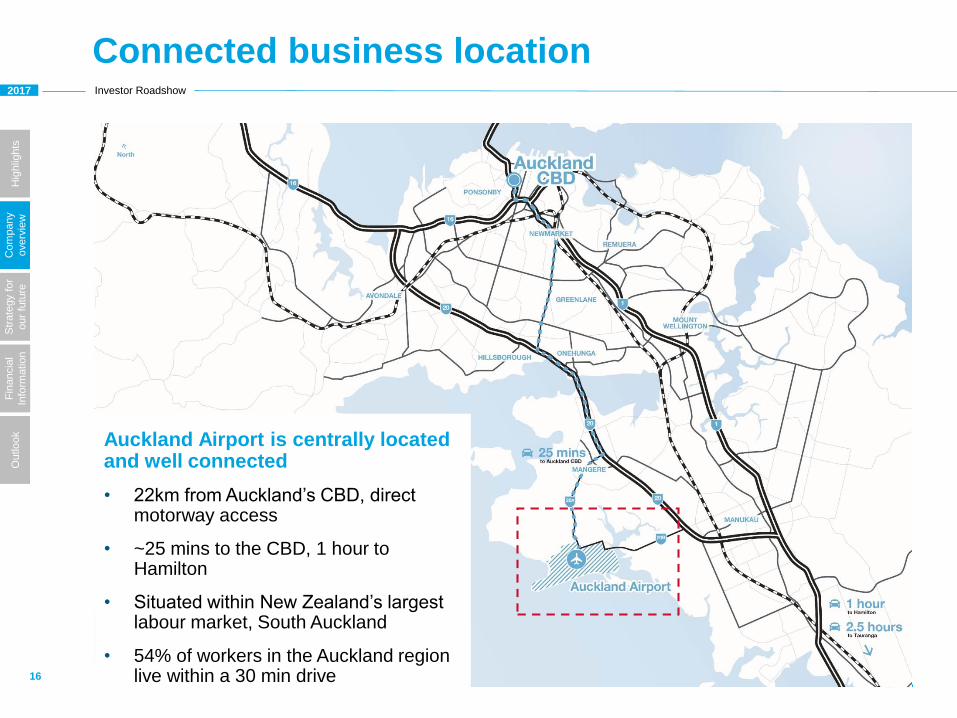
Connected business location
16
Auckland Airport is centrally located and well connected
• 22km from Auckland’s CBD, direct motorway access
• ~25 mins to the CBD, 1 hour to Hamilton
• Situated within New Zealand’s largest labour market, South Auckland
• 54% of workers in the Auckland region live within a 30 min drive
Str
ate
gy for
our fu
ture
2017 Investor Roadshow
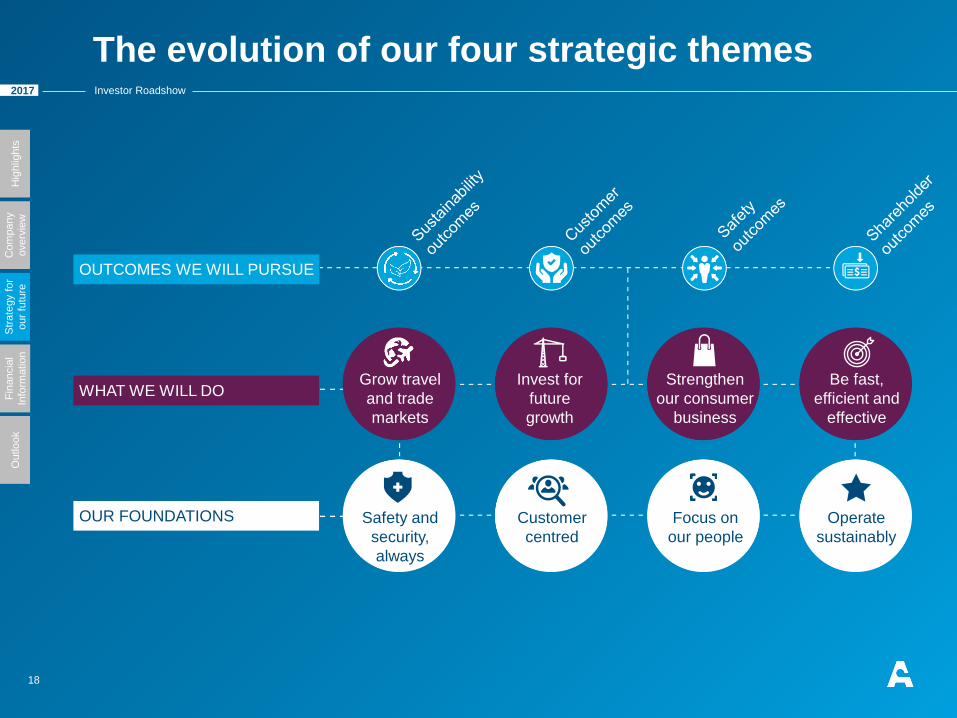
The evolution of our four strategic themes
18
OUR FOUNDATIONS
WHAT WE WILL DO
OUTCOMES WE WILL PURSUE
Safety and
security,
always
Customer
centred
Focus on
our people
Operate
sustainably
Strengthen
our consumer
business
Be fast,
efficient and
effective
Invest for
future
growth
Grow travel
and trade
markets
Hig
hlig
hts
Com
pany
overv
iew
Str
ate
gy f
or
our
futu
re
Fin
ancia
l
Info
rmatio
nO
utlo
ok
2017 Investor Roadshow
Hig
hlig
hts
Com
pany
overv
iew
Str
ate
gy f
or
our
futu
re
Fin
ancia
l
Info
rmatio
nO
utlo
ok
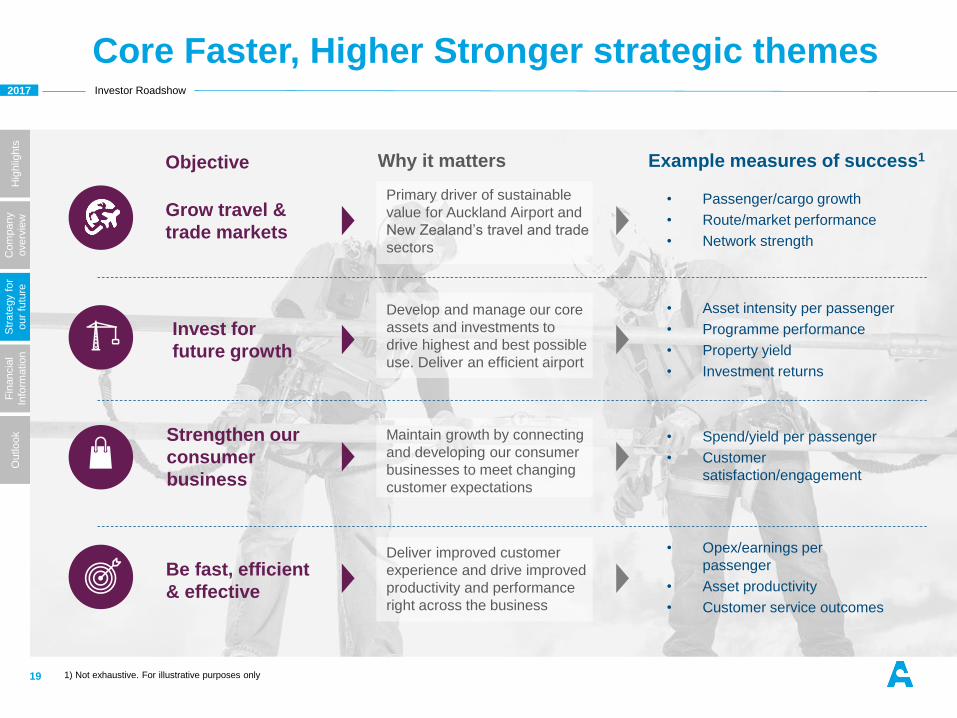
Core Faster, Higher Stronger strategic themes
19
• Passenger/cargo growth
• Route/market performance
• Network strength
Grow travel &
trade markets
Example measures of success1Objective
Primary driver of sustainable
value for Auckland Airport and
New Zealand’s travel and trade
sectors
Why it matters
• Spend/yield per passenger
• Customer
satisfaction/engagement
• Opex/earnings per
passenger
• Asset productivity
• Customer service outcomes
Be fast, efficient
& effective
Strengthen our
consumer
business
Maintain growth by connecting
and developing our consumer
businesses to meet changing
customer expectations
Deliver improved customer
experience and drive improved
productivity and performance
right across the business
• Asset intensity per passenger
• Programme performance
• Property yield
• Investment returns
Invest for
future growth
Develop and manage our core
assets and investments to
drive highest and best possible
use. Deliver an efficient airport
1) Not exhaustive. For illustrative purposes only
2017 Investor Roadshow
Hig
hlig
hts
Com
pany
overv
iew
Str
ate
gy f
or
our
futu
re
Fin
ancia
l
Info
rmatio
nO
utlo
ok
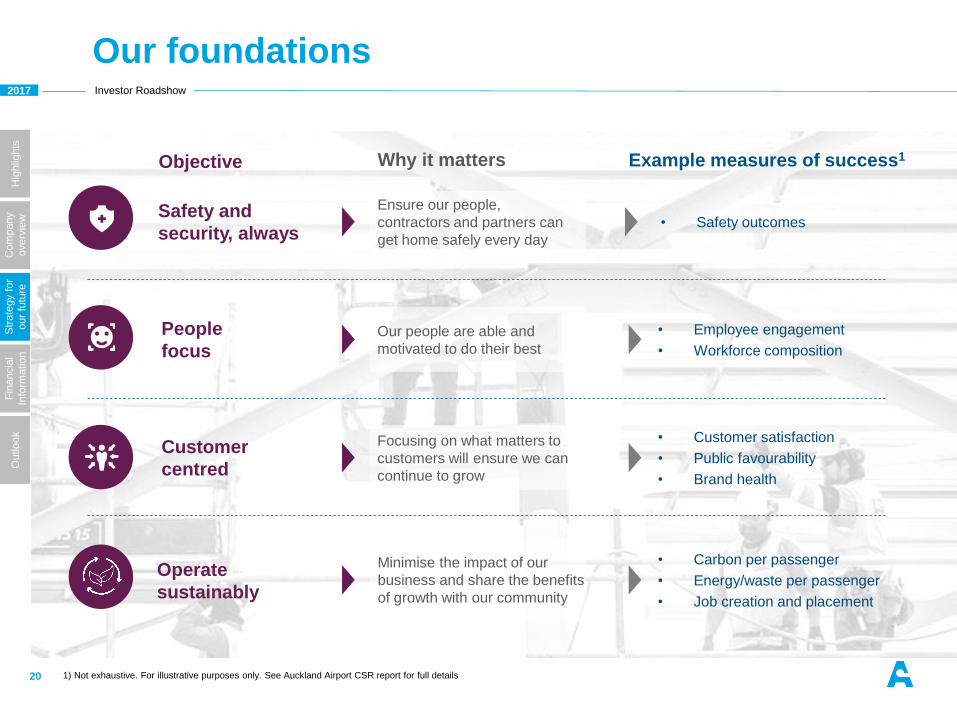
Safety and
security, always
Our foundations
20
Why it mattersObjective
Our people are able and
motivated to do their best
People
focus
• Employee engagement
• Workforce composition
Example measures of success1
Ensure our people,
contractors and partners can
get home safely every day
• Safety outcomes
Minimise the impact of our
business and share the benefits
of growth with our community
Operate
sustainably
• Carbon per passenger
• Energy/waste per passenger
• Job creation and placement
Customer
centred
Focusing on what matters to
customers will ensure we can
continue to grow
• Customer satisfaction
• Public favourability
• Brand health
1) Not exhaustive. For illustrative purposes only. See Auckland Airport CSR report for full details
2017 Investor Roadshow
Hig
hlig
hts
Com
pany
overv
iew
Str
ate
gy f
or
our
futu
re
Fin
ancia
l
Info
rmatio
nO
utlo
ok
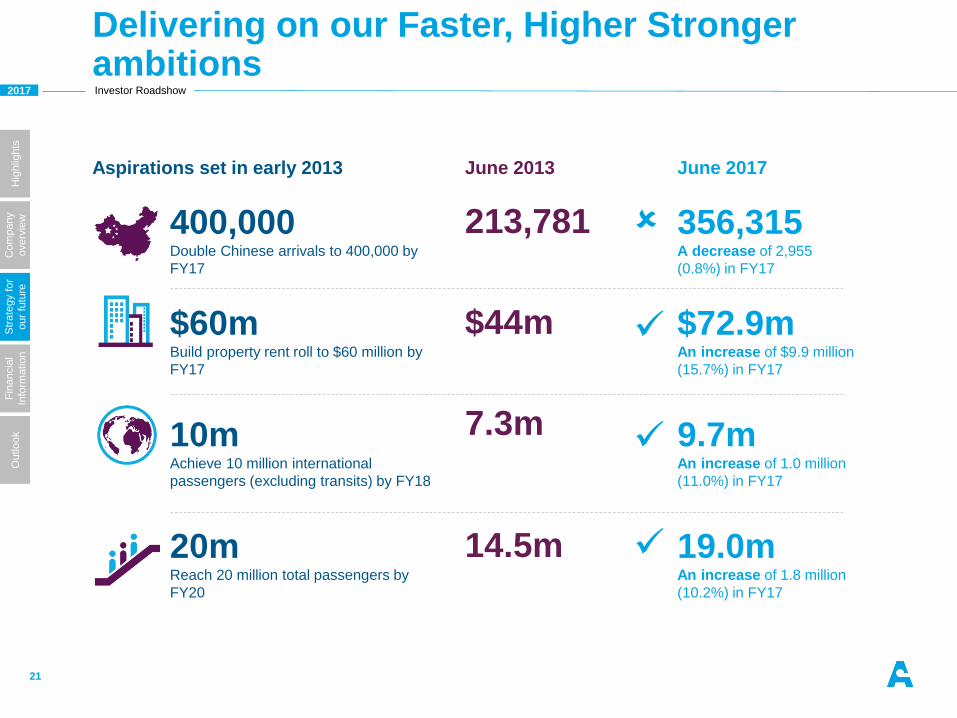
Aspirations set in early 2013 June 2013 June 2017
400,000Double Chinese arrivals to 400,000 by
FY17
213,781 356,315A decrease of 2,955
(0.8%) in FY17
$60mBuild property rent roll to $60 million by
FY17
$44m $72.9mAn increase of $9.9 million
(15.7%) in FY17
10mAchieve 10 million international
passengers (excluding transits) by FY18
7.3m 9.7mAn increase of 1.0 million
(11.0%) in FY17
20mReach 20 million total passengers by
FY20
14.5m 19.0mAn increase of 1.8 million
(10.2%) in FY17
Delivering on our Faster, Higher Stronger ambitions
21
2017 Investor Roadshow
Hig
hlig
hts
Com
pany
overv
iew
Str
ate
gy f
or
our
futu
re
Fin
ancia
l
Info
rmatio
nO
utlo
ok
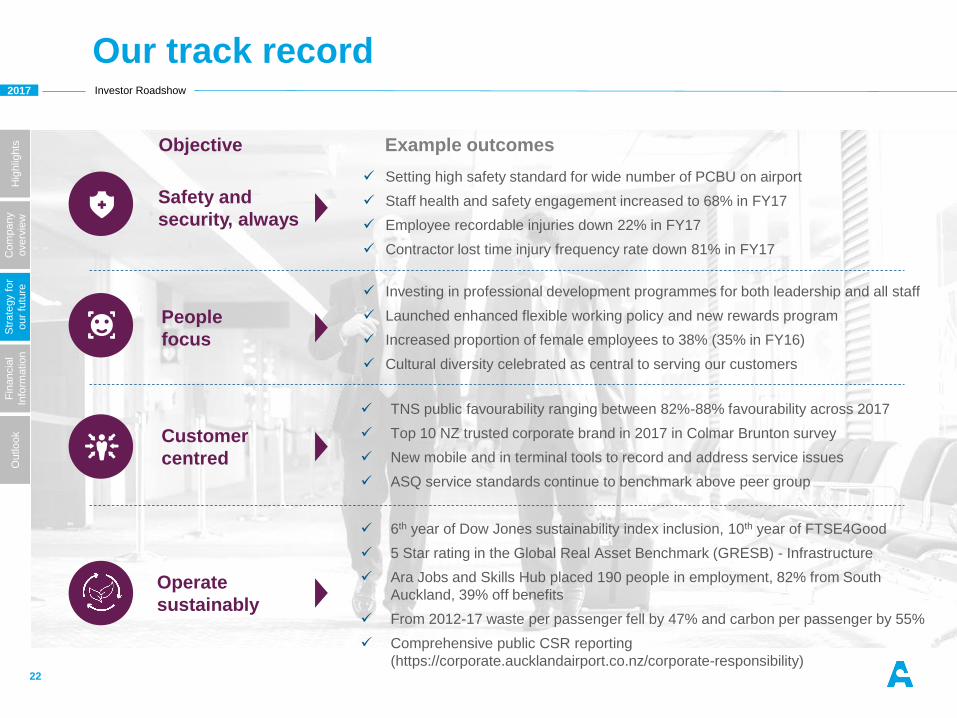
Setting high safety standard for wide number of PCBU on airport
Staff health and safety engagement increased to 68% in FY17
Employee recordable injuries down 22% in FY17
Contractor lost time injury frequency rate down 81% in FY17
Investing in professional development programmes for both leadership and all staff
Launched enhanced flexible working policy and new rewards program
Increased proportion of female employees to 38% (35% in FY16)
Cultural diversity celebrated as central to serving our customers
Our track record
22
Safety and
security, always
Example outcomesObjective
People
focus
Operate
sustainably
Customer
centred
TNS public favourability ranging between 82%-88% favourability across 2017
Top 10 NZ trusted corporate brand in 2017 in Colmar Brunton survey
New mobile and in terminal tools to record and address service issues
ASQ service standards continue to benchmark above peer group
6th year of Dow Jones sustainability index inclusion, 10th year of FTSE4Good
5 Star rating in the Global Real Asset Benchmark (GRESB) - Infrastructure
Ara Jobs and Skills Hub placed 190 people in employment, 82% from South
Auckland, 39% off benefits
From 2012-17 waste per passenger fell by 47% and carbon per passenger by 55%
Comprehensive public CSR reporting
(https://corporate.aucklandairport.co.nz/corporate-responsibility)
2017 Investor Roadshow
Hig
hlig
hts
Com
pany
overv
iew
Str
ate
gy f
or
our
futu
re
Fin
ancia
l
Info
rmatio
nO
utlo
ok
0.0
2.0
4.0
6.0
8.0
10.0
12.0
14.0
16.0
18.0
20.0
2013 2014 2015 2016 2017
Passenger
num
bers
(m
)
International Transits Domestic
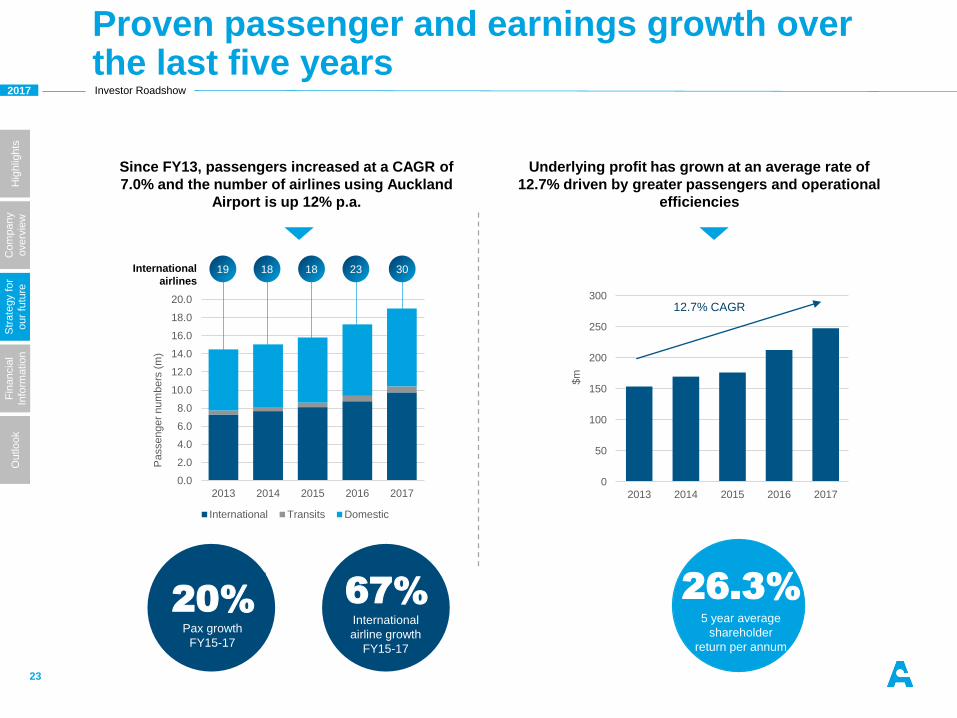
Proven passenger and earnings growth over the last five years
23
0
50
100
150
200
250
300
2013 2014 2015 2016 2017
$m
12.7% CAGR
Underlying profit has grown at an average rate of
12.7% driven by greater passengers and operational
efficiencies
International
airlines19 18 18 3023
Since FY13, passengers increased at a CAGR of
7.0% and the number of airlines using Auckland
Airport is up 12% p.a.
26.3%
5 year average
shareholder
return per annum
20%Pax growth
FY15-17
67%International
airline growth
FY15-17
2017 Investor Roadshow
Hig
hlig
hts
Com
pany
overv
iew
Str
ate
gy f
or
our
futu
re
Fin
ancia
l
Info
rmatio
nO
utlo
ok
0.0
1.0
2.0
3.0
4.0
5.0
6.0
7.0
8.0
9.0
10.0
Passengers
(m
)
International pax (excl. transits) Domestic pax Linear (International pax (excl. transits)) Linear (Domestic pax)
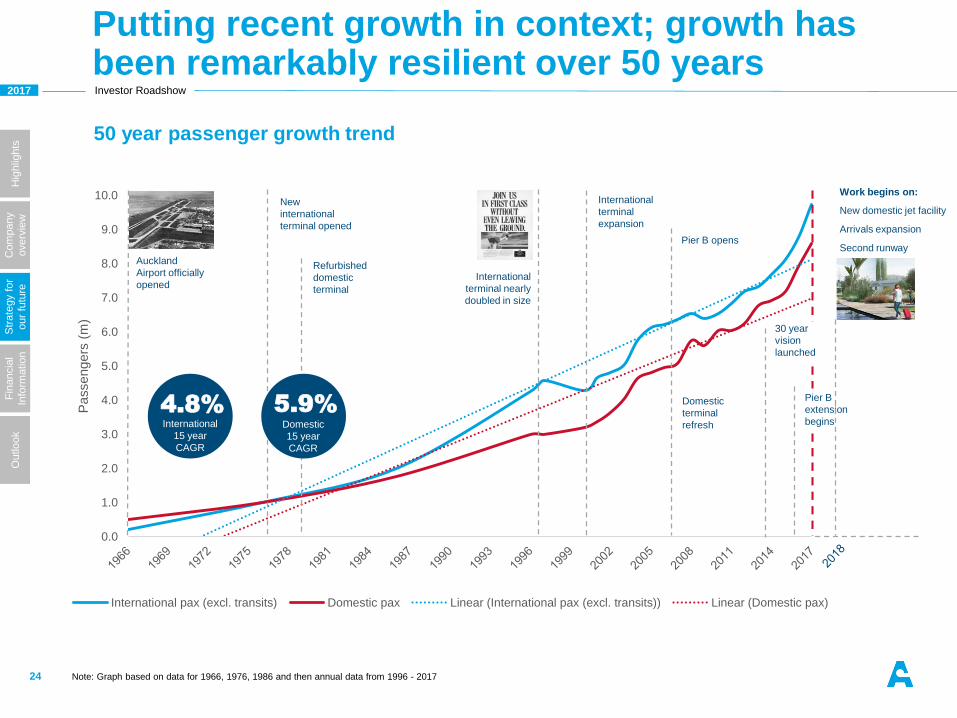
Putting recent growth in context; growth has been remarkably resilient over 50 years
24
50 year passenger growth trend
Note: Graph based on data for 1966, 1976, 1986 and then annual data from 1996 - 2017
Auckland
Airport officially
opened
New
international
terminal opened
Refurbished
domestic
terminal
International
terminal nearly
doubled in size
International
terminal
expansion
Pier B opens
Domestic
terminal
refresh
30 year
vision
launched
Pier B
extension
begins
Work begins on:
New domestic jet facility
Arrivals expansion
Second runway
5.9%
Domestic
15 year
CAGR
4.8%International
15 year
CAGR
2017 Investor Roadshow
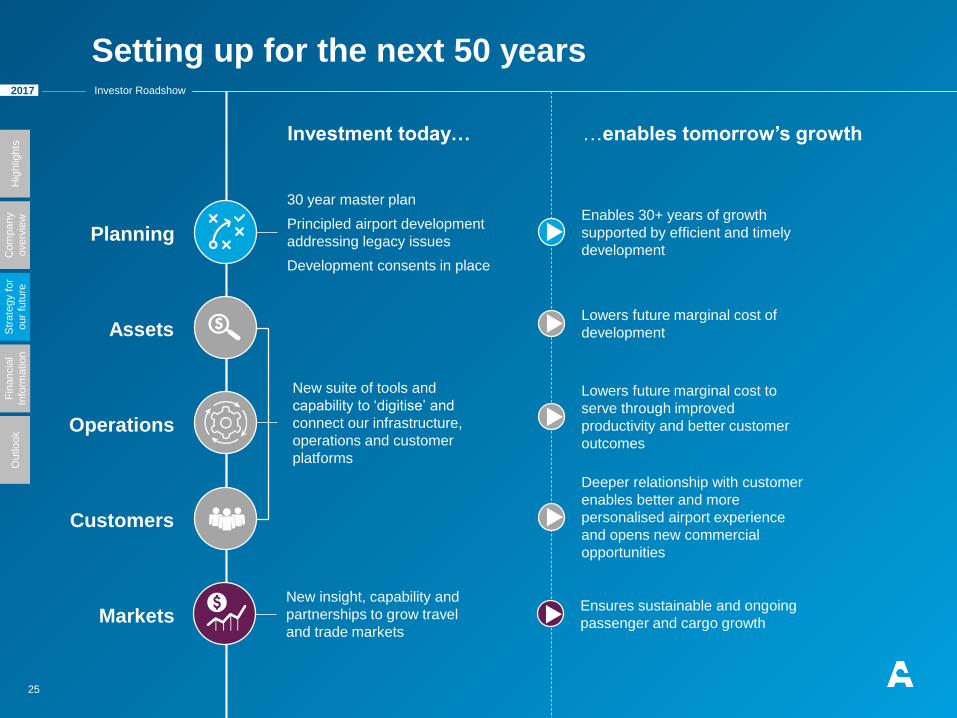
Setting up for the next 50 years
25
Investment today… …enables tomorrow’s growth
Planning
Assets
Operations
Markets
30 year master plan
Principled airport development
addressing legacy issues
Development consents in place
New suite of tools and
capability to ‘digitise’ and
connect our infrastructure,
operations and customer
platforms
Customers
New insight, capability and
partnerships to grow travel
and trade markets
Enables 30+ years of growth
supported by efficient and timely
development
Lowers future marginal cost of
development
Ensures sustainable and ongoing
passenger and cargo growth
Lowers future marginal cost to
serve through improved
productivity and better customer
outcomes
Deeper relationship with customer
enables better and more
personalised airport experience
and opens new commercial
opportunities
Hig
hlig
hts
Com
pany
overv
iew
Str
ate
gy f
or
our
futu
re
Fin
ancia
l
Info
rmatio
nO
utlo
ok
2017 Investor Roadshow
Hig
hlig
hts
Com
pany
overv
iew
Str
ate
gy f
or
our
futu
re
Fin
ancia
l
Info
rmatio
nO
utlo
ok
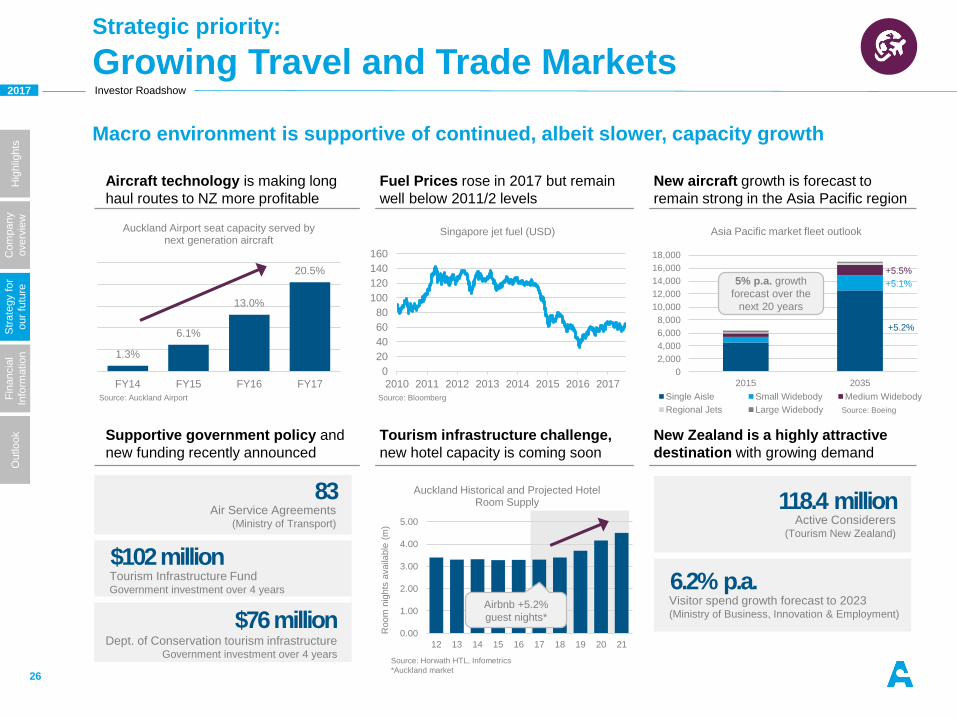
Aircraft technology is making long
haul routes to NZ more profitable
Fuel Prices rose in 2017 but remain
well below 2011/2 levels
New aircraft growth is forecast to
remain strong in the Asia Pacific region
Supportive government policy and
new funding recently announced
Tourism infrastructure challenge,
new hotel capacity is coming soon
New Zealand is a highly attractive
destination with growing demand
118.4 millionActive Considerers
(Tourism New Zealand)
6.2% p.a.Visitor spend growth forecast to 2023 (Ministry of Business, Innovation & Employment)
26
Macro environment is supportive of continued, albeit slower, capacity growth
1.3%
6.1%
13.0%
20.5%
FY14 FY15 FY16 FY17
Auckland Airport seat capacity served by next generation aircraft
0
20
40
60
80
100
120
140
160
2010 2011 2012 2013 2014 2015 2016 2017
Singapore jet fuel (USD)
Source: BloombergSource: Auckland Airport
83Air Service Agreements
(Ministry of Transport)
$102 millionTourism Infrastructure FundGovernment investment over 4 years
$76 millionDept. of Conservation tourism infrastructure
Government investment over 4 years
0.00
1.00
2.00
3.00
4.00
5.00
12 13 14 15 16 17 18 19 20 21
Room
nig
hts
availa
ble
(m
)
Auckland Historical and Projected Hotel Room Supply
Airbnb +5.2%
guest nights*
Source: Horwath HTL, Infometrics
*Auckland market
0
2,000
4,000
6,000
8,000
10,000
12,000
14,000
16,000
18,000
2015 2035
Asia Pacific market fleet outlook
Single Aisle Small Widebody Medium Widebody
Regional Jets Large Widebody Source: Boeing
5% p.a. growth
forecast over the
next 20 years
+5.2%
+5.1%
+5.5%
Strategic priority:
Growing Travel and Trade Markets
2017 Investor Roadshow
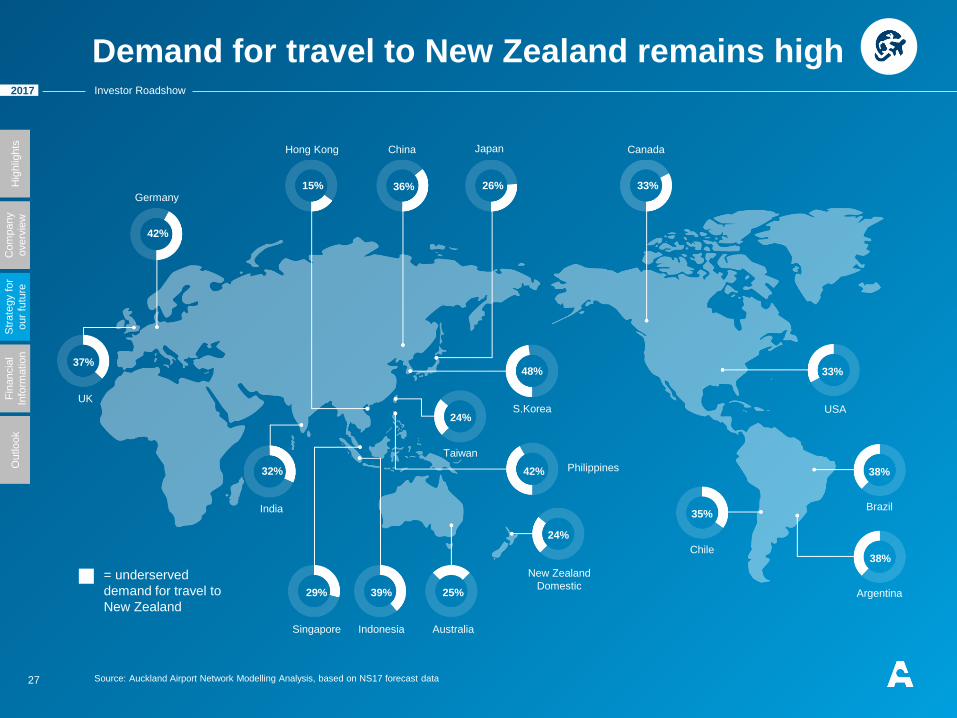
Demand for travel to New Zealand remains high
27
UK
37%
India
32%
Singapore
29%
Indonesia
39%
Australia
25%
New Zealand
Domestic
24%
Chile
35%
Argentina
38%
Brazil
38%
USA
33%
S.Korea
48%
Philippines42%
24%
Taiwan
Japan
26%
Canada
33%
China
36%
Hong Kong
15%Germany
42%
Source: Auckland Airport Network Modelling Analysis, based on NS17 forecast data
= underserved
demand for travel to
New Zealand
Hig
hlig
hts
Com
pany
overv
iew
Str
ate
gy f
or
our
futu
re
Fin
ancia
l
Info
rmatio
nO
utlo
ok
2017 Investor Roadshow
Hig
hlig
hts
Com
pany
overv
iew
Str
ate
gy f
or
our
futu
re
Fin
ancia
l
Info
rmatio
nO
utlo
ok
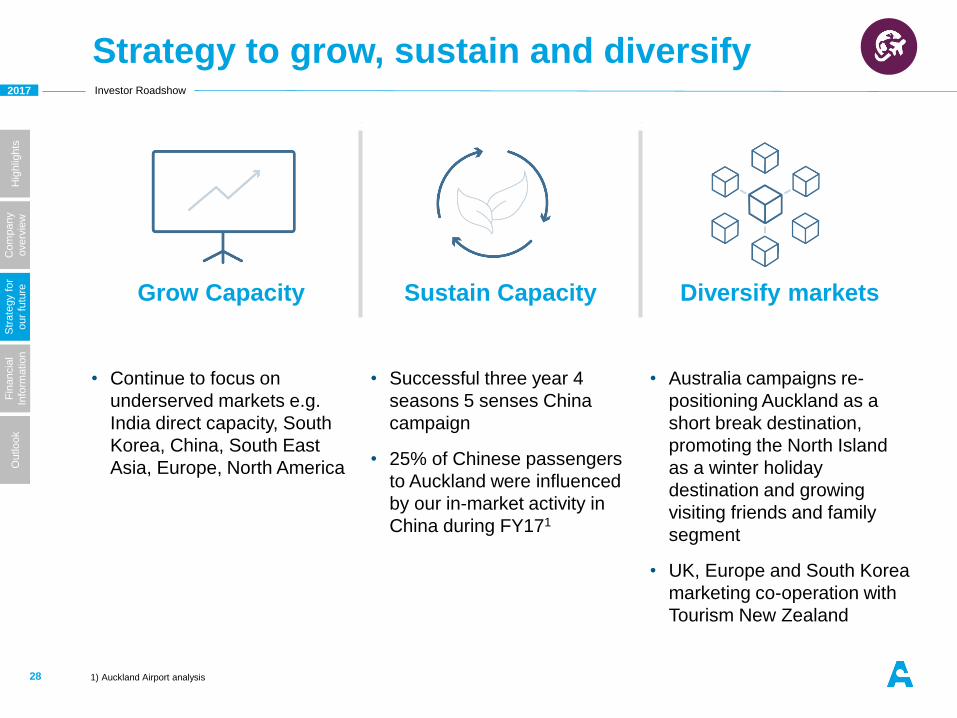
Grow Capacity Sustain Capacity Diversify markets
• Continue to focus on
underserved markets e.g.
India direct capacity, South
Korea, China, South East
Asia, Europe, North America
• Successful three year 4
seasons 5 senses China
campaign
• 25% of Chinese passengers
to Auckland were influenced
by our in-market activity in
China during FY171
• Australia campaigns re-
positioning Auckland as a
short break destination,
promoting the North Island
as a winter holiday
destination and growing
visiting friends and family
segment
• UK, Europe and South Korea
marketing co-operation with
Tourism New Zealand
Strategy to grow, sustain and diversify
28 1) Auckland Airport analysis
2017 Investor Roadshow
Hig
hlig
hts
Com
pany
overv
iew
Str
ate
gy f
or
our
futu
re
Fin
ancia
l
Info
rmatio
nO
utlo
ok
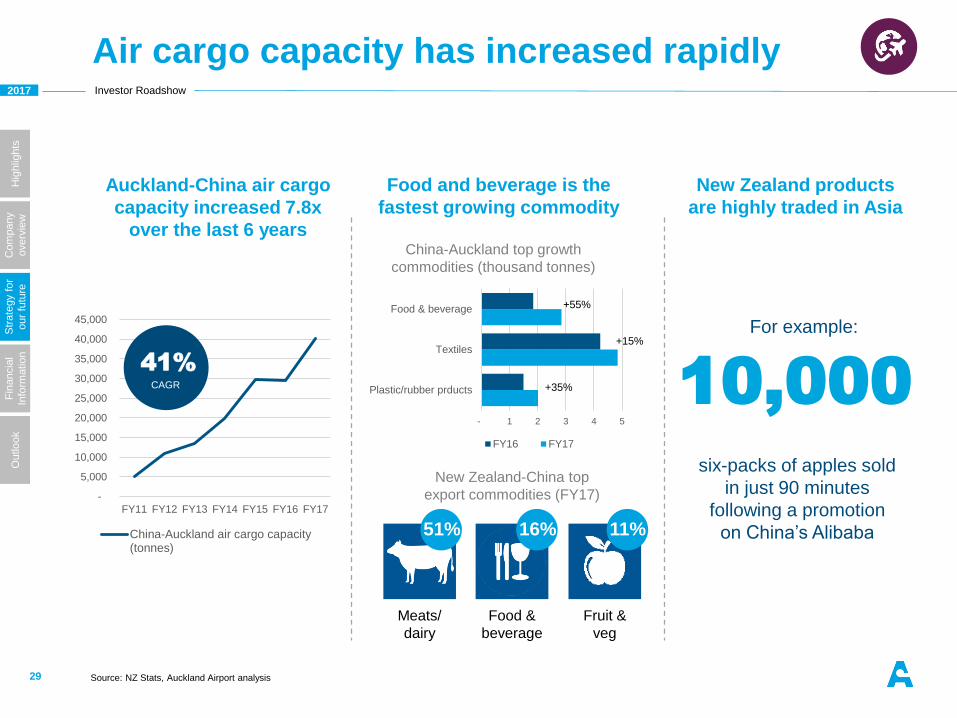
Air cargo capacity has increased rapidly
29
Auckland-China air cargo
capacity increased 7.8x
over the last 6 years
Source: NZ Stats, Auckland Airport analysis
New Zealand-China top
export commodities (FY17)
Meats/
dairy
Food and beverage is the
fastest growing commodity
New Zealand products
are highly traded in Asia
Fruit &
veg
Food &
beverage
-
5,000
10,000
15,000
20,000
25,000
30,000
35,000
40,000
45,000
FY11 FY12 FY13 FY14 FY15 FY16 FY17
China-Auckland air cargo capacity(tonnes)
- 1 2 3 4 5
Plastic/rubber prducts
Textiles
Food & beverage
FY16 FY17
China-Auckland top growth
commodities (thousand tonnes)
51% 11%16%
+55%
+35%
+15%
10,000
six-packs of apples sold
in just 90 minutes
following a promotion
on China’s Alibaba
41%
CAGR
For example:
2017 Investor Roadshow
Hig
hlig
hts
Com
pany
overv
iew
Str
ate
gy f
or
our
futu
re
Fin
ancia
l
Info
rmatio
nO
utlo
ok
Our strategy to grow trade markets
30 1) Ministry of Transport NZ
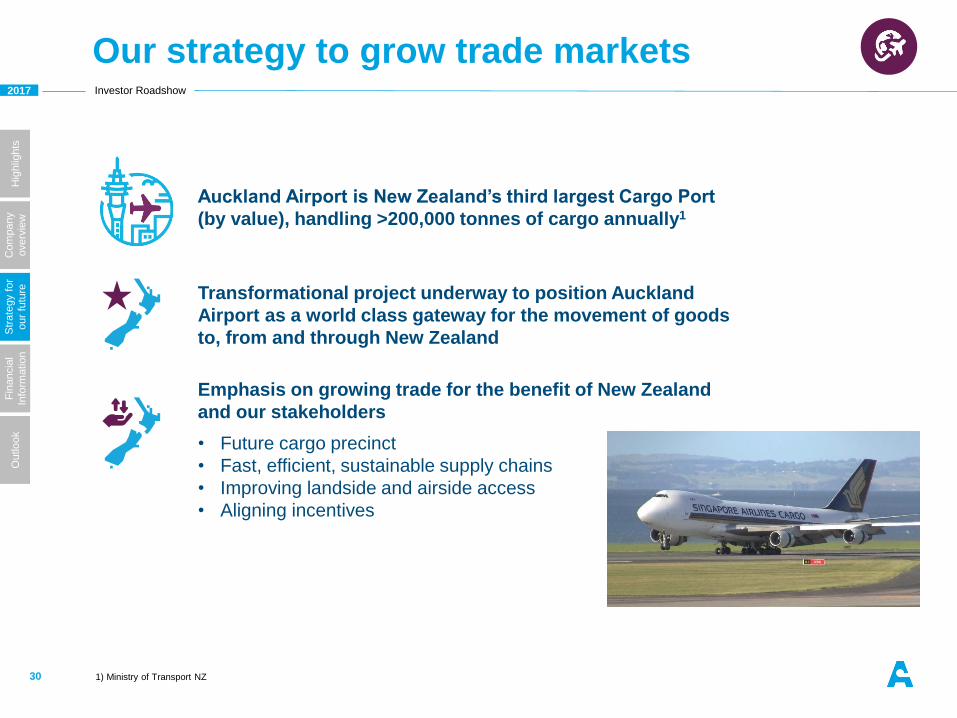
Auckland Airport is New Zealand’s third largest Cargo Port
(by value), handling >200,000 tonnes of cargo annually1
Transformational project underway to position Auckland
Airport as a world class gateway for the movement of goods
to, from and through New Zealand
Emphasis on growing trade for the benefit of New Zealand
and our stakeholders
• Future cargo precinct
• Fast, efficient, sustainable supply chains
• Improving landside and airside access
• Aligning incentives
2017 Investor Roadshow
Hig
hlig
hts
Com
pany
overv
iew
Str
ate
gy f
or
our
futu
re
Fin
ancia
l
Info
rmatio
nO
utlo
ok
Strategic priority:
Strengthen our consumer business
31
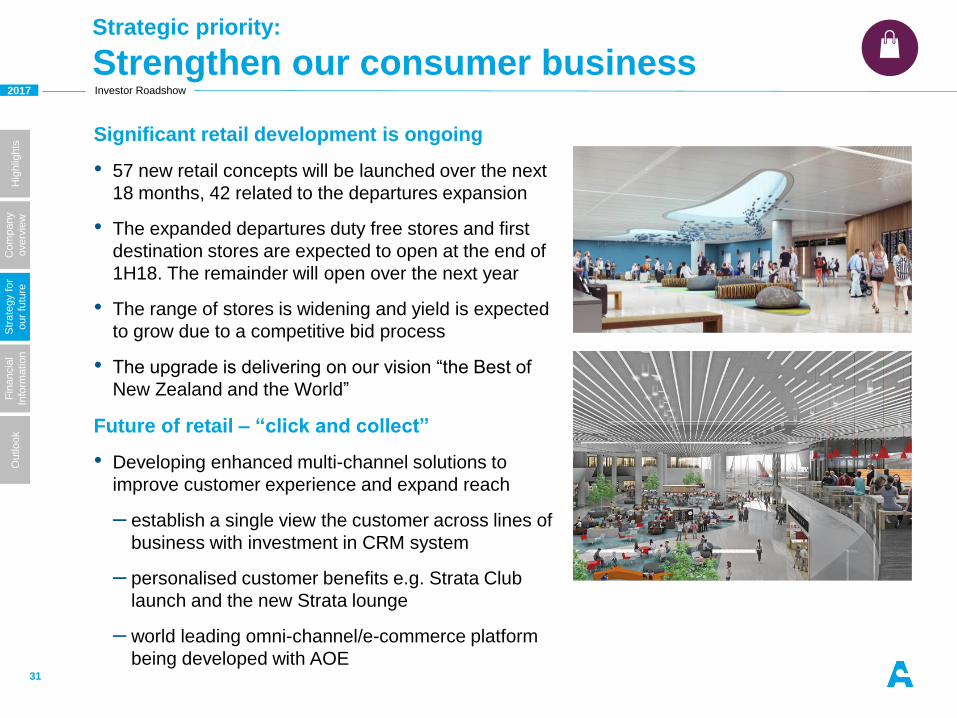
Significant retail development is ongoing
• 57 new retail concepts will be launched over the next
18 months, 42 related to the departures expansion
• The expanded departures duty free stores and first
destination stores are expected to open at the end of
1H18. The remainder will open over the next year
• The range of stores is widening and yield is expected
to grow due to a competitive bid process
• The upgrade is delivering on our vision “the Best of
New Zealand and the World”
Future of retail – “click and collect”
• Developing enhanced multi-channel solutions to
improve customer experience and expand reach
– establish a single view the customer across lines of
business with investment in CRM system
– personalised customer benefits e.g. Strata Club
launch and the new Strata lounge
– world leading omni-channel/e-commerce platform
being developed with AOE
2017 Investor Roadshow
Hig
hlig
hts
Com
pany
overv
iew
Str
ate
gy f
or
our
futu
re
Fin
ancia
l
Info
rmatio
nO
utlo
ok
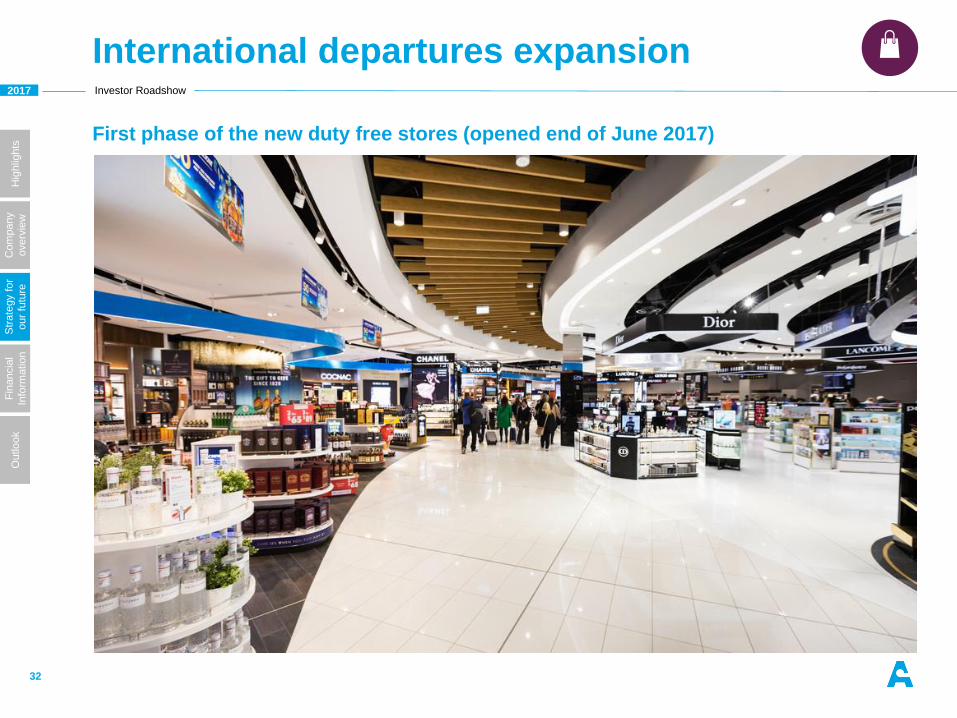
International departures expansion
32
First phase of the new duty free stores (opened end of June 2017)
2017 Investor Roadshow
Hig
hlig
hts
Com
pany
overv
iew
Str
ate
gy f
or
our
futu
re
Fin
ancia
l
Info
rmatio
nO
utlo
ok
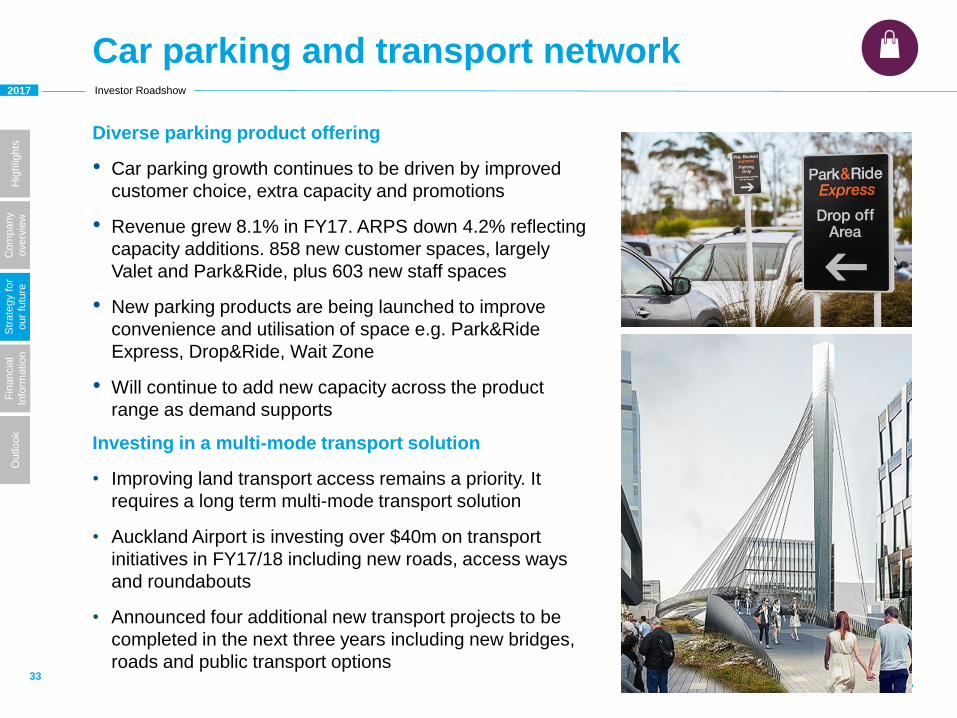
Diverse parking product offering
• Car parking growth continues to be driven by improved
customer choice, extra capacity and promotions
• Revenue grew 8.1% in FY17. ARPS down 4.2% reflecting
capacity additions. 858 new customer spaces, largely
Valet and Park&Ride, plus 603 new staff spaces
• New parking products are being launched to improve
convenience and utilisation of space e.g. Park&Ride
Express, Drop&Ride, Wait Zone
• Will continue to add new capacity across the product
range as demand supports
Investing in a multi-mode transport solution
• Improving land transport access remains a priority. It
requires a long term multi-mode transport solution
• Auckland Airport is investing over $40m on transport
initiatives in FY17/18 including new roads, access ways
and roundabouts
• Announced four additional new transport projects to be
completed in the next three years including new bridges,
roads and public transport options
Car parking and transport network
33
2017 Investor Roadshow
Hig
hlig
hts
Com
pany
overv
iew
Str
ate
gy f
or
our
futu
re
Fin
ancia
l
Info
rmatio
nO
utlo
ok
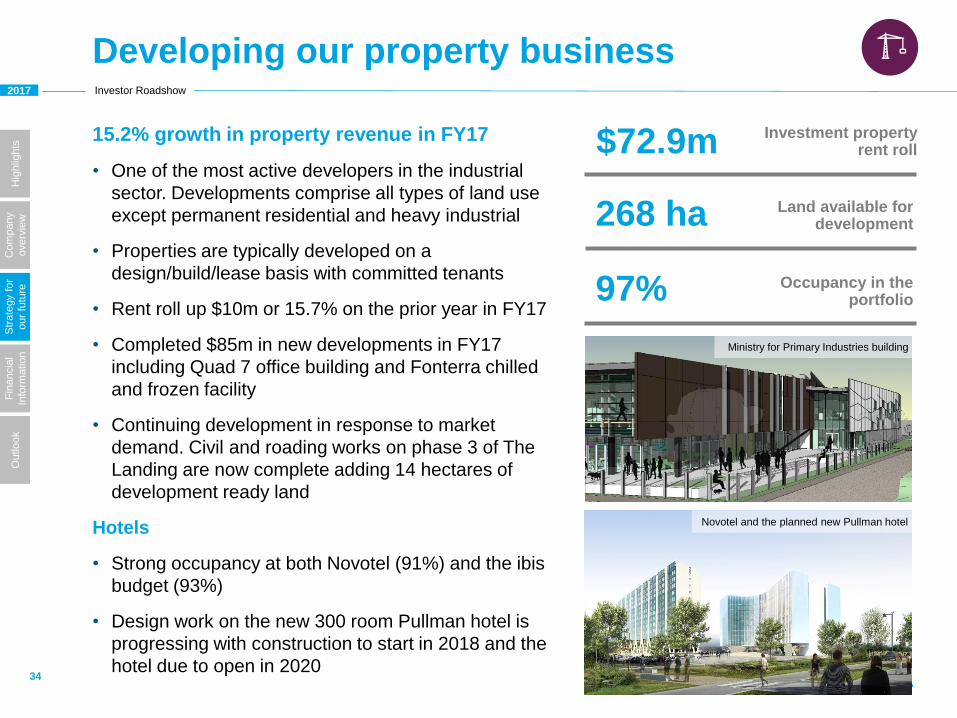
15.2% growth in property revenue in FY17
• One of the most active developers in the industrial
sector. Developments comprise all types of land use
except permanent residential and heavy industrial
• Properties are typically developed on a
design/build/lease basis with committed tenants
• Rent roll up $10m or 15.7% on the prior year in FY17
• Completed $85m in new developments in FY17
including Quad 7 office building and Fonterra chilled
and frozen facility
• Continuing development in response to market
demand. Civil and roading works on phase 3 of The
Landing are now complete adding 14 hectares of
development ready land
Hotels
• Strong occupancy at both Novotel (91%) and the ibis
budget (93%)
• Design work on the new 300 room Pullman hotel is
progressing with construction to start in 2018 and the
hotel due to open in 2020
Developing our property business
34
$72.9m Investment property rent roll
268 ha Land available for development
97% Occupancy in the portfolio
Ministry for Primary Industries building
Novotel and the planned new Pullman hotel
2017 Investor Roadshow
Hig
hlig
hts
Com
pany
overv
iew
Str
ate
gy f
or
our
futu
re
Fin
ancia
l
Info
rmatio
nO
utlo
ok
Strategic priority:
Be fast, efficient and effective
35
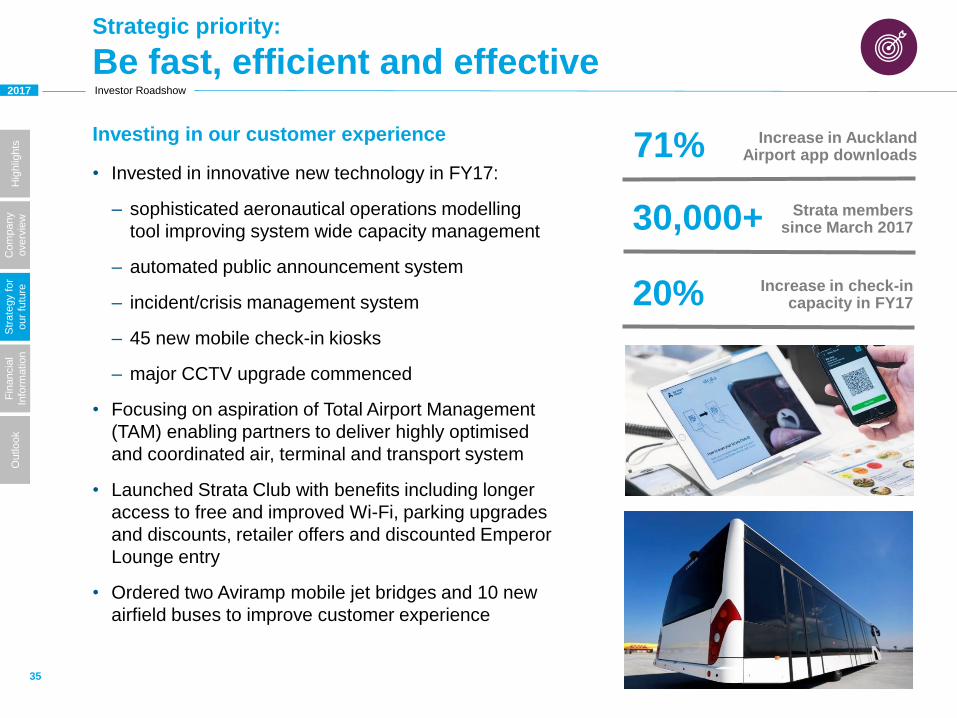
Investing in our customer experience
• Invested in innovative new technology in FY17:
– sophisticated aeronautical operations modelling
tool improving system wide capacity management
– automated public announcement system
– incident/crisis management system
– 45 new mobile check-in kiosks
– major CCTV upgrade commenced
• Focusing on aspiration of Total Airport Management
(TAM) enabling partners to deliver highly optimised
and coordinated air, terminal and transport system
• Launched Strata Club with benefits including longer
access to free and improved Wi-Fi, parking upgrades
and discounts, retailer offers and discounted Emperor
Lounge entry
• Ordered two Aviramp mobile jet bridges and 10 new
airfield buses to improve customer experience
71% Increase in Auckland Airport app downloads
30,000+ Strata members since March 2017
20% Increase in check-in capacity in FY17
2017 Investor Roadshow
Hig
hlig
hts
Com
pany
overv
iew
Str
ate
gy f
or
our
futu
re
Fin
ancia
l
Info
rmatio
nO
utlo
ok
Strategic priority:
Invest for future growth
36
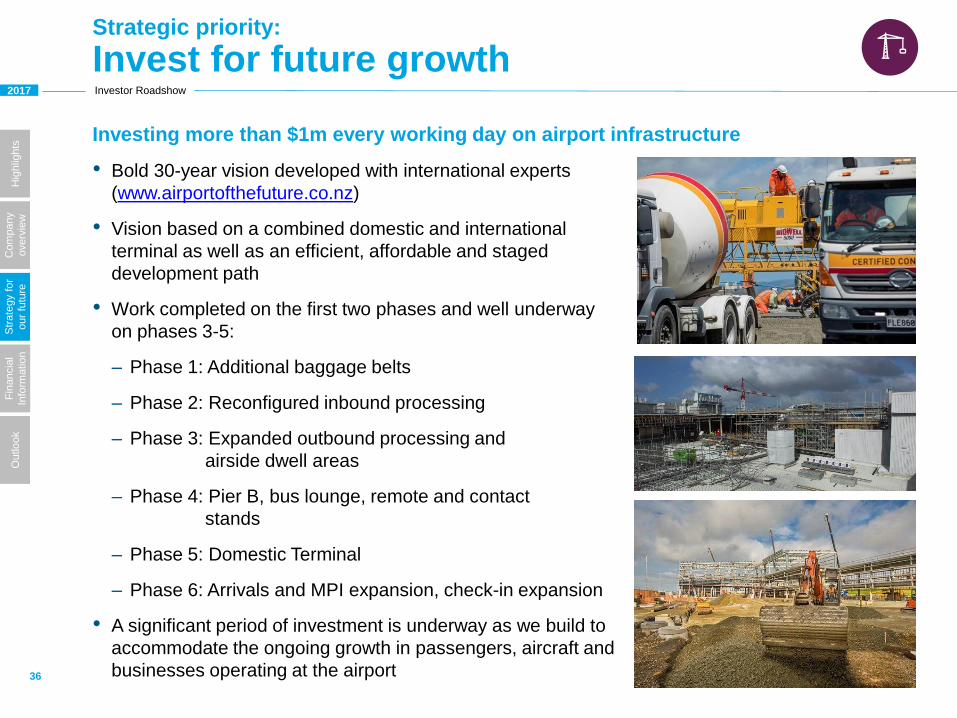
• Bold 30-year vision developed with international experts
(www.airportofthefuture.co.nz)
• Vision based on a combined domestic and international
terminal as well as an efficient, affordable and staged
development path
• Work completed on the first two phases and well underway
on phases 3-5:
– Phase 1: Additional baggage belts
– Phase 2: Reconfigured inbound processing
– Phase 3: Expanded outbound processing and
airside dwell areas
– Phase 4: Pier B, bus lounge, remote and contact
stands
– Phase 5: Domestic Terminal
– Phase 6: Arrivals and MPI expansion, check-in expansion
• A significant period of investment is underway as we build to
accommodate the ongoing growth in passengers, aircraft and
businesses operating at the airport
Investing more than $1m every working day on airport infrastructure
2017 Investor Roadshow
Hig
hlig
hts
Com
pany
overv
iew
Str
ate
gy f
or
our
futu
re
Fin
ancia
l
Info
rmatio
nO
utlo
ok
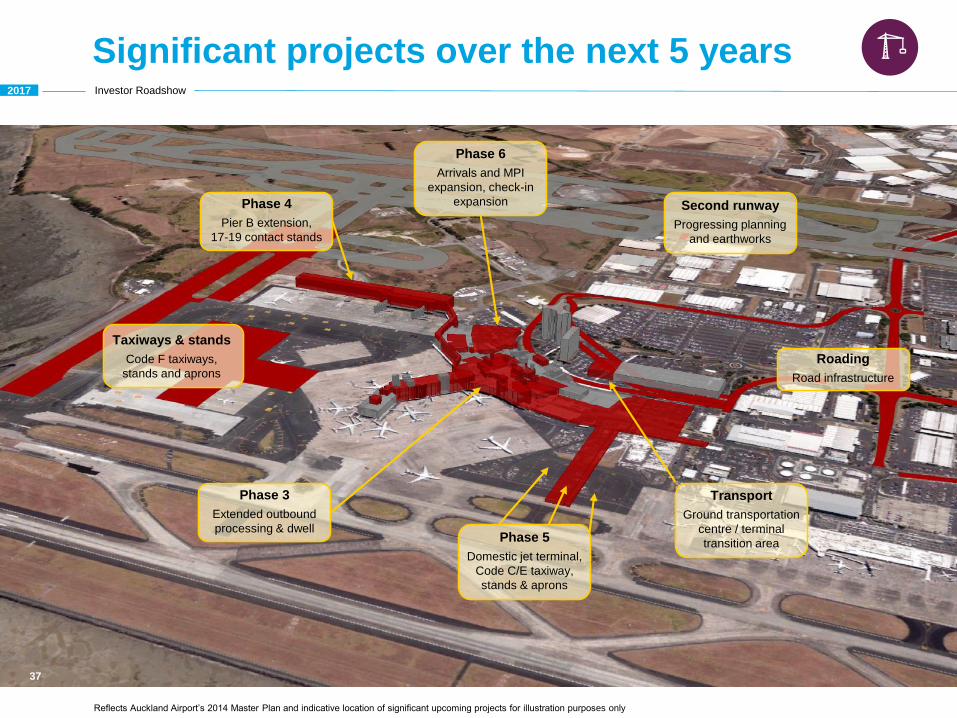
Significant projects over the next 5 years
37
Phase 4
Pier B extension,
17-19 contact stands
Phase 6
Arrivals and MPI
expansion, check-in
expansion Second runway
Progressing planning
and earthworks
Roading
Road infrastructure
Transport
Ground transportation
centre / terminal
transition areaPhase 5
Domestic jet terminal,
Code C/E taxiway,
stands & aprons
Phase 3
Extended outbound
processing & dwell
Taxiways & stands
Code F taxiways,
stands and aprons
Reflects Auckland Airport’s 2014 Master Plan and indicative location of significant upcoming projects for illustration purposes only
Fin
ancia
l in
form
ation
2017 Investor Roadshow
Hig
hlig
hts
Com
pany
overv
iew
Str
ate
gy f
or
our
futu
re
Fin
ancia
l
Info
rmatio
nO
utlo
ok
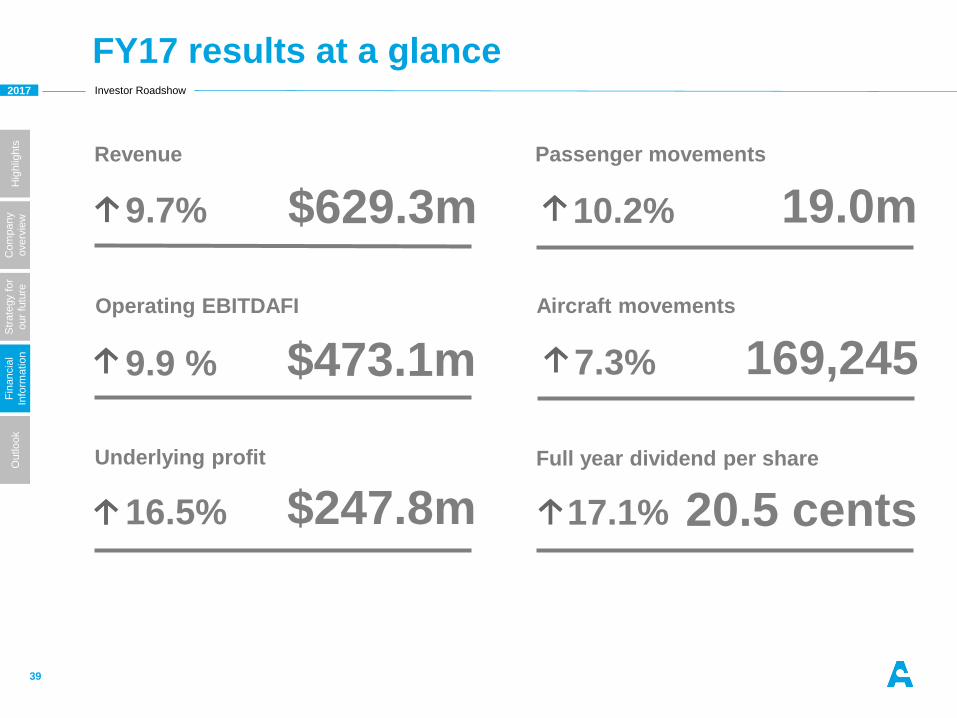
FY17 results at a glance
39
9.7% $629.3m
Revenue
Operating EBITDAFI
9.9 % $473.1m
Underlying profit
16.5% $247.8m
Full year dividend per share
17.1% 20.5 cents
Passenger movements
10.2% 19.0m
Aircraft movements
7.3% 169,245
2017 Investor Roadshow
Hig
hlig
hts
Com
pany
overv
iew
Str
ate
gy f
or
our
futu
re
Fin
ancia
l
Info
rmatio
nO
utlo
ok
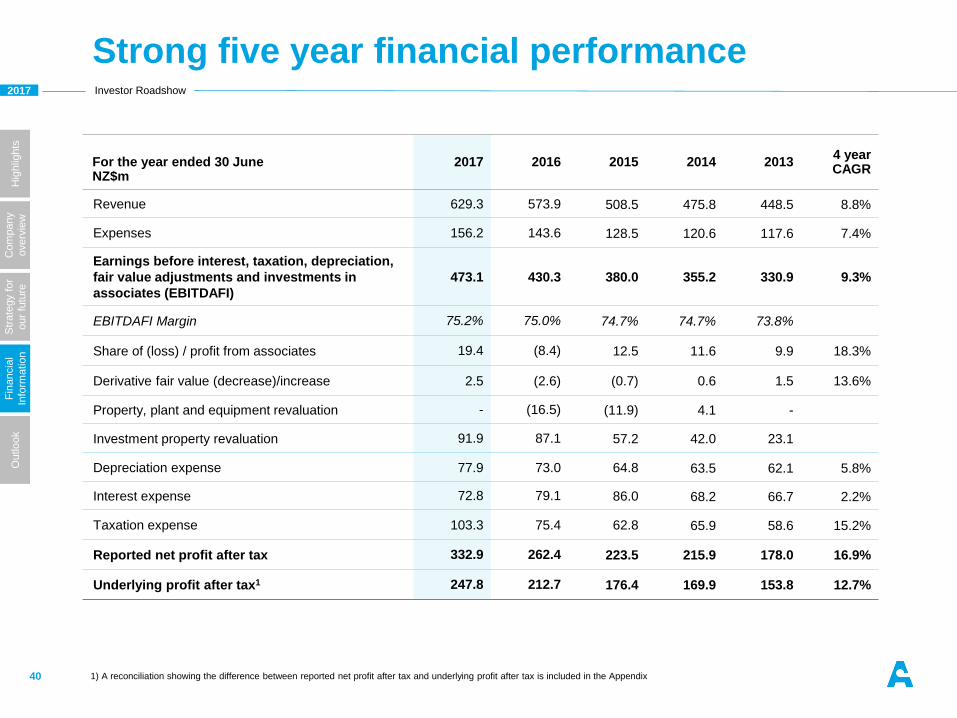
Strong five year financial performance
40
For the year ended 30 JuneNZ$m
2017 2016 2015 2014 20134 yearCAGR
Revenue 629.3 573.9 508.5 475.8 448.5 8.8%
Expenses 156.2 143.6 128.5 120.6 117.6 7.4%
Earnings before interest, taxation, depreciation,
fair value adjustments and investments in
associates (EBITDAFI)
473.1 430.3 380.0 355.2 330.9 9.3%
EBITDAFI Margin 75.2% 75.0% 74.7% 74.7% 73.8%
Share of (loss) / profit from associates 19.4 (8.4) 12.5 11.6 9.9 18.3%
Derivative fair value (decrease)/increase 2.5 (2.6) (0.7) 0.6 1.5 13.6%
Property, plant and equipment revaluation - (16.5) (11.9) 4.1 -
Investment property revaluation 91.9 87.1 57.2 42.0 23.1
Depreciation expense 77.9 73.0 64.8 63.5 62.1 5.8%
Interest expense 72.8 79.1 86.0 68.2 66.7 2.2%
Taxation expense 103.3 75.4 62.8 65.9 58.6 15.2%
Reported net profit after tax 332.9 262.4 223.5 215.9 178.0 16.9%
Underlying profit after tax1 247.8 212.7 176.4 169.9 153.8 12.7%
1) A reconciliation showing the difference between reported net profit after tax and underlying profit after tax is included in the Appendix
2017 Investor Roadshow
Hig
hlig
hts
Com
pany
overv
iew
Str
ate
gy f
or
our
futu
re
Fin
ancia
l
Info
rmatio
nO
utlo
ok
9.78.88.17.77.3
0.70.6
0.50.50.4
8.6
7.97.2
6.96.8
20172016201520142013
0.0
2.0
4.0
6.0
8.0
10.0
12.0
14.0
16.0
18.0
20.0
Mili
ons
International passengers excluding transits Transit passengers Domestic passengers
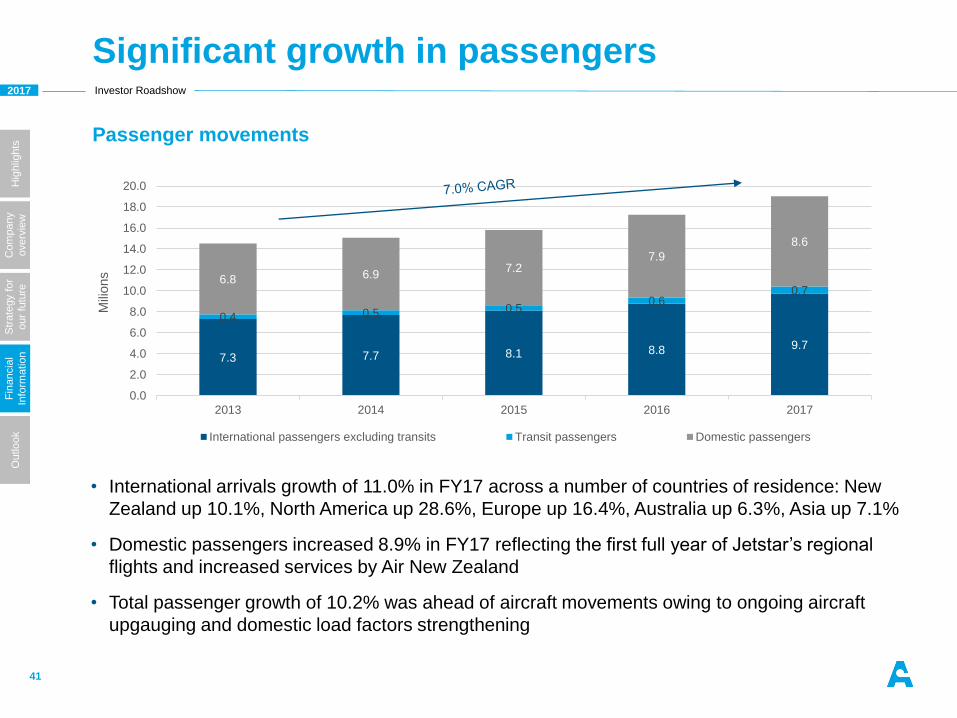
Significant growth in passengers
41
• International arrivals growth of 11.0% in FY17 across a number of countries of residence: New
Zealand up 10.1%, North America up 28.6%, Europe up 16.4%, Australia up 6.3%, Asia up 7.1%
• Domestic passengers increased 8.9% in FY17 reflecting the first full year of Jetstar’s regional
flights and increased services by Air New Zealand
• Total passenger growth of 10.2% was ahead of aircraft movements owing to ongoing aircraft
upgauging and domestic load factors strengthening
Passenger movements
2017 Investor Roadshow
Hig
hlig
hts
Com
pany
overv
iew
Str
ate
gy f
or
our
futu
re
Fin
ancia
l
Info
rmatio
nO
utlo
ok
5.64.94.64.34.1
2.22.1
1.91.91.8
20172016201520142013
0.0
1.0
2.0
3.0
4.0
5.0
6.0
7.0
8.0
9.0
Mill
ion
Domestic MCTOW
International MCTOW
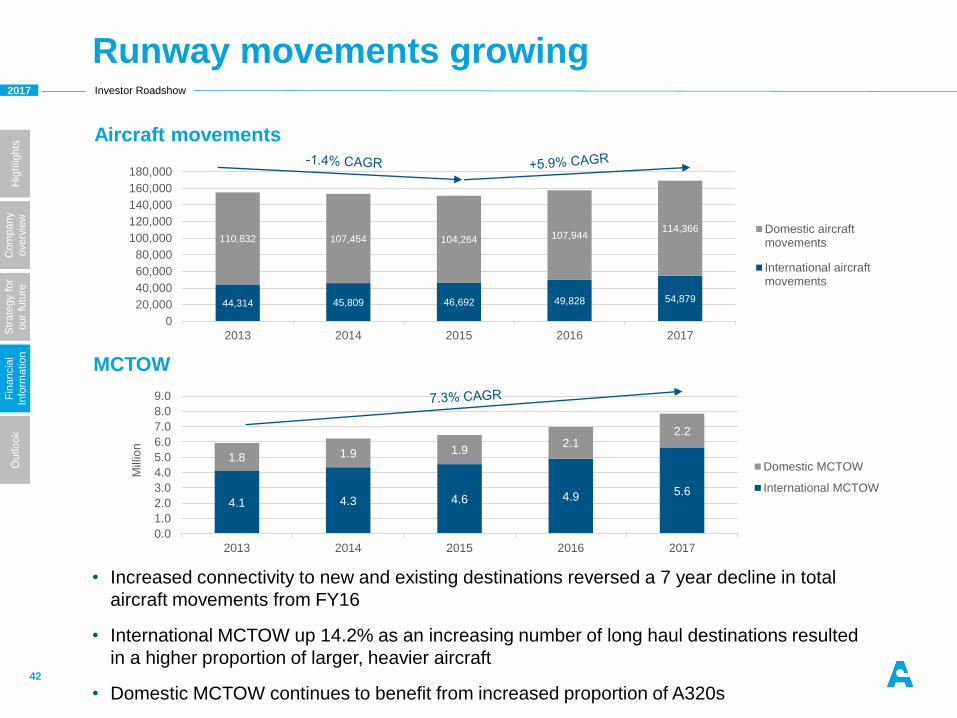
54,87949,82846,69245,80944,314
114,366107,944104,264107,454110,832
20172016201520142013
0
20,000
40,000
60,000
80,000
100,000
120,000
140,000
160,000
180,000
Domestic aircraftmovements
International aircraftmovements
Runway movements growing
42
Aircraft movements
MCTOW
• Increased connectivity to new and existing destinations reversed a 7 year decline in total
aircraft movements from FY16
• International MCTOW up 14.2% as an increasing number of long haul destinations resulted
in a higher proportion of larger, heavier aircraft
• Domestic MCTOW continues to benefit from increased proportion of A320s
2017 Investor Roadshow
Hig
hlig
hts
Com
pany
overv
iew
Str
ate
gy f
or
our
futu
re
Fin
ancia
l
Info
rmatio
nO
utlo
ok
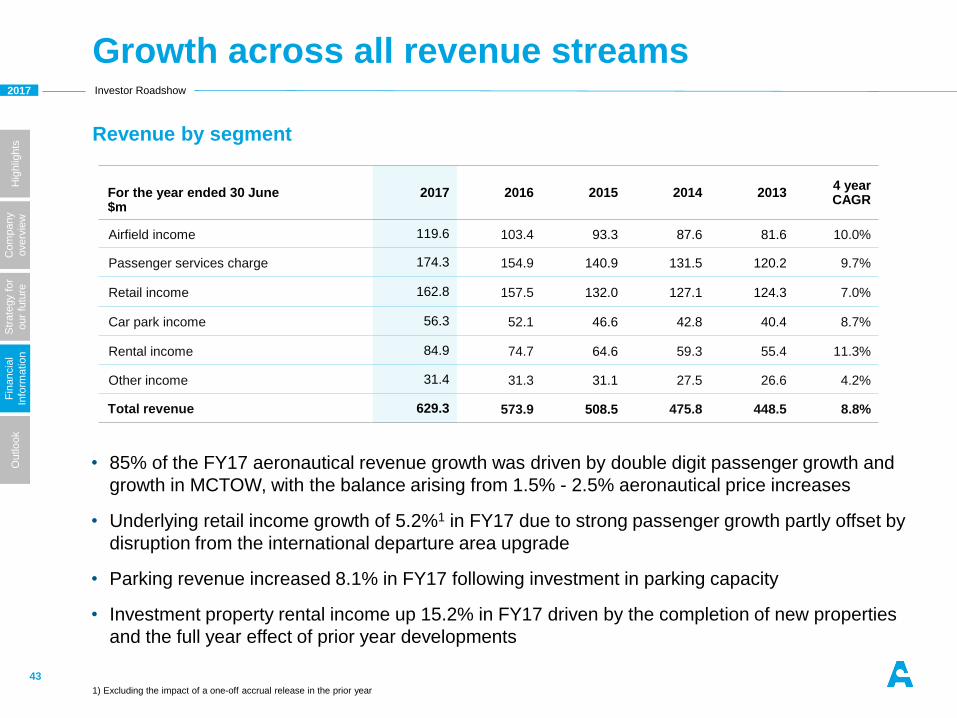
Growth across all revenue streams
43
For the year ended 30 June$m
2017 2016 2015 2014 20134 yearCAGR
Airfield income 119.6 103.4 93.3 87.6 81.6 10.0%
Passenger services charge 174.3 154.9 140.9 131.5 120.2 9.7%
Retail income 162.8 157.5 132.0 127.1 124.3 7.0%
Car park income 56.3 52.1 46.6 42.8 40.4 8.7%
Rental income 84.9 74.7 64.6 59.3 55.4 11.3%
Other income 31.4 31.3 31.1 27.5 26.6 4.2%
Total revenue 629.3 573.9 508.5 475.8 448.5 8.8%
Revenue by segment
• 85% of the FY17 aeronautical revenue growth was driven by double digit passenger growth and
growth in MCTOW, with the balance arising from 1.5% - 2.5% aeronautical price increases
• Underlying retail income growth of 5.2%1 in FY17 due to strong passenger growth partly offset by
disruption from the international departure area upgrade
• Parking revenue increased 8.1% in FY17 following investment in parking capacity
• Investment property rental income up 15.2% in FY17 driven by the completion of new properties
and the full year effect of prior year developments
1) Excluding the impact of a one-off accrual release in the prior year
2017 Investor Roadshow
Hig
hlig
hts
Com
pany
overv
iew
Str
ate
gy f
or
our
futu
re
Fin
ancia
l
Info
rmatio
nO
utlo
ok
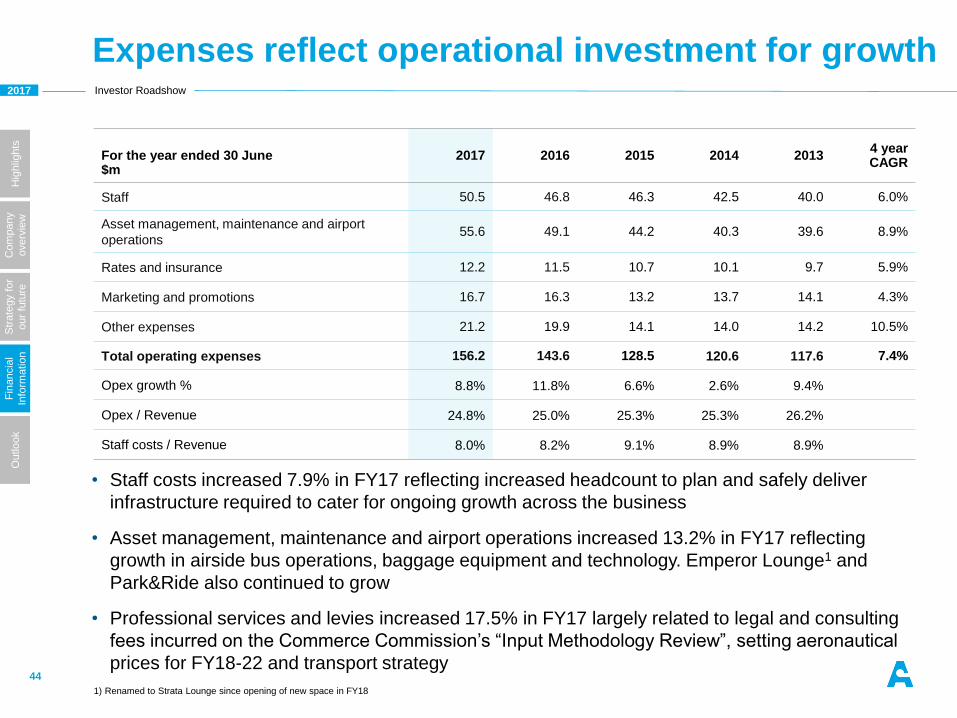
Expenses reflect operational investment for growth
44
For the year ended 30 June$m
2017 2016 2015 2014 20134 yearCAGR
Staff 50.5 46.8 46.3 42.5 40.0 6.0%
Asset management, maintenance and airport
operations55.6 49.1 44.2 40.3 39.6 8.9%
Rates and insurance 12.2 11.5 10.7 10.1 9.7 5.9%
Marketing and promotions 16.7 16.3 13.2 13.7 14.1 4.3%
Other expenses 21.2 19.9 14.1 14.0 14.2 10.5%
Total operating expenses 156.2 143.6 128.5 120.6 117.6 7.4%
Opex growth % 8.8% 11.8% 6.6% 2.6% 9.4%
Opex / Revenue 24.8% 25.0% 25.3% 25.3% 26.2%
Staff costs / Revenue 8.0% 8.2% 9.1% 8.9% 8.9%
• Staff costs increased 7.9% in FY17 reflecting increased headcount to plan and safely deliver
infrastructure required to cater for ongoing growth across the business
• Asset management, maintenance and airport operations increased 13.2% in FY17 reflecting
growth in airside bus operations, baggage equipment and technology. Emperor Lounge1 and
Park&Ride also continued to grow
• Professional services and levies increased 17.5% in FY17 largely related to legal and consulting
fees incurred on the Commerce Commission’s “Input Methodology Review”, setting aeronautical
prices for FY18-22 and transport strategy
1) Renamed to Strata Lounge since opening of new space in FY18
2017 Investor Roadshow
Hig
hlig
hts
Com
pany
overv
iew
Str
ate
gy f
or
our
futu
re
Fin
ancia
l
Info
rmatio
nO
utlo
ok
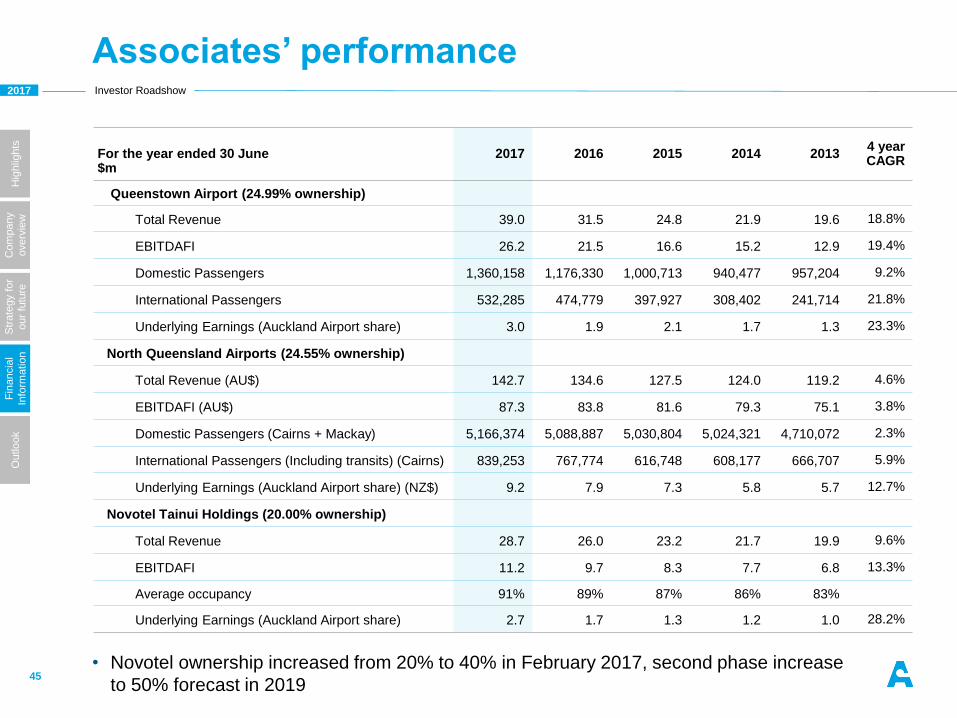
Associates’ performance
45
For the year ended 30 June$m
2017 2016 2015 2014 20134 yearCAGR
Queenstown Airport (24.99% ownership)
Total Revenue 39.0 31.5 24.8 21.9 19.6 18.8%
EBITDAFI 26.2 21.5 16.6 15.2 12.9 19.4%
Domestic Passengers 1,360,158 1,176,330 1,000,713 940,477 957,204 9.2%
International Passengers 532,285 474,779 397,927 308,402 241,714 21.8%
Underlying Earnings (Auckland Airport share) 3.0 1.9 2.1 1.7 1.3 23.3%
North Queensland Airports (24.55% ownership)
Total Revenue (AU$) 142.7 134.6 127.5 124.0 119.2 4.6%
EBITDAFI (AU$) 87.3 83.8 81.6 79.3 75.1 3.8%
Domestic Passengers (Cairns + Mackay) 5,166,374 5,088,887 5,030,804 5,024,321 4,710,072 2.3%
International Passengers (Including transits) (Cairns) 839,253 767,774 616,748 608,177 666,707 5.9%
Underlying Earnings (Auckland Airport share) (NZ$) 9.2 7.9 7.3 5.8 5.7 12.7%
Novotel Tainui Holdings (20.00% ownership)
Total Revenue 28.7 26.0 23.2 21.7 19.9 9.6%
EBITDAFI 11.2 9.7 8.3 7.7 6.8 13.3%
Average occupancy 91% 89% 87% 86% 83%
Underlying Earnings (Auckland Airport share) 2.7 1.7 1.3 1.2 1.0 28.2%
• Novotel ownership increased from 20% to 40% in February 2017, second phase increase
to 50% forecast in 2019
2017 Investor Roadshow
Hig
hlig
hts
Com
pany
overv
iew
Str
ate
gy f
or
our
futu
re
Fin
ancia
l
Info
rmatio
nO
utlo
ok
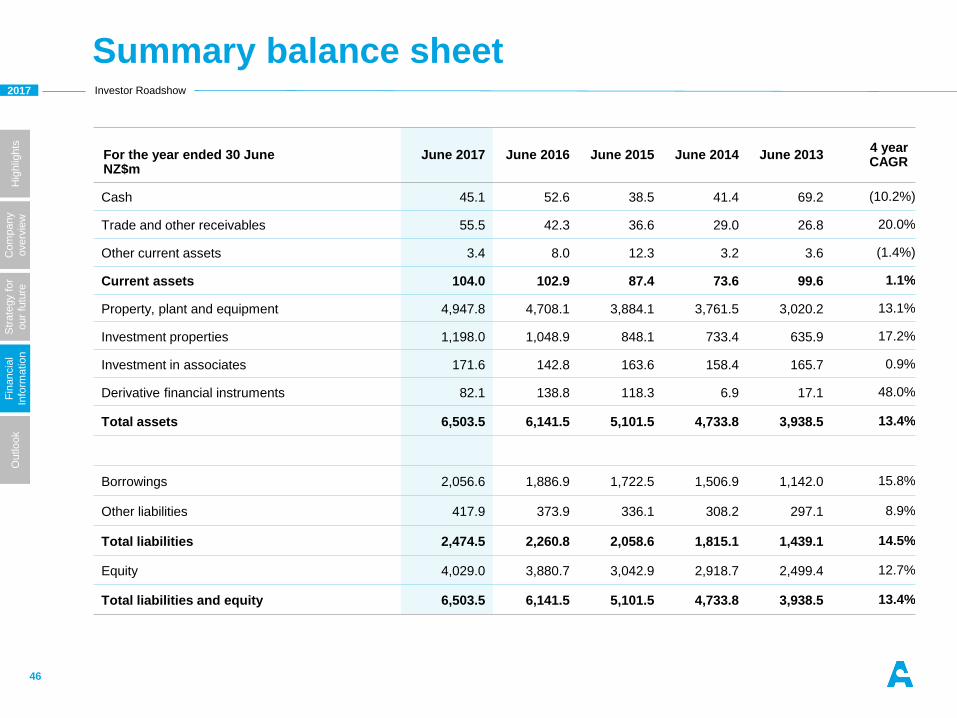
Summary balance sheet
46
For the year ended 30 JuneNZ$m
June 2017 June 2016 June 2015 June 2014 June 20134 yearCAGR
Cash 45.1 52.6 38.5 41.4 69.2 (10.2%)
Trade and other receivables 55.5 42.3 36.6 29.0 26.8 20.0%
Other current assets 3.4 8.0 12.3 3.2 3.6 (1.4%)
Current assets 104.0 102.9 87.4 73.6 99.6 1.1%
Property, plant and equipment 4,947.8 4,708.1 3,884.1 3,761.5 3,020.2 13.1%
Investment properties 1,198.0 1,048.9 848.1 733.4 635.9 17.2%
Investment in associates 171.6 142.8 163.6 158.4 165.7 0.9%
Derivative financial instruments 82.1 138.8 118.3 6.9 17.1 48.0%
Total assets 6,503.5 6,141.5 5,101.5 4,733.8 3,938.5 13.4%
Borrowings 2,056.6 1,886.9 1,722.5 1,506.9 1,142.0 15.8%
Other liabilities 417.9 373.9 336.1 308.2 297.1 8.9%
Total liabilities 2,474.5 2,260.8 2,058.6 1,815.1 1,439.1 14.5%
Equity 4,029.0 3,880.7 3,042.9 2,918.7 2,499.4 12.7%
Total liabilities and equity 6,503.5 6,141.5 5,101.5 4,733.8 3,938.5 13.4%
2017 Investor Roadshow
Hig
hlig
hts
Com
pany
overv
iew
Str
ate
gy f
or
our
futu
re
Fin
ancia
l
Info
rmatio
nO
utlo
ok
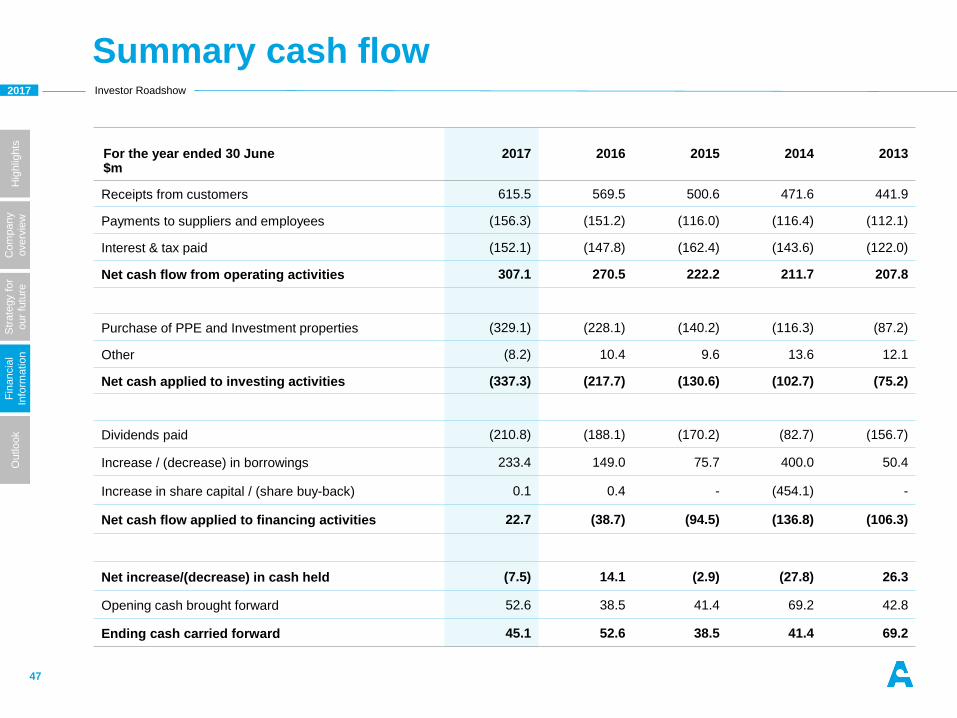
Summary cash flow
47
For the year ended 30 June$m
2017 2016 2015 2014 2013
Receipts from customers 615.5 569.5 500.6 471.6 441.9
Payments to suppliers and employees (156.3) (151.2) (116.0) (116.4) (112.1)
Interest & tax paid (152.1) (147.8) (162.4) (143.6) (122.0)
Net cash flow from operating activities 307.1 270.5 222.2 211.7 207.8
Purchase of PPE and Investment properties (329.1) (228.1) (140.2) (116.3) (87.2)
Other (8.2) 10.4 9.6 13.6 12.1
Net cash applied to investing activities (337.3) (217.7) (130.6) (102.7) (75.2)
Dividends paid (210.8) (188.1) (170.2) (82.7) (156.7)
Increase / (decrease) in borrowings 233.4 149.0 75.7 400.0 50.4
Increase in share capital / (share buy-back) 0.1 0.4 - (454.1) -
Net cash flow applied to financing activities 22.7 (38.7) (94.5) (136.8) (106.3)
Net increase/(decrease) in cash held (7.5) 14.1 (2.9) (27.8) 26.3
Opening cash brought forward 52.6 38.5 41.4 69.2 42.8
Ending cash carried forward 45.1 52.6 38.5 41.4 69.2
2017 Investor Roadshow
Hig
hlig
hts
Com
pany
overv
iew
Str
ate
gy f
or
our
futu
re
Fin
ancia
l
Info
rmatio
nO
utlo
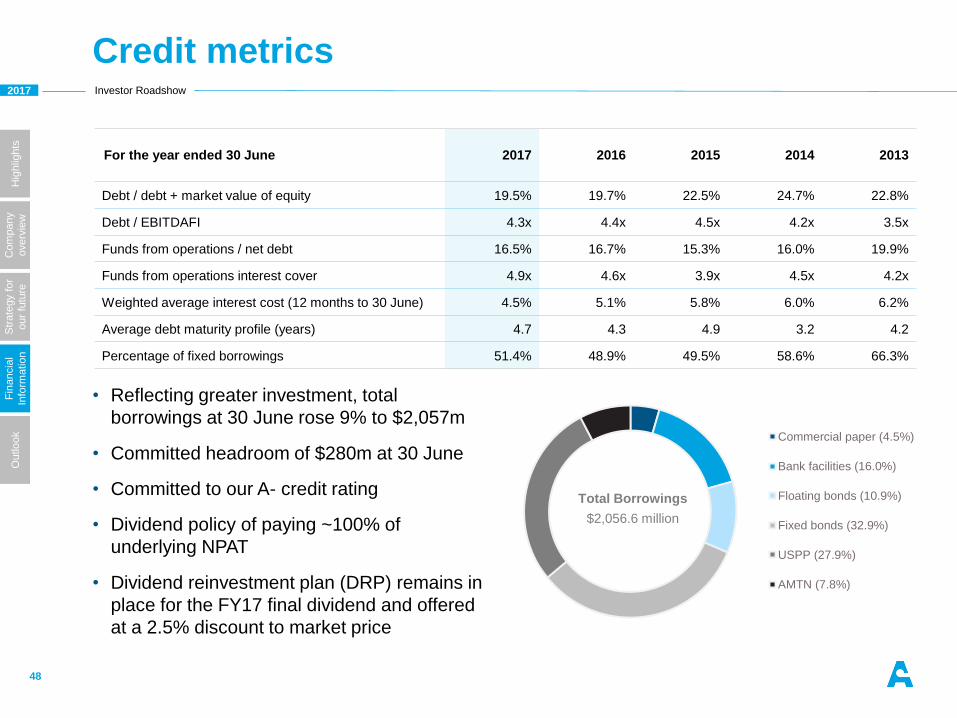
ok Commercial paper (4.5%)
Bank facilities (16.0%)
Floating bonds (10.9%)
Fixed bonds (32.9%)
USPP (27.9%)
AMTN (7.8%)
Credit metrics
48
• Reflecting greater investment, total
borrowings at 30 June rose 9% to $2,057m
• Committed headroom of $280m at 30 June
• Committed to our A- credit rating
• Dividend policy of paying ~100% of
underlying NPAT
• Dividend reinvestment plan (DRP) remains in
place for the FY17 final dividend and offered
at a 2.5% discount to market price
For the year ended 30 June 2017 2016 2015 2014 2013
Debt / debt + market value of equity 19.5% 19.7% 22.5% 24.7% 22.8%
Debt / EBITDAFI 4.3x 4.4x 4.5x 4.2x 3.5x
Funds from operations / net debt 16.5% 16.7% 15.3% 16.0% 19.9%
Funds from operations interest cover 4.9x 4.6x 3.9x 4.5x 4.2x
Weighted average interest cost (12 months to 30 June) 4.5% 5.1% 5.8% 6.0% 6.2%
Average debt maturity profile (years) 4.7 4.3 4.9 3.2 4.2
Percentage of fixed borrowings 51.4% 48.9% 49.5% 58.6% 66.3%
Total Borrowings
$2,056.6 million
2017 Investor Roadshow
Hig
hlig
hts
Com
pany
overv
iew
Str
ate
gy f
or
our
futu
re
Fin
ancia
l
Info
rmatio
nO
utlo
ok
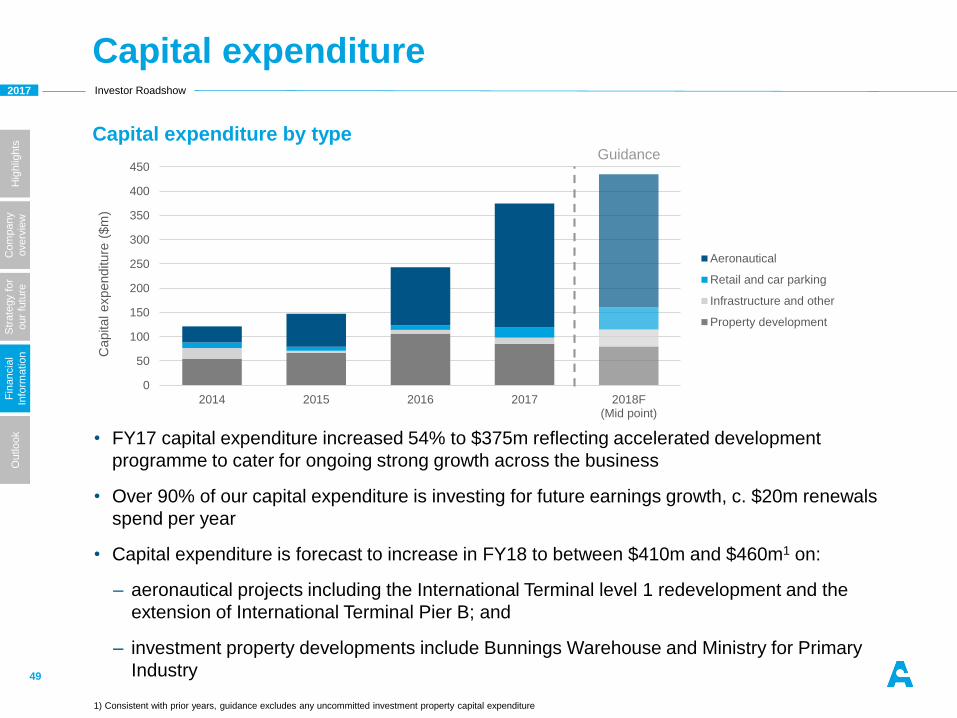
Capital expenditure
49
• FY17 capital expenditure increased 54% to $375m reflecting accelerated development
programme to cater for ongoing strong growth across the business
• Over 90% of our capital expenditure is investing for future earnings growth, c. $20m renewals
spend per year
• Capital expenditure is forecast to increase in FY18 to between $410m and $460m1 on:
– aeronautical projects including the International Terminal level 1 redevelopment and the
extension of International Terminal Pier B; and
– investment property developments include Bunnings Warehouse and Ministry for Primary
Industry
Capital expenditure by type
0
50
100
150
200
250
300
350
400
450
2018F(Mid point)
2017201620152014
Capital expenditure
($m
)
Aeronautical
Retail and car parking
Infrastructure and other
Property development
Guidance
1) Consistent with prior years, guidance excludes any uncommitted investment property capital expenditure
Outlook
2017 Investor Roadshow
Hig
hlig
hts
Com
pany
overv
iew
Str
ate
gy f
or
our
futu
re
Fin
ancia
l
Info
rmatio
nO
utlo
ok
Outlook
51
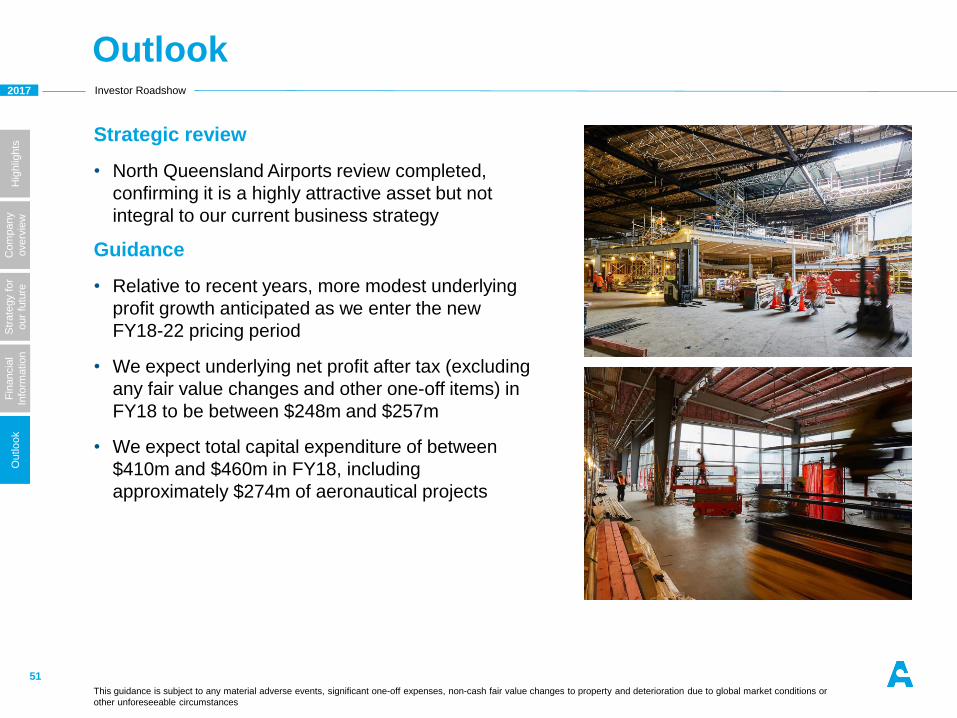
Strategic review
• North Queensland Airports review completed,
confirming it is a highly attractive asset but not
integral to our current business strategy
Guidance
• Relative to recent years, more modest underlying
profit growth anticipated as we enter the new
FY18-22 pricing period
• We expect underlying net profit after tax (excluding
any fair value changes and other one-off items) in
FY18 to be between $248m and $257m
• We expect total capital expenditure of between
$410m and $460m in FY18, including
approximately $274m of aeronautical projects
This guidance is subject to any material adverse events, significant one-off expenses, non-cash fair value changes to property and deterioration due to global market conditions or
other unforeseeable circumstances
2017 Investor Roadshow
Hig
hlig
hts
Com
pany
overv
iew
Str
ate
gy f
or
our
futu
re
Fin
ancia
l
Info
rmatio
nO
utlo
ok
Reference material and further details
52
Reference material
Auckland Airport website: https://corporate.aucklandairport.co.nz/
Regulation overview: https://corporate.aucklandairport.co.nz/investors/regulation
Commerce Commission: http://www.comcom.govt.nz/regulated-industries/airports/
Investor inquiries
Suzannah Steele, Investor Relations and Reporting
DDI: +64 9 257 7043, Mobile: +64 27 203 2822
Questions

2017 Investor Roadshow
Important notice and glossary
Disclaimer
This presentation is given on behalf of Auckland International Airport Limited. Information in this presentation:
• is provided for general information purposes only, and is not an offer or invitation for subscription, purchase, or recommendation of securities in Auckland International Airport Limited (Auckland Airport);
• should be read in conjunction with, and is subject to, Auckland Airport's audited consolidated annual financial report for the twelve months ended 30 June 2017, prior annual and interim reports and Auckland Airport's market releases on the NZX and ASX;
• includes forward-looking statements about Auckland Airport and the environment in which Auckland Airport operates, which are subject to uncertainties and contingencies outside of Auckland Airport's control. Auckland Airport's actual results or performance may differ materially from these statements;
• includes statements relating to past performance, which should not be regarded as a reliable indicator of future performance; and
• may contain information from third parties believed to be reliable; however, no representations or warranties are made as to the accuracy or completeness of such information.
All information in this presentation is current at the date of this presentation, unless otherwise stated. Auckland Airport is not under any obligation to update this presentation at any time after its release, whether as a result of new information, future events or otherwise.
All currency amounts are in New Zealand dollars unless otherwise stated.
GlossaryARPS Average revenue per parking space
EBITDAFI Earnings before interest, taxation, depreciation, fair value adjustments and investments in associates
MCTOW Maximum certified take off weight
NPAT Net profit after tax
PAX Passenger
PSE2 FY13-FY17
PSE3 FY18-FY22
54
2017 Investor Roadshow
Hig
hlig
hts
Com
pany
overv
iew
Str
ate
gy f
or
our
futu
re
Fin
ancia
l
Info
rmatio
nO
utlo
ok
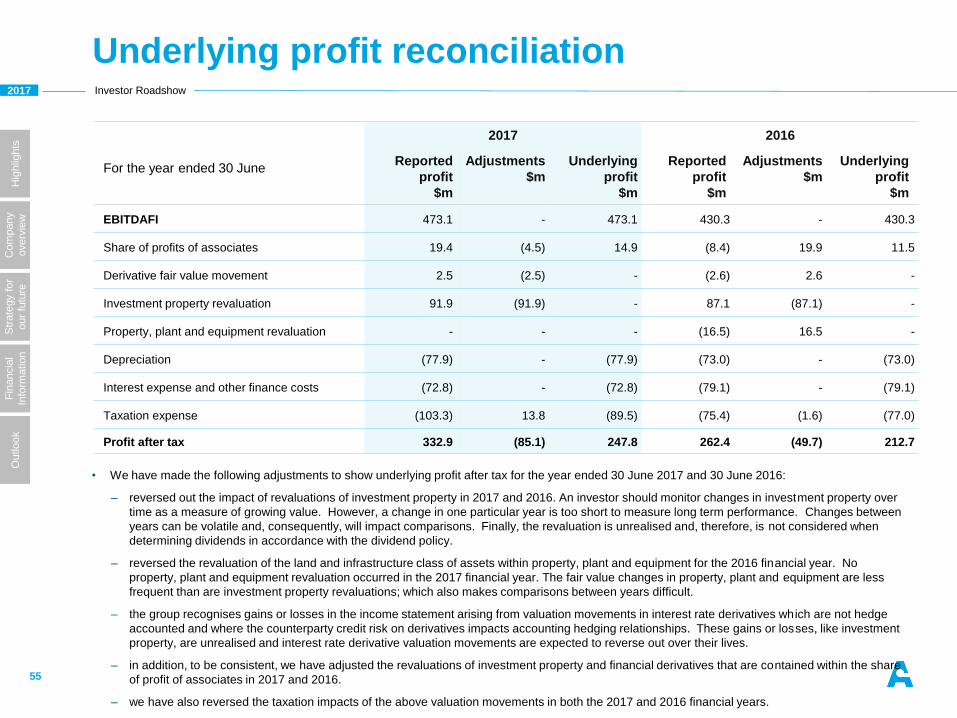
Underlying profit reconciliation
55
• We have made the following adjustments to show underlying profit after tax for the year ended 30 June 2017 and 30 June 2016:
– reversed out the impact of revaluations of investment property in 2017 and 2016. An investor should monitor changes in investment property over
time as a measure of growing value. However, a change in one particular year is too short to measure long term performance. Changes between
years can be volatile and, consequently, will impact comparisons. Finally, the revaluation is unrealised and, therefore, is not considered when
determining dividends in accordance with the dividend policy.
– reversed the revaluation of the land and infrastructure class of assets within property, plant and equipment for the 2016 financial year. No
property, plant and equipment revaluation occurred in the 2017 financial year. The fair value changes in property, plant and equipment are less
frequent than are investment property revaluations; which also makes comparisons between years difficult.
– the group recognises gains or losses in the income statement arising from valuation movements in interest rate derivatives which are not hedge
accounted and where the counterparty credit risk on derivatives impacts accounting hedging relationships. These gains or losses, like investment
property, are unrealised and interest rate derivative valuation movements are expected to reverse out over their lives.
– in addition, to be consistent, we have adjusted the revaluations of investment property and financial derivatives that are contained within the share
of profit of associates in 2017 and 2016.
– we have also reversed the taxation impacts of the above valuation movements in both the 2017 and 2016 financial years.
2017 2016
For the year ended 30 JuneReported
profit
$m
Adjustments
$m
Underlying
profit
$m
Reported
profit
$m
Adjustments
$m
Underlying
profit
$m
EBITDAFI 473.1 - 473.1 430.3 - 430.3
Share of profits of associates 19.4 (4.5) 14.9 (8.4) 19.9 11.5
Derivative fair value movement 2.5 (2.5) - (2.6) 2.6 -
Investment property revaluation 91.9 (91.9) - 87.1 (87.1) -
Property, plant and equipment revaluation - - - (16.5) 16.5 -
Depreciation (77.9) - (77.9) (73.0) - (73.0)
Interest expense and other finance costs (72.8) - (72.8) (79.1) - (79.1)
Taxation expense (103.3) 13.8 (89.5) (75.4) (1.6) (77.0)
Profit after tax 332.9 (85.1) 247.8 262.4 (49.7) 212.7