2017 INTERNATIONAL ELASTOMER CONFERENCE...
12
Evaluation of Treated Aluminosilicate Microspheres in EPDM and Silicone Elastomers Processing and Performance Effects Using Solid Microsphere Process Aids Erick Sharp ACE Products and Consulng, LLC Uniontown, OH Miles Dearth Spherix Mineral Products Lexington, SC 2017 INTERNATIONAL ELASTOMER CONFERENCE
-
Upload
trinhkhanh -
Category
Documents
-
view
220 -
download
0
Transcript of 2017 INTERNATIONAL ELASTOMER CONFERENCE...
Evaluation of Treated Aluminosilicate Microspheres in EPDM and Silicone ElastomersProcessing and Performance Effects Using Solid Microsphere Process Aids
Erick Sharp ACE Products and Consulting, LLC Uniontown, OH
Miles DearthSpherix Mineral ProductsLexington, SC
2017 INTERNATIONAL ELASTOMER CONFERENCE

DESIGN OF EXPERIMENT Processing & performance effects using solid microsphere process aids.
Elastomers Chosen …
The factors selected for this experiment are the types of treatment on spheres, part level of spheres
and elastomer type.
Factors Selected for EPDM …
Control without Spheres vs. Surface –Treated Aluminosilicate Spheres (D50=3 micron) vs. Non-Treated
Silica Nanospheres (150nm, compacted)
Factors Selected for Silicone …
With and without surface treated aluminosilicate spheres
Dependent variables that were measured:
� Rheology � Dispersion � Physical Properties � Mixing Cycle Time
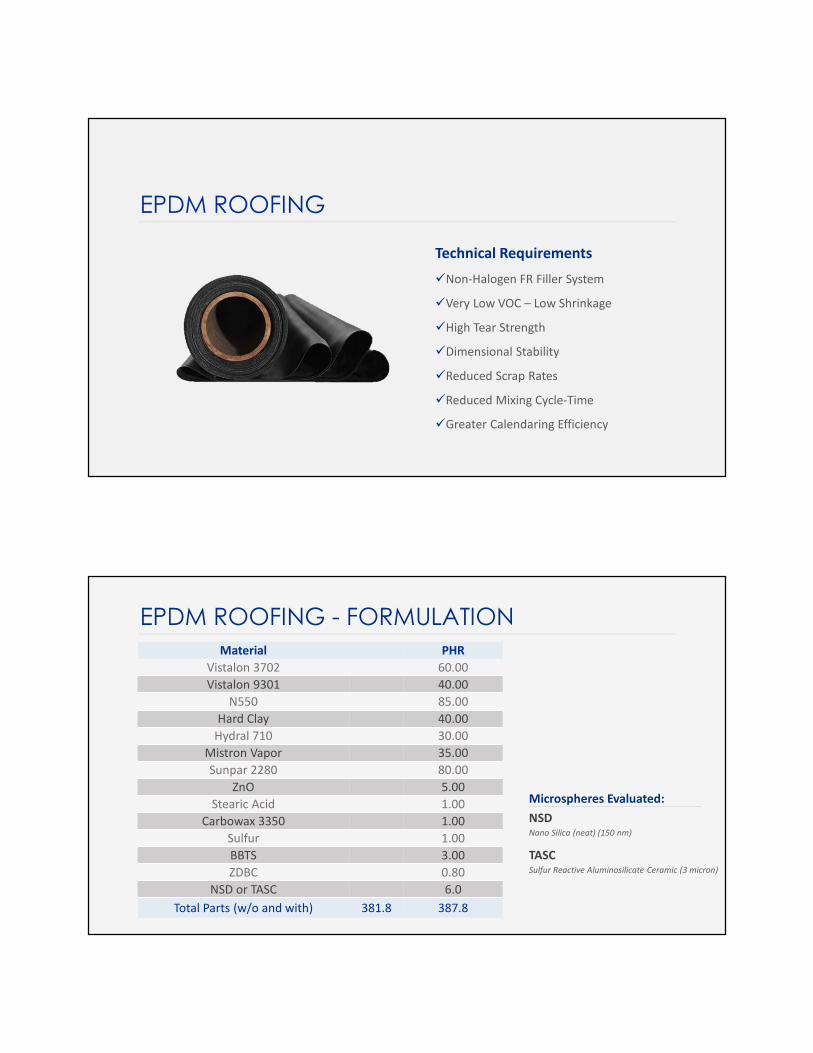
Technical Requirements
�Non-Halogen FR Filler System
�Very Low VOC – Low Shrinkage
�High Tear Strength
�Dimensional Stability
�Reduced Scrap Rates
�Reduced Mixing Cycle-Time
�Greater Calendaring Efficiency
EPDM ROOFING
Material PHR
Vistalon 3702 60.00
Vistalon 9301 40.00
N550 85.00
Hard Clay 40.00
Hydral 710 30.00
Mistron Vapor 35.00
Sunpar 2280 80.00
ZnO 5.00
Stearic Acid 1.00
Carbowax 3350 1.00
Sulfur 1.00
BBTS 3.00
ZDBC 0.80
NSD or TASC 6.0
Total Parts (w/o and with) 381.8 387.8
EPDM ROOFING - FORMULATION
NSDNano Silica (neat) (150 nm)
TASCSulfur Reactive Aluminosilicate Ceramic (3 micron)
Microspheres Evaluated:

EPDM ROOFING – MIXING PROCEDURE
Upside Down Mixing Mixer Duration
Fillers and Spheres
(if present)
Ram Down
(Floating)0 - 40 Seconds
Small Powders Ram Down 40 - 100 Seconds
Oil Sweep 100 Seconds
EPDM Drop180, 160, or 140
Seconds
EPDM ROOFING - PROCESSING
Control (without spheres) NSD 6.0 phr TASC 6.0 phr
Mix at 180 Seconds Mix at 160 Seconds Mix at 160 Seconds
Mix at 140 Seconds Mix at 140 Seconds Mix at 140 Seconds
Absent Spheres NSD 6.0 phr TASC 6.0 phr
Observations Testing
Probe Temperature Durometer ASTM D2240-05
Mixing Yield (%) Tensile Strength ASTM D624-06a
Total Power (kWh/sec.) Oscillating Disc Rheometer ASTM D2084-11
Appearance Mooney Viscosity ASTM D1646-07 (2012)

EPDM ROOFING - PROCESSING
Control (A) Control (B) NSD (A) NSD (B) TASC (A) TASC (B)
Mix Time – Seconds 180 140 160 140 160 140
Yield Percentage 99.0% 96.7% 98.8% 99.1% 99.2% 99.9%
Probe Temperature °F 209 190 202 209 215 195
95.00% 96.00% 97.00% 98.00% 99.00% 100.00% 101.00%
TASC (A)
98.8%NSD (A)
96.7%Control (B)
99.0%Control (A)
99.9%TASC (B)
96.7%
99.9%NSD (B)
EPDM ROOFING – MDR RHEOLOGY 350°F/12’/42% STRAIN
Control (A) Control (B) NSD (A) NSD (B) TASC (A) TASC (B)
Tc90 5.68 6.13 5.52 6.81 6.56 6.15
ML 2.69 2.66 2.66 2.59 2.50 2.52
MH 25.19 24.56 23.62 23.40 25.59 25.24
ML (1+4) 212°F 54.46 52.93 54.71 53.55 52.08 52.48

EPDM ROOFING – PHYSICAL PROPERTIES
Control (A) Control (B) NSD (A) NSD (B) TASC (A) TASC (B)
Durometer 67 65 67 67 67 67
Tensile (psi) 1472 1460 1356 1393 1556 1493
Elongation (%) 617 626 624 613 640 611
300% Modulus 687 664 650 646 718 724
Tear Die C (lb/in) 193 188 190 183 203 202
EPDM - TENSILE STRENGTH
-7.88% NSD (A)
-4.59% NSD (B)
TASC (A) 5.71%
TASC (B) 2.26%
-10.00% -8.00% -6.00% -4.00% -2.00% 0.00% 2.00% 4.00% 6.00% 8.00%
Percent Difference From Control A
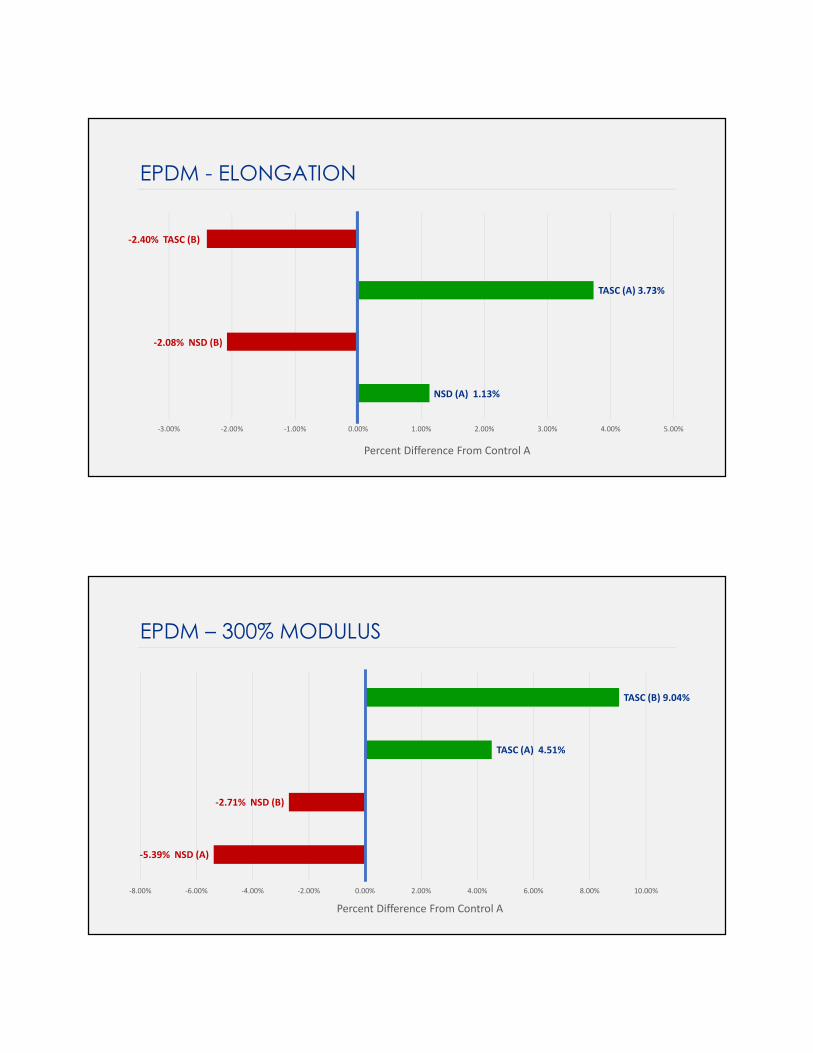
NSD (A) 1.13%
-2.08% NSD (B)
TASC (A) 3.73%
-3.00% -2.00% -1.00% 0.00% 1.00% 2.00% 3.00% 4.00% 5.00%
Percent Difference From Control A
EPDM - ELONGATION
-2.40% TASC (B)
-5.39% NSD (A)
-2.71% NSD (B)
TASC (A) 4.51%
-8.00% -6.00% -4.00% -2.00% 0.00% 2.00% 4.00% 6.00% 8.00% 10.00%
Percent Difference From Control A
EPDM – 300% MODULUS
TASC (B) 9.04%

-1.55% NSD (A)
-2.66% NSD (B)
TASC (A) 5.18%
-4.00% -2.00% 0.00% 2.00% 4.00% 6.00% 8.00%
Percent Difference From Control A
EPDM – TEAR DIE C
TASC (B) 7.45%
SILICONE EXTRUSION
�Better Dispersion
�Lower Standard Deviation
�Dimensional Stability
�Surface Finish
�Die Flow Rate
�Tear Properties
�Cycle Times

Material PHR
70 EXT Base 100.00
10 Micron Mineral Filler 36.00
Heat Stabilizer 1.00
DBPH – 50 1.00
Black Pigment 1.00
Peroxide-reactive microspheres (D50 = 3 micron) PR-TASC 5.00
SILICONE EXTRUSION - FORMULATION
SILICONE EXTRUSION - PROCESSING
About the ExperimentThis experiment was run on a 1.2 liter tilt body lab mixer
�Silicone base and additives were mixed for 30 seconds
�Mineral filler was added and the compound mixed to 30°C
�PR-TASC was added with the silicone base and other additives

SILICONE EXTRUSION - PROCESSING
Process Step Control (Mix Time) TASC (Mix Time)
Add polymer, additives and PR-TASC 30 Seconds 30 Seconds
Add mineral filler mix to 32°c 210 Seconds 160 Seconds
Mixer Discharge
Mineral filler on mixer walls
and agglomerated particles
on the surface of the batch
Small amount of PR-TASC
above the ram. No mineral
filler powder visible
Mill Rough edges Smooth
0 50 100 150 200 250
CONTROL
TASC
Total Cycle Time
The total cycle time of the PR-TASC batch was 21% faster than the control batch.
SILICONE EXTRUSION – TOTAL CYCLE TIME
190 SEC.
240 SEC.
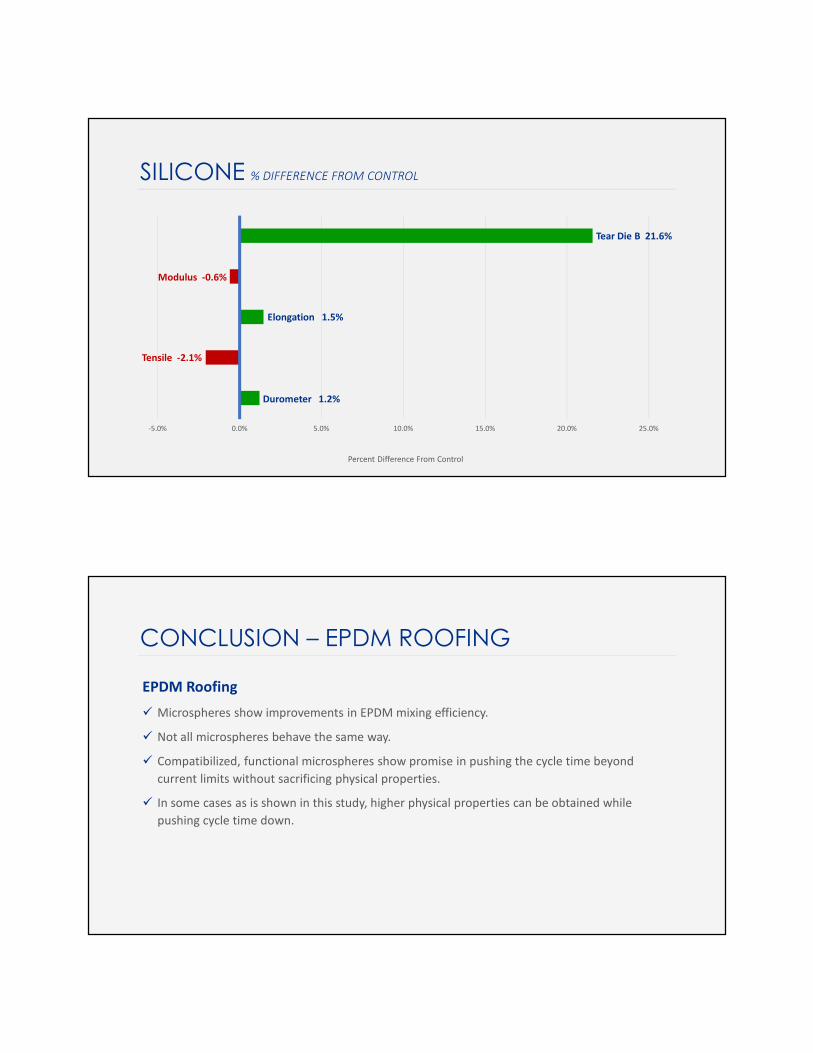
Durometer 1.2%
Tensile -2.1%
Elongation 1.5%
Modulus -0.6%
Tear Die B 21.6%
-5.0% 0.0% 5.0% 10.0% 15.0% 20.0% 25.0%
Percent Difference From Control
SILICONE % DIFFERENCE FROM CONTROL
CONCLUSION – EPDM ROOFING
EPDM Roofing
� Microspheres show improvements in EPDM mixing efficiency.
� Not all microspheres behave the same way.
� Compatibilized, functional microspheres show promise in pushing the cycle time beyond
current limits without sacrificing physical properties.
� In some cases as is shown in this study, higher physical properties can be obtained while
pushing cycle time down.

In a model Silicone extrusion compound:
� A 3.5% loading of compatibilized, peroxide-reactive microspheres yielded a 21% reduction
mixing time.
� In addition, there were no unmixed filler agglomerates both at the mixer and in milling
compared to the control which exhibited some undispersed solids.
� A 3.5% loading of reactive microspheres exhibited no statistically significant change in
Durometer, Mooney viscosity and physical properties.
� The use of microspheres yielded a 21.6% increase in Die B tear.
CONCLUSION – SILICONE EXTRUSION
Thank You