Metformin & glipizide microspheres
38
Preparation, Characterization and In - Vitro Evaluation of Metformin HCl and Glipizide Loaded Microspheres of Different polymers by Using Emulsion Solvent Evaporation Technique Submitted by: Md. Maksud Al- Hasan Registration no: 14107095 Session: Spring- 2014.
-
Upload
maksud-al-hasan-mahim -
Category
Health & Medicine
-
view
101 -
download
0
Transcript of Metformin & glipizide microspheres
Preparation, Characterization and In-Vitro
Evaluation of Metformin HCl and Glipizide
Loaded Microspheres of Different polymers by
Using Emulsion Solvent Evaporation Technique
Submitted by:
Md. Maksud Al- Hasan
Registration no: 14107095
Session: Spring- 2014.
AIM, SCOPE AND OBJECTIVES OF THE
STUDY
AIM: The present work was aim to formulate and
evaluate combination microspheres of Metformin HCl
and Glipizide by emulsion solvent evaporation technique
using EC, HPMC 15CPS, Eudragit RSPO and Eudragit
RLPO polymers. The ultimate aim to use those polymers
is to increase bioavailability and decreasing
gastrointestinal side effects.
SCOPE: Prepared Microspheres of Metformin and
Glipizide are expected to shows synergetic effect in their
action and can be utilized for controlled release of
Metformin HCl and Glipizide for an extend period in the
management of type-II diabetes.
OBJECTIVES: Reduce the dosing frequency
fluctuation in therapeutic blood level is avoid.
Increase patient compliance, decrease in dose
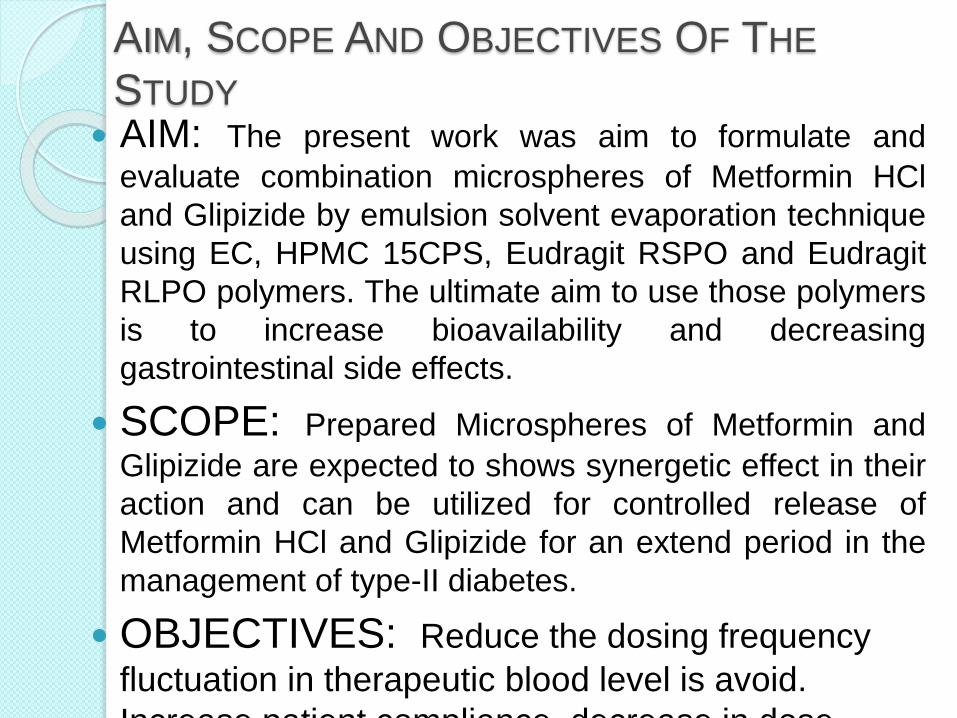
Preparation of Metformin HCl and Glipizide
Microspheres
Ethanol and DCM
Polymer, Ethanol and DCM
Polymer, Ethanol and DCM.
Polymer
Metformin HCl & Glipizide
Homogenization for 4 hrs 30 min.
450 RPM, 50ml Liquid Paraffin with
1% Tween 80.
Settle for few minutes
Washing
Drying at Room Temperature
Store
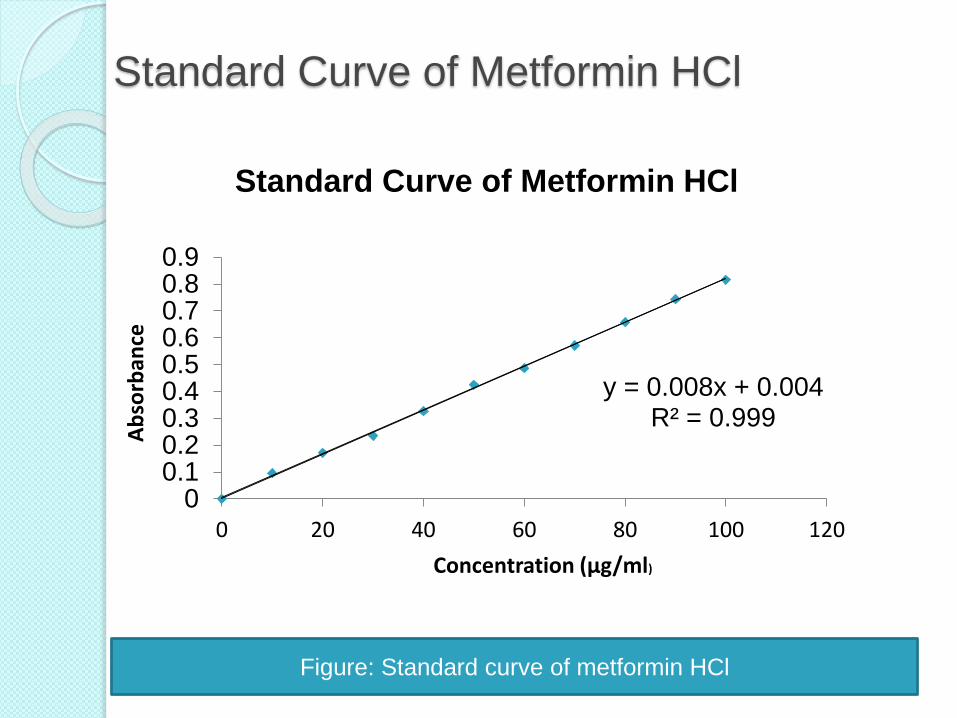
Standard Curve of Metformin HCl
y = 0.008x + 0.004R² = 0.999
00.10.20.30.40.50.60.70.80.9
0 20 40 60 80 100 120
Ab
sorb
ance
Concentration (µg/ml)
Standard Curve of Metformin HCl
Figure: Standard curve of metformin HCl
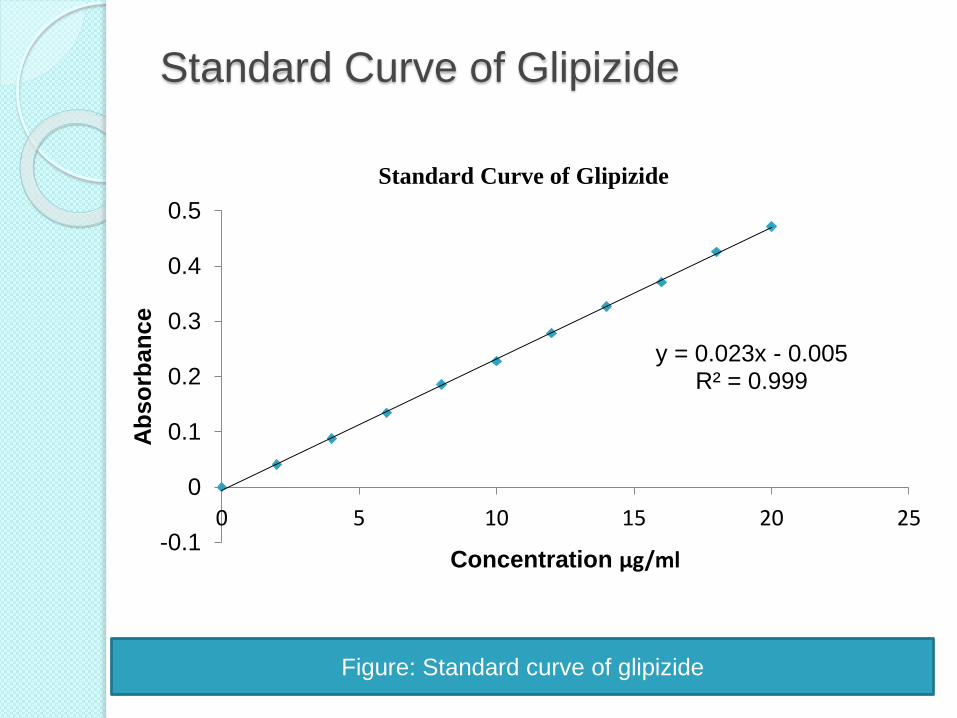
Standard Curve of Glipizide
y = 0.023x - 0.005R² = 0.999
-0.1
0
0.1
0.2
0.3
0.4
0.5
0 5 10 15 20 25
Ab
so
rban
ce
Concentration µg/ml
Standard Curve of Glipizide
Figure: Standard curve of glipizide
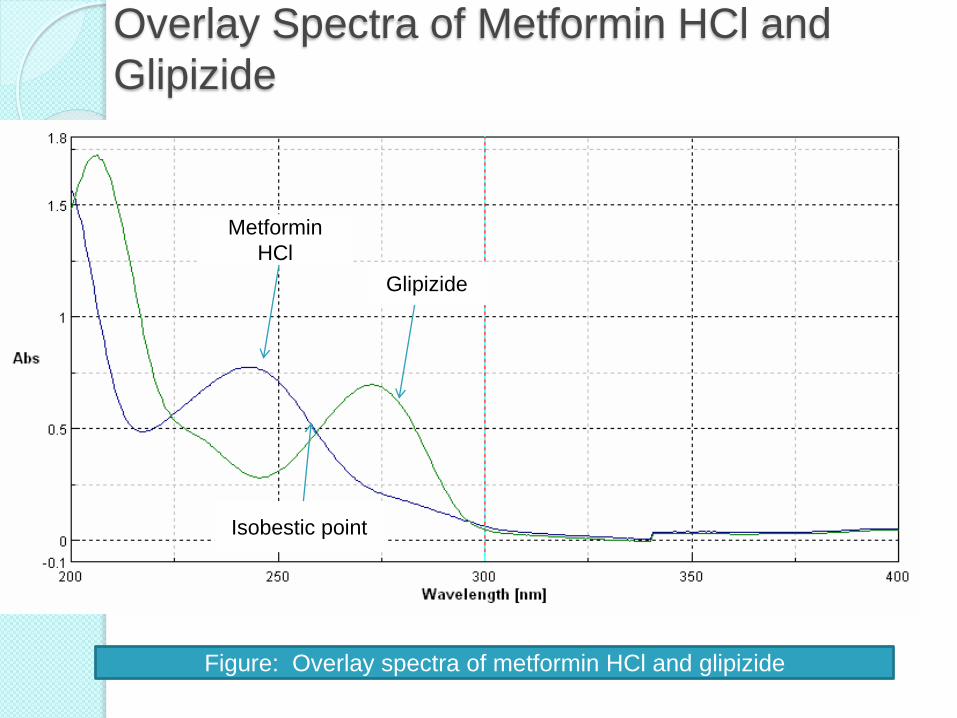
Overlay Spectra of Metformin HCl and
Glipizide
Figure: Overlay spectra of metformin HCl and glipizide
Metformin
HCl
Glipizide
Isobestic point
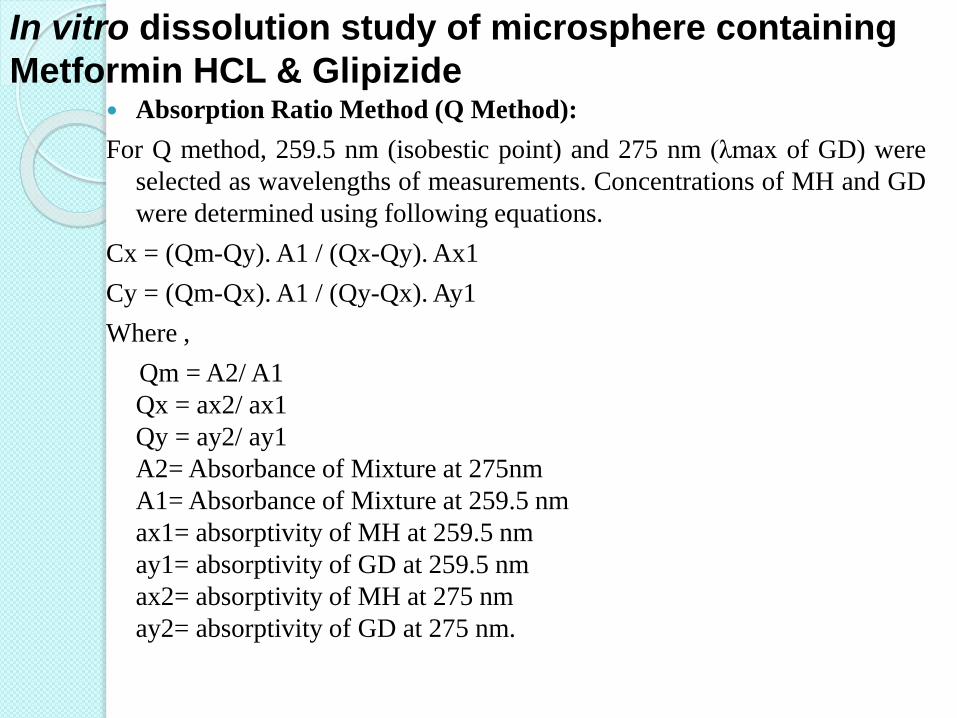
In vitro dissolution study of microsphere containing
Metformin HCL & Glipizide Absorption Ratio Method (Q Method):
For Q method, 259.5 nm (isobestic point) and 275 nm (λmax of GD) were
selected as wavelengths of measurements. Concentrations of MH and GD
were determined using following equations.
Cx = (Qm-Qy). A1 / (Qx-Qy). Ax1
Cy = (Qm-Qx). A1 / (Qy-Qx). Ay1
Where ,
Qm = A2/ A1
Qx = ax2/ ax1
Qy = ay2/ ay1
A2= Absorbance of Mixture at 275nm
A1= Absorbance of Mixture at 259.5 nm
ax1= absorptivity of MH at 259.5 nm
ay1= absorptivity of GD at 259.5 nm
ax2= absorptivity of MH at 275 nm
ay2= absorptivity of GD at 275 nm.
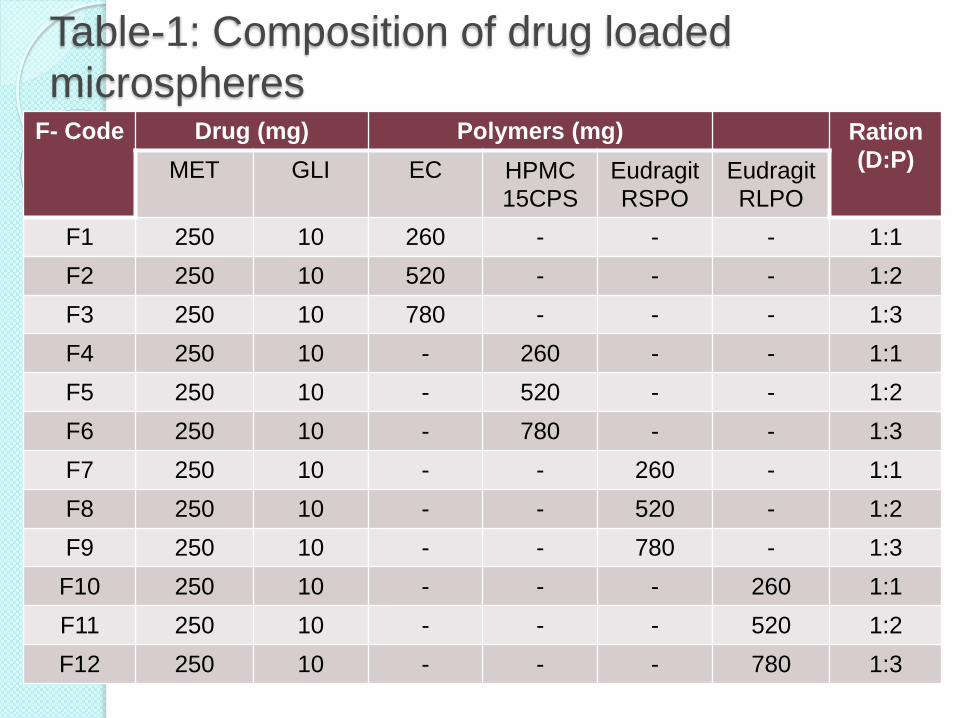
Table-1: Composition of drug loaded
microspheresF- Code Drug (mg) Polymers (mg) Ration
(D:P)MET GLI EC HPMC
15CPS
Eudragit
RSPO
Eudragit
RLPO
F1 250 10 260 - - - 1:1
F2 250 10 520 - - - 1:2
F3 250 10 780 - - - 1:3
F4 250 10 - 260 - - 1:1
F5 250 10 - 520 - - 1:2
F6 250 10 - 780 - - 1:3
F7 250 10 - - 260 - 1:1
F8 250 10 - - 520 - 1:2
F9 250 10 - - 780 - 1:3
F10 250 10 - - - 260 1:1
F11 250 10 - - - 520 1:2
F12 250 10 - - - 780 1:3
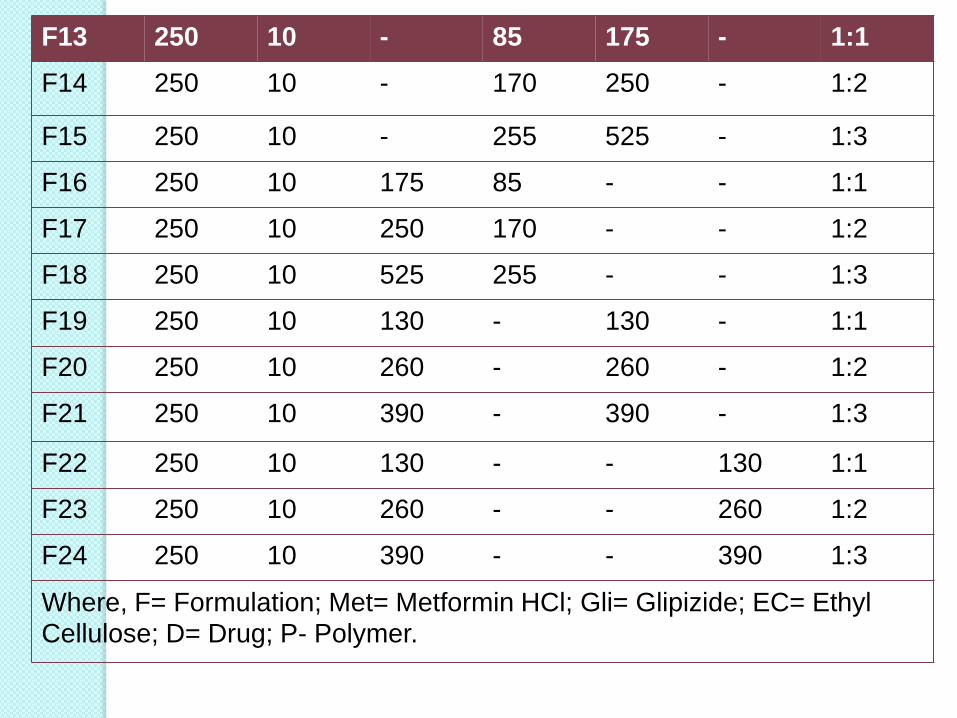
F13 250 10 - 85 175 - 1:1
F14 250 10 - 170 250 - 1:2
F15 250 10 - 255 525 - 1:3
F16 250 10 175 85 - - 1:1
F17 250 10 250 170 - - 1:2
F18 250 10 525 255 - - 1:3
F19 250 10 130 - 130 - 1:1
F20 250 10 260 - 260 - 1:2
F21 250 10 390 - 390 - 1:3
F22 250 10 130 - - 130 1:1
F23 250 10 260 - - 260 1:2
F24 250 10 390 - - 390 1:3
Where, F= Formulation; Met= Metformin HCl; Gli= Glipizide; EC= Ethyl Cellulose; D= Drug; P- Polymer.
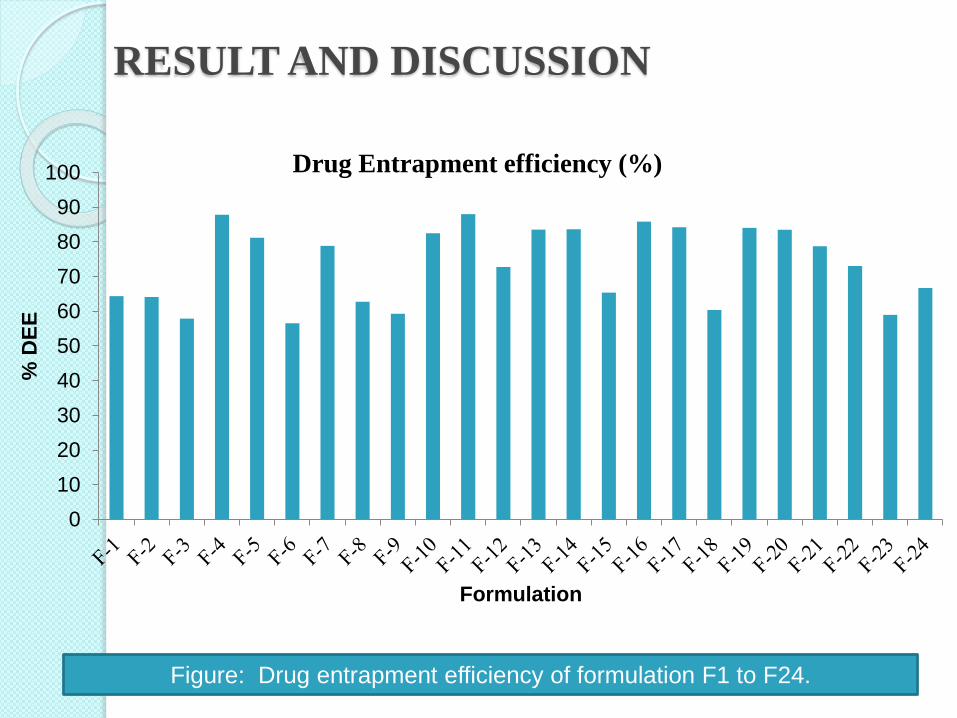
RESULT AND DISCUSSION
0
10
20
30
40
50
60
70
80
90
100
% D
EE
Formulation
Drug Entrapment efficiency (%)
Figure: Drug entrapment efficiency of formulation F1 to F24.
Discussion
It was found in the range of 56.56% to 88.02% Formulation F11 containing eudragit RLPO
showed maximum drug loading about 88.02% Formulation F6 containing HPMC 15CPS shows
minimum drug loading about 56.56% Microspheres of HPMC 15CPS are irregular
shape therefore more drug loss from surface during washing leads to less drug entrapment efficiency
Rank order of % drug loading of various formulations:F11>F4>F16>F17>F19>F14>F13>F20>F10>F5>F7>F21>F22>F12>F24>F15<F8>F1>F2>F18>F9>F23>F3>F6
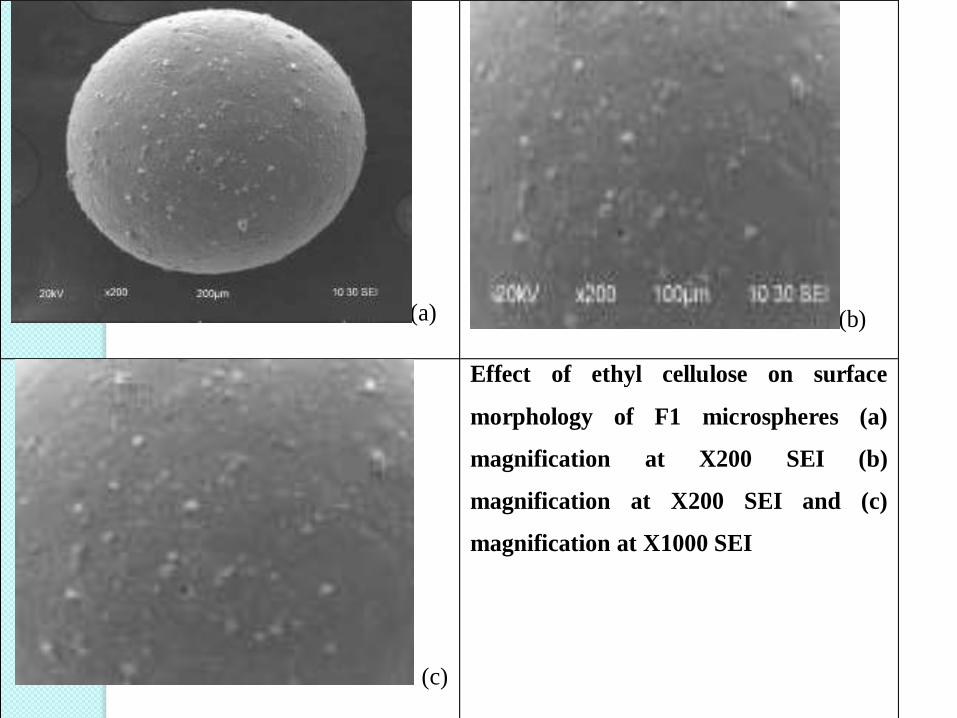
(a) (b)
(c)
Effect of ethyl cellulose on surface
morphology of F1 microspheres (a)
magnification at X200 SEI (b)
magnification at X200 SEI and (c)
magnification at X1000 SEI
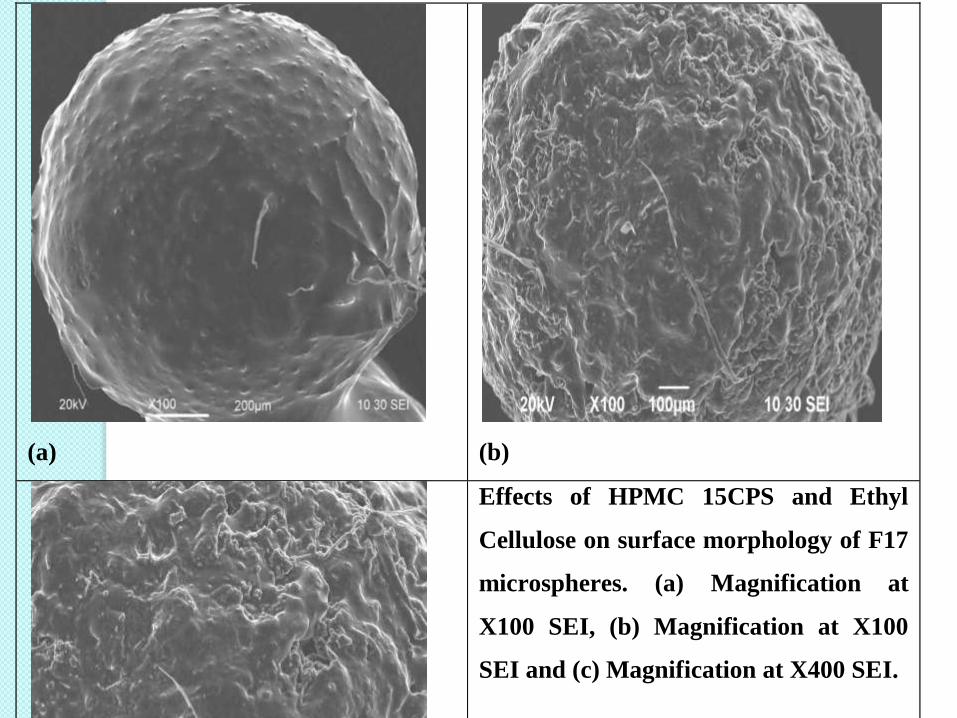
(a)
(b)
(c)
Effects of HPMC 15CPS and Ethyl
Cellulose on surface morphology of F17
microspheres. (a) Magnification at
X100 SEI, (b) Magnification at X100
SEI and (c) Magnification at X400 SEI.
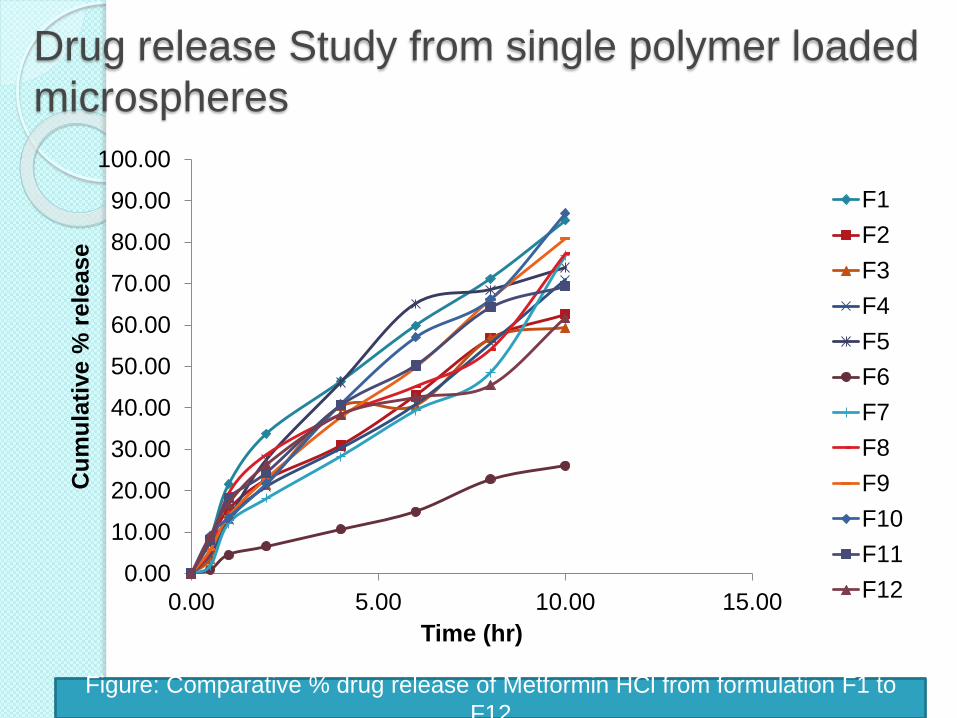
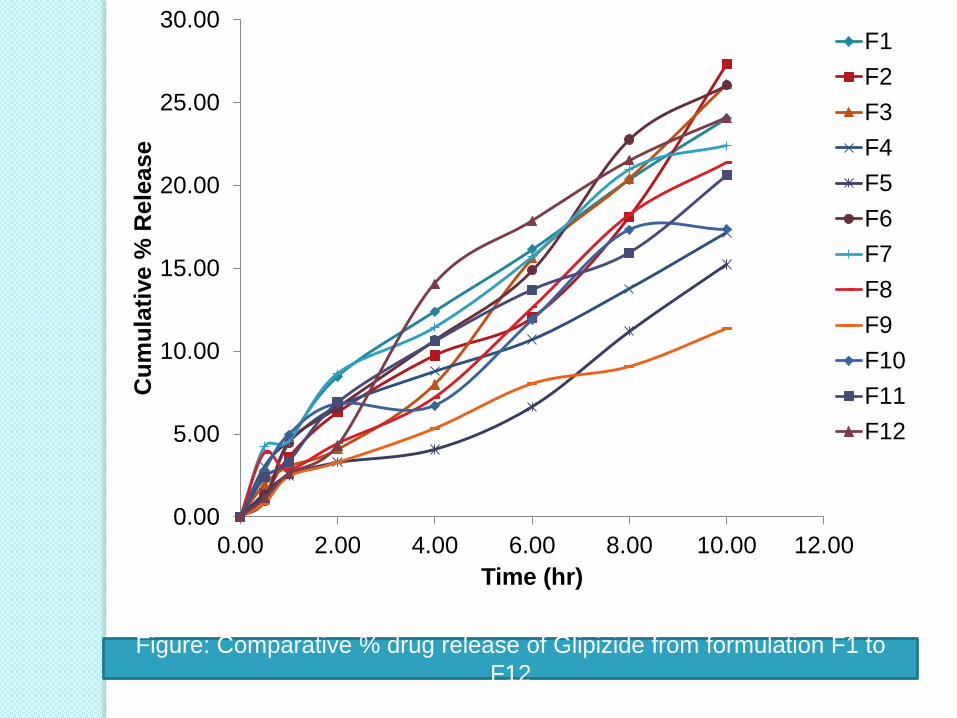
Drug release Study from single polymer loaded
microspheres
0.00
10.00
20.00
30.00
40.00
50.00
60.00
70.00
80.00
90.00
100.00
0.00 5.00 10.00 15.00
Cu
mu
lati
ve %
rele
ase
Time (hr)
F1
F2
F3
F4
F5
F6
F7
F8
F9
F10
F11
F12
Figure: Comparative % drug release of Metformin HCl from formulation F1 to
F12
0.00
5.00
10.00
15.00
20.00
25.00
30.00
0.00 2.00 4.00 6.00 8.00 10.00 12.00
Cu
mu
lati
ve %
Rele
ase
Time (hr)
F1
F2
F3
F4
F5
F6
F7
F8
F9
F10
F11
F12
Figure: Comparative % drug release of Glipizide from formulation F1 to
F12
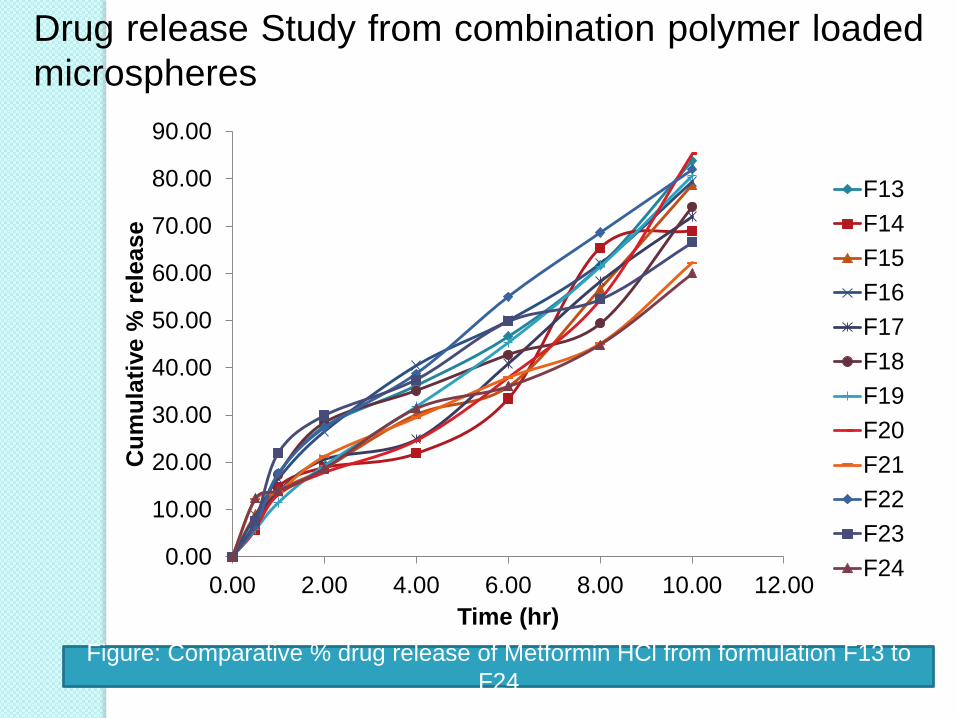
Figure: Comparative % drug release of Metformin HCl from formulation F13 to
F24
0.00
10.00
20.00
30.00
40.00
50.00
60.00
70.00
80.00
90.00
0.00 2.00 4.00 6.00 8.00 10.00 12.00
Cu
mu
lati
ve %
rele
ase
Time (hr)
F13
F14
F15
F16
F17
F18
F19
F20
F21
F22
F23
F24
Drug release Study from combination polymer loaded
microspheres
0.00
5.00
10.00
15.00
20.00
25.00
30.00
0.00 2.00 4.00 6.00 8.00 10.00 12.00
Cu
mu
lati
ve %
Rele
ase
Time (hr)
F13
F14
F15
F16
F17
F18
F19
F20
F21
F22
F23
F24
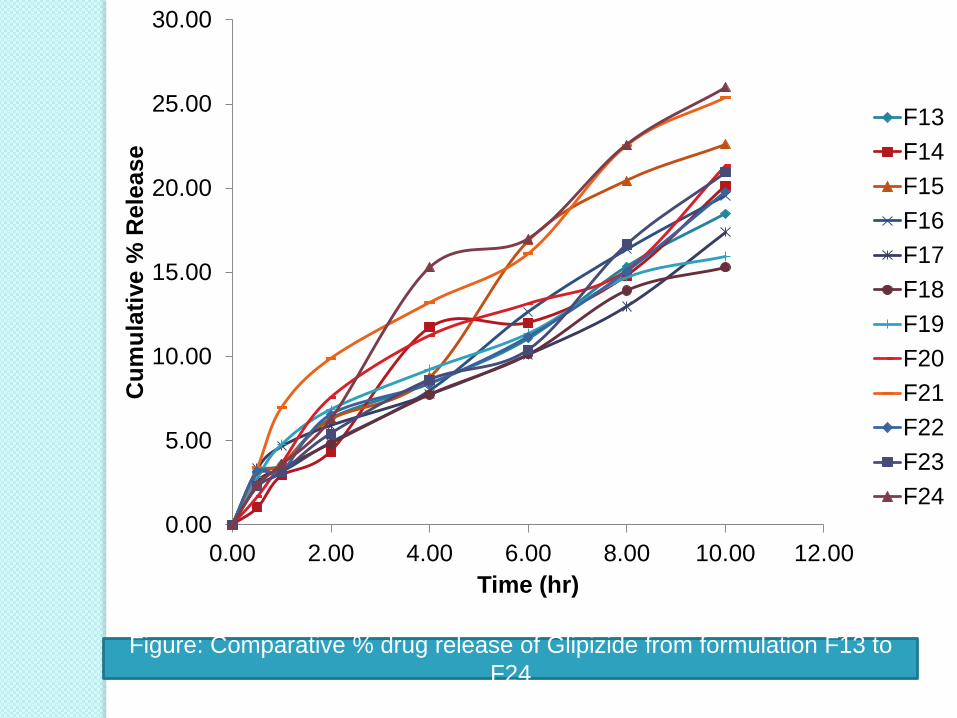
Figure: Comparative % drug release of Glipizide from formulation F13 to
F24
Discussion
Dissolution Medium: Buffer (pH 6.8), Temp: 370C
Drug release from these microspheres were found to be slow, extended and depended in the type and conc. of polymer used.
It was observed that metformin hydrochloride release was higher when compared to that of glipizide at the end of the release study this may be due to reason that release of glipizide from the microspheres depends on the core: coat ratio i.e., drug: polymer ratio. Here the ratio was 1:26; 1:52 and 1:78 for glipizide and 1:1.04; 1: 2.08 and 1: 3.12 for metformin hydrochloride, which resulted in low cumulative percentage drug release of glipizide from the microspheres.
Formulation F10 and F2 containing Eudragit RLPO and Ethyl cellulose showed the max. release of 87.02% and 27.31% for metformin and glipizide respectively for formulation F1 to F12 after 10hrs, due to high swelling property and high dissolution of polymer.
Formulation F20 and F24 containing combination polymers of Ethyl cellulose+ eudragit RSPO and Ethyl cellulose+ eudragit RLPO showed the max. release for metformin and glipizide from formulation F13 to F24 respectively.
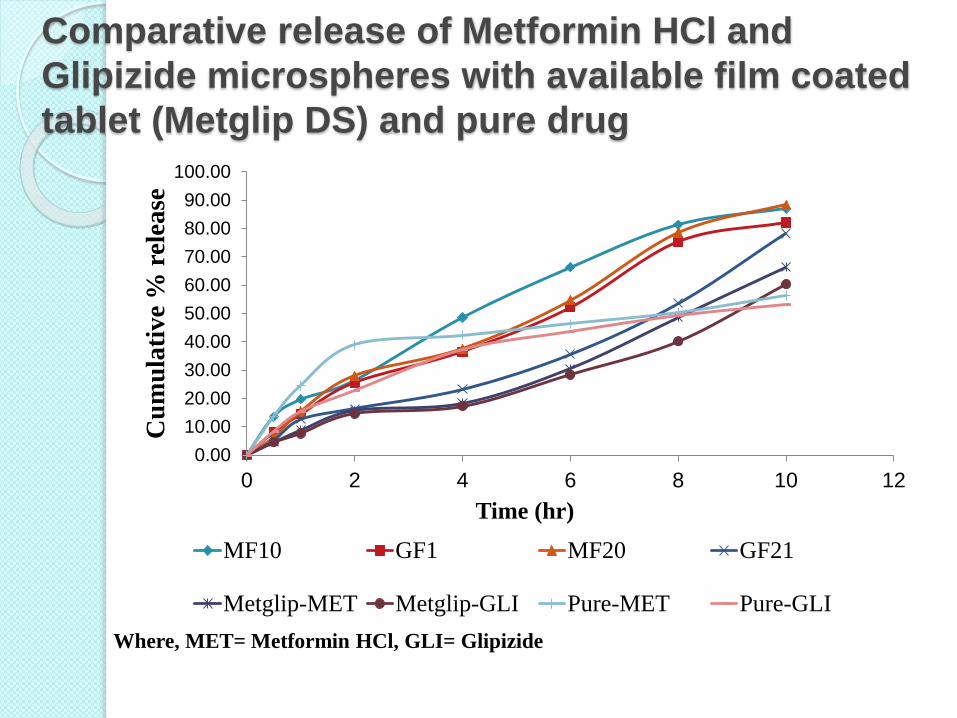
Comparative release of Metformin HCl and
Glipizide microspheres with available film coated
tablet (Metglip DS) and pure drug
0.00
10.00
20.00
30.00
40.00
50.00
60.00
70.00
80.00
90.00
100.00
0 2 4 6 8 10 12
Cu
mu
lati
ve
% r
elea
se
Time (hr)
MF10 GF1 MF20 GF21
Metglip-MET Metglip-GLI Pure-MET Pure-GLI
Where, MET= Metformin HCl, GLI= Glipizide
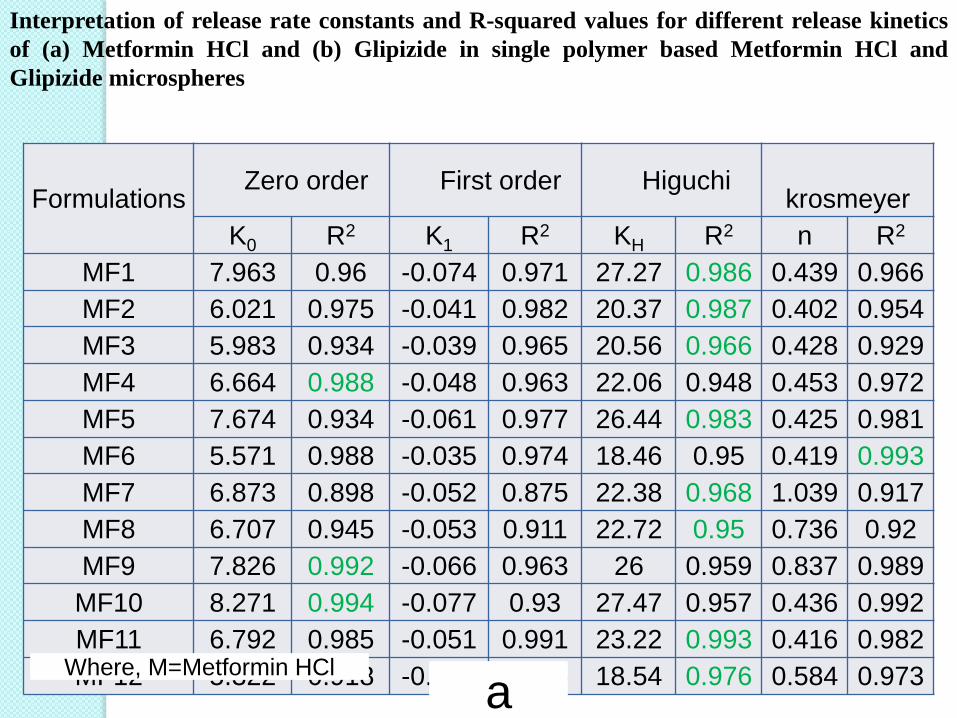
FormulationsZero order First order Higuchi
krosmeyer
K0 R2 K1 R2 KH R2 n R2
MF1 7.963 0.96 -0.074 0.971 27.27 0.986 0.439 0.966
MF2 6.021 0.975 -0.041 0.982 20.37 0.987 0.402 0.954
MF3 5.983 0.934 -0.039 0.965 20.56 0.966 0.428 0.929
MF4 6.664 0.988 -0.048 0.963 22.06 0.948 0.453 0.972
MF5 7.674 0.934 -0.061 0.977 26.44 0.983 0.425 0.981
MF6 5.571 0.988 -0.035 0.974 18.46 0.95 0.419 0.993
MF7 6.873 0.898 -0.052 0.875 22.38 0.968 1.039 0.917
MF8 6.707 0.945 -0.053 0.911 22.72 0.95 0.736 0.92
MF9 7.826 0.992 -0.066 0.963 26 0.959 0.837 0.989
MF10 8.271 0.994 -0.077 0.93 27.47 0.957 0.436 0.992
MF11 6.792 0.985 -0.051 0.991 23.22 0.993 0.416 0.982
MF12 5.322 0.918 -0.035 0.945 18.54 0.976 0.584 0.973
Interpretation of release rate constants and R-squared values for different release kinetics
of (a) Metformin HCl and (b) Glipizide in single polymer based Metformin HCl and
Glipizide microspheres
aWhere, M=Metformin HCl
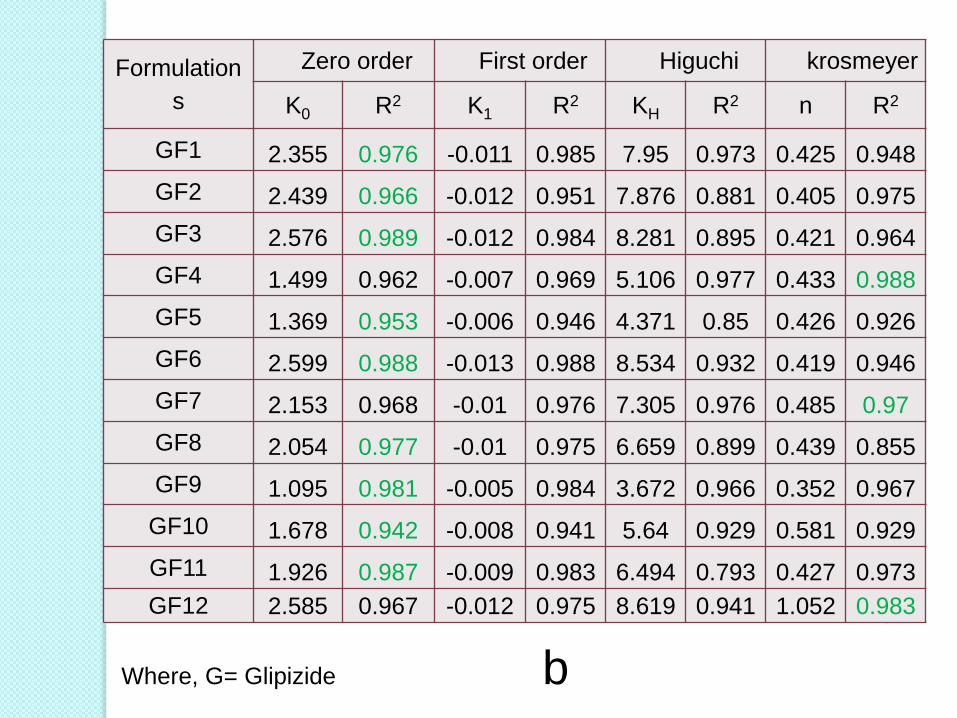
Formulation
s
Zero order First order Higuchi krosmeyer
K0 R2 K1 R2 KH R2 n R2
GF1 2.355 0.976 -0.011 0.985 7.95 0.973 0.425 0.948
GF2 2.439 0.966 -0.012 0.951 7.876 0.881 0.405 0.975
GF3 2.576 0.989 -0.012 0.984 8.281 0.895 0.421 0.964
GF4 1.499 0.962 -0.007 0.969 5.106 0.977 0.433 0.988
GF5 1.369 0.953 -0.006 0.946 4.371 0.85 0.426 0.926
GF6 2.599 0.988 -0.013 0.988 8.534 0.932 0.419 0.946
GF7 2.153 0.968 -0.01 0.976 7.305 0.976 0.485 0.97
GF8 2.054 0.977 -0.01 0.975 6.659 0.899 0.439 0.855
GF9 1.095 0.981 -0.005 0.984 3.672 0.966 0.352 0.967
GF10 1.678 0.942 -0.008 0.941 5.64 0.929 0.581 0.929
GF11 1.926 0.987 -0.009 0.983 6.494 0.793 0.427 0.973
GF12 2.585 0.967 -0.012 0.975 8.619 0.941 1.052 0.983
Where, G= Glipizide b
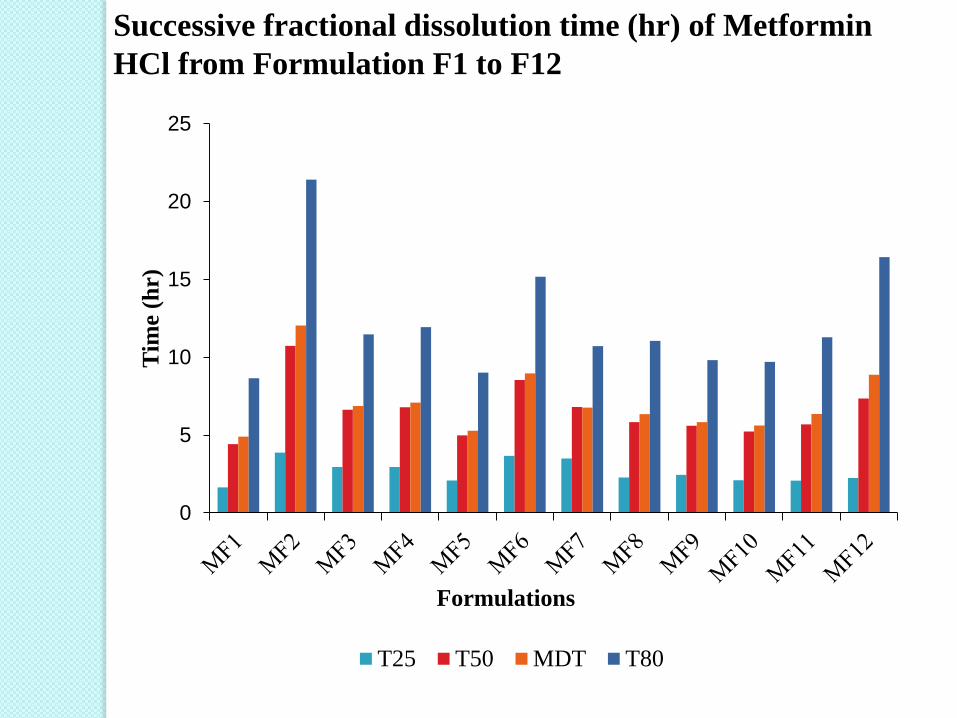
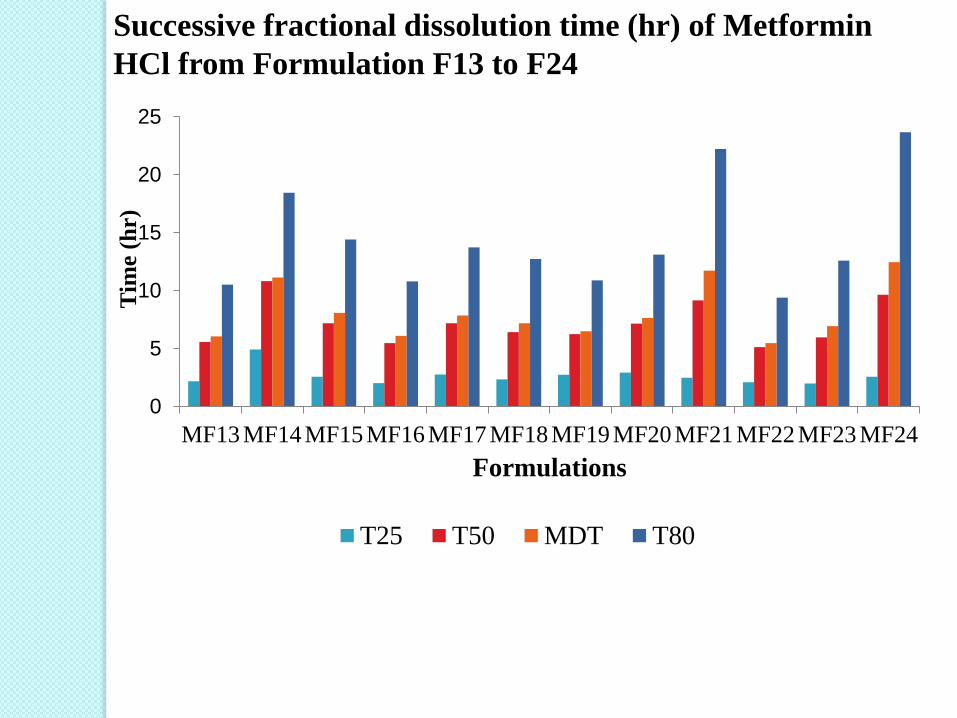
Successive fractional dissolution time (hr) of Metformin
HCl from Formulation F1 to F12
0
5
10
15
20
25
Tim
e (
hr)
Formulations
T25 T50 MDT T80
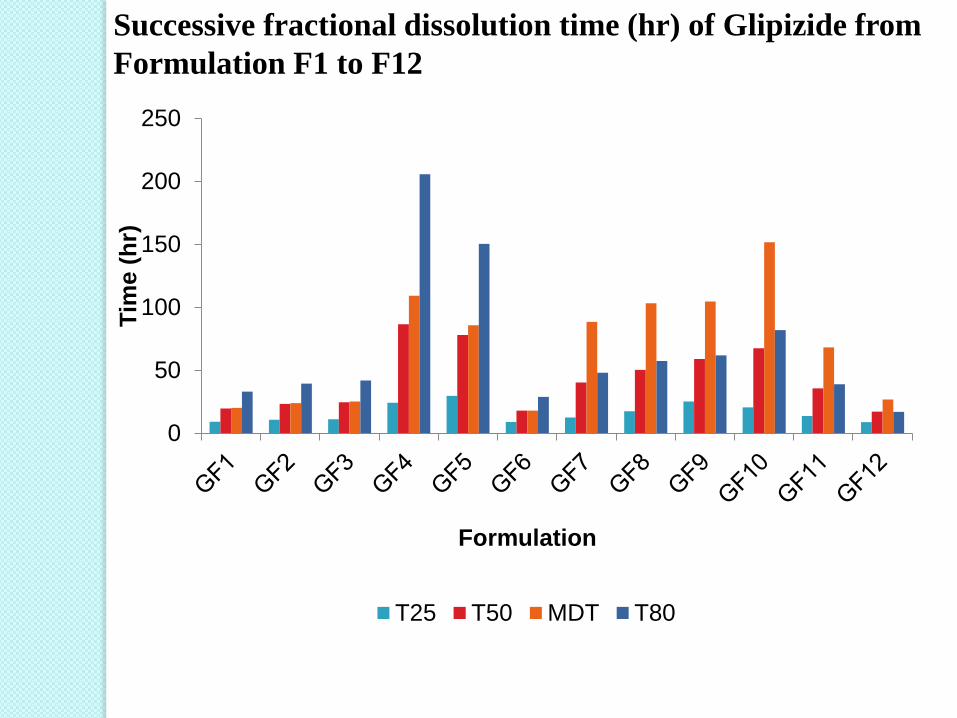
Successive fractional dissolution time (hr) of Glipizide from
Formulation F1 to F12
0
50
100
150
200
250T
ime (
hr)
Formulation
T25 T50 MDT T80
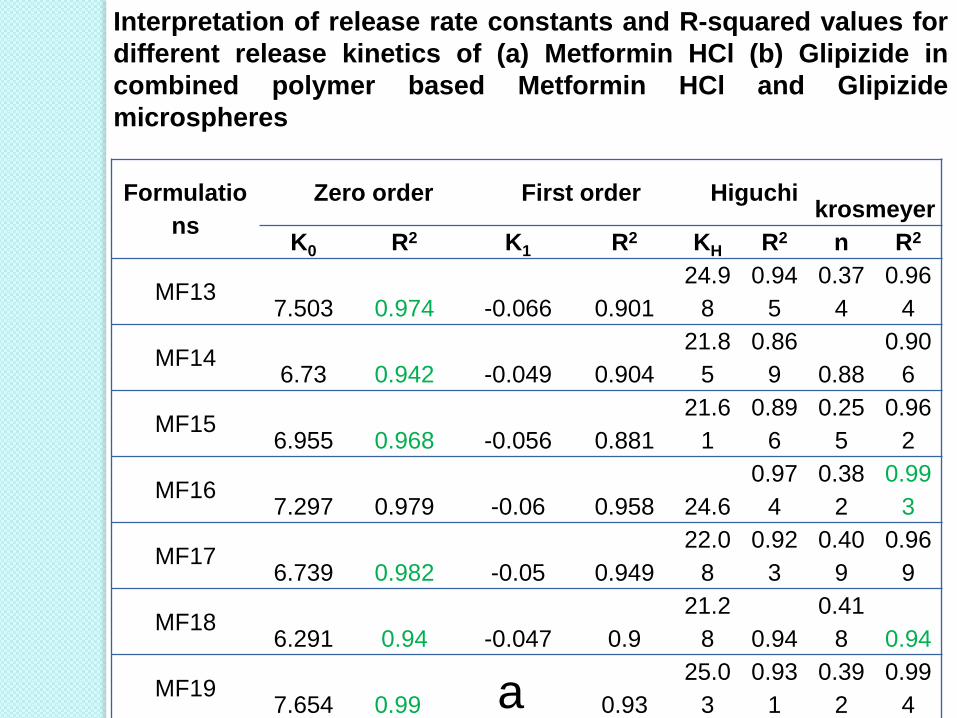
Interpretation of release rate constants and R-squared values for
different release kinetics of (a) Metformin HCl (b) Glipizide in
combined polymer based Metformin HCl and Glipizide
microspheres
Formulatio
ns
Zero order First order Higuchikrosmeyer
K0 R2 K1 R2 KH R2 n R2
MF137.503 0.974 -0.066 0.901
24.9
8
0.94
5
0.37
4
0.96
4
MF146.73 0.942 -0.049 0.904
21.8
5
0.86
9 0.88
0.90
6
MF156.955 0.968 -0.056 0.881
21.6
1
0.89
6
0.25
5
0.96
2
MF167.297 0.979 -0.06 0.958 24.6
0.97
4
0.38
2
0.99
3
MF176.739 0.982 -0.05 0.949
22.0
8
0.92
3
0.40
9
0.96
9
MF186.291 0.94 -0.047 0.9
21.2
8 0.94
0.41
8 0.94
MF197.654 0.995 -0.063 0.93
25.0
3
0.93
1
0.39
2
0.99
4
23.8 0.85 0.42 0.95
a
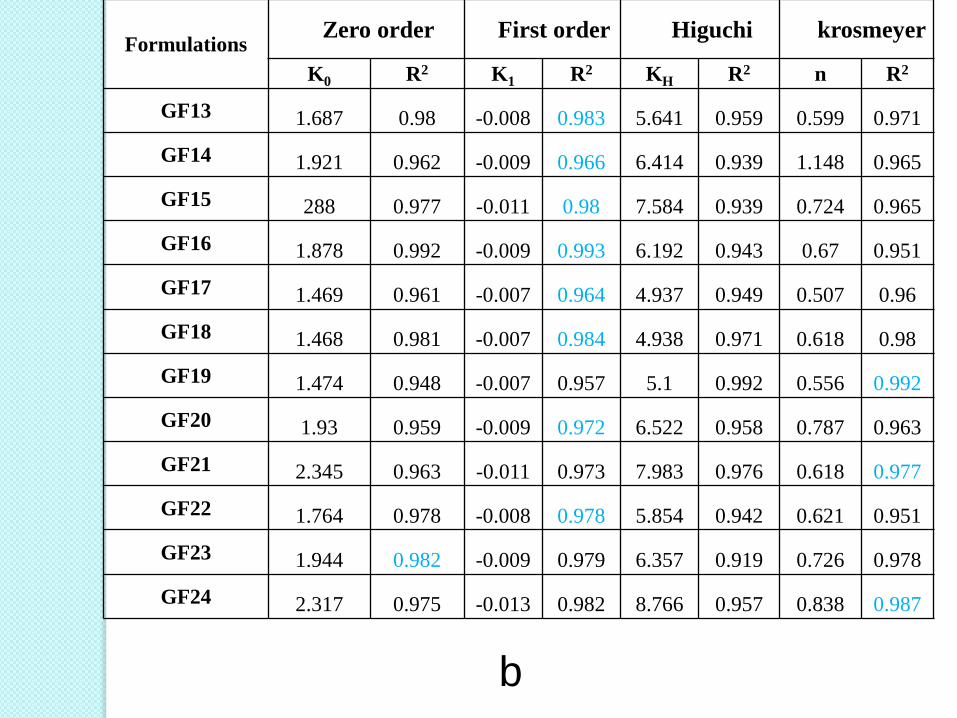
FormulationsZero order First order Higuchi krosmeyer
K0 R2 K1 R2 KH R2 n R2
GF13 1.687 0.98 -0.008 0.983 5.641 0.959 0.599 0.971
GF14 1.921 0.962 -0.009 0.966 6.414 0.939 1.148 0.965
GF15 288 0.977 -0.011 0.98 7.584 0.939 0.724 0.965
GF16 1.878 0.992 -0.009 0.993 6.192 0.943 0.67 0.951
GF17 1.469 0.961 -0.007 0.964 4.937 0.949 0.507 0.96
GF18 1.468 0.981 -0.007 0.984 4.938 0.971 0.618 0.98
GF19 1.474 0.948 -0.007 0.957 5.1 0.992 0.556 0.992
GF20 1.93 0.959 -0.009 0.972 6.522 0.958 0.787 0.963
GF21 2.345 0.963 -0.011 0.973 7.983 0.976 0.618 0.977
GF22 1.764 0.978 -0.008 0.978 5.854 0.942 0.621 0.951
GF23 1.944 0.982 -0.009 0.979 6.357 0.919 0.726 0.978
GF24 2.317 0.975 -0.013 0.982 8.766 0.957 0.838 0.987
b
0
5
10
15
20
25
MF13 MF14 MF15 MF16 MF17 MF18 MF19 MF20 MF21 MF22 MF23 MF24
Tim
e (
hr)
Formulations
T25 T50 MDT T80
Successive fractional dissolution time (hr) of Metformin
HCl from Formulation F13 to F24
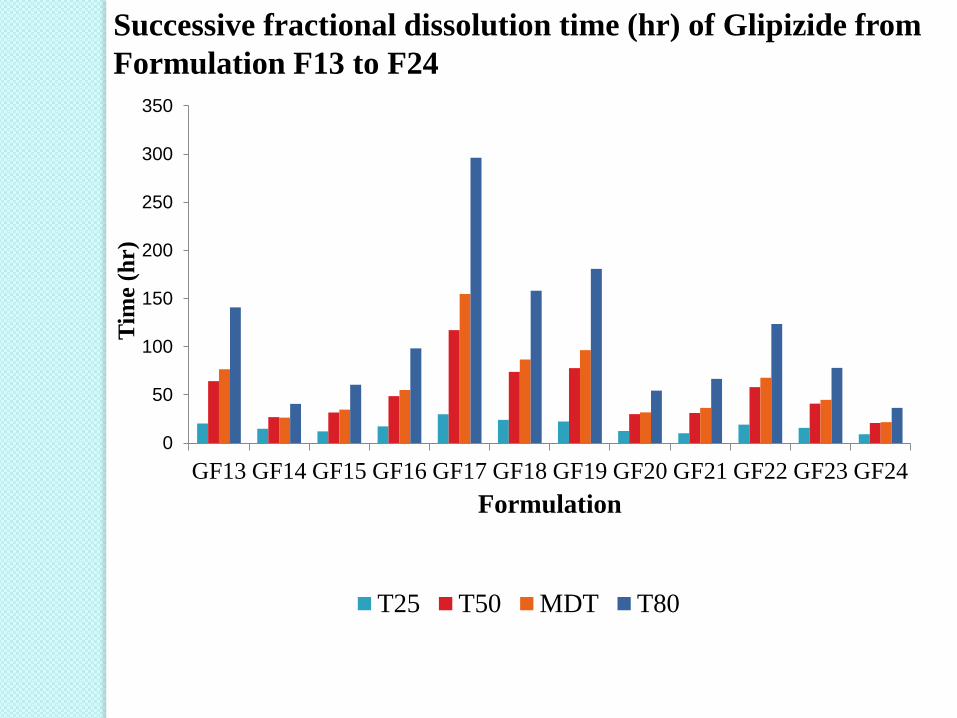
0
50
100
150
200
250
300
350
GF13 GF14 GF15 GF16 GF17 GF18 GF19 GF20 GF21 GF22 GF23 GF24
Tim
e (
hr)
Formulation
T25 T50 MDT T80
Successive fractional dissolution time (hr) of Glipizide from
Formulation F13 to F24
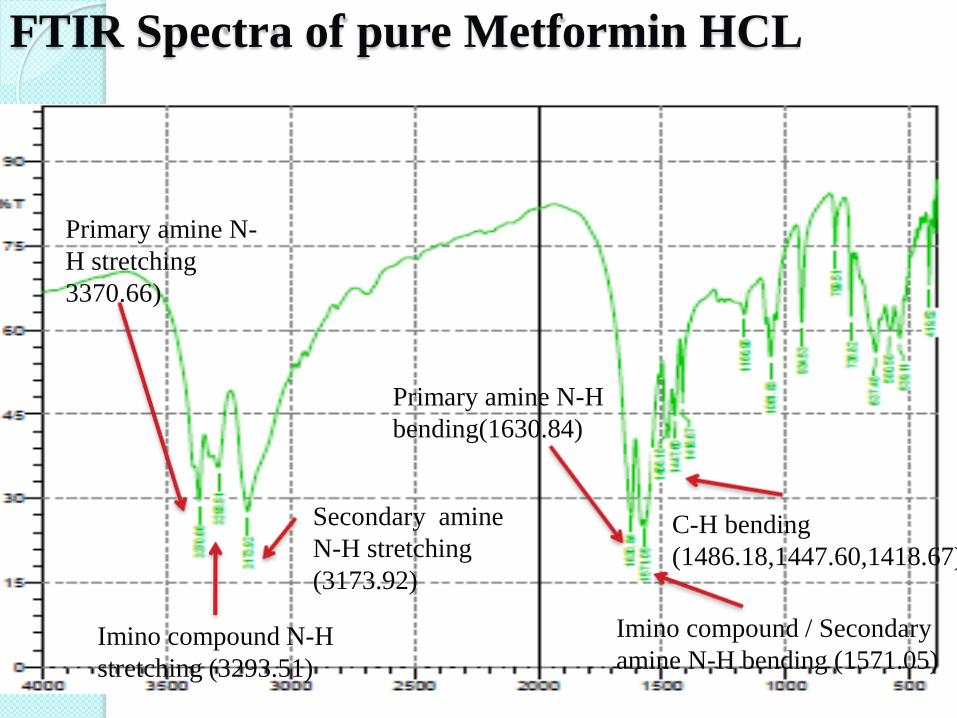
FTIR Spectra of pure Metformin HCL
Primary amine N-
H stretching
3370.66)
Primary amine N-H
bending(1630.84)
Imino compound N-H
stretching (3293.51)
Secondary amine
N-H stretching
(3173.92)
Imino compound / Secondary
amine N-H bending (1571.05)
C-H bending
(1486.18,1447.60,1418.67)
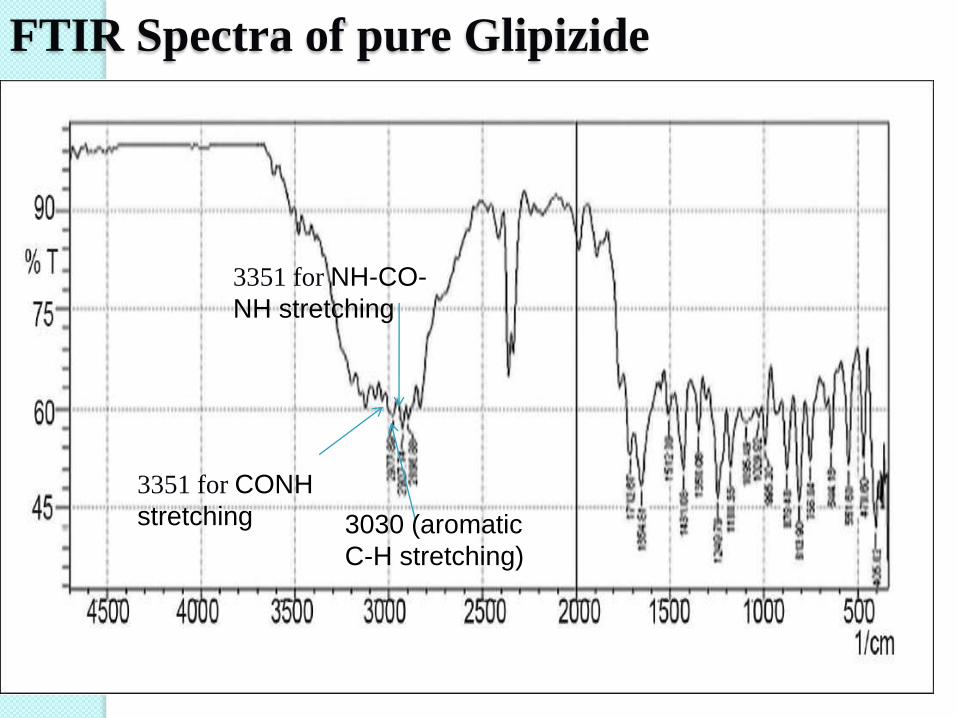
FTIR Spectra of pure Glipizide
3351 for CONH
stretching
3351 for NH-CO-
NH stretching
3030 (aromatic
C-H stretching)
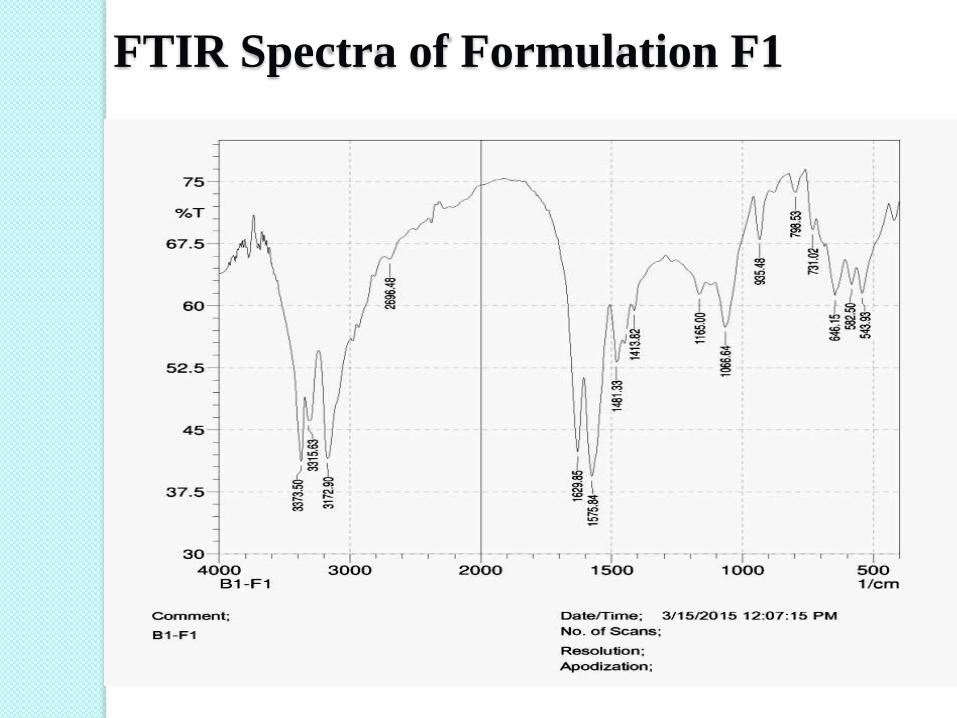
FTIR Spectra of Formulation F1
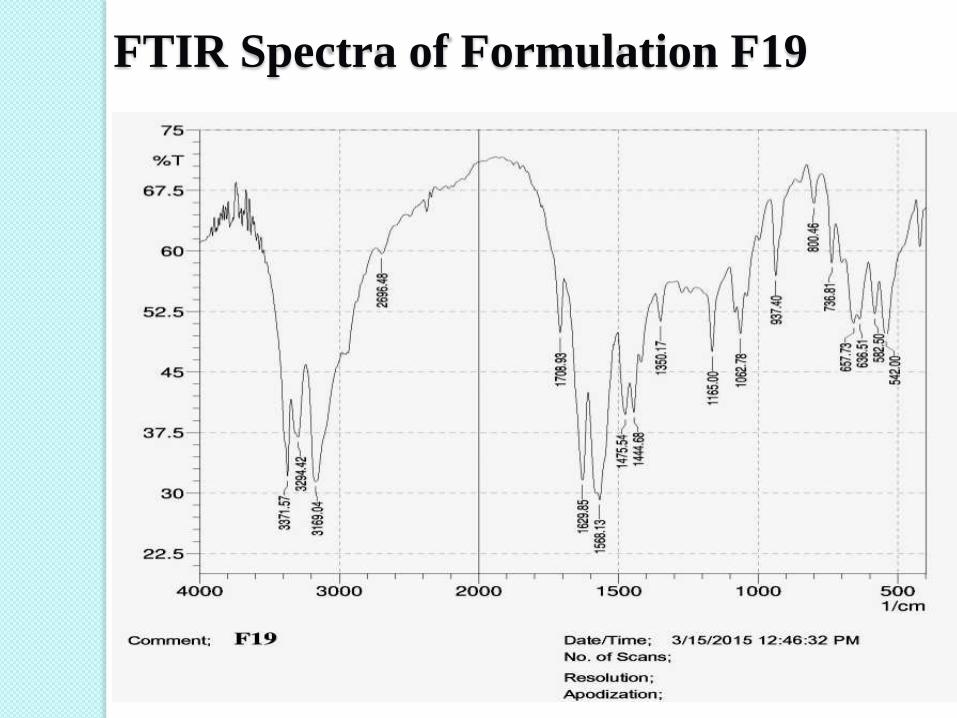
FTIR Spectra of Formulation F19
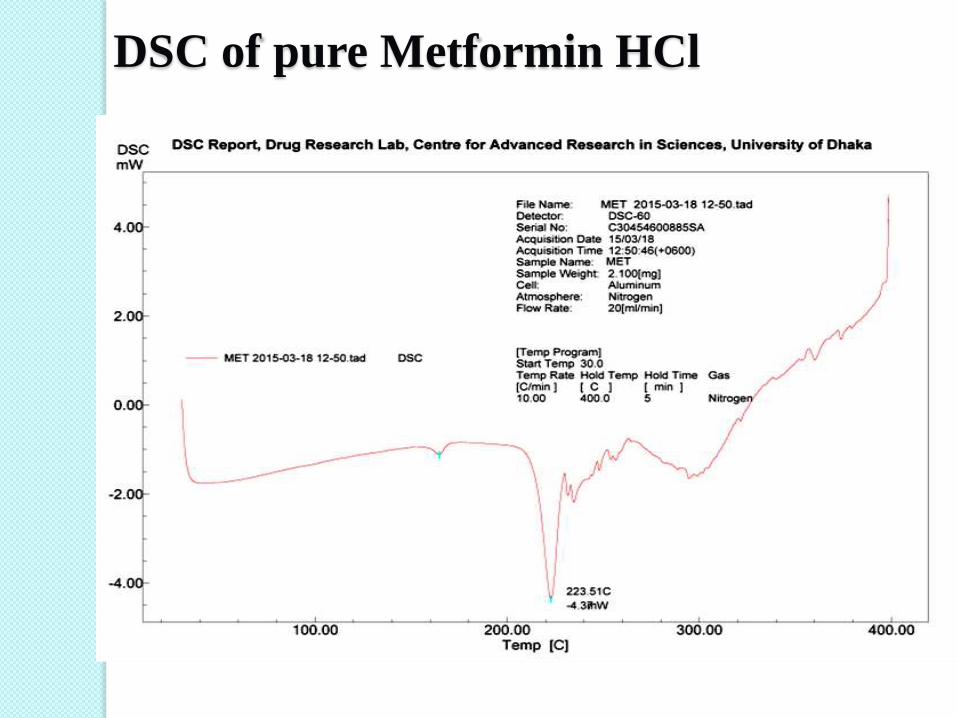
DSC of pure Metformin HCl
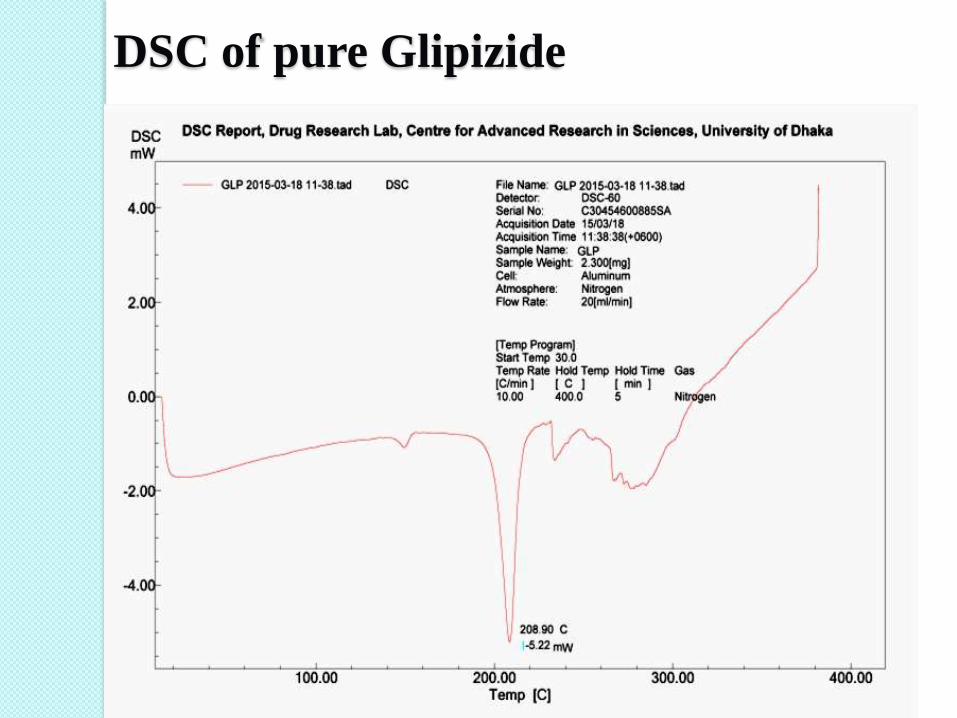
DSC of pure Glipizide
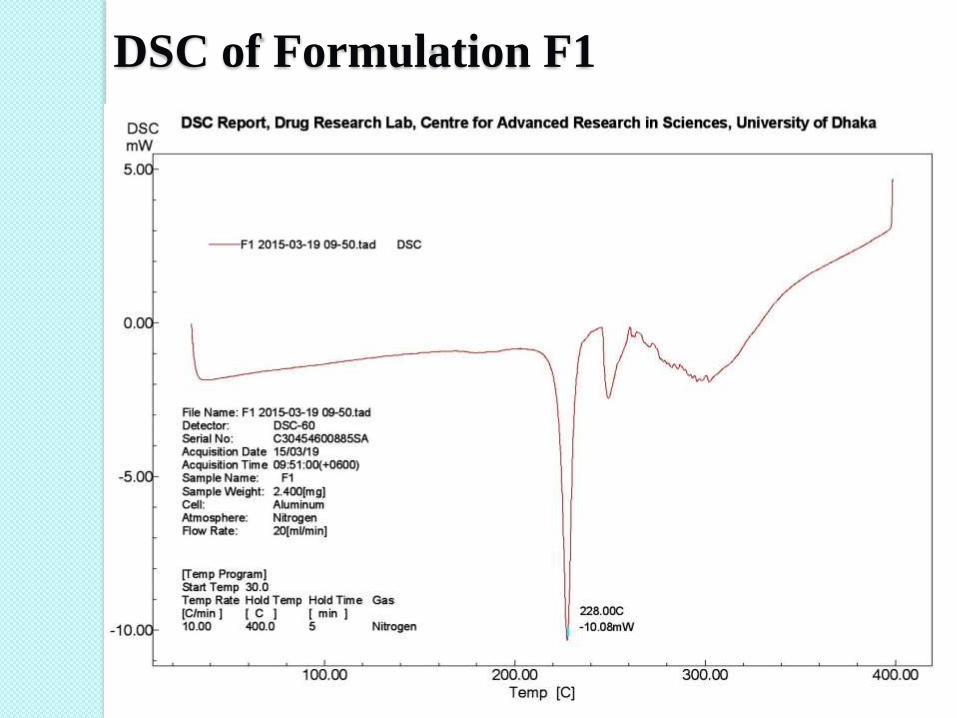
DSC of Formulation F1
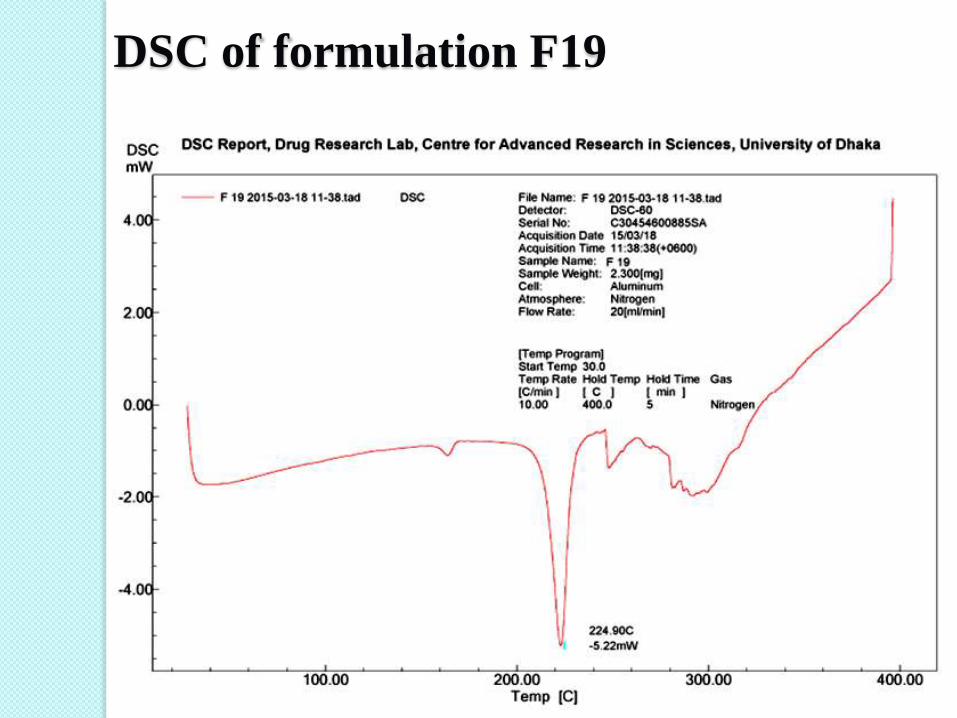
DSC of formulation F19
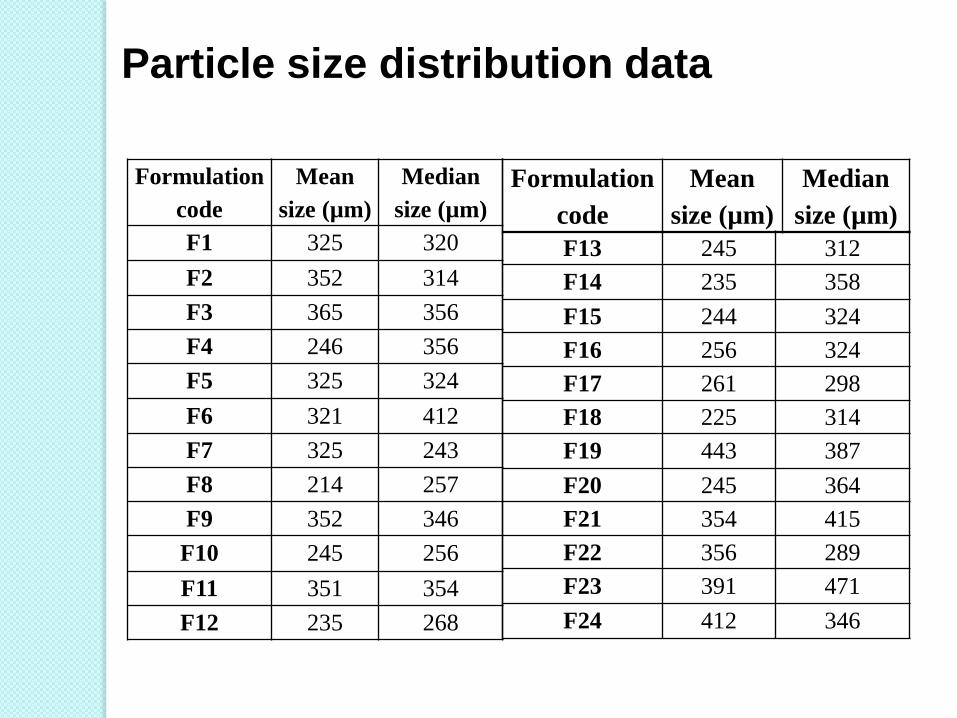
Formulation
code
Mean
size (µm)
Median
size (µm)
F1 325 320
F2 352 314
F3 365 356
F4 246 356
F5 325 324
F6 321 412
F7 325 243
F8 214 257
F9 352 346
F10 245 256
F11 351 354
F12 235 268
F13 245 312
F14 235 358
F15 244 324
F16 256 324
F17 261 298
F18 225 314
F19 443 387
F20 245 364
F21 354 415
F22 356 289
F23 391 471
F24 412 346
Formulation
code
Mean
size (µm)
Median
size (µm)
Particle size distribution data
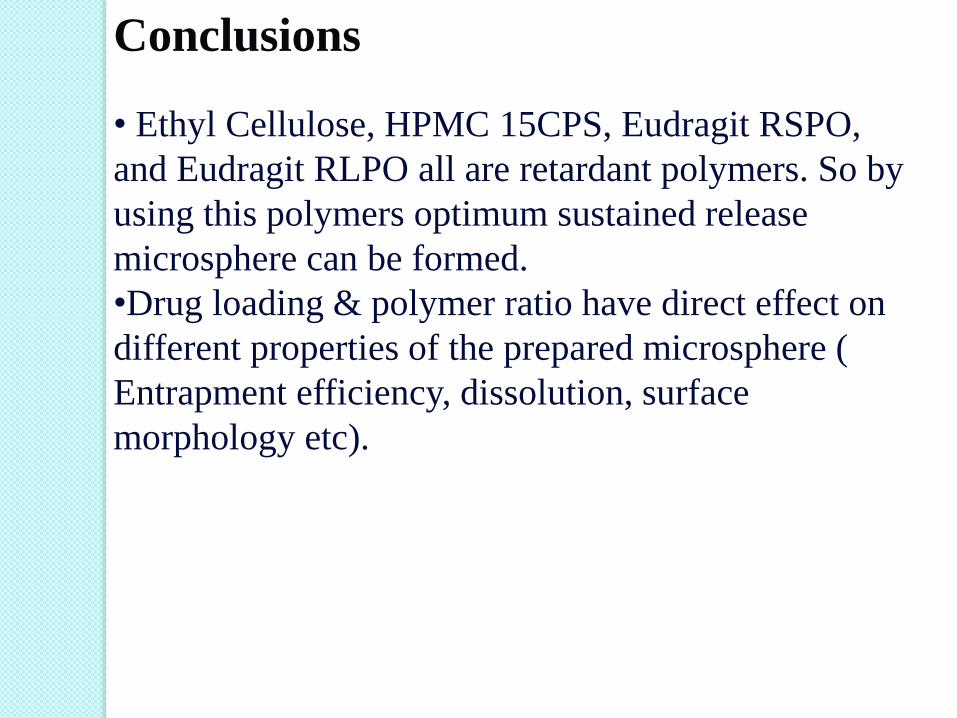
Conclusions
• Ethyl Cellulose, HPMC 15CPS, Eudragit RSPO,
and Eudragit RLPO all are retardant polymers. So by
using this polymers optimum sustained release
microsphere can be formed.
•Drug loading & polymer ratio have direct effect on
different properties of the prepared microsphere (
Entrapment efficiency, dissolution, surface
morphology etc).


![Bioavailability File: Glipizide - FABADdergi.fabad.org.tr/index/issue/pdf/volum31/issue3/151-161.pdf152 Kaynak, Öner phenyl] sulfonyl] urea7,10.The molecular formula of Glipizide](https://static.fdocuments.net/doc/165x107/611c2256124aeb0d326e6abd/bioavailability-file-glipizide-152-kaynak-ner-phenyl-sulfonyl-urea710the.jpg)