2017 Annual General Meeting CEO Presentation - Thule … · Annual General Meeting. CEO...
33
2017 Annual General Meeting CEO Presentation Magnus Welander April 26, 2017 Malmö, Sweden
Transcript of 2017 Annual General Meeting CEO Presentation - Thule … · Annual General Meeting. CEO...

2017 Annual General MeetingCEO Presentation
Magnus WelanderApril 26, 2017Malmö, Sweden

Active Life, Simplified.
April 26, 2017 Thule Group AB – AGM 2017Slide 2

Our Investment Case
April 26, 2017 Thule Group AB – AGM 2017Slide 3
Attractive CompanyAttractive Market
Strong user-influenced Innovation and Product Development Differentiated Premium Brand Global Route-to-Market Strategy and Implementation Strong Position in the Value Chain Sustainable business approach
Favorable mega-trendsdriving market growth

Attractive Market

Market trends are positive for most of the categories within Outdoor&Bags
April 26, 2017 Thule Group AB – AGM 2017Slide 5
Sport&Cargo Carriers Bags for El. DevicesOther Outdoor&Bags
Share ofThule GroupSales 2016 1
MarketTrend 2
Growth2016 vs. 2015
(Constant Currency)
67% 19% 14%+5.3% +25.8% -13.2%
+10%
RV ProductsActivewith Kids
Sport &Travel Bags
+3%+5% +5% +5% -20%
1 Excl., Specialty Segment that is under divestment
2 Market Trend isCompany estimatesin target markets
Daypacks &Laptop Bags
Device specific(e.g. Camera)

Attractive Company

Sustainable Approach

Environmental Focus is moving us closer to our ambitious targets
April 26, 2017 Thule Group AB – AGM 2017Slide 8
0%
25%
50%
75%
100%
0
5
10
15
20
2012 2013 2014 2015 2016
GWh Share
Proportion renewable electricity in own plants (%)Electricity (GWh)
- 45%Reduction CO2 emissions
at Thule Group sites(as compared with Base Year 2014)

Health&Safety and equal opportunities are high on our agenda
April 26, 2017 Thule Group AB – AGM 2017Slide 9
0
20
40
60
80
100
0
100
200
300
400
500
days accidents
2013 2013 2014 2015 2016
Number of accidentsLost days per million hours worked
41%Share Women
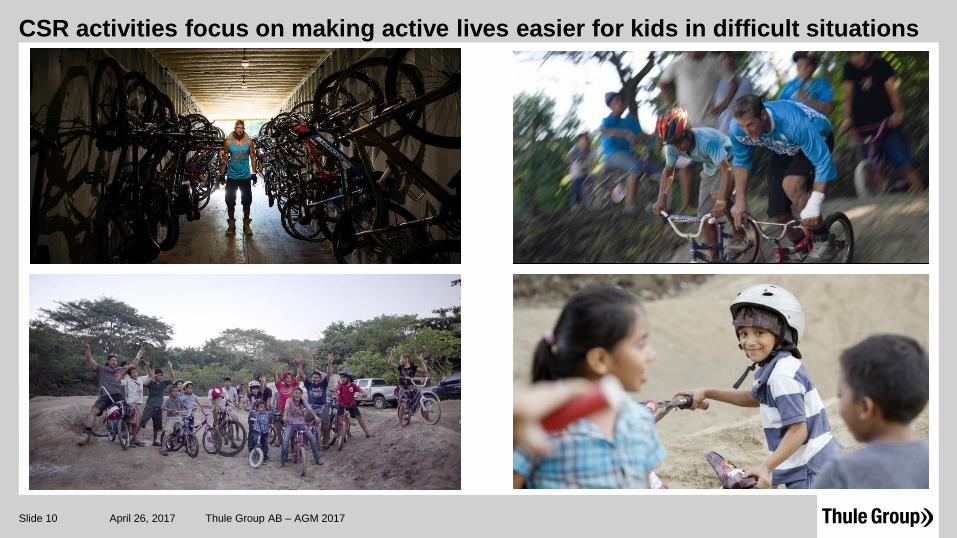
CSR activities focus on making active lives easier for kids in difficult situations
April 26, 2017 Thule Group AB – AGM 2017Slide 10

Strong Position in the Value Chain
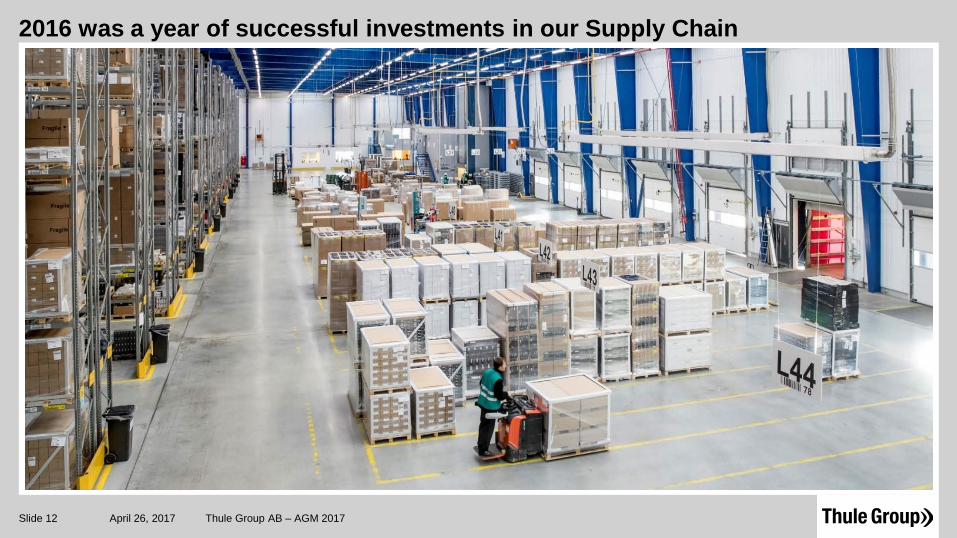
2016 was a year of successful investments in our Supply Chain
April 26, 2017 Thule Group AB – AGM 2017Slide 12

Global Go-To-Market Approach

Sales in 140 markets supporting a broad retail omni-channel customer base
April 26, 2017 Thule Group AB – AGM 2017Slide 14
Sport&Cargo Carriers
Specialists Brick&Mortar Specialists On-line
Other Categories
Thule Retail Partners Other Retailers

Premium Brand

Thule – Our biggest brand stands for 71% of sales
April 26, 2017 Thule Group AB – AGM 2017Slide 16
71%Share of salesThule brand
86%Share of Sales
Thule Group brands

Strong position at Key Fairs and Events
April 26, 2017 Thule Group AB – AGM 2017Slide 17

A great brand and fantastic products generate positive PR
April 26, 2017 Thule Group AB – AGM 2017Slide 18
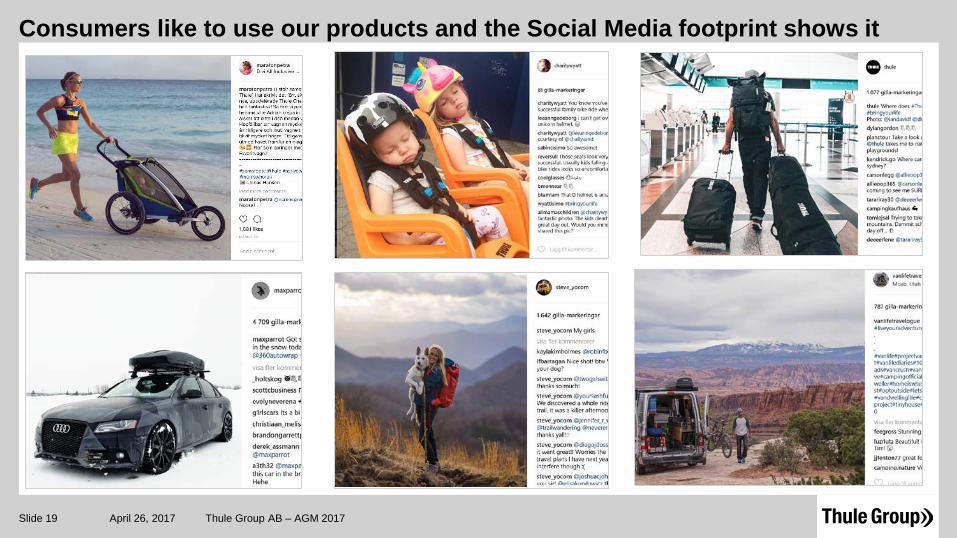
Consumers like to use our products and the Social Media footprint shows it
April 26, 2017 Thule Group AB – AGM 2017Slide 19

Innovation Driven

We spend more money on innovation than ever to drive future growth
April 26, 2017 Thule Group AB – AGM 2017Slide 21
53%Share of sales from products
launched the last 3 years
4.6%Product Development spend
(share of sales)
695 773612
1900
250
500
750
1000
Patents in 268families
Designs in 313families
Trademarks in104 families
Domains
IP Portfolio with strong global coverage

We are better than most at turning consumer insights into great products
April 26, 2017 Thule Group AB – AGM 2017Slide 22

We test harder, because we build products to last
April 26, 2017 Thule Group AB – AGM 2017Slide 23
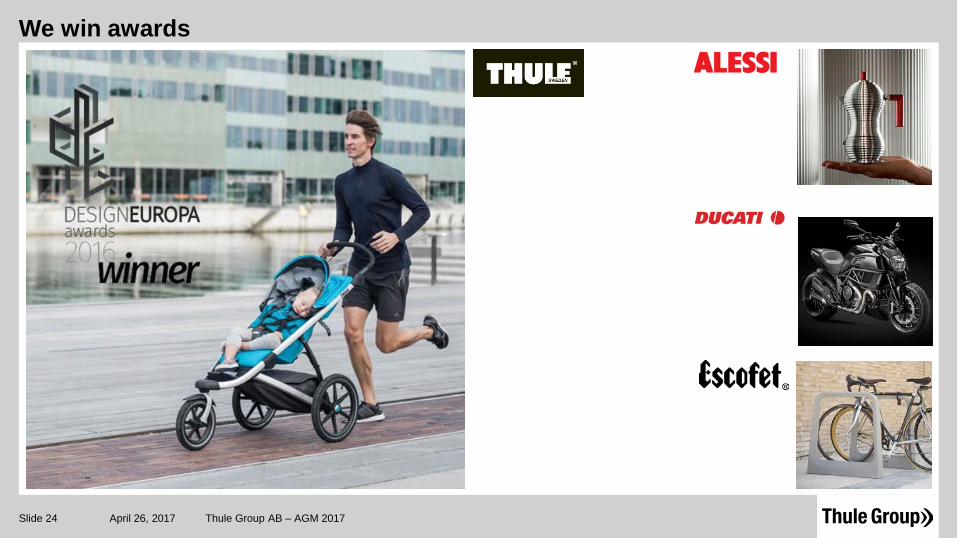
We win awards
April 26, 2017 Thule Group AB – AGM 2017Slide 24

We win awards
April 26, 2017 Thule Group AB – AGM 2017Slide 25

Financials 2016

2016 – Performance vs. Financial Targets
Dividend Policy ≥ 50%
Organic Growth ≥ 5%
UnderlyingEBIT
Margin≥ 17%
Net Debt / EBITDA c. 2.5x
Constant Currency Net Sales Growth (excl. Acquisitions)
Outdoor&Bags SpecialtyThule Group+4.6% +5.0% 0.1%
17.3%
1.6x 2.3x (YE 2015)
2015 FY at 16.0%
51%* * Ordinary dividend of SEK 3.40 per share, proposed by the Board. In addition the Board proposes an extraordinary dividend ofSEK 7.50 per share
April 26, 2017 Thule Group AB – AGM 2017Slide 27
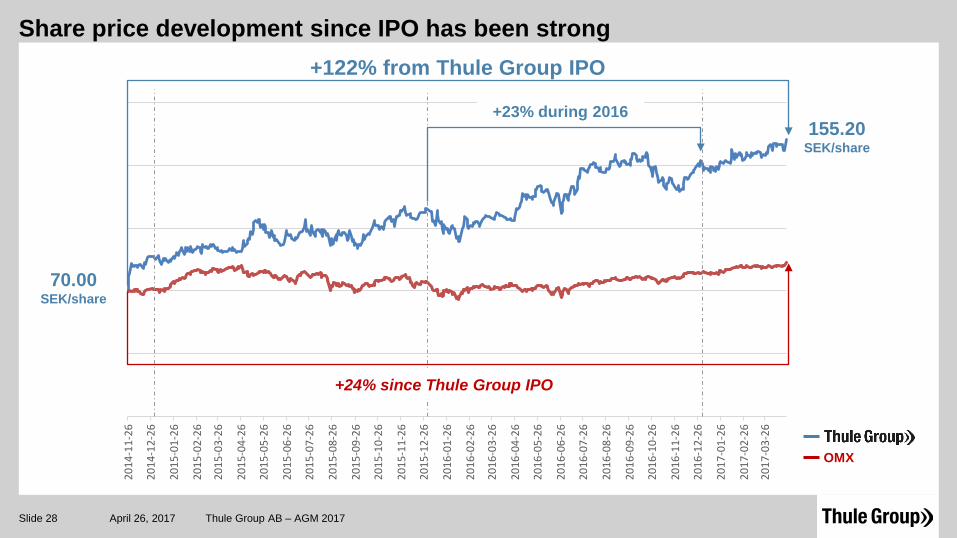
+122% from Thule Group IPO
Share price development since IPO has been strong
April 26, 2017 Thule Group AB – AGM 2017Slide 28
2014
-11-
26
2014
-12-
26
2015
-01-
26
2015
-02-
26
2015
-03-
26
2015
-04-
26
2015
-05-
26
2015
-06-
26
2015
-07-
26
2015
-08-
26
2015
-09-
26
2015
-10-
26
2015
-11-
26
2015
-12-
26
2016
-01-
26
2016
-02-
26
2016
-03-
26
2016
-04-
26
2016
-05-
26
2016
-06-
26
2016
-07-
26
2016
-08-
26
2016
-09-
26
2016
-10-
26
2016
-11-
26
2016
-12-
26
2017
-01-
26
2017
-02-
26
2017
-03-
26
70.00SEK/share
155.20SEK/share
OMX
+23% during 2016
+24% since Thule Group IPO

2017/Q1 Update

2017/Q1 – A very good start to the year Net sales of SEK 1,599m (1,380) Thule Group +15.9% (+12.3% excluding currency effects) Outdoor&Bags +17.2% (+13.8% excluding currency effects) Specialty -7.6% (-12.4% excluding currency effects)
Underlying EBIT of SEK 280m (235), underlyingEBIT margin of 17.5% (17.0) Improvement by +0.3 percentage points in constant currency Outdoor&Bags SEK 296m (252), +17.4% vs. PY Specialty SEK 9m (9), -1.5% vs. PY
Net income of SEK 203m (169) Earnings per share of SEK 2.00 (1.67) Cash flow from operating activities of SEK -172m (-31)
Specialty divestment in progress
April 26, 2017 Thule Group AB – AGM 2017Slide 30

2017/Q1 – Performance vs. Financial Targets
Dividend Policy ≥ 50%
Organic Growth ≥ 5%
UnderlyingEBIT
Margin≥ 17%
Net Debt / EBITDA c. 2.5x
Constant Currency Net Sales Growth (excl. Acquisitions)
Outdoor&Bags SpecialtyThule Group+11.7% +13.1% -12.4%
17.5%
1.6x 1.6x (YE 2016)
LTM 2017/Q1 at 17.4%
51%* * Ordinary dividend of SEK 3.40 per share, proposed by the Board. In addition the Board proposes an extraordinary dividend ofSEK 7.50 per share
April 26, 2017 Thule Group AB – AGM 2017Slide 31

Focus areas for coming months
Drive profitable sales growth
Build further on strong Thule brand
Operational efficiencies to offset raw material costs
Deliver on strategic initiatives for the future
April 26, 2017 Thule Group AB – AGM 2017Slide 32