2016 RESULTS REPORT - Road Map Project
35
THE ROAD MAP PROJECT 2016 RESULTS REPORT PUBLISHED SPRING 2017
Transcript of 2016 RESULTS REPORT - Road Map Project

THE ROAD MAP PROJECT
2016 RESULTS REPORT
PUBLISHED SPRING 2017
A MESSAGE FROM THE CCER TEAMEach year, the Communit y Center for
Education Results (CCER) team works with
many committed partners and organizations
to produce the Road Map Project Results
Report, which allows us to reflect on the
communities we serve and the young people
who live in them. This annual snapshot offers a
close examination of our region’s progress and
the challenges we face. We hope advocates
and practitioners working to improve student
success see it as a valuable resource for data,
insight and action.
This is the fifth year we have published the
Results Report, and across the region we are
seeing steady progress in most areas, such
as rigorous coursetaking and high school
graduation. Despite this progress, racial gaps
are not closing, and poverty continues to be
a barrier for our students, with 92% of high-
poverty schools in King County concentrated
in the Road Map Region. Also of note is the
concerning rise in homelessness. When the
Road Map Project began in 2010, fewer than
2,000 of the region’s K-12 students were
homeless. Today, that number has more than
doubled to 4,500 students.
These sobering facts were at the forefront
of our minds as we engaged with partners in
a strategic planning process to address the
limited progress made on closing racial and
ethnic opportunity gaps. A Strategic Planning
Group was formed to help build a new strategic
framework. Moving forward, the project will
put greater emphasis on systems-level change.
We will also be putting racial equity at the
forefront of everything we do. The Road
Map Project will maintain its long-term goal
of closing opportunity gaps and boosting
postsecondary education attainment, and we
will work harder to collaborate with partners
across the education continuum. As you read
this report, you’ll find information about these
new strategic approaches.
Over the last few months we have seen even
more challenges to fundamental civil rights
and access to opportunity. In solidarity with
our communities, we are raising our voices and
joining forces to confront inequities. Those
involved in the Road Map Project consider our
region’s diversity our greatest asset. We stand
in strong support of students and families
regardless of race, ethnicity, immigration
status, ability, economic background, gender
identity, sexual orientation, religion or country
of origin.
There are no shortcuts when it comes
to combat t ing s y s temic rac ism and
intergenerational poverty. Change of this
magnitude takes the collective action of those
in and outside of the school system—and we
hope you will join us and our Road Map Project
partners in this work.
2016 RESULTS REPORT The Road Map Project2

Introduction
Healthy & Ready for Kindergarten
Supported & Successful in School
Graduate from High School College & Career Ready
Earn a College Degree or Career Credential
New Strategic Direction
Contents4
13
15
22
30
32
2016 RESULTS REPORT The Road Map Project3

The Road Map Project is a regional collective
impact initiative aimed at dramatically improving
student achievement from cradle through
college and career in South King County and
South Seattle. The project is working to make
large-scale change and has created a common
goal and shared vision to facilitate coordinated
action, both inside and outside schools. Started
in 2010, leaders and activists from many sectors
are committed to working together as part of
the Road Map Project to improve education
outcomes in our communities.
SOUTH SEATTLE
RENTON SCHOOL DISTRICT
TUKWILA SCHOOL DISTRICT
KENT SCHOOL DISTRICT
AUBURN SCHOOL DISTRICT
FEDERAL WAY PUBLIC SCHOOLS
HIGHLINE PUBLIC SCHOOLS
< 50%
50% - 60%
60% - 70%
70% - 80%
80% - 90%
> 90%
This map shows the concentration of high-poverty K-12 schools in King County. The dot size represents size of enrollment in each school. The color of the dot represents the proportion of students who qualify for free or reduced price lunch (FRPL).
Source: Office of Superintendent of Public Instruction (OSPI) Report Card, 2015-16.
STUDENTS WHO
QUALIFY FOR FRPL
WHAT IS THE ROAD MAP PROJECT?
INTRODUCTION
2016 RESULTS REPORT The Road Map Project4

WHAT IS THE RESULTS REPORT?
While the Results Report is a snapshot of the Road Map region’s progress, the online data
dashboard provides even more information at the school, district and regional level. This
interactive tool allows a deeper dive for additional insights into data presented in this report,
as well as a look at how outcomes and demographics have shifted by race/ethnicity, income,
housing status, gender, language and ability status since 2010.
GET MORE DATA
roadmapproject.org/dashboard
EXPLORE THE DASHBOARD AT:
The Results Report is the Road Map Project’s annual
report card. It presents the most recent data on
the Indicators of Student Success, which are critical
student achievement milestones. Where possible,
the report shows trends and results relative to
baselines. The Results Report is organized by the
Road Map Project’s cradle through college and
career framework: Healthy & Ready for Kindergarten;
Supported & Successful in School; Graduate from
High School College & Career Ready; and Earn a
College Degree or Career Credential. The report
shares both regional results and disaggregated data
to better illustrate our challenges and progress.
2016 RESULTS REPORT The Road Map Project5

The Road Map Project focuses on South
Seattle and South King County, the county’s
areas of greatest need. The region’s
communities are increasingly diverse;
more than two-thirds of the K-12 population
is made up of students of color, and more
than 180 languages are spoken in the region.
Across the project’s seven school districts,
20% of students are English language
learners (ELLs).
The region’s economy is booming but not
everyone is benefitting. Homelessness is
skyrocketing, affordable housing is scarce
and income inequality is continuing to grow.
The phenomenon of suburban poverty, or
low-income families being driven out of cities
into nearby suburbs, is continuing to spread
and many South King County schools are
facing even higher levels of concentrated
poverty. While the region has seen a 7%
student population increase since the start
of the project, homelessness among its
students has gone up by a staggering 124%.
ROAD MAP PROJECT REGION
Auburn13%
Federal Way18%
Highline15%Kent
22%
Renton12%
South Seattle16%
Tukwila2%
American Indian or Alaskan Native
1%
Asian17%
Black15%
Hispanic25%
Pacific Islander
3%
Two or More Races
9%
White30%
ROAD MAP REGION K-12 STUDENTS
BY DISTRICT BY RACE/ETHNICITY
SOURCES: Office of Superintendent of Public Instruction Report Card; Office of Superintendent of Public Instruction student-level database, 2015-16.
NOTE: Totals may not add up to 100% due to rounding.
70%56% 20%
124,948K-12 STUDENTS IN ROAD MAP REGION SCHOOLS
70,528 LOW-INCOME STUDENTS
87,857STUDENTS OF COLOR
25,575 ENGLISH LANGUAGE
LEARNERS
2016 RESULTS REPORT The Road Map Project6

Our region has a “leaky pipeline”—we’re
losing too many students between 9th grade
and the completion of a college degree or
career credential. Earning a college degree or
career credential is an increasingly important
step toward achieving career and economic
success. The region’s knowledge-intensive
economy provides high-paying jobs, but
most of the students growing up here
are not being prepared to access those
opportunities.
National Student Clearinghouse; Office of Superintendent of Public Instruction student-level database data provided by Washington State Education Research & Data Center and prepared by CCER.
THE PATH TO POSTSECONDARY SUCCESS: A LEAKY PIPELINE
NOTE
This infographic is created using one cohort of 9th grade students tracked consistently through six years after expected high school graduation year (or 10 years after 9th grade, through academic year 2015-16). By tracking one consistent group of students over time, differences by race/ethnicity and other demographic factors can be explored. College enrollment is defined as ever having an enrollment record in the NSC database through 2016. College persistence is defined as enrollment in college for any two consecutive years. College completion is defined as any two- or four-year degree.
52%66% 31%9TH GRADERSIn 2007(Expected Class of 2010)
COLLEGE ENROLLMENT(Ever Enrolled in College)
COLLEGE PERSISTENCE(Ever Persisted to Second
Year of College)
COLLEGE COMPLETIONBy 2016
(Students in Their Mid-20s)
SOURCES
2016 RESULTS REPORT The Road Map Project7

INCREMENTAL GAINS AND PERSISTENT GAPS
RACE/ETHNICITY OPPORTUNITY GAP
CURR
ENT
RATE
CURR
ENT
RATE
46% 46%
49%
BASE
LIN
E RA
TE
PRIO
R YE
AR R
ATE
37%
41% 42%
BASE
LIN
E RA
TE
PRIO
R YE
AR R
ATE
CURR
ENT
RATE
49% 50%50%
BASE
LIN
E RA
TE
PRIO
R YE
AR R
ATE
CURR
ENT
RATE
45%
54%56%
BASE
LIN
E RA
TE
PRIO
R YE
AR R
ATE
CURR
ENT
RATE
51% 51%52%
BASE
LIN
E RA
TE
PRIO
R YE
AR R
ATE
CURR
ENT
RATE
46% 46%46%
BASE
LIN
E RA
TE
PRIO
R YE
AR R
ATE
CURR
ENT
RATE
56%53%
62%
BASE
LIN
E RA
TE
PRIO
R YE
AR R
ATE
KINDERGARTEN READINESS (WAKIDS)
3RD GRADE READING
4TH GRADE MATH
5TH GRADE SCIENCE
6TH GRADE READING
7TH GRADEMATH
8TH GRADESCIENCE
K-12 ACADEMIC PROFICIENCY
REGIONAL PROGRESS REPORT
The Road Map Project Progress Report
is a high-level view of how the region is
supporting our students and youth across
the education continuum. Overall, there is
promising progress across most Indicators
of Student Success. However, there are
persistent gaps by race/ethnicity and income
that must be addressed. Institutionalized
racism and antiquated systems and policies
have real impacts on student success.
Transformational change will only occur
if the focus remains on removing barriers
and increasing access to opportunity. In
future reports, the Road Map Project will
highlight and track system-level indicators
in addition to these Indicators of Student
Success. Additionally, the Road Map Project
targets will be updated in 2017 to align with
updates from the 2016 Strategic Planning
Process (see page 32).
100%
50%
0%
Source: The BERC Group; National Student Clearinghouse (NSC); National Student Clearinghouse (NSC) via ERDC; OSPI CEDARS student-level data via ERDC; OSPI Report Card Data Files; U.S. Department of Education: Federal Student Aid Office; Washington State Achievement Council.
Note: The population of College Bound Scholarship students has more than doubled since the baseline year of this report. Data for high school graduates who submitted the FAFSA is available at the school-level from the U.S. Department of Education; disaggregation by race/ethnicity is not possible for this indicator.
28% 24%
33%
19% 20%
30% 36%
63%
70% 72% 68% 68%
77%
51%
72%
BLACK/AFRICAN AMERICAN
AMERICAN INDIAN/ALASKAN NATIVE
HISPANIC/LATINO OF ANY RACE(S)
NATIVE HAWAIIAN/OTHER PACIFIC ISLANDER
WHITE
ASIAN
TWO OR MORE RACES
2016 RESULTS REPORT The Road Map Project8

10% 10%10% 13%14%14%
23% 25%
27%
ELEMENTARY SCHOOL STUDENTS
WHO WERE ABSENT 20 OR
MORE FULL DAYS
MIDDLE SCHOOL STUDENTS WHO WERE ABSENT 20 OR MORE FULL
DAYS
HIGH SCHOOL STUDENTS WHO WERE ABSENT 20 OR MORE FULL
DAYS
ABSENCES & DISCIPLINE
23% 26%
48%
6% 7%
16%
100%
50%
0%
BLACK/AFRICAN AMERICAN
AMERICAN INDIAN/ALASKAN NATIVE
HISPANIC/LATINO OF ANY RACE(S)
NATIVE HAWAIIAN/OTHER PACIFIC ISLANDER
WHITE
ASIAN
TWO OR MORE RACES
CURR
ENT
RATE
CURR
ENT
RATE
33%38%
44%
BASE
LIN
E RA
TE
PRIO
R YE
AR R
ATE
70% 70%76%
BASE
LIN
E RA
TE
PRIO
R YE
AR R
ATE
CURR
ENT
RATE
52%
58%59%
BASE
LIN
E RA
TE
PRIO
R YE
AR R
ATE
CURR
ENT
RATE
72%77%
BASE
LIN
E RA
TE
PRIO
R YE
AR R
ATE
CURR
ENT
RATE
76%
81%83%
BASE
LIN
E RA
TE
PRIO
R YE
AR R
ATE
CURR
ENT
RATE
85%
68%75%
BASE
LIN
E RA
TE
PRIO
R YE
AR R
ATE
66% 65%69%
STUDENTS TAKING A COLLEGE-LEVEL COURSE BEFORE
GRADUATING
HIGH SCHOOL GRADUATES WHO
COMPLETED A FORMAL CAREER AND TECHNICAL
EDUCATION PROGRAM OF
STUDY
HIGH SCHOOL GRADUATES
MEETING MINIMUM
REQUIREMENTS TO APPLY TO A WASHINGTON
FOUR-YEAR COLLEGE
STUDENTS WHO GRADUATE HIGH SCHOOL WITHIN
4 YEARS (ON-TIME GRADUATION
RATE)
STUDENTS WHO GRADUATE HIGH
SCHOOL WITHIN 5 YEARS (EXTENDED
GRADUATION RATE)
COLLEGE BOUND SCHOLARSHIP HIGH SCHOOL
GRADUATES WHO SUBMITTED THE
FAFSA
HIGH SCHOOL GRADUATES WHO SUBMITTED THE
FAFSA
78%
CURR
ENT
RATE
BASE
LIN
E RA
TE
PRIO
R YE
AR R
ATE
COURSETAKING & HIGH SCHOOL GRADUATION
CURR
ENT
RATE
33% 29%
26%
BASE
LIN
E RA
TE
PRIO
R YE
AR R
ATE
15%
7% 6%
9TH GRADERS WITH AT LEAST ONE
COURSE FAILURE AND ABSENT 6 OR
MORE DAYS
9TH GRADERS WHO WERE
EXPELLED OR SUSPENDED
CURR
ENT
RATE
N/A
49%
14% 10%
2%
59%
70% 65% 65%
37%
49%
84%
70%
85% 90%
85%
48%
2016 RESULTS REPORT The Road Map Project9

60% 60%62%
CURR
ENT
RATE
51% 52%51%BA
SELI
NE
RATE
PRIO
R YE
AR R
ATE
CURR
ENT
RATE
32%39%40%
BASE
LIN
E RA
TE
PRIO
R YE
AR R
ATE
67% 67% 66%
HIGH SCHOOL GRADUATES WHO DIRECTLY ENROLL
IN COLLEGE
HIGH SCHOOL GRADUATES WHO EARN A COLLEGE
DEGREE OR CREDENTIAL
STUDENTS FROM A 9TH GRADE COHORT WHO
EVER ENROLL IN COLLEGE
HIGH SCHOOL GRADUATES
WHO PERSIST TO A SECOND YEAR
OF COLLEGE
STUDENTS FROM A 9TH GRADE COHORT WHO EVER PERSIST TO A SECOND YEAR
OF COLLEGE
STUDENTS FROM A 9TH GRADE COHORT WHO
EARN A COLLEGE DEGREE OR
CREDENTIAL BY AGE 24
CURR
ENT
RATE
53% 53%52%
BASE
LIN
E RA
TE
PRIO
R YE
AR R
ATE
CURR
ENT
RATE
24%29%
31%
BASE
LIN
E RA
TE
PRIO
R YE
AR R
ATE
COLLEGE ENROLLMENT & SUCCESS
CURR
ENT
RATE
BASE
LIN
E RA
TE
PRIO
R YE
AR R
ATE
CURR
ENT
RATE
BASE
LIN
E RA
TE
PRIO
R YE
AR R
ATE
43%
29%
16%
46%
29% 25%
74%
67%
74%
63%
40%
49%
10% 10%10%
100%
50%
0%
BLACK/AFRICAN AMERICAN
AMERICAN INDIAN/ALASKAN NATIVE
HISPANIC/LATINO OF ANY RACE(S)
NATIVE HAWAIIAN/OTHER PACIFIC ISLANDER
WHITE
ASIAN
TWO OR MORE RACES
2016 RESULTS REPORT The Road Map Project10

IMPROVING RACE AND ETHNICITY REPORTINGRacial and ethnic inequity persists in our
education system. As a result, there are large
differences in student outcomes by race and
ethnicity. Community feedback after last year’s
Results Report led CCER—with input from
the Road Map Project’s Data Advisors Group,
community members and many others—
to change how racial opportunity gaps are
measured. Instead of relying on an oversimplified
approach that compares the two groups with
highest outcomes against all others, the racial
opportunity gap this year is defined as the range
in outcomes by race and ethnicity.
While the seven federal government race and
ethnicity categories used throughout the report
are helpful in identifying inequities, they are
insufficient to capture the wide spectrum of
identities and miss the true opportunity gaps
that exist for many communities.
To improve our ability to serve our diverse
communities, CCER has requested and has
begun to receive student sub-race and sub-
ethnicity data. CCER is testing various methods
for reporting this detailed information, and
continues to work with partners to refine these
methods for future analyses and community
tools.
Sub-race and sub-ethnicity data are critical, yet
as of publication of this report, Washington only
collects this data for American Indian/Alaska
Native, Asian, Hispanic/Latino of any race(s), and
Native Hawaiian/other Pacific Islander students.
As a result, many of the region’s ethnic groups
are left off of school district enrollment forms.
There is no sub-ethnicity data for students who
are black/African American, two or more races,
or white. This means Somali and Ethiopian
communities, for example, are invisible in state
data making a regional sub-race opportunity
gap impossible to track. Under Washington
State House Bill #1541, the state will require
districts to include sub-race and sub-ethnicity
categories for all groups on enrollment forms
starting in the 2017-18 school year.
Educational Opportunity Gap Oversight and Accountability Committee k12.wa.us/Workgroups/EOGOAC.aspx
Washington State Race and Ethnicity Student Data Task Force k12.wa.us/Workgroups/RET.aspx
Washington State House Bill #1541 app.leg.wa.gov/billinfo
“The Hidden Academic Opportunity Gaps Among Asian Americans and Pacific Islanders: What Disaggregated Data Reveals in Washington State” By the National Commission on Asian American and Pacific Islander Research in Education care.igeucla.org/wp-content/uploads/2015/09/iCount-Report_The-Hidden-Academic-Opportunity-Gaps_2015.pdf
WHAT IS HAPPENING
AT THE STATE LEVEL?
2016 RESULTS REPORT The Road Map Project11

Working towards better disaggregation, the
CCER data team is engaging with community
members, youth and families to learn how data
disaggregation matters to them. Grounded
in community questions, listening sessions
were held around the region with youth and
families of African descent. Participants
agreed that one category is not enough to
capture plural identities and diverse cultures.
There is no singular measure showing
what students, families and communities
experience in the region’s schools. Yet,
through community-centered questions,
improved data quality, access and advocacy,
Road Map Project partners will continue to
refine tools and approaches to support the
region’s youth.
COLLABORATIVE COMMUNITY RESEARCH
“We need to stop grouping all
the black races into one choice
because that diminishes our voice.”
- African American Male, 17-years-old, Foster High School, Tukwila Listening Session
Young women and men, from Refugee Women’s Alliance and Kent School District’s Men on the Move, respectively, share their thoughts on sub-race disaggregation, black identity, sense of belonging and supports in school during winter 2016 listening sessions.
2016 RESULTS REPORT The Road Map Project12

High-quality early learning opportunities
support healthy development for children.
Early learning opportunities may include
home-visiting programs or early intervention
services to address developmental delays.
Making sure these opportunities fit the
unique needs of each family also provides
critical supports for new parents when
they may need them the most. Thanks to
increased investments at the state and local
level, more families are able to access early
learning programs to set their children up
for long-term success.
BUILDING A SYSTEM OF HIGH-QUALITY EARLY LEARNING
PERCENT OF LOW-INCOME CHILDREN ENROLLED IN FORMAL EARLY LEARNING PROGRAMS
Families living in poverty with three- and four-year-old children are eligible to participate in formal early learning programs, including those administered by the City of Seattle, Washington or the federal Head Start preschool program. Although the number of slots in these programs has increased this year, the number of families in need is outpacing that growth. Families in South King County communities are particularly in need of additional slots to support families and set our youngest learners up for success.
Early Achievers is Washington’s early learning quality rating and improvement system, a process that ensures a high-quality early learning experience. Since it began in 2012, the number of childcare providers receiving a license has gone up, and more providers have signed up to participate in the system. Participating providers receive coaching and resources to improve their quality of care and are rated on a variety of criteria relating to their personnel, environment and the support they provide. An increasing number of providers in the Road Map region are signing up to participate in Early Achievers each year. Additionally, more are completing the rating process and earning a quality rating—promising signs of a growing quality early learning system.
Source: Enrollment numbers, defined as the number of classroom slots, are provided by the Washington State Department of Early Learning and the City of Seattle (Step Ahead). Population estimates are from the Washington State Office of Financial Management, Forecasting Division, single year intercensal estimates 2001-2015, June, 2015. Prepared by Public Health - Seattle & King County, Assessment, Policy Development & Evaluation Unit, 10/26/2016. Low-income status is from OSPI Report Card and CCER’s student-level database.
Notes: Rates are estimated based on the number of classroom slots in the region’s formal early learning programs and student demographic information. Programs include Early Childhood Education and Assistance Program (ECEAP), Head Start and Seattle Step Ahead. South King County is defined here as the Road Map region districts excluding Seattle. South Seattle is defined by the census tract definition.
Source: Washington State Department of Early Learning Licensed Child Care Provider and Early Childhood Education and Assistance Program sites data sets, published 11/1/2016.
Note: Childcare center and in-home providers in the Road Map region included. Childcare providers are rated on a scale of 1 to 5, with ratings of 3 to 5 considered a quality rating. Data reflect the totals at the end of year.
CHILDCARE PROVIDER PARTICIPATION IN EARLY ACHIEVERS
LICENSED CHILDCARE PROVIDERS
LICENSED CHILDCARE PROVIDERS
PARTICIPATING IN EARLY ACHIEVERS
CHILDCARE PROVIDERS THAT
WERE RATED
CHILDCARE PROVIDERS THAT
RECEIVED A QUALITY RATING
ROAD MAP REGION
SOUTH KING COUNTY (EXCLUDING
SEATTLE)
SOUTH SEATTLE ONLY
SEATTLE
22%
18%
37%
42%
25%
20%
43%
48%
0%
10%
20%
30%
40%
50%
60%
70%
80%
90%
100%
ROAD MAP REGION SOUTH KING COUNTY (EXCLUDING SEATTLE)
SOUTH SEATTLE ONLY* (CENSUS TRACT
DEFINITION)
SEATTLE
2014- 2015 2015- 2016
22%
18%
37%
42%
25%
20%
43%
48%
0%
10%
20%
30%
40%
50%
60%
70%
80%
90%
100%
ROAD MAP REGION SOUTH KING COUNTY (EXCLUDING SEATTLE)
SOUTH SEATTLE ONLY* (CENSUS TRACT
DEFINITION)
SEATTLE
2014- 2015 2015- 2016
965
422
103
77
976
759
154
115
LICENSED CHILDCARE PROVIDERS
LICENSED CHILDCARE PROVIDERS
PARTICIPATING IN EARLY ACHIEVERS
CHILDCARE PROVIDERS THAT
WERE RATED
CHILDCARE PROVIDERS THAT
RECEIVED A QUALITY RATING
2015 2016
HEALTHY & READY FOR KINDERGARTEN
HEALTHY & READY FOR KINDERGARTEN The Road Map Project13

AN IMPORTANT MILESTONE: KINDERGARTEN TRANSITION
Starting kindergarten can be an exciting but unsettling time for children and families, but the earlier they can get to know their new school community, the more successful the transition will be. The seven Road Map region districts in 2014 agreed to the same registration start date to make it easier for parents to know when and where to register their children for kindergarten.
They chose the Tuesday after Martin Luther King, Jr. Day in January as the start of KRegNow, the regional campaign for kindergarten registration. Campaign materials are translated into 13 languages and are available at www.kregnow.org. Registering early helps families prepare for school by connecting them ahead of time to information about transportation, before/after school care or other needed supports. Early registration also provides information on a child’s needs for school staff and teachers, so they are prepared to teach and support all students when school starts.
A supportive, successful kindergarten transition includes numerous positive engagements with the school, starting with registration early in the calendar year, continuing in the summer with programming that develops school readiness skills, and culminates in positive connections with families during the first few weeks of school. The Washington Kindergarten Inventory of Developing Skills (WaKIDS) is the statewide kindergarten transition process made up of three components that help ensure a successful transition:
• Family connections: meetings between kindergarten teachers and families at the beginning of the school year
• Early learning collaboration: year-long collaboration between early learning and kindergarten teachers
• Whole-child assessment: teachers gaining more information about children’s skills at the beginning of the school year
The whole-child assessment includes an observational assessment of skills across six developmental domains. The region’s WaKIDS data show unacceptable gaps by race, income and language begin before kindergarten.
STUDENTS IN KINDERGARTEN MEETING READINESS STANDARDSBY INCOME, 2015-16
Source: OSPI WaKIDS
ALL SIX DOMAINS
MET
LITERACY PHYSICAL SOCIAL EMOTIONAL
COGNITIVE LANGUAGE MATH
kregnow.org
35%
78%
72%
71%
71%
72%
53%
54%
90%
78%
79%
83%
84%
74%
0
0.1
0.2
0.3
0.4
0.5
0.6
0.7
0.8
0.9
1
LowIncome NonLowIncome
35%
78%
72%
71%
71%
72%
53%
54%
90%
78%
79%
83%
84%
74%
0%
10%
20%
30%
40%
50%
60%
70%
80%
90%
100%
LowIncome NonLowIncome
HEALTHY & READY FOR KINDERGARTEN The Road Map Project14

Students’ success in school depends on the
support they receive at home, before and after
school, and during the summer, in addition to
in the classroom. Student success is impacted
by many things, including how children and
youth feel about themselves and how adults
in their life treat them. Students need support
in developing a positive perception of their
identities and confidence in their future success,
as well as adults providing relevant curriculum
English language learner (ELL) students and their
families bring rich cultural and linguistic diversity to
our school system and community. This is especially
true in South King County, where in some classrooms
over half of the students are ELLs and more than 160
languages are spoken. ELL students, most of whom are
immigrants and refugees or children of immigrants,
typically enter the school system learning their home
language and English simultaneously. Research has
shown that while making progress in learning English is
critically important, the success of ELL students is also
tied to developing a strong foundation in their primary
or home language and having a positive identity and
strong connections to their heritage and culture.
SUPPORTING ELL STUDENTS2016 ENGLISH LANGUAGE LEARNERS BY GRADE
and ensuring a sense of belonging within
the school community. Elevating effective
practices to support English language learners,
eliminate disproportionality in discipline,
alleviate chronic absenteeism, meaningfully
engage with families, and increase attention
on social emotional learning are all whole-
day, whole-child strategies that together can
narrow the opportunity gap and increase
student success.
Source: OSPI CEDARS student-level data via ERDC.
Note: This indicator shows the percent of all students at each grade level who are English language learners, as defined by participation in the State Transitional Bilingual Instructional Program.
38% 38% 33% 29% 26%
21% 17% 13% 12% 11% 11% 9% 9%
0
0.1
0.2
0.3
0.4
0.5
0.6
0.7
0.8
0.9
1
K 1st 2nd 3rd 4th 5th 6th 7th 8th 9th 10th 11th 12th
SUPPORTED & SUCCESSFUL IN SCHOOL
SUPPORTED & SUCCESSFUL IN SCHOOL The Road Map Project15

Embracing immigrant and refugee students and their families’ culture, language and diversity as assets has made South King County a leader in standing up for these student populations and ensuring the education system reflects the rich strengths of the region. Beginning this year, the Road Map Project will measure and report system-level indicators, such as the number of World Language Competency Credits awarded, the number of Seal of Biliteracy awards and the growth of dual-language programs within the region.
2016 DUAL LANGUAGE PROGRAMS IN THE ROAD MAP REGION
The Home Language Campaign is an effort led by OneAmerica and the Road Map Project’s ELL Work Group to acknowledge and celebrate the home languages of the region’s students. The campaign has contributed to a shift in how the academic progress of ELL students is measured. Typically ELLs have been assessed only by their progress in learning English, but now more reflective indicators are being used to also measure growth in students’ home language skills and core content areas.
The campaign also emphasizes that central to supporting ELL students are dual-language programs, in which students learn core academic content in English and another target language with the goal of becoming fully bilingual and biliterate. In 2015, Washington invested funding to expand dual-language programming.
PROMOTING BILINGUALISM AND POSITIVE IDENTITY THROUGH THE HOME LANGUAGE CAMPAIGN
Seattle Public Schools
Highline Public Schools
Kent School District
Federal Way Public Schools
The Home Language Parent Ambassadors are a multi-ethnic group of parents who were trained in the key messages of the Home Language Campaign to take back to their communities and schools. They also advocate for district policies that support and reinforce the importance of bilingualism in our education systems.
14DUAL LANGUAGE PROGRAMS OFFERED IN 4 DISTRICTS
6PROGRAMS
5PROGRAMS
2PROGRAMS
• Children have the unique ability to learn many languages at the same time.
• In high school, students can earn credits and the Seal of Biliteracy for knowledge of two languages.
• A young person that graduates speaking two or more languages can access more job opportunities.
speakyourlanguage.weareoneamerica.org
KEY HOME LANGUAGE CAMPAIGN MESSAGES:
Source: http://www.k12.wa.us/WorldLanguages/DualImmersion.aspx
1PROGRAM
SUPPORTED & SUCCESSFUL IN SCHOOL The Road Map Project16
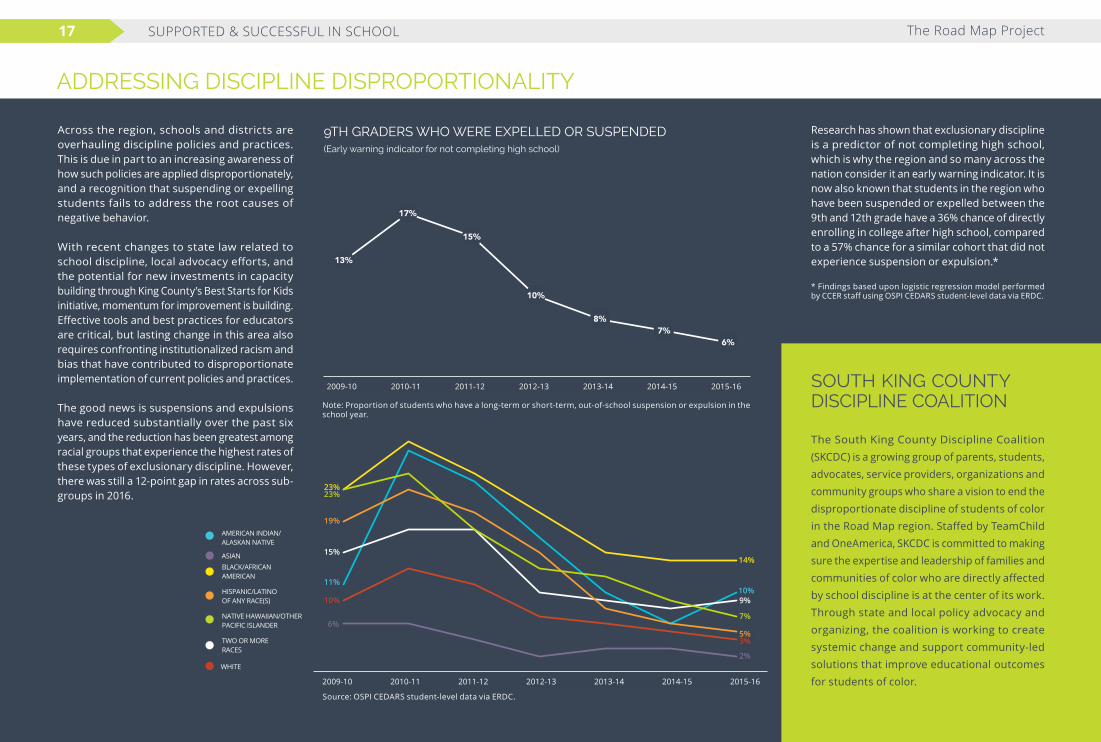
ADDRESSING DISCIPLINE DISPROPORTIONALITY
Research has shown that exclusionary discipline is a predictor of not completing high school, which is why the region and so many across the nation consider it an early warning indicator. It is now also known that students in the region who have been suspended or expelled between the 9th and 12th grade have a 36% chance of directly enrolling in college after high school, compared to a 57% chance for a similar cohort that did not experience suspension or expulsion.*
* Findings based upon logistic regression model performed by CCER staff using OSPI CEDARS student-level data via ERDC.
Across the region, schools and districts are overhauling discipline policies and practices. This is due in part to an increasing awareness of how such policies are applied disproportionately, and a recognition that suspending or expelling students fails to address the root causes of negative behavior.
With recent changes to state law related to school discipline, local advocacy efforts, and the potential for new investments in capacity building through King County’s Best Starts for Kids initiative, momentum for improvement is building. Effective tools and best practices for educators are critical, but lasting change in this area also requires confronting institutionalized racism and bias that have contributed to disproportionate implementation of current policies and practices.
The good news is suspensions and expulsions have reduced substantially over the past six years, and the reduction has been greatest among racial groups that experience the highest rates of these types of exclusionary discipline. However, there was still a 12-point gap in rates across sub-groups in 2016.
The South King County Discipline Coalition (SKCDC) is a growing group of parents, students, advocates, service providers, organizations and community groups who share a vision to end the disproportionate discipline of students of color in the Road Map region. Staffed by TeamChild and OneAmerica, SKCDC is committed to making sure the expertise and leadership of families and communities of color who are directly affected by school discipline is at the center of its work. Through state and local policy advocacy and organizing, the coalition is working to create systemic change and support community-led solutions that improve educational outcomes for students of color.
BLACK/AFRICAN AMERICAN
AMERICAN INDIAN/ALASKAN NATIVE
HISPANIC/LATINO OF ANY RACE(S)
NATIVE HAWAIIAN/OTHER PACIFIC ISLANDER
WHITE
ASIAN
TWO OR MORE RACES
9TH GRADERS WHO WERE EXPELLED OR SUSPENDED(Early warning indicator for not completing high school)
Note: Proportion of students who have a long-term or short-term, out-of-school suspension or expulsion in the school year.
SOUTH KING COUNTY DISCIPLINE COALITION
2009-10 2010-11 2011-12 2012-13 2013-14 2014-15 2015-16
2009-10 2010-11 2011-12 2012-13 2013-14 2014-15 2015-16
23%
19%
15%
11%
10%
6%
14%
7%
5%
9%10%
3%
2%
Source: OSPI CEDARS student-level data via ERDC.
13%
17%
15%
10%
8% 7%
6%
2009-10 2010-11 2011-12 2012-13 2013-14 2014-15 2015-16
2009-2010 2010-2011 2011-2012 2012-2013 2013-2014 2014-2015 2015-2016
23%
SUPPORTED & SUCCESSFUL IN SCHOOL The Road Map Project17

Social emotional learning (SEL) is defined as the process through which people build awareness and skills in managing emotions, setting goals, establishing relationships and making responsible decisions, leading to success in school and in life. This definition grounds the 2016 report by the Social Emotional Learning Benchmarks Work Group convened at the Office of Superintendent of Public Instruction in 2016 that provides a framework for Washington to amplify SEL. This framework aligns well with the Road Map Project’s
The path forward to support social emotional learning is being paved locally, statewide and nationally. With renewed interest in a focus on school climate as essential to achieving racial equity and ensuring all young people feel a sense of belonging in their schools, heightened attention to SEL is critical. Several recommendations are gaining traction:
• Adult interactions should be consistent across the environments where children spend their time. Young people should feel a sense of belonging and hear consistent messages throughout the day, inside and outside the classroom.
• Data can help; research is still emerging and questions remain about how to best measure SEL and whether to focus data collection on children or the adults who work with them. That said, most Road Map districts now use a student perception survey to measure school climate as well as specific SEL skills. Though there are limitations to this data, it can provide useful information for practitioners.
• Explicit instruction is important, but training school and other staff to teach young people SEL skills is only one part of the solution. SEL supports must be integrated throughout the day, inside and outside the classroom.
SOCIAL EMOTIONAL LEARNINGBOOSTING SOCIAL EMOTIONAL
LEARNING BY CHANGING
ADULT BEHAVIOR
All middle and high school students in the Highline School District take the Gear Up Student Motivation Survey annually, and the results are used to inform a range of college readiness strategies. A specific group of 1,000 students who worked with Success Coaches during the 2015-16 school year took a pre- and post-survey so
USING STUDENT MOTIVATION DATA TO IMPROVE INTERVENTIONS
STUDENT SURVEY RESPONSES BEFORE & AFTER WORKING WITH SUCCESS COACHES, 2015-16
that the district could assess the impact of that intervention. Success Coaches are predominantly bilingual young adults of color from the region who mentor students most at risk of not graduating. They serve as enthusiastic advocates who motivate and provide a host of individualized and group supports.
Students’ survey responses related to motivation, postsecondary plans, and relevance of learning increased after working with coaches (see below), and evaluators found a positive relationship between hours spent with Success Coaches and a number of important academic indicators such as attendance and course failure.
Youth Development for Education Results Work Group, staffed by Youth Development Executives of King County (YDEKC), that has been elevating motivation, engagement and SEL practices in the school day and in out-of-school settings. See the right sidebar for recommendations coming out of the work group to further SEL practices in the region.
How likely is it that you can motivate yourself to do unpleasant tasks if they will help you to accomplish your goals? (High school students responding “Likely”)
Participating in college and career activities at this school helped me decide to go to college after high school. (Middle school students responding “Agree”)
What I learn in class helps me outside of school. (Middle school students responding “Agree”)
Source: Highline Public Schools Gear Up Student Motivation Survey, 2015-16.
77%
70%
79%
69%
53%
46%
POST
PRE
POST
PRE
POST
PRE
SUPPORTED & SUCCESSFUL IN SCHOOL The Road Map Project18

Authentic and inclusive family engagement is a vital strategy for advancing racial equity and improving student achievement. Building on the work from the last several years, the first-ever Road Map Project Family Engagement Institute took place in August 2016. More than 200 attendees, including parents and family members, district officials, community-based organizations and more, came together. The institute served as a kick-off to the multi-phased development of year-round, capacity-building supports for the region’s
districts and community-based organizations.
The institute brought national and local expertise to the region, and continued the practice of building equitable collaborations with parents, community-based organizations and district/school leadership. The institute was constructed in collaboration with the Institute for Educational Leadership (IEL), as well as local planning teams made up of parents, representatives from the Road Map school districts and several partner
organizations. A post-institute survey reported positive experiences and the need for more capacity-building support.
After the institute, IEL, CCER and Road Map Project partners worked directly with interested districts to assess current family engagement strategies. Guided by the district family engagement lead and with the support of their superintendent, districts are now developing plans to strengthen family engagement practices throughout their district.
FAMILY ENGAGEMENT
Participants agreed that the institute improved their knowledge of best practices in family and community engagement.
Participants agreed that the institute improved their skill set around implementing effective family and community engagement practices.
Par t i c ip an t s ag re e d they could benefit from additional training and support to improve family engagement practices.
FAMILY ENGAGEMENT INSTITUTE PARTICIPANT SURVEY RESULTS
99% 93% 95%
Source: Road Map Family Engagement Institute Post-Survey, August 2016
Note: Participants who responded with “strongly agree” and “agree” are included in the results shown above.
I want this region and my district to see the
asset that I am, and I want to be an active
part of this work at the regional level so
I can bring this back to my community.”“- Family Engagement Institute Parent Participant
SUPPORTED & SUCCESSFUL IN SCHOOL The Road Map Project19

Children and youth need engaging, high-quality
opportunities to develop social, emotional and
academic skills for school and life success. Young
people spend only about a quarter of their time in
school, leaving a lot of time in the remainder of the
day and throughout the summer to engage in active,
culturally relevant learning opportunities, also known
as expanded learning opportunities (ELOs). These
opportunities, often provided by community-based
organizations, go well beyond keeping young people
safe by developing the social skills, confidence and
thinking skills they need for success in school and
life. Disparities in access to quality expanded learning
opportunities are significant, particularly during the
summer. Low-income youth tend to lose an average of
two to three months in reading proficiency while their
higher-income peers make slight gains, according to
the National Summer Learning Association. Work is
under way in the region to build a robust and effective
expanded learning opportunity system.
EXPANDED LEARNING OPPORTUNITIES
Participants of Techbridge Girls, an expanded learning opportunity that helps girls discover their passion for technology, science and engineering.
SUPPORTED & SUCCESSFUL IN SCHOOL The Road Map Project20

Students need to be in school to learn, and strong family engagement is important to making sure students consistently attend classes. Without deep family engagement, the root causes of chronic absenteeism may go unaddressed. Chronic
CHRONIC ABSENTEEISM
King County Housing Authority (KCHA) is committed to reducing chronic absenteeism. The agency and its partners launched in 2015 a community-wide attendance awareness campaign to equip families with the tools and information to understand the negative impacts of absenteeism. Community-based organizations at 15 housing sites provide attendance-related activities and education to KCHA youth and their parents as part of afterschool programming, while KCHA distributes a variety of communications materials and tools to its residents throughout King County. In a recent survey, 71% of families reported they are using the absence tracking tool they had received in the mail.
KCHA also convenes partners to analyze data, align strategies and cultivate resources. The agency supports and participates in three school-based attendance teams in Kent and White Center. Each team is a cross-sector learning community committed to addressing the challenges of chronic absenteeism through family engagement and data-driven activities. There are some promising signs of progress:
• Pine Tree Elementary in Kent has been reducing tardies and has had success with its Beat the Bell campaign. Compared with last school year, tardies through February 2017 dropped by 20%.
• Mount View Elementary in Highline is working on reducing the number of students who are absent 18 days or more. Compared with last school year, the percent of kindergarten students chronically absent through February 2017 has declined from 39% to 15%.
ORGANIZING LOCALLY TO ADDRESS CHRONIC ABSENTEEISM
STUDENTS WHO WERE ABSENT 20 OR MORE FULL DAYS BY GRADE, 2015-16
Source: OSPI CEDARS student-level data via ERDC.
Note: K-5th graders with 20 or more full-day absences within a given academic year. For standardization, 6th grade students attending K-6 Elementary schools are included in the “middle school” grade grouping.
absenteeism affects groups of students differently across the education continuum, so strategies must be tailored to address disparities by race and ethnicity.
ELEMENTARY STUDENTS WHO WERE ABSENT 20 OR MORE FULL DAYS BY RACE
BLACK/AFRICAN AMERICAN
AMERICAN INDIAN/ALASKAN NATIVE
HISPANIC/LATINO OF ANY RACE(S)
NATIVE HAWAIIAN/ OTHER PACIFIC ISLANDER
WHITE
ASIAN
TWO OR MORE RACES
12%12%
6% 6%
10%11%
12%
19%
22%21%23%
8% 8%
2012-13 2013-14 2014-15 2015-16
15% 12%
10% 9% 8% 9% 11%
14% 17%
20%
26% 29%
33%
K 1st 2nd 3rd 4th 5th 6th 7th 8th 9th 10th 11th 12th
2012-13 2013-14 2014-15 2015-16
12%
SUPPORTED & SUCCESSFUL IN SCHOOL The Road Map Project21

Each district within the Road Map Project
is unique, but one commonality is all
share the goal of graduating college-
and-career-ready students. Research
shows five key components necessary to
improve the college and career readiness
system to prepare all students for
success beyond high school:
• Academic Foundation: Learning basic core subject content and taking rigorous courses that will prepare students to meet their college and career goals.
• Academic Behavior and Life Skills: Developing skills and strategies that will prepare students for academic success and help them persist and grow, such as time management, organization and problem solving.
• Advising System: Dedicated staff support and time for students to develop their postsecondary plans.
• Career Awareness and Exploration: Developing career readiness skills such as preparing for interviews and resume writing, and opportunities to explore career options through hands-on activities like worksite tours and internships.
• Postsecondary Awareness and Knowledge: Providing students the information and opportunities to explore their postsecondary options and navigate the many steps to enrolling, such as accessing financial aid, applying for admission and successfully transitioning.
GRADUATE FROM HIGH SCHOOL COLLEGE & CAREER-READY
These areas are where the Road Map
Project has focused system-building
efforts, from increasing access to
rigorous high school courses for a solid
education foundation to building business
partnerships so that students can explore
careers during DiscoverU week (read more
about DiscoverU on page 29). Too often
only a portion of students have access to
experiences like these.
GRADUATE FROM HIGH SCHOOL COLLEGE & CAREER READY The Road Map Project22

High school graduation is an important life milestone and should be a launching pad to postsecondary education success. Overall, graduation rates in the Road Map region have steadily increased since the beginning of the project. In 2016, 78% percent of students graduated from high school on-time compared to
72% in 2011. Highline and Tukwila school districts have both seen dramatic increases in their graduation rates (13 and 12 percentage points, respectively) since 2011. Extended graduation, or graduation within five years, is also up slightly to 83% for the class of 2016.
ON-TIME & EXTENDED HIGH SCHOOL GRADUATION
STUDENTS WHO GRADUATE HIGH SCHOOL WITHIN 4 YEARS (ON-TIME GRADUATION RATE) BY DISTRICT
FEDERAL WAY PUBLIC SCHOOLS
KENT SCHOOL DISTRICT
TUKWILA SCHOOL DISTRICT
RENTON SCHOOL DISTRICT
SOUTH SEATTLE
AUBURN SCHOOL DISTRICT
HIGHLINE PUBLIC SCHOOLS
ROAD MAP REGION
78%
76%77%
80%
75%
Source: OSPI Report Card Data Files.
Note: Students who graduated high school within 4 years of first entering the 9th grade.
72%
78%
69%
75%
73%
63%
2010-11 2011-12 2012-13 2013-14 2014-15 2015-16
2010-11 2011-12 2012-13 2013-14 2014-15 2015-16
75%75%
75%
62%
GRADUATE FROM HIGH SCHOOL COLLEGE & CAREER READY The Road Map Project23

COURSETAKINGFor students to be prepared for college coursework, it is critical for them to have a strong academic foundation beginning in high school. Two key indicators of coursetaking strength are students taking a college-level course before graduating and students taking the minimum college admissions standards for four-year public institutions, also known as the College Academic Distribution Requirements (CADRs).
Since the beginning of the Road Map Project, steady gains have been made in the number of students taking at least one college-level course
STUDENTS TAKING A COLLEGE-LEVEL COURSE BEFORE GRADUATING (INCLUDES AP, IB, CAMBRIDGE, RUNNING START OR COLLEGE IN THE HIGH SCHOOL) BY DISTRICT
before graduation. There are many types of courses that allow students to earn college credit while in high school, known as dual credit. In the past only students who took a class through Advanced Placement (AP), International Baccalaureate (IB) or Cambridge programs were reported. Students taking these courses can earn college credit based on scores obtained in year-end examinations. For the first time this year, a more comprehensive view of college-level coursetaking is available, which includes Running Start and College in the High School programs, where students earn credits based solely on
Source: OSPI CEDARS student-level data via ERDC.
Note: High school graduates who by their 12th grade year took one or more Advanced Placement, International Baccalaureate, Running Start, College in the High School, or Cambridge courses.
FEDERAL WAY PUBLIC SCHOOLS
KENT SCHOOL DISTRICT
TUKWILA SCHOOL DISTRICT
RENTON SCHOOL DISTRICT
SOUTH SEATTLE
AUBURN SCHOOL DISTRICT
HIGHLINE PUBLIC SCHOOLS
ROAD MAP REGION
2014-15 2015-16
70%
76%
61% 59%
72%
77% 76%
87%
65%
72%
65%
75%
79%
88%
60% 59% 59%
65%
enrollment and grade in a course. These new data show opportunity gaps are narrowing for black and Latino students as more are taking rigorous courses than ever before.
Additional funding through the Race to the Top grant has supported expansion of AP and IB courses, and allowed more teachers to receive necessary training to provide these curriculums.
Despite the growth in students taking dual-credit courses, among the graduating class of
2016, only 59% of students met the minimum coursetaking eligibility requirements to apply to a four-year college. Notably, Renton School District saw a dramatic increase while most other school districts in the region remained flat or slightly decreased. For the class of 2016, 62% of Renton graduates completed the requirements compared with only 47% of the class of 2015. Racial opportunity gaps persist within both coursetaking measures; however, efforts to increase access are paying off and gaps are beginning to close slightly.
GRADUATE FROM HIGH SCHOOL COLLEGE & CAREER READY The Road Map Project24
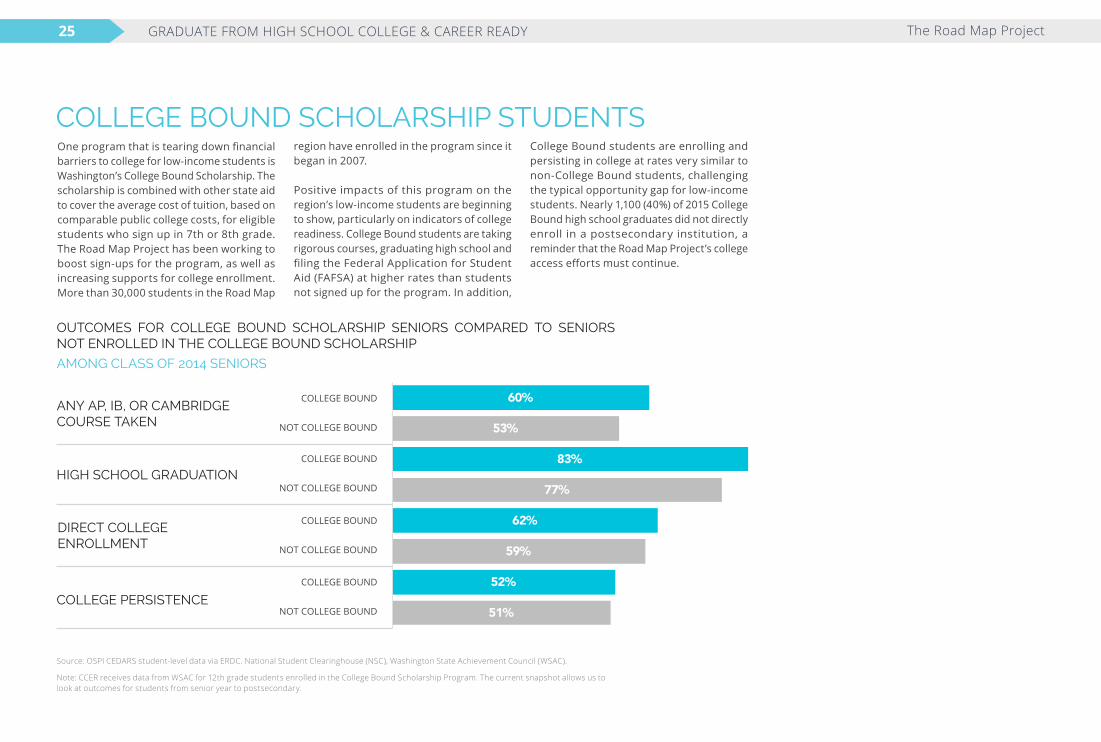
OUTCOMES FOR COLLEGE BOUND SCHOLARSHIP SENIORS COMPARED TO SENIORS NOT ENROLLED IN THE COLLEGE BOUND SCHOLARSHIP
Source: OSPI CEDARS student-level data via ERDC. National Student Clearinghouse (NSC), Washington State Achievement Council (WSAC).
Note: CCER receives data from WSAC for 12th grade students enrolled in the College Bound Scholarship Program. The current snapshot allows us to look at outcomes for students from senior year to postsecondary.
One program that is tearing down financial barriers to college for low-income students is Washington’s College Bound Scholarship. The scholarship is combined with other state aid to cover the average cost of tuition, based on comparable public college costs, for eligible students who sign up in 7th or 8th grade. The Road Map Project has been working to boost sign-ups for the program, as well as increasing supports for college enrollment. More than 30,000 students in the Road Map
COLLEGE BOUND SCHOLARSHIP STUDENTS
ANY AP, IB, OR CAMBRIDGE COURSE TAKEN
AMONG CLASS OF 2014 SENIORS
HIGH SCHOOL GRADUATION
DIRECT COLLEGE ENROLLMENT
COLLEGE PERSISTENCE
region have enrolled in the program since it began in 2007.
Positive impacts of this program on the region’s low-income students are beginning to show, particularly on indicators of college readiness. College Bound students are taking rigorous courses, graduating high school and filing the Federal Application for Student Aid (FAFSA) at higher rates than students not signed up for the program. In addition,
College Bound students are enrolling and persisting in college at rates very similar to non-College Bound students, challenging the typical opportunity gap for low-income students. Nearly 1,100 (40%) of 2015 College Bound high school graduates did not directly enroll in a postsecondary institution, a reminder that the Road Map Project’s college access efforts must continue.
COLLEGE BOUND
NOT COLLEGE BOUND
COLLEGE BOUND
NOT COLLEGE BOUND
COLLEGE BOUND
NOT COLLEGE BOUND
COLLEGE BOUND
NOT COLLEGE BOUND 51%
52%
59%
62%
77%
83%
53%
60%
NOT COL L E GE BOU ND
COL L E GE BOU ND
NOT COL L E GE BOU ND
COL L E GE BOU ND
NOT COL L E GE BOU ND
COL L E GE BOU ND
NOT COL L E GE BOU ND
COL L E GE BOU ND
GRADUATE FROM HIGH SCHOOL COLLEGE & CAREER READY The Road Map Project25
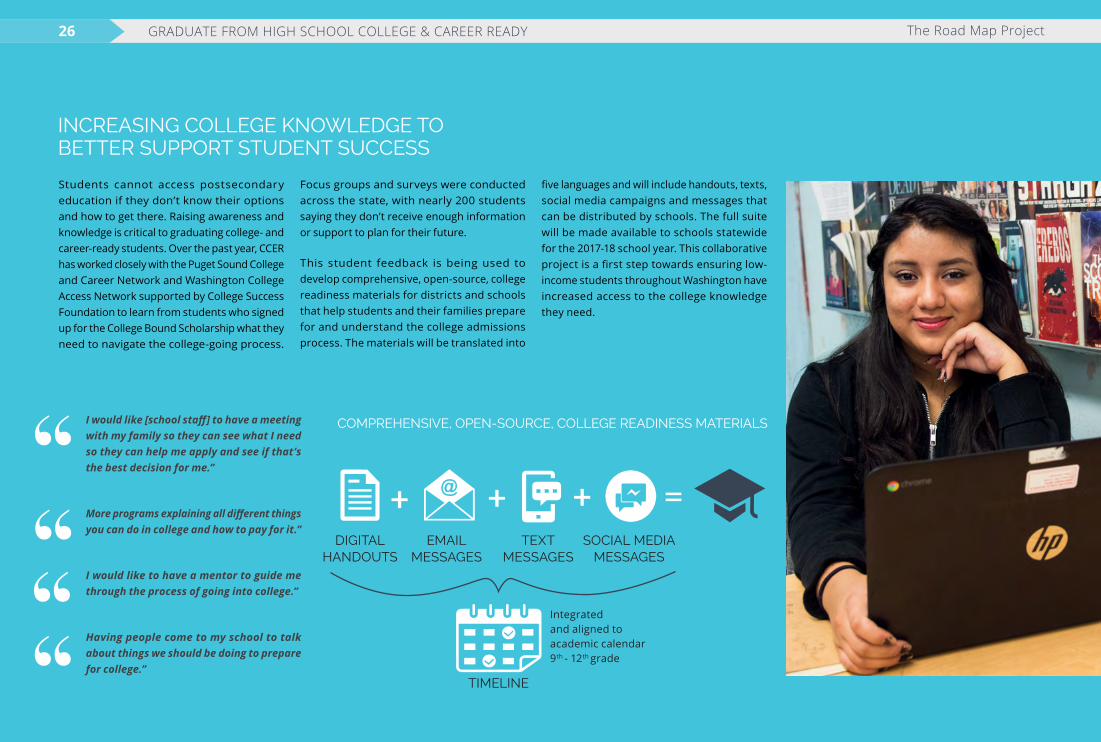
+ + + =DIGITAL
HANDOUTSEMAIL
MESSAGESTEXT
MESSAGESSOCIAL MEDIA
MESSAGES
TIMELINE
Integrated and aligned to academic calendar 9th - 12th grade
COMPREHENSIVE, OPEN-SOURCE, COLLEGE READINESS MATERIALS
Students cannot access postsecondary education if they don’t know their options and how to get there. Raising awareness and knowledge is critical to graduating college- and career-ready students. Over the past year, CCER has worked closely with the Puget Sound College and Career Network and Washington College Access Network supported by College Success Foundation to learn from students who signed up for the College Bound Scholarship what they need to navigate the college-going process.
Focus groups and surveys were conducted across the state, with nearly 200 students saying they don’t receive enough information or support to plan for their future.
This student feedback is being used to develop comprehensive, open-source, college readiness materials for districts and schools that help students and their families prepare for and understand the college admissions process. The materials will be translated into
five languages and will include handouts, texts, social media campaigns and messages that can be distributed by schools. The full suite will be made available to schools statewide for the 2017-18 school year. This collaborative project is a first step towards ensuring low-income students throughout Washington have increased access to the college knowledge they need.
INCREASING COLLEGE KNOWLEDGE TO BETTER SUPPORT STUDENT SUCCESS
I would like [school staff] to have a meeting with my family so they can see what I need so they can help me apply and see if that’s the best decision for me.”
More programs explaining all different things you can do in college and how to pay for it.”
I would like to have a mentor to guide me through the process of going into college.”
Having people come to my school to talk about things we should be doing to prepare for college.”
GRADUATE FROM HIGH SCHOOL COLLEGE & CAREER READY The Road Map Project26

FAFSA SUBMISSIONS AMONG HIGH SCHOOL GRADUATES BY YEAR
Source: Washington State Achievement Council (WSAC), U.S. Department of Education: Federal Student Aid Office, OSPI CEDARS student-level database via ERDC.
Note:. The FAFSA is considered “submitted” when a student completes the application. It is only considered complete when the application is accepted by the U.S. Department of Education. If an application is submitted and rejected, the student has the opportunity to correct the application as appropriate.
Non-College Bound high school graduates who submitted the FAFSA
College Bound high school graduates who submitted the FAFSA
The financial barrier to a college education must be dismantled to increase access for all students. The cost of a higher education can be overwhelming for students and families, but there are many different resources to help pay for college. Filing the Free Application for Federal Student Aid (FAFSA) or the Washington Application for State Financial Aid (WASFA) is an important first step to getting grants, scholarships, loans and work study. District superintendents in the Road Map Project region in 2016 prioritized financial aid application completion and school staff and community partners increased their one-on-one support for students.
As a result , more FAFSAs were f iled in the region than ever before. There was a significant increase in filing by College Bound
INCREASING ACCESS TO FINANCIAL AIDScholarship students, with nearly 300 more filing this past year. Racial opportunity gaps also decreased significantly among these scholars. Last year, 200 additional federal applications were filed by College Bound graduates who were Latino. Additionally, the WASFA allows undocumented students to receive financial aid to pursue their undergraduate degree. In 2016, a total of 325 undocumented students filed the WASFA across the seven Road Map districts.
While there has been strong progress on this front, Road Map Project work must continue to ensure students do not miss out on financial support for college. The Puget Sound College and Career Network, college access providers and school staff continue to lead the charge in helping students through the financial aid process.
2011-12 2012-13 2013-14 2014-15 2015-16
1,088 1,063 1,444
1,813 2,099
3,108 3,106 2,751
2,513 2,348
2011-12 2012-13 2013-14 2014-15 2015-16
Non-College Bound high school graduates who submitted the FAFSA
College Bound high school graduates who submitted the FAFSA
GRADUATE FROM HIGH SCHOOL COLLEGE & CAREER READY The Road Map Project27
Hispanic/Latino of any race(s)
White
Black/African American
Two or More Races
Asian
Native Hawaiian/Other Pacific Islander
American Indian/Alaskan Native
Male
Female
Boys & Men of Color
16 to 17 year-olds
18 to 19 year-olds
20+ year-olds
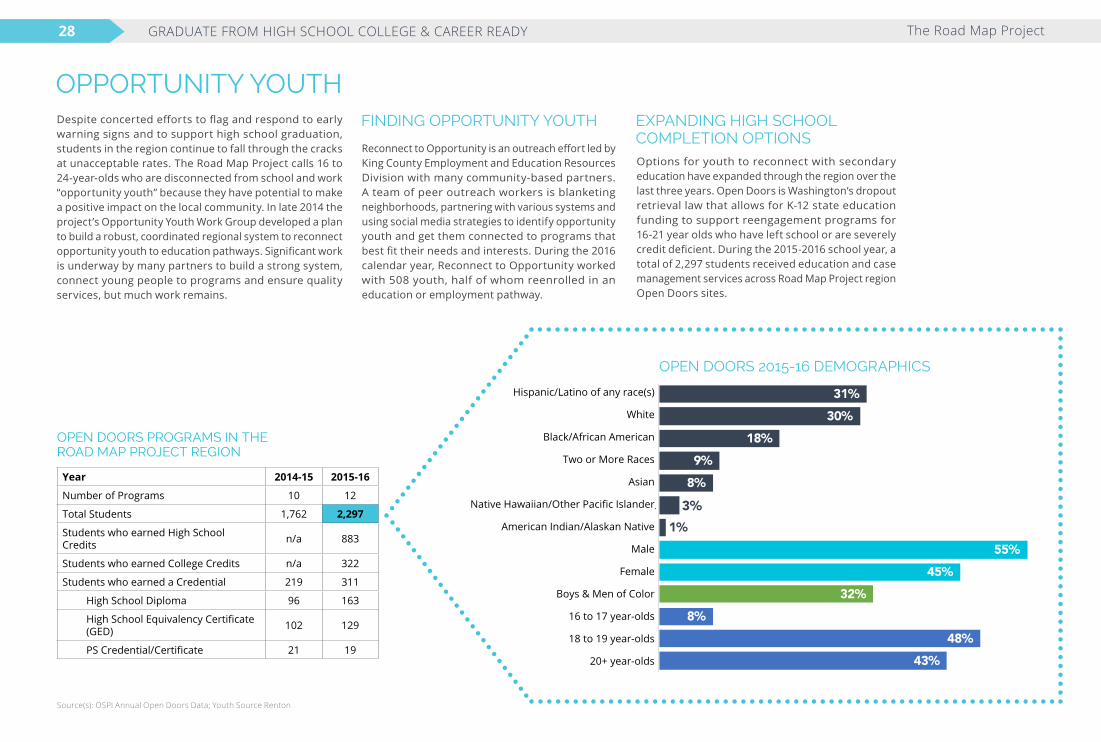
Despite concerted efforts to flag and respond to early warning signs and to support high school graduation, students in the region continue to fall through the cracks at unacceptable rates. The Road Map Project calls 16 to 24-year-olds who are disconnected from school and work “opportunity youth” because they have potential to make a positive impact on the local community. In late 2014 the project’s Opportunity Youth Work Group developed a plan to build a robust, coordinated regional system to reconnect opportunity youth to education pathways. Significant work is underway by many partners to build a strong system, connect young people to programs and ensure quality services, but much work remains.
OPPORTUNITY YOUTH
Reconnect to Opportunity is an outreach effort led by King County Employment and Education Resources Division with many community-based partners. A team of peer outreach workers is blanketing neighborhoods, partnering with various systems and using social media strategies to identify opportunity youth and get them connected to programs that best fit their needs and interests. During the 2016 calendar year, Reconnect to Opportunity worked with 508 youth, half of whom reenrolled in an education or employment pathway.
FINDING OPPORTUNITY YOUTH
43% 48%
8% 32%
45% 55%
1%
8% 9%
18% 30% 31%
20+ year-olds
18 to 19 year-olds
16 to 17 year-olds
Boys & Men of Color
Female
Male
Amerian Indian/Alaskan Native
Native Hawaiian/Other Pacific …
Asian
Two or More Races
Black/African American
White
Hispanic/Latino of any race(s)
Options for youth to reconnect with secondary education have expanded through the region over the last three years. Open Doors is Washington’s dropout retrieval law that allows for K-12 state education funding to support reengagement programs for 16-21 year olds who have left school or are severely credit deficient. During the 2015-2016 school year, a total of 2,297 students received education and case management services across Road Map Project region Open Doors sites.
EXPANDING HIGH SCHOOL COMPLETION OPTIONS
OPEN DOORS 2015-16 DEMOGRAPHICS
Source(s): OSPI Annual Open Doors Data; Youth Source Renton
Year 2014-15 2015-16
Number of Programs 10 12
Total Students 1,762 2,297
Students who earned High School Credits n/a 883
Students who earned College Credits n/a 322
Students who earned a Credential 219 311
High School Diploma 96 163
High School Equivalency Certificate (GED) 102 129
PS Credential/Certificate 21 19
3%
OPEN DOORS PROGRAMS IN THE ROAD MAP PROJECT REGION
GRADUATE FROM HIGH SCHOOL COLLEGE & CAREER READY The Road Map Project28
Completing a secondary credential or equivalency is a huge milestone for youth who have left school, but the labor market realities in the region make transition support and postsecondary training critically important. At ten Open Doors sites across the region, Seattle Education Access (SEA) provides individualized college and career transition support thanks to a federal Social Innovation Fund (SIF) grant matched by United Way of King County. SEA helps students create a career and education plan tailored to their skills and goals and provides hands-on technical support to ensure they have the knowledge and resources needed to succeed. SEA provides ongoing support until students complete their postsecondary education and successfully transition to the workforce.
As of December 2016, 197 Open Doors students were receiving individualized postsecondary navigation support through the SIF grant.
Of the nearly 200 Open Doors students receiving navigation support from SEA as of December 2016, 89 had already enrolled in postsecondary pathways ranging from apprenticeship to technical and two-year transfer programs. Of the 25 students who have been enrolled in a postsecondary program for over one year, 76% persisted to a second year of education or training.
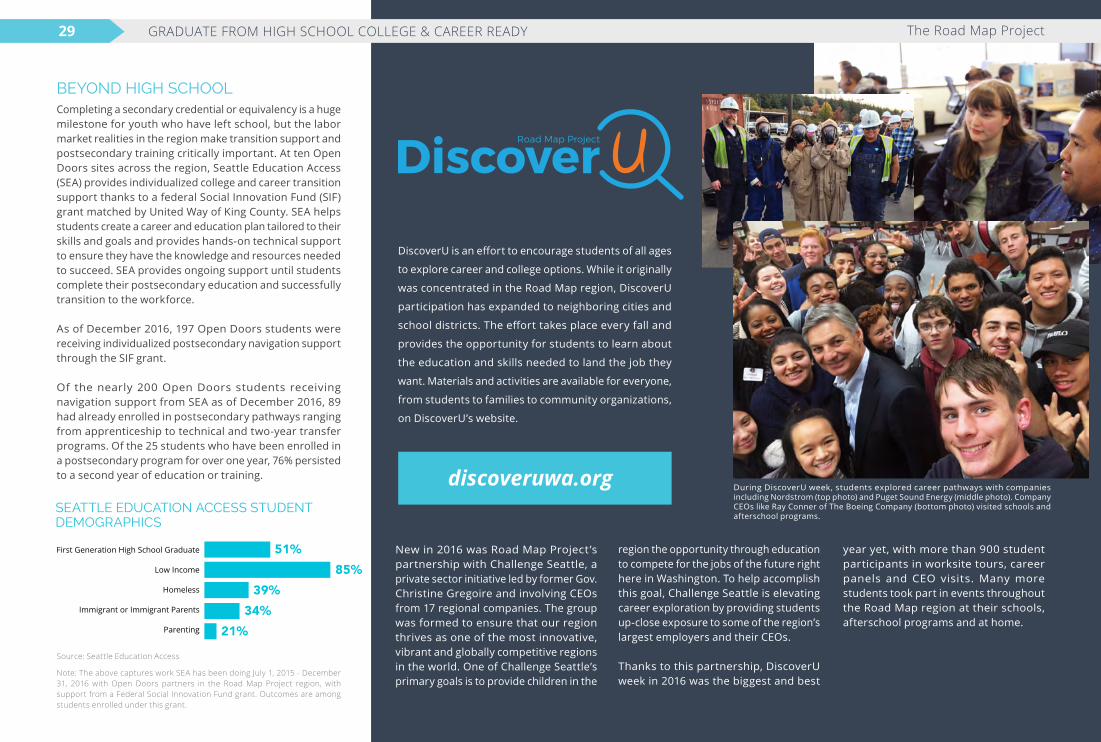
BEYOND HIGH SCHOOL
DiscoverU is an effort to encourage students of all ages
to explore career and college options. While it originally
was concentrated in the Road Map region, DiscoverU
participation has expanded to neighboring cities and
school districts. The effort takes place every fall and
provides the opportunity for students to learn about
the education and skills needed to land the job they
want. Materials and activities are available for everyone,
from students to families to community organizations,
on DiscoverU’s website.
discoveruwa.org
New in 2016 was Road Map Project’s partnership with Challenge Seattle, a private sector initiative led by former Gov. Christine Gregoire and involving CEOs from 17 regional companies. The group was formed to ensure that our region thrives as one of the most innovative, vibrant and globally competitive regions in the world. One of Challenge Seattle’s primary goals is to provide children in the
region the opportunity through education to compete for the jobs of the future right here in Washington. To help accomplish this goal, Challenge Seattle is elevating career exploration by providing students up-close exposure to some of the region’s largest employers and their CEOs.
Thanks to this partnership, DiscoverU week in 2016 was the biggest and best
year yet, with more than 900 student participants in worksite tours, career panels and CEO visits. Many more students took part in events throughout the Road Map region at their schools, afterschool programs and at home.
During DiscoverU week, students explored career pathways with companies including Nordstrom (top photo) and Puget Sound Energy (middle photo). Company CEOs like Ray Conner of The Boeing Company (bottom photo) visited schools and afterschool programs.
SEATTLE EDUCATION ACCESS STUDENT DEMOGRAPHICS
Source: Seattle Education Access
Note: The above captures work SEA has been doing July 1, 2015 - December 31, 2016 with Open Doors partners in the Road Map Project region, with support from a Federal Social Innovation Fund grant. Outcomes are among students enrolled under this grant.
First Generation High School Graduate
Low Income
Homeless
Immigrant or Immigrant Parents
Parenting 21% 34%
39% 85%
51%
Parenting
Immigrant or Immigrant Parents
Homeless
Low Income
First Generation High School Graduate
GRADUATE FROM HIGH SCHOOL COLLEGE & CAREER READY The Road Map Project29
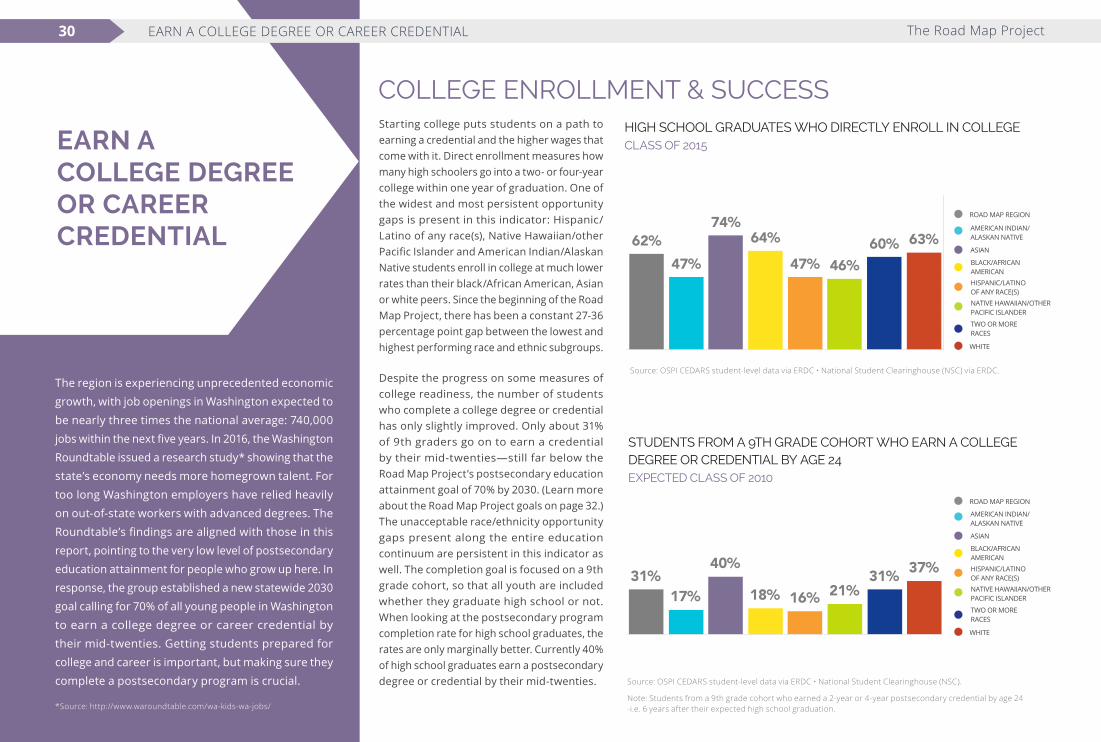
The region is experiencing unprecedented economic growth, with job openings in Washington expected to be nearly three times the national average: 740,000 jobs within the next five years. In 2016, the Washington Roundtable issued a research study* showing that the state’s economy needs more homegrown talent. For too long Washington employers have relied heavily on out-of-state workers with advanced degrees. The Roundtable’s findings are aligned with those in this report, pointing to the very low level of postsecondary education attainment for people who grow up here. In response, the group established a new statewide 2030 goal calling for 70% of all young people in Washington to earn a college degree or career credential by their mid-twenties. Getting students prepared for college and career is important, but making sure they complete a postsecondary program is crucial.
EARN A COLLEGE DEGREE OR CAREER CREDENTIAL
HIGH SCHOOL GRADUATES WHO DIRECTLY ENROLL IN COLLEGECLASS OF 2015
Source: OSPI CEDARS student-level data via ERDC • National Student Clearinghouse (NSC) via ERDC.
Starting college puts students on a path to earning a credential and the higher wages that come with it. Direct enrollment measures how many high schoolers go into a two- or four-year college within one year of graduation. One of the widest and most persistent opportunity gaps is present in this indicator: Hispanic/Latino of any race(s), Native Hawaiian/other Pacific Islander and American Indian/Alaskan Native students enroll in college at much lower rates than their black/African American, Asian or white peers. Since the beginning of the Road Map Project, there has been a constant 27-36 percentage point gap between the lowest and highest performing race and ethnic subgroups.
Despite the progress on some measures of college readiness, the number of students who complete a college degree or credential has only slightly improved. Only about 31% of 9th graders go on to earn a credential by their mid-twenties—still far below the Road Map Project’s postsecondary education attainment goal of 70% by 2030. (Learn more about the Road Map Project goals on page 32.) The unacceptable race/ethnicity opportunity gaps present along the entire education continuum are persistent in this indicator as well. The completion goal is focused on a 9th grade cohort, so that all youth are included whether they graduate high school or not. When looking at the postsecondary program completion rate for high school graduates, the rates are only marginally better. Currently 40% of high school graduates earn a postsecondary degree or credential by their mid-twenties.
COLLEGE ENROLLMENT & SUCCESS
*Source: http://www.waroundtable.com/wa-kids-wa-jobs/
STUDENTS FROM A 9TH GRADE COHORT WHO EARN A COLLEGE DEGREE OR CREDENTIAL BY AGE 24EXPECTED CLASS OF 2010
Source: OSPI CEDARS student-level data via ERDC • National Student Clearinghouse (NSC).
Note: Students from a 9th grade cohort who earned a 2-year or 4-year postsecondary credential by age 24 -i.e. 6 years after their expected high school graduation.
BLACK/AFRICAN AMERICAN
AMERICAN INDIAN/ALASKAN NATIVE
HISPANIC/LATINO OF ANY RACE(S)NATIVE HAWAIIAN/OTHER PACIFIC ISLANDER
WHITE
ASIAN
TWO OR MORE RACES
ROAD MAP REGION
BLACK/AFRICAN AMERICAN
AMERICAN INDIAN/ALASKAN NATIVE
HISPANIC/LATINO OF ANY RACE(S)NATIVE HAWAIIAN/OTHER PACIFIC ISLANDER
WHITE
ASIAN
TWO OR MORE RACES
ROAD MAP REGION
62% 47%
74% 64%
47% 46% 60% 63%
0%
10%
20%
30%
40%
50%
60%
70%
80%
90%
100%
ALL NATIVE AMERICAN / ALASKAN
NATIVE
ASIAN BLACK / AFRICAN
AMERICAN
HISPANIC / LATINO OF
ANY RACE(S)
NATIVE HAWAIIAN / OTHER PACIFIC
ISLANDER
TWO OR MORE RACES
WHITE
31% 17%
40%
18% 16% 21% 31% 37%
0
0.1
0.2
0.3
0.4
0.5
0.6
0.7
0.8
0.9
1
ALL NATIVE AMERICAN /
ALASKAN NATIVE
ASIAN BLACK / AFRICAN
AMERICAN
HISPANIC / LATINO OF
ANY RACE(S)
NATIVE HAWAIIAN /
OTHER PACIFIC
ISLANDER
TWO OR MORE RACES
WHITE
EARN A COLLEGE DEGREE OR CAREER CREDENTIAL The Road Map Project30

Community and Technical Colleges (CTCs) serve a disproportionate number of the region’s low-income youth and students of color. They also provide a vital on-ramp to postsecondary education. In the Road Map Project region, half of all students who enroll in a postsecondary program attend a local CTC. In the past, good information about how CTC students were performing was not available, but after working closely with postsecondary education partners, CCER published the Road Map Project Community Technical College Report. The
IMPROVING DATA TO SUPPORT COLLEGE ENROLLMENT AND SUCCESS
Left Local Community and Technical Colleges
Still Enrolled in Community and Technical Colleges
Any Completion and Transfer to 4-year
Any Completion No Transfer
Transfer to 4-year (no completion)
Source: OSPI CEDARS student-level data via ERDC, National Student Clearinghouse (NSC) via ERDC, State Board for Community and Technical Colleges (SBCTC) via ERDC.
Note: The proportion of Road Map Project region 2011 high school graduates who completed degrees or transferred to a four-year college within three years of enrolling in a local CTC. This graph comes from the Road Map Project Community and Technical College Report, published January 2016. The class of 2011 was selected because it was the most recent cohort of students that had at least three years of data (through academic year 2013-14) when the report was produced. The report focused on seven local CTCs that serve a large proportion of students from the Road Map region: Bellevue College, Green River College, Highline College, Renton Technical College, and the three main campuses of the Seattle Colleges system – North Seattle College, Seattle Central College, and South Seattle College.
Students encounter many barriers to completing their
postsecondary education. Balancing financial needs,
family life and academics can be difficult. One major
effort in the region helping students earn a degree
or credential is Project Finish Line. Project Finish Line
works with four community and technical colleges in the
Road Map region: all Seattle Colleges and Green River
College. During the three-year project, the colleges
hired completion coaches, revised their policies and
procedures, and participated in a learning community
to improve their students’ postsecondary credential
completion and university transfer rates.
Completion coaches reengage students who are close to
finishing postsecondary credentials but have dropped
out. Through one-on-one advising and service referral,
coaches are able to address many of the needs that
have kept students from finishing. Coaches prioritize
services such as tutoring and funding resources to
underrepresented students of color and low-income
students. Since Project Finish Line began in 2014, more
than 1,100 students have completed more than 1,000
degrees and 300 certificates. Project Finish Line’s
outreach efforts reached more than 8,000 students.
The effort is a great example of what can happen when
institutions partner and learn from each other so that
they can better address barriers students face.
PROJECT FINISH LINE
THREE YEAR OUTCOMES FOR HIGH SCHOOL GRADUATES ENROLLING IN LOCAL COMMUNITY & TECHNICAL COLLEGES BY RACE/ETHNICITY CLASS OF 2011
report examined outcomes for those in the high school class of 2011 who attended a CTC over a three-year period. Outcomes measured include college readiness, credit accumulation, persistence and completion.
Twenty-seven percent of recent high school graduates in the region enrolled in a local CTC completed a degree or credential within three years. An additional 9% transferred to a four-year college without a degree or credential. However, completion and transfer rates vary significantly between
individual CTCs. These rates are significantly lower for black/African American, Hispanic/Latino of any race(s) and American Indian/Alaskan Native students.
Washington’s CTCs educate the students with the lowest levels of college readiness and the highest need, but receive the least funding. This, combined with lack of state financial aid, demonstrates that there is much to be done to achieve equitable funding.
ALL STUDENTS
WHITE
ASIAN
AMERICAN INDIAN/ALASKAN NATIVE
BLACK/AFRICAN AMERICAN
HISPANIC/LATINO OF ANY RACE(S)
UNABLE TO SHOW DATA FOR NATIVE HAWAIIAN/OTHER PACIFIC ISLANDER AND TWO OR MORE RACES DUE TO SMALL NUMBERS OF STUDENTS IDENTIFYING WITHIN THESE GROUPS.
15%
7%
19%
18%
22%
18%
2%
3%
5%
11%
11%
9%
4%
11%
9%
10%
9%
LeftLocalCTCs StillEnrolled
EARN A COLLEGE DEGREE OR CAREER CREDENTIAL The Road Map Project31

VISION STATEMENT Every child and youth in South King County and South Seattle, particularly children of color and low-income children, thrives in their education, communities and life.
GOALSBy 2020, we will increase equitable policies and practices in our education systems and dramatically improve outcomes for children and youth, from cradle through college and career; so that:
By 2030, we will eliminate the opportunity and achievement gaps impacting children of color and low-income children in South King County and South Seattle, and 70% of youth in the region will earn a college degree or career credential.
VALUESWe believe race should not be a predictor of education outcomes, yet education policies and practices have historically disenfranchised communities of color and low-income families. In order to achieve our vision and realize a future where every child and youth in our region are thriving in their education, communities and lives, we must be intentional about disrupting the inequities we strive to change. The Road Map Project core values guide our approach to the work, and help us hold ourselves accountable to children, youth and communities.
In 2016, many Road Map Project partners and CCER staff engaged in a strategic planning process, which began with the acknowledgment that we are far from reaching our original 2020 goal of closing opportunity and achievement gaps for low-income students and children of color in addition to doubling the number of students who earn a postsecondary credential. The Strategic Planning Group, with input from stakeholders, built a new strategic framework for the project. It includes a vision statement, a set of core values to guide the work, an updated theory of change and revised goal statements. The revised Road Map Project goals increase the postsecondary attainment target to 70% and extend the project’s timeline from 2020 to 2030.
This new direction calls for significant shifts in approaches to our work, as well as the creation of a Community Leadership Team to guide the project
PLANNING FOR THE ROAD MAP PROJECT’S FUTURE
going forward. There will be deeper emphasis on building stronger systems and addressing systemic barriers to advance racial equity. Another shift will elevate the work to support data and research partnerships with community advocates, educators and service providers. This will support targeted gap-closing work, recognizing the need for more strategy differentiation since generalized interventions fail to address the root causes of our significant racial and ethnic disparities.
We remain committed to aligning our collective efforts across the education continuum. Extending our timeframe does not mean backing off the need to push for outcomes our students deserve now. It does mean working each day with a sense of great urgency while simultaneously maintaining the commitment to stay in the work for the long haul.
NEW STRATEGIC DIRECTION
2016 RESULTS REPORT The Road Map Project32
EQUITY • OPPORTUNITY • INCLUSION
COMMUNITY • SOCIAL JUSTICE
COLLABORATION • ACCOUNTABILITY
TRANSPARENCY

ROAD MAP PROJECT SYSTEM-WIDE RACIAL EQUITY ESSENTIALSStrengthening these foundational essentials will help students of color in our region reach their full potential.
Advocate for local and regional
funding equity, including public
and private sources
EQUITABLE FUNDINGINCREASE CULTURALLY
RELEVANT SCHOOL CLIMATE AND SUPPORTS
STRONG FAMILY ENGAGEMENT PRACTICES
AND FUNCTIONS
INCREASE ACCESS AND DISMANTLE BARRIERS
TO OPPORTUNITY
STRONG CIVIL RIGHTS POLICIES
Advocate for state funding equity
Build capacity of culturally
specific community-based
organizations
Reform discipline policy and practices
Diversify educator workforce
Improve cultural competence of workforce
Support bilingual pride and language access
Support families as early childhood brain-builders
Build regional capacity for grassroots parent advocacy
Build strong district and
school family engagement
practices
Support strong implementation of
House Bill #1541 (state “opportunity
gap” bill)
Increase access to high-quality early learning
Increase access to strong family
supports
Increase access to quality out-of-school-time
Increase access to career
connections and pathways to
success
Advocate for federal Every Student Succeeds Act (ESSA) implementation as a civil rights opportunity
Increase access to quality reengagement programs
2016 RESULTS REPORT The Road Map Project33

KEEP IN TOUCHCCER and all Road Map Project partners look
forward to continuing this work, and creating
relationships with new organizations, individuals
and communities with shared interests in the
years ahead.
To stay up-to-date on the latest Road Map Project
news and events, sign up for the newsletter at:
www.roadmapproject.org/newsletter.
Like Road Map Project on Facebook:
facebook.com/RoadMapProject
Follow Road Map Project on Twitter:
twitter.com/RoadMapProject
Visit the Online Data Dashboard:
roadmapproject.org/dashboard
View the report online:
roadmapproject.org/2016ResultsReport
Many project partners contributed to creating the 2016 Results Report, and many more are involved in the day-to-day efforts to improve education systems for children, families and communities. Thank you to all Road Map Project partners for taking part in this comprehensive work!
We would also like to specifically thank organizations who provided support to the development of this Results Report:
THANK YOU
AUBURN SCHOOL DISTRICT • CHILDCARE RESOURCES • CITY OF SEATTLE DEPARTMENT OF EDUCATION AND EARLY LEARNING • FEDERAL WAY PUBLIC SCHOOLS • HIGHLINE PUBLIC SCHOOLS • KENT SCHOOL DISTRICT • KENT SCHOOL DISTRICT’S MEN ON THE MOVE • KING COUNTY HOUSING AUTHORITY • NATIONAL STUDENT CLEARINGHOUSE • ONEAMERICA • PUBLIC HEALTH - SEATTLE & KING COUNTY • PUGET SOUND EDUCATIONAL SERVICE DISTRICT • REFUGEE WOMEN’S ALLIANCE • RENTON SCHOOL DISTRICT • SEATTLE PUBLIC SCHOOLS • TEAMCHILD • TECHBRIDGE GIRLS • THE BERC GROUP • TUKWILA SCHOOL DISTRICT • U.S. DEPARTMENT OF EDUCATION • WASHINGTON COLLEGE ACCESS NE T WORK • WA SHINGTON STATE BOARD FOR COMMUNITY AND TECHNICAL COLLEGES • WASHINGTON STATE DEPARTMENT OF EARLY LEARNING • WASHINGTON STATE EDUCATION RESEARCH AND DATA CENTER • WASHINGTON STATE OFFICE OF SUPERINTENDENT OF PUBLIC INSTRUCTION • WASHINGTON STUDENT ACHIEVEMENT COUNCIL • YOUTH DEVELOPMENT EXECUTIVES OF KING COUNTY
2016 RESULTS REPORT The Road Map Project34

COMMUNITY CENTER FOR EDUCATION RESULTS 206-838-6610 • [email protected] • 1200 12th Ave S, Suite 701 Seattle, WA 98144