2016 Performance Monitoring Workplan For … Spinar, Quality Assurance ... waterbody and to...
51
2016 PERFOMANCE MONITORING WORK PLAN FOR SELECTED SUB-WATERSHEDS Prepared by Kayla Werbianskyj Environmental Manager Targeted Monitoring Section Watershed Assessment and Planning Branch (WAPB) Indiana Department of Environmental Management (IDEM) Office of Water Quality 100 North Senate Avenue MC 65-40-2 Shadeland Indianapolis, Indiana 46204-2251 December 14, 2016 B-028-OWQ-WAP-TGM-16-W-R0
Transcript of 2016 Performance Monitoring Workplan For … Spinar, Quality Assurance ... waterbody and to...
2016
PERFOMANCE MONITORING WORK PLAN
FOR SELECTED SUB-WATERSHEDS
Prepared by
Kayla Werbianskyj
Environmental Manager
Targeted Monitoring Section
Watershed Assessment and Planning Branch (WAPB)
Indiana Department of Environmental Management (IDEM)
Office of Water Quality
100 North Senate Avenue
MC 65-40-2 Shadeland
Indianapolis, Indiana 46204-2251
December 14, 2016
B-028-OWQ-WAP-TGM-16-W-R0

2016 Performance Monitoring WP for Selected Sub-watersheds B-028-OWQ-WAP-TGM-16-W-R0
December 14, 2016
This page is intended to be blank

2016 Performance Monitoring WP for Selected Sub-watersheds B-028-OWQ-WAP-TGM-16-W-R0
December 14, 2016
i
SIGNATURE PAGE
2016 Performance Monitoring Work Plan for Selected Sub-watersheds
Indiana Department of Environmental Management Office of Water Quality
Watershed Assessment & Planning Branch Indianapolis, Indiana
B-028-OWQ-WAP-TGM-16-W-R0
Author(s) Signatures
Date Kayla Werbianskyj, Project Manager, Targeted Monitoring Section
Date Tim Fields, Environmental Manager, Probabilistic Monitoring Section
Date Cory Fischer, Senior Environmental Manager, Watershed Planning and Restoration Section
Date Paul McMurray, Senior Environmental Manager, Probabilistic Monitoring Section
Date Kevin Gaston, Senior Environmental Manager, Probabilistic Monitoring Section
Date Angie Brown, Senior Environmental Manager, Watershed Planning and Restoration Section
Date Jody Arthur, Integrated Report Coordinator, Watershed Assessment and Planning Branch
Management Review and Approvals
Date Mike Sutton, Section Chief, Technical and Logistical Services Section, Quality Assurance Manager Date Timothy Bowren, Project Quality Assurance Officer, Technical and Logistical Services Section
Date Stacey Sobat, Section Chief, Probabilistic Monitoring Section
Date Cyndi Wagner, Section Chief, Targeted Monitoring Section
Date Marylou Renshaw, Chief, Watershed Assessment and Planning Branch
IDEM Quality Assurance Staff Reviewed and Approves this Sampling and Analysis Workplan.
Date Michael Spinar, Quality Assurance Staff, Office of Program Support

2016 Performance Monitoring WP for Selected Sub-watersheds B-028-OWQ-WAP-TGM-16-W-R0
December 14, 2016
ii
This page is intended to be blank

2016 Performance Monitoring WP for Selected Sub-watersheds B-028-OWQ-WAP-TGM-16-W-R0
December 14, 2016
iii
WORK PLAN ORGANIZATION
This Sampling and Analysis Work Plan is an extension of the existing Watershed Assessment and Planning Branch, October 2004 “Quality Assurance Project Plan (QAPP) for Indiana Surface Water Quality Monitoring and Total Maximum Daily Load (TMDL) Program” and serves as a link to the existing QAPP and an independent QAPP for the project. Per the United States Environmental Protection Agency (U.S. EPA) 2006 QAPP guidance (U.S. EPA 2006), this Work Plan establishes criteria and specifications pertaining to a specific water quality monitoring project that are usually described in the following four sections as QAPP elements:
Section I. Project Management/Planning
Project Objectives
Background and Project/Task Description
Project/Task Organization
Data Quality Objectives (DQOs)
Section II. Measurement/Data Acquisition
Sampling Procedure
Analytical Methods
Sample and Data Acquisition Requirements
Quality Control (QC) Measures Specific to the Project
Section III. Assessment/Oversight
External and Internal Checks
Audits
Data Quality Assessments (DQAs)
Quality Assurance/Quality Control (QA/QC) Review Reports
Section IV. Data Validation and Usability
Data Handling and associated QA/QC activities
QA/QC Review Reports

2016 Performance Monitoring WP for Selected Sub-watersheds B-028-OWQ-WAP-TGM-16-W-R0
December 14, 2016
iv
This page is intended to be blank

2016 Performance Monitoring WP for Selected Sub-watersheds B-028-OWQ-WAP-TGM-16-W-R0
December 14, 2016
v
TABLE OF CONTENTS WORK PLAN ORGANIZATION ................................................................................................. iii
TABLE OF CONTENTS .............................................................................................................. v
LIST OF TABLES ....................................................................................................................... vi
LIST OF FIGURES .................................................................................................................... vi
LIST OF ACRONYMS ............................................................................................................... vii
DEFINITIONS .......................................................................................................................... viii
I. PROJECT MANAGEMENT/PLANNING ................................................................................. 1
Project Objective ................................................................................................................... 1 Background and Project/Task Description ............................................................................. 1 Project/Task Organization ..................................................................................................... 4 Data Quality Objectives (DQOs) ............................................................................................ 8
II. Measurement/Data Acquisition..............................................................................................12
Sampling Sites/Sampling Design......................................................................................... 12 Sampling Methods and Sample Handling ............................................................................ 13 Analytical Methods .............................................................................................................. 15 Quality Control and Custody Requirements ......................................................................... 18 Field Instrument Testing and Calibrations ........................................................................... 18
III. ASSESSMENT/OVERSIGHT ...............................................................................................18
Data Quality Assessment Levels ......................................................................................... 18 IV. DATA VALIDATION AND USABILITY .................................................................................19
Data Qualifier Flags............................................................................................................. 19 Data Usability ...................................................................................................................... 19 Laboratory and Estimated Cost ........................................................................................... 19 Reference Manuals and Personnel Safety .......................................................................... 19
REFERENCES .........................................................................................................................21
Attachment 1. IDEM Stream Sampling Field Data Sheet. .........................................................26
Attachment 2. IDEM Fish Collection Data Sheet (front). ...........................................................27
Attachment 3. IDEM Office of Water Quality Macroinvertebrate Header Form .........................29
Attachment 4. IDEM OWQ Biological Qualitative Habitat Evaluation Index (front). ...................30
Attachment 5. IDEM Biological Samples Field Chain of Custody Form. ...................................32
Appendix 1. IDEM Fish Community Assessments for Aquatic Life Use .....................................33
Appendix 2. Calculating IDEM Macroinvertebrate Index of Biotic Integrity (mIBI) ......................36
2016 Performance Monitoring WP for Selected Sub-watersheds B-028-OWQ-WAP-TGM-16-W-R0
December 14, 2016
vi
LIST OF TABLES Table 1. Sampling parameters and stream segment impairments for Busseron Creek and Eagle
Creek sub-watersheds performance monitoring sites in 2016 .................................................... 2
Table 2. Site information for Busseron Creek sub-watersheds sampling in 2016 ....................... 3
Table 3. Site information for Eagle Creek sub-watersheds sampling in 2016 ............................. 4
Table 4. Performance monitoring time frames for sampling activities relative to the cause of
impairment per stream in selected sub-watersheds in 2016 ....................................................... 5
Table 5. Water Quality Criteria [327 IAC 2-1-6] .......................................................................... 9
Table 6. Training and Staffing Requirements ............................................................................11
Table 7. Bacteriological and Water Chemistry sample container, preservative, and holding time
requirements .............................................................................................................................16
Table 8. Water chemistry and Bacteriological Test Methods and Reporting Limits ....................17
Table 9. In situ Water Chemistry and Bacteriological parameters showing method and IDEM
quantification limit .....................................................................................................................17
LIST OF FIGURES Figure 1. Performance monitoring sampling area, AUID stream segments, and site sampling
parameters for Busseron Creek sub-watersheds ....................................................................... 6
Figure 2. Performance monitoring sampling area, AUID stream segments, and site sampling
parameters for Eagle Creek sub-watersheds ............................................................................. 7

2016 Performance Monitoring WP for Selected Sub-watersheds B-028-OWQ-WAP-TGM-16-W-R0
December 14, 2016
vii
LIST OF ACRONYMS AIMS: Assessment Information Management System AUID: Assessment Unit Identification CALM: Consolidated Assessment Listing Methodology CFR: Code of Federal Regulations CPR: Cardio-Pulmonary Resuscitation DO: Dissolved Oxygen DQA: Data Quality Assessment DQO: Data Quality Objectives GPS: Global Positioning System IAC: Indiana Administrative Code IBC: Impaired Biotic Community IBI: Index of Biotic Integrity IC: Indiana Code IDEM: Indiana Department of Environmental Management MDL: Method Detection Limit mg/L: Milligram per liter MHAB: Multi-habitat mL: Milliliter mm: Millimeters NPDES: National Pollutant Discharge Elimination System NPS: Nonpoint Source Control NTU: Nephelometric Turbidity Unit(s) Nx: Nutrient OHEPA Ohio Environmental Protection Agency OWQ: Office of Water Quality PFD: Personal Floatation Device PPE: Personal Protective Equipment QA/QC: Quality Assurance/Quality Control QAPP: Quality Assurance Project Plan QC: Quality Control QHEI: Qualitative Habitat Evaluation Index RL: Reporting Limit RPD: Relative Percent Difference SM: Standard Method SOLAS: Safety of Life at Sea SOP: Standard Operating Procedures S.U.: Standard Units TMDL: Total Maximum Daily Load U.S. EPA: United States Environmental Protection Agency USGS: United States Geological Survey WAPB: Watershed Assessment and Planning Branch

2016 Performance Monitoring WP for Selected Sub-watersheds B-028-OWQ-WAP-TGM-16-W-R0
December 14, 2016
viii
DEFINITIONS
TMDL The sum of the wasteload allocations (effluent limitations) for
point sources, load allocations for nonpoint sources and natural
background, plus a margin of safety. TMDLs are required for any
impaired waters on the CWA 303(d) List.
Impaired Biotic Communities Biological communities – the fish and aquatic invertebrates (e.g.,
insects) in stream – are indicators of the cumulative effects of
activities that affect water quality conditions over time. An IBC
listing on Indiana’s 303(d) list means IDEM’S monitoring data
shows one or both of the aquatic communities are not as healthy
as they should be. IBC is not a source of impairment but a
symptom of other sources.
Elutriate To purify, separate, or remove lighter or finer particles by
washing, decanting, and settling.
Fifteen (15) Minute Pick A component of the IDEM multihabitat macroinvertebrate
sampling method in which the one minute kick sample and fifty
meter sweep sample collected at a site are combined, elutriated,
with macroinvertebrates removed from the resulting sample for 15
minutes while in the field.
Fifty (50) Meter Sweep A component of the IDEM multihabitat macroinvertebrate
sampling method in which approximately 50 meters (m) of
shoreline habitat in a stream or river is sampled with a standard
500 micrometer (µm) mesh width D-frame dipnet by taking 20-25
individual “jab” or “sweep” samples, which are then composited.
One (1) minute kick sample A component of the IDEM multihabitat macroinvertebrate
sampling method in which approximately one square meter (m²)
of riffle or run substrate habitat in a stream or river is sampled
with a standard 500 micrometer (µm) mesh width D-frame dipnet
for approximately one minute.
Perennial Refers to a water body in which water is present in at least 50% of
the stream reach during the time of fish community sampling.
Reach A segment of a stream used for fish community sampling, equal in
length to 15 times the average wetted width of the stream, with a
minimum length of 50 meters and a maximum length 500 meters.
Target A sampling point which falls on a perennial stream within the
basin of interest and the boundaries of Indiana.
Pre-reclamation sampling Sampling completed prior to DNR mine reclamation activities.

2016 Performance Monitoring WP for Selected Sub-watersheds B-028-OWQ-WAP-TGM-16-W-R0
December 14, 2016
ix
Letter of intention Letter sent to landowners that staff will be sampling a stream
accessed at a bridge near their property.
Hydrologic Unit Code Numerical sequence unique to every watershed in the United
States consisting of two to eight digits (largest region to smallest
categorical unit) based on level of classification (size) of
watershed; larger watersheds have less HUC digits
Assessment Unit (AU) Individual segment of a stream or river (measured and reported in
miles) used for assessing waters; length of a stream AU can vary.
A single AU may or may not represent the entire stream to which
it is associated.
Example: Large rivers are commonly broken into smaller,
separate AUs while smaller streams may be grouped together
into a single, “catchment” AU based on hydrology and other
factors that can affect water quality
Reach Indexing Process for dividing or combining one or more AUs using
software tools that work within geographical information systems
(GIS) applications to delineate one or more AUs for a given
waterbody and to “key” these AUs to the National Hydrography
Dataset (NHD) which allows them to be mapped.
AUID Unique code used to identify each AU’s based on the12-digit HUC
in which it is located; used for reporting biological, chemical,
bacteriological impairments of Indiana streams and rivers to the
303(d) List of Impaired Waterbodies.
NHD The NHD is a database created by U.S. EPA and the United
States Geological Survey that provides a comprehensive
coverage of hydrographic data for the United States. It uniquely
identifies and interconnects the stream segments that comprise
the nation’s surface water drainage system and contains
information for other common surface waterbodies such as lakes,
reservoirs, estuaries, and coastlines

2016 Performance Monitoring WP for Selected Sub-watersheds B-028-OWQ-WAP-TGM-16-W-R0
December 14, 2016
1
I. PROJECT MANAGEMENT/PLANNING
Project Objective The goal of the State of Indiana is to restore and maintain the chemical, physical, and biological integrity of the waters of the State (327-IAC-2-1-1.5). Section 106(e) of the Clean Water Act (CWA) and 40 CFR Part 35.168(a) require the United States Environmental Protection Agency (U.S. EPA) to determine that a state is monitoring the quality of navigable waters, compiling, and analyzing data on water quality and including it in the State’s Section 305(b) report. The Indiana Department of Environmental Management (IDEM) Office of Water Quality (OWQ) is responsible for sampling and assessing Indiana’s surface water quality pursuant to the CWA Section 305(b) as well as, according to Section 303(d) of the CWA, identifying water bodies of the state that are impaired and need development of a Total Maximum Daily Load (TMDL) to alleviate the impairments. To that end, all states must submit a biennial Integrated Water Quality Monitoring and Assessment Report (Integrated Report) (IDEM 2014a), encompassing the 305(b) assessment report and the 303(d) list of impaired water bodies (IDEM 2014b) to the U.S. EPA. Assessments of the state’s waters are facilitated by various Watershed Assessment and Planning Branch programs involving probabilistic and targeted approaches by collecting biological, chemical, physical, and habitat data (US EPA 2005).
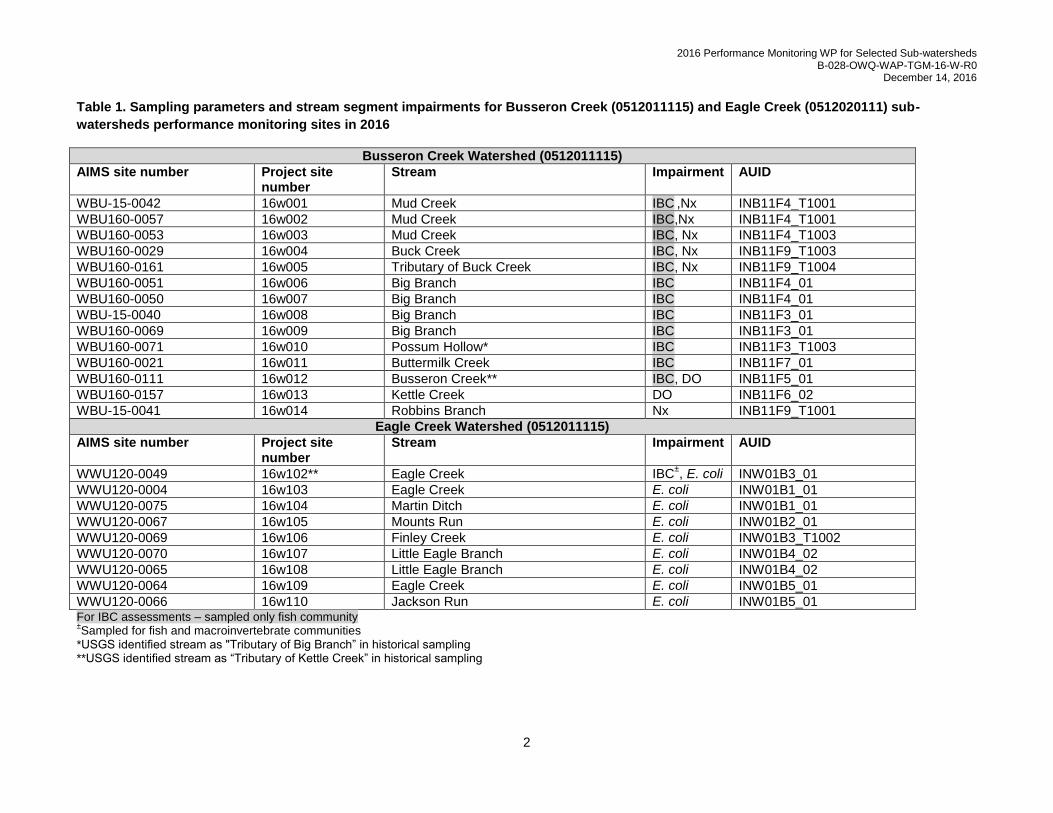
Background and Project/Task Description Performance monitoring is initiated to show improvements in water quality when waterbodies cited on the Indiana 303(d) list as impaired have received documented Nonpoint Source (NPS) control or watershed planning and restoration efforts. This type of monitoring provides chemical, physical, biological, and/or bacteriological data that can be reported to U.S. EPA Region 5’s NPS Program showing improvements in watersheds previously listed as impaired. The monitoring design for each waterbody reflects the original sampling effort that was conducted; no new sites were selected or added. For this study on the sub-watersheds of: 1.) Busseron Creek (HUC 0512011115) and 2.) Eagle Creek (HUC 0512020111), one or more of the following data types will be used for assessment purposes: Water chemistry (all biological and nutrient sampling events), in-situ water chemistry (all sampling events), E. coli bacteriological contamination indicator, fish community, macroinvertebrate assemblages (one site), and habitat evaluations (every biological sampling site) (see Table 1). For previous sampling of biological community status, only fish community was collected by USGS using IDEM’s methodology in Busseron Creek sub-watersheds; therefore to show improvement, the same protocol will be used when assessing for Impaired Biotic Communities (IBC), (see pages 12-13 of workplan). For IBC at site 16w102 in the Eagle Creek sub-watershed Finley-Eagle Creek (051202011103), both macroinvertebrate and fish communities will be sampled and assessed for integrity, as per standard protocol (see pages 12-13 of workplan). .
The Indiana Water Quality Monitoring Strategy: 2011-2019 (WQMS) (IDEM 2011) facilitates the accomplishment of these CWA requirements, in addition to other IDEM-specific management goals. Following analysis of historical data and statewide restoration activities, performance monitoring sites are selected from the 303(d) list of impaired waters in a watershed for which IDEM has observed significant restoration activities. Sampling parameters may vary among sites and are determined by the impairment indicated by the 303(d) listing.
2016 Performance Monitoring WP for Selected Sub-watersheds B-028-OWQ-WAP-TGM-16-W-R0
December 14, 2016
2
Table 1. Sampling parameters and stream segment impairments for Busseron Creek (0512011115) and Eagle Creek (0512020111) sub-
watersheds performance monitoring sites in 2016
Busseron Creek Watershed (0512011115)
AIMS site number Project site number
Stream Impairment AUID
WBU-15-0042 16w001 Mud Creek IBC ,Nx INB11F4_T1001
WBU160-0057 16w002 Mud Creek IBC,Nx INB11F4_T1001
WBU160-0053 16w003 Mud Creek IBC, Nx INB11F4_T1003
WBU160-0029 16w004 Buck Creek IBC, Nx INB11F9_T1003
WBU160-0161 16w005 Tributary of Buck Creek IBC, Nx INB11F9_T1004
WBU160-0051 16w006 Big Branch IBC INB11F4_01
WBU160-0050 16w007 Big Branch IBC INB11F4_01
WBU-15-0040 16w008 Big Branch IBC INB11F3_01
WBU160-0069 16w009 Big Branch IBC INB11F3_01
WBU160-0071 16w010 Possum Hollow* IBC INB11F3_T1003
WBU160-0021 16w011 Buttermilk Creek IBC INB11F7_01
WBU160-0111 16w012 Busseron Creek** IBC, DO INB11F5_01
WBU160-0157 16w013 Kettle Creek DO INB11F6_02
WBU-15-0041 16w014 Robbins Branch Nx INB11F9_T1001
Eagle Creek Watershed (0512011115)
AIMS site number Project site number
Stream Impairment AUID
WWU120-0049 16w102** Eagle Creek IBC±, E. coli INW01B3_01
WWU120-0004 16w103 Eagle Creek E. coli INW01B1_01
WWU120-0075 16w104 Martin Ditch E. coli INW01B1_01
WWU120-0067 16w105 Mounts Run E. coli INW01B2_01
WWU120-0069 16w106 Finley Creek E. coli INW01B3_T1002
WWU120-0070 16w107 Little Eagle Branch E. coli INW01B4_02
WWU120-0065 16w108 Little Eagle Branch E. coli INW01B4_02
WWU120-0064 16w109 Eagle Creek E. coli INW01B5_01
WWU120-0066 16w110 Jackson Run E. coli INW01B5_01 For IBC assessments – sampled only fish community ±Sampled for fish and macroinvertebrate communities
*USGS identified stream as "Tributary of Big Branch” in historical sampling **USGS identified stream as “Tributary of Kettle Creek” in historical sampling
2016 Performance Monitoring WP for Selected Sub-watersheds B-028-OWQ-WAP-TGM-16-W-R0
December 14, 2016
3
Study Area for the 2016 Monitoring Program
Busseron Creek sub-watersheds
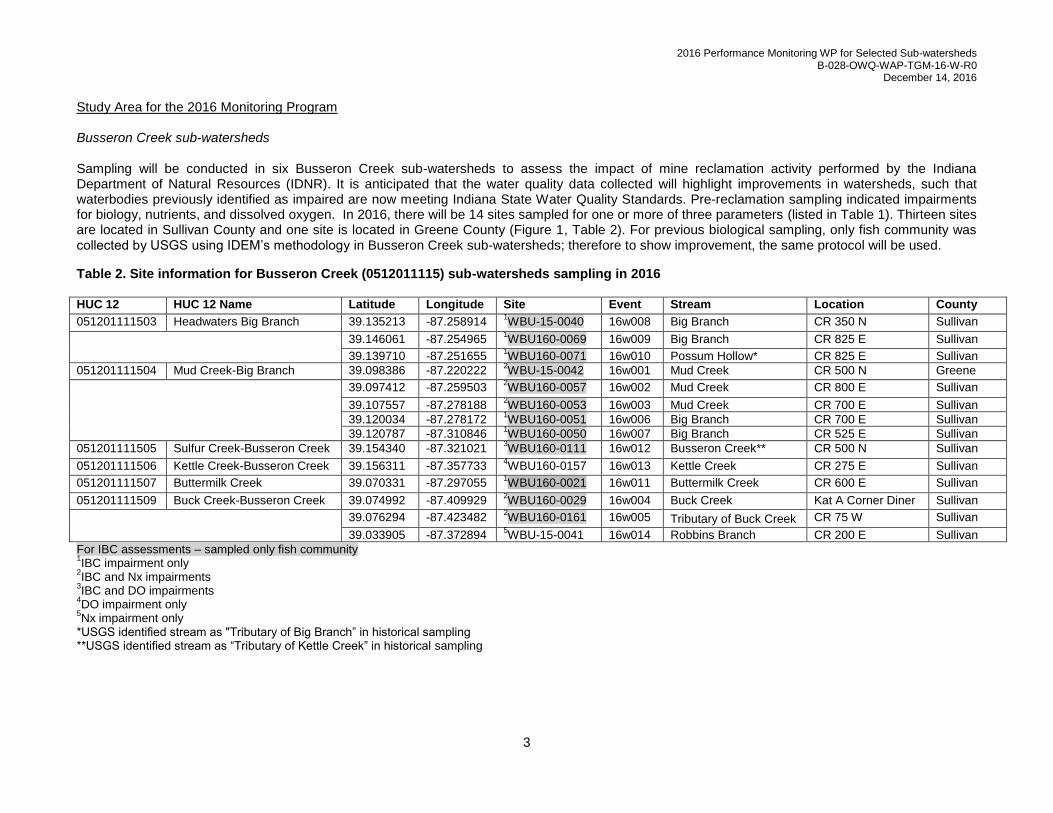
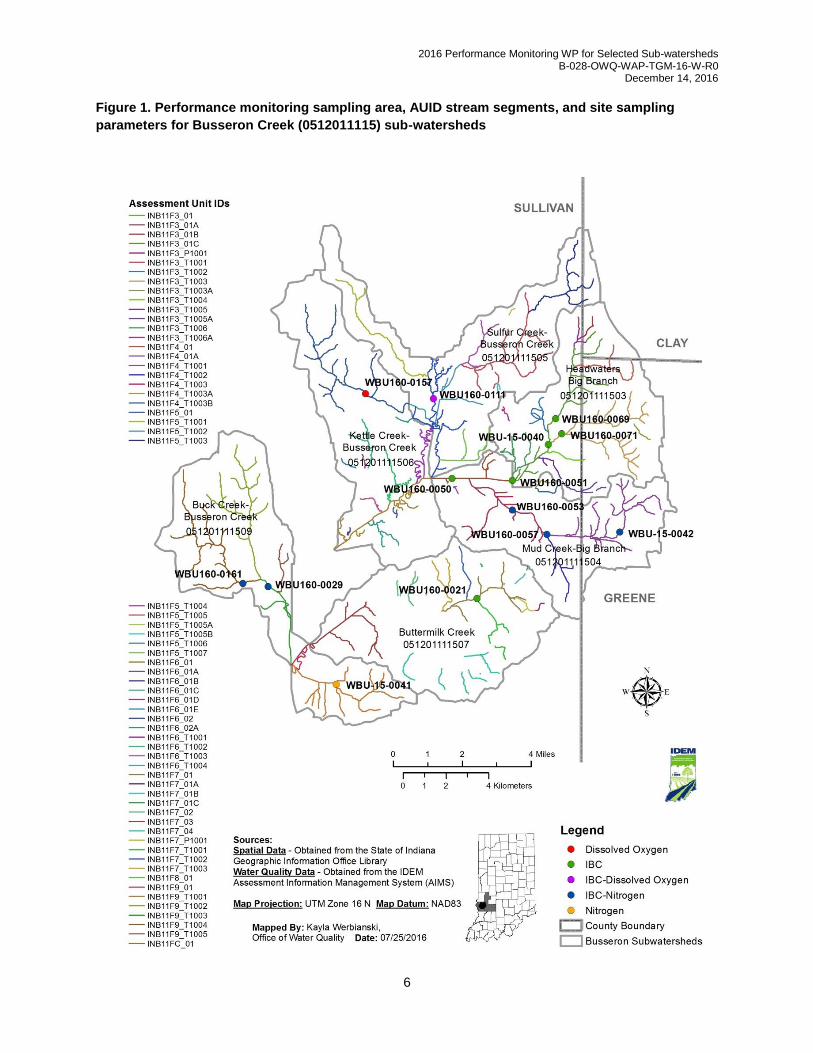
Sampling will be conducted in six Busseron Creek sub-watersheds to assess the impact of mine reclamation activity performed by the Indiana Department of Natural Resources (IDNR). It is anticipated that the water quality data collected will highlight improvements in watersheds, such that waterbodies previously identified as impaired are now meeting Indiana State Water Quality Standards. Pre-reclamation sampling indicated impairments for biology, nutrients, and dissolved oxygen. In 2016, there will be 14 sites sampled for one or more of three parameters (listed in Table 1). Thirteen sites are located in Sullivan County and one site is located in Greene County (Figure 1, Table 2). For previous biological sampling, only fish community was collected by USGS using IDEM’s methodology in Busseron Creek sub-watersheds; therefore to show improvement, the same protocol will be used.
Table 2. Site information for Busseron Creek (0512011115) sub-watersheds sampling in 2016
HUC 12 HUC 12 Name Latitude Longitude Site Event Stream Location County
051201111503 Headwaters Big Branch 39.135213 -87.258914 1WBU-15-0040 16w008 Big Branch CR 350 N Sullivan
39.146061 -87.254965 1WBU160-0069 16w009 Big Branch CR 825 E Sullivan
39.139710 -87.251655 1WBU160-0071 16w010 Possum Hollow* CR 825 E Sullivan
051201111504 Mud Creek-Big Branch 39.098386 -87.220222 2WBU-15-0042 16w001 Mud Creek CR 500 N Greene
39.097412 -87.259503 2WBU160-0057 16w002 Mud Creek CR 800 E Sullivan
39.107557 -87.278188 2WBU160-0053 16w003 Mud Creek CR 700 E Sullivan
39.120034 -87.278172 1WBU160-0051 16w006 Big Branch CR 700 E Sullivan
39.120787 -87.310846 1WBU160-0050 16w007 Big Branch CR 525 E Sullivan
051201111505 Sulfur Creek-Busseron Creek 39.154340 -87.321021 3WBU160-0111 16w012 Busseron Creek** CR 500 N Sullivan
051201111506 Kettle Creek-Busseron Creek 39.156311 -87.357733 4WBU160-0157 16w013 Kettle Creek CR 275 E Sullivan
051201111507 Buttermilk Creek 39.070331 -87.297055 1WBU160-0021 16w011 Buttermilk Creek CR 600 E Sullivan
051201111509 Buck Creek-Busseron Creek 39.074992 -87.409929 2WBU160-0029 16w004 Buck Creek Kat A Corner Diner Sullivan
39.076294 -87.423482 2WBU160-0161 16w005 Tributary of Buck Creek CR 75 W Sullivan
39.033905 -87.372894 5WBU-15-0041 16w014 Robbins Branch CR 200 E Sullivan
For IBC assessments – sampled only fish community 1IBC impairment only
2IBC and Nx impairments
3IBC and DO impairments
4DO impairment only
5Nx impairment only
*USGS identified stream as "Tributary of Big Branch” in historical sampling **USGS identified stream as “Tributary of Kettle Creek” in historical sampling

2016 Performance Monitoring WP for Selected Sub-watersheds B-028-OWQ-WAP-TGM-16-W-R0
December 14, 2016
4
Eagle Creek sub-watersheds Sampling will be conducted in five Eagle Creek sub-watersheds to assess the impact of U.S. EPA NPS funding of watershed management plan implementation. Previous sampling (2001) in the selected sub-watersheds indicated a bacteriological impairment for Escherichia coli (E. coli). In 2016, there will be nine sites will be targeted for E. coli sampling; one site will also be sampled for biological communities (see Table 1). All sites are located in Boone County with the exception of 16w107; site 16w107 is located in Hamilton County (Figure 2, Table 3). For IBC assessments at site 16w102 in the Eagle Creek sub-watershed Finley-Eagle Creek (051202011103), both macroinvertebrate and fish communities will be sampled. Table 3. Site information for Eagle Creek (0512020111) sub-watersheds sampling in 2016
HUC 12 HUC 12 Name Latitude Longitude Site Event Stream Location County
051202011101 Dixon Branch-Eagle Creek 40.125953 -86.280432 7WWU120-0075 16w104 Martin Ditch CR 1000 E Boone
40.070019 -86.270253 7WWU120-0004 16w103 Eagle Creek CR 200 N Boone
051202011102 Mounts Run 40.015490 -86.288824 7WWU120-0067 16w105 Mounts Run CR 950 E Boone
051202011103 Finley-Eagle Creek 40.040643 -86.283835 6WWU120-0049
± 16w102 Eagle Creek SR 32 Boone
40.025541 -86.277903 7WWU120-0069 16w106 Finley Creek SR 421 Boone
051202011104 Lion Creek-Eagle Branch 40.013814 -86.228242 7WWU120-0070 16w107 Little Eagle Branch CR 200 S Hamilton
39.962456 -86.254517 7WWU120-0065 16w108 Little Eagle Branch CR 550 S Boone
051202011105 Jackson Run-Eagle Creek 39.992609 -86.283978 7WWU120-0066 16w110 Jackson Run CR 975 Boone
39.960811 -86.259970 7WWU120-0064 16w109 Eagle Creek Willow Ave. Boone
±Sampled for fish and macroinvertebrate
6E. coli and IBC impairments
7E. coli impairment only
Project/Task Organization Sampling of waterbodies in the Busseron Creek sub-watersheds of HUC 0512011115 and Eagle Creek sub-watersheds of HUC 0512020111 will occur between June and October during the 2016 sampling season (Table 1). Deadlines and Time Frames for Sampling Activities
a. Site reconnaissance activities for all watersheds will be completed in March 2016. All sites will be accessed at bridge crossings. Staff will seek
land owner approval (if necessary) for biological sampling to access the stream safely with the appropriate equipment. Landowners unable to be
contacted will be sent a letter of intention with the project manager’s contact information. Reconnaissance activities will be conducted in the
office and through physical site visits if needed.
b. Biological sampling (IBC) for Busseron Creek sites will begin in June 2016 and end no later than October 17, 2016 (see Table 1). Twelve sites
in Busseron Creek sub-watersheds 051201111503, -504, -505, -507, and -509 will each be sampled once for fish community, and habitat quality.
In-situ water chemistry parameters (see Table 4) will be collected with biology. One site (16w102, HUC 051202011103) in Eagle Creek
Watershed will be sampled for both biological parameters (fish community and macroinvertebrate community), (Table 1). The biological sampling
for Busseron Creek sub-watersheds will be reassessed based on previous USGS sampling in 2007 indicating impairment. All data and results

2016 Performance Monitoring WP for Selected Sub-watersheds B-028-OWQ-WAP-TGM-16-W-R0
December 14, 2016
5
will be produced in a report to EPA. USGS used IDEM methodology for fish community sampling, therefore this data is comparable (see pages
12-13 of workplan).
c. Bacteriological sampling (E. coli) for Eagle Creek sub-watersheds will be conducted during the recreational season of April to October 2016.
Each site will be sampled five times at equally spaced intervals over a 30-day period to determine a geometric mean. Bacteriological sampling
will be reassessed based on previous sampling conducted by IDEM for the 2001 Eagle Creek TMDL project.
d. General Water Chemistry and Nutrients (Nx)--Ammonia, Phosphorus, and Nitrogen will be sampled on three discrete occasions between June
and October at six targeted sites in Busseron Creek sub-watersheds, with a minimum time frame of 30 days between sampling events (see
Table 1 for these sites). See Table 8 for a list of these parameters.
e. In situ Water Chemistry—Dissolved Oxygen (DO), Dissolved Oxygen Percent Saturation, pH, Temperature, Specific Conductance and Turbidity
readings will be collected with all sampling events in all sub-watersheds. Since site 16w012 will be sampled once for DO during the biological
visit, two additional samples will need to be taken to meet the data minimum for assessments. Site 16w013 will also need to be sampled three
times for DO to reassess the prior impairment (IDEM, 2014a).
Table 4. Performance monitoring time frames for sampling activities relative to the cause of impairment per stream in selected sub-
watersheds in 2016
2016 Reconnaissance E.coli Nutrients IBC In situ Water Chemistry
Eagle Creek Watershed March September-October X June-Oct 17 Every Sampling Event
Busseron Watershed March X June-October June-Oct 17 Every Sampling Event
“X” denotes that the watershed will not be sampled for the corresponding parameter
Samples will be collected for physical, chemical, and biological communities if the flow is not dangerous for staff to enter the stream and barring any hazardous weather conditions or unexpected physical barriers to site access. Unexpected physical barriers could include an impassable log jam, fence or physical installations, and domestic and wildlife dangers. Flow is considered dangerous at flood stages, or using best professional judgement following or during a high water event. Staff will use USGS Current Water Data, Daily Streamflow Condition readings on the USGS website to determine if discharge is elevated too far from median flow to sample. Typically, streamflow discharge in the 75th percentile or greater would be considered too high to sample. Since there are not stream gaging stations on all streams and rivers, especially headwater streams, staff may travel to sites and use best professional judgement at the site when determining to collect a sample. Even if the weather conditions and stream flows are safe, sample collections for biological communities may also be postponed at least one week due to scouring of the stream substrate or instream cover following a high water event resulting in non-representative samples.
2016 Performance Monitoring WP for Selected Sub-watersheds B-028-OWQ-WAP-TGM-16-W-R0
December 14, 2016
6
Figure 1. Performance monitoring sampling area, AUID stream segments, and site sampling
parameters for Busseron Creek (0512011115) sub-watersheds

2016 Performance Monitoring WP for Selected Sub-watersheds B-028-OWQ-WAP-TGM-16-W-R0
December 14, 2016
7
Figure 2. Performance monitoring sampling area, AUID stream segments, and site sampling
parameters for Eagle Creek (0512020111) sub-watersheds

2016 Performance Monitoring WP for Selected Sub-watersheds B-028-OWQ-WAP-TGM-16-W-R0
December 14, 2016
8
Data Quality Objectives (DQOs) The DQO process (U.S. EPA 2006) is a planning tool for data collection activities. It provides a basis for balancing decision uncertainty with available resources. The DQO is required for all significant data collection efforts for a project. It is a seven step systematic planning process used to clarify study objectives, define the appropriate types of data, and establish decision criteria on which to base the final use of the data. The DQO for Performance Monitoring in Busseron Creek (0512011115) and Eagle Creek (0512020111) sub-watersheds is identified in the following seven steps:
1. Description of the Problem
Indiana is required to assess all waters of the state to determine their designated use attainment status. “Surface waters of the state are designated for full body contact recreation” and “will be capable of supporting” a “well-balanced, warm water aquatic community” [327 IAC 2-1-3]. This project will gather bacteriological, biological (fish and macroinvertebrate) and habitat, and/or chemical data for the purpose of reassessing the designated use attainment status of the impaired assessment unit identification (AUID) segments on waterbodies in the sub-watersheds of Busseron Creek (0512011115) and Eagle Creek (0512020111).
2. Identify the Decision for the Data Collection
The goal of this study is to reassess whether the targeted stream segments on waterbodies in the sub-watersheds of Busseron Creek (0512011115) and Eagle Creek (0512020111) are “supporting” or “non-supporting” for the designated use attainment related to each previously identified impairment (see Table 5). This comparison will be in correlation with water quality criteria included in Table 5 [327 IAC 2-1-6], nutrient criteria, and/or biological criteria following Indiana’s 2014 Consolidated Assessment Listing Methodology (CALM, IDEM 2014a).
For a description of all sites, including AUID stream segments; location; waterbodies; 12-digit hydrologic unit code identification; and Impairments, see Table 1. A total of 14 sites will be assessed for improvement in Busseron Creek sub-watersheds for one or more of the following parameters: biology (fish community), nutrients, and dissolved oxygen. Twelve biological sites in Busseron Creek sub-watersheds and one site in one Eagle Creek sub-watershed will be assessed for improvement based on the Indiana narrative biological criteria [327 IAC 2-1-3]. There will be two sites assessed for dissolved oxygen improvement and six sites assessed for nutrient improvement in Busseron Creek sub-watersheds following the benchmarks listed in the nutrient benchmarks section below (IDEM 2014a). Nine sites across five Eagle Creek sub-watersheds will be evaluated for bacteriological improvement. All water quality criterions can be viewed in Table 5.
Nutrient Benchmarks
Assuming a minimum of three sampling events, if two or more of the conditions below are met on the
same date, the waterbody will be classified as non-supporting due to nutrients.
Total Phosphorus: one or more measurements >0.3 mg/L
Nitrogen (measured as NO3+NO2): one or more measurements >10.0 mg/L
Dissolved Oxygen: any measurement <4.0 mg/L or >12.0 mg/L; or measurements consistently at or close to the standard (e.g., readings of 4.0-5.0 mg/L)
pH: >9.0 Standard Units (S.U.) or measurements consistently at or close to the standard (e.g., readings of 8.7-9.0 S.U.)
Algal conditions-- Algae are described as “excessive” based on field observations by IDEM scientists.
Biological Criteria:
Indiana narrative biological criteria [327 IAC 2-1-3] states that “all waters, except as described in subdivision (5),” (i.e., limited use waters) “will be capable of supporting” a “well-balanced, warm water aquatic community.” The water quality standard definition of a “well-balanced aquatic community” is “an aquatic community that: (A) is diverse in species composition; (B) contains several different trophic levels

2016 Performance Monitoring WP for Selected Sub-watersheds B-028-OWQ-WAP-TGM-16-W-R0
December 14, 2016
9
and (C) is not composed mainly of pollution tolerant species” [327 IAC 2-1-9]. An interpretation or translation of narrative biological criteria into numeric criteria would be as follows: A stream segment is non-supporting for aquatic life use when the monitored fish or macroinvertebrate community receives an Index of Biotic Integrity (IBI) score of less than 36 (on a scale of 0-60 for fish and 12-60 for macroinvertebrate communities), which is considered “Poor” or “Very Poor” (IDEM 2014a). There are no sites in this project with known distributions of salmonids.
Table 5. Water Quality Criteria [327 IAC 2-1-6]
Parameter Level Criterion
Chloride Calculated based on hardness and sulfate CAC
Dissolved Oxygen
At least 5.0 mg/L (warm water aquatic life) At least 6.0 mg/L (cold-water fish*)
Not less than 4.0 mg/L. Not less than 6.0 mg/L at any time and shall not be less than 7.0 mg/L in areas where spawning occurs during the spawning season and in areas used for imprinting during the time salmonids are being imprinted.
pH
6.0 - 9.0 S.U. Must remain between 6.0 and 9.0 S.U. except for daily fluctuations that exceed 9.0 due to photosynthetic activity
Total Ammonia (NH3-N) Calculated based on pH and Temperature Calculated CAC
Nitrate- N+Nitrite-N 10 mg/L Human Health point of drinking water intake
Sulfate Calculated based on hardness and chloride In all waters outside the mixing zone
E. coli (April-October Recreational season)
125 CFU/100mL or 125 MPN/100 mL 235 CFU/100 mL or 235 MPN/100 mL
5 sample geometric mean based on at least 5 samples equally spaced over a 30 day period Not to exceed in any one sample in a 30 day period except in cases where there are at least 10 samples, 10% of the samples may exceed the criterion
Dissolved Solids 750 mg/L Public water supply
CAC = Chronic Aquatic Criterion, S.U. = Standard Units, MPN = Most Probable Number, CFU = Colony Forming Unit *Waters protected for cold-water fish include those waters designated by the Indiana Department of Natural
Resources for put-and-take trout fishing as well as salmonid waters listed in 327 IAC 2-1.5-5.
2016 Performance Monitoring WP for Selected Sub-watersheds B-028-OWQ-WAP-TGM-16-W-R0
December 14, 2016
10
3. Inputs to the Decision
Field monitoring activities are required to collect physical, chemical, biological and habitat data. These data are required to address the necessary decisions previously described. Monitoring activities will take place at previously sampled sites for which permission to access has been granted by the necessary landowners or property managers. Collection procedures for in situ water chemistry measurements, chemical, biological and habitat data will be described in detail under Section II MEASUREMENT/DATA ACQUISITION.
4. Define the Boundaries of the Study
There are nine sites located across five Eagle Creek sub-watersheds. The 12-digit sub-watersheds include: Dixon Branch-Eagle Creek (051202011101); Mounts Run (051202011102); Finley-Eagle Creek (051202011103); Lion Creek-Eagle Branch (051202011104); and Jackson Run-Eagle Creek (051202011105). A majority of these watersheds are located in Boone County. Portions of three watersheds extend into Hamilton County: Dixon Branch-Eagle Creek, Finley Creek-Eagle Creek, and Lion Creek-Little Eagle Branch. Collectively these five watersheds drain 102.86 square miles of land. The predominant use of this land in these watersheds is Cultivated Crops, covering 71.41% (or (73.44 sq. miles).
There are 14 sites located across six Busseron Creek sub-watersheds in this project. The 12-digit sub-watersheds include: Headwaters Big Branch (051201111503); Mud Creek-Big Branch (051201111504); Sulfur Creek-Busseron Creek (051201111505); Kettle Creek-Busseron Creek (051201111506); Buttermilk Creek (051201111507); and Buck Creek-Busseron Creek (051201111509). The majority of these watersheds are located in Sullivan County. Small portions of two watersheds, Sulfur Creek-Busseron Creek and Headwaters Big Branch, extend into Clay County; no sites are located in Clay County. Additionally, portions of Headwaters Big Branch and Mud Creek-Big Branch extend into Green County. Collectively these six watersheds drain 115.64 square miles of land. The predominant use of this land in these watersheds is Deciduous Forest, covering 39.94% (or 46.19 sq. miles), and Cultivated Crops, covering 34.61% (or 40 sq. miles). Land use was calculated in ArcGIS with the 2011 NLCD Land use raster layer and HUC-12 sub-watershed layer retrieved from the Indiana GIO (geodatabase) library (Yang et al, 2013).
5. Develop a Decision Rule
Assessment decisions (305(b)/303(d)) will be reported in the 2018 Indiana Integrated Report. Recreational use attainment decisions will be based on bacteriological criteria developed to protect primary contact recreational activities [327 IAC 2-1-6]. Aquatic life use support decisions will include independent evaluations of biological and chemical data as outlined in Indiana’s 2014 Consolidated Assessment and Listing Methodology (CALM, IDEM 2014a) and based on water quality criteria expressed in Indiana’s Water Quality Standards (327 IAC 2-1). The fish assemblage will be evaluated at each site using the appropriate IBI (Simon 1990; Simon and Dufour 1998, 2005) (see Appendix 1 for more details). Macroinvertebrate multi-habitat samples will also be evaluated using the Macroinvertebrate IBI developed for lowest practical taxonomic level identifications (see Appendix 2 for more details). For fish, IBI scores range from 0 (minimum) to 60 (maximum). For macroinvertebrates, the mIBI scores range from 0 (minimum) to 60 (maximum). A site will be determined non-supporting for aquatic life use when one or both biological communities score less than or equal to 35.
6. Specify Tolerable Limits on Decision Errors
Site specific aquatic life use assessments include program specific controls to minimize the introduction of errors. These controls include water chemistry equipment checks, duplicates, and laboratory controls through verification of species identifications. Field Procedure Manuals (IDEM 2002; OHEPA 2006) and standard operating procedures (IDEM 1992a, IDEM 1992b, 1992c, 1992d, 1992e, 2010a) dictate consistent and proven techniques for sample collection to assure representative samples and minimize measurement error. The QA/QC process detects deficiencies in the data collection as set forth in the IDEM QAPP for the Indiana Surface Water Quality Monitoring Program (IDEM 2004). The field and laboratory performance includes precision measurements by relative percent difference of field and

2016 Performance Monitoring WP for Selected Sub-watersheds B-028-OWQ-WAP-TGM-16-W-R0
December 14, 2016
11
laboratory duplicates; accuracy measurements by percent recovery of MS/MSD samples analyzed in the laboratory; and completeness measurements by the percent of planned samples that are actually collected, analyzed, reported, and usable for the project.
7. Optimize the Design for Obtaining Data
Five Eagle Creek and six Busseron Creek Indiana sub-watersheds previously cited on the 303(d) list for impairment(s) that have undergone restoration activities are targeted in this study. These activities will be discussed in a write-up to U.S. EPA for reporting watershed improvement, or outlined in a Success Story Document. Sites in the watershed that historically documented the impairment(s) were chosen as sampling sites.
8. Training and Staffing Requirements
Table 6. Training and Staffing Requirements
Role Required Training/Experience
Responsibilities Training References
Project Manager -Bachelor of Science Degree in biology, toxicology, or other closely related field plus four years of experience in aquatic ecosystems (Masters Degree with two years aquatic ecosystems experience may substitute) -Database experience -Annually review the Principles and Techniques of Electrofishing -Annually review relevant safety procedures -Annually review relevant SOP documents for field operations
-Establish Project in the AIMS II database -Oversee development of Project Work Plan -Oversee entry and QC of field data -Oversee querying of data from AIMS II database to determine results not meeting aquatic life use Water Quality Criteria -Sample shipments to contract laboratory -Assign analysis tasks to the samples -Track contract laboratory expenditures
-AIMS II Database User Guide -U.S. EPA 2006 QA Documents on developing Work Plans (QAPPs)
Field Crew Chief -Bachelor of Science Degree in biology or other closely related field -At least one year of experience in sampling methodology and taxonomy of aquatic communities in the region -Annually review the Principles and Techniques of Electrofishing -Annually review relevant safety procedures -Annually review relevant SOP documents for field operations
-Completion of field data sheets -Taxonomic accuracy -Overall operation of field crew when remote from central office -Adherence to safety and field SOP by crew members -Ensure field sampling equipment is functioning properly and all equipment loaded into vehicles prior to field sampling activities -Maintaining proper preservation of samples -Hold an active First Aid and CPR certification
-IDEM 1992a, 1992b, 1992c, 1992d, 2002, 2008, 2010b, 2010c -U.S. EPA, 1994a -Novotny, 1974 -Cowx, 1990 Cowx and Lamarque, 1990 -Appendix 1 and 2 -See attachments 1-5 for field data sheets

2016 Performance Monitoring WP for Selected Sub-watersheds B-028-OWQ-WAP-TGM-16-W-R0
December 14, 2016
12
Training and Staffing Requirements, Continued
Field Crew Members (continued)
-Complete hands-on training for sampling methodology prior to field sampling activities -Review the Principles and Techniques of Electrofishing -Review relevant safety procedures -Review relevant SOP documents for field and sample processing operations
-Follow all safety and SOP procedures while engaged in field sampling activities -Follow direction of Field Crew Chief while conducting field sampling activities -Hold an active First Aid and CPR certification
-IDEM 1992a, 1992b, 1992c, 1992d, 2002, 2008, 2010b, 2010c -U.S. EPA, 1994a -Novotny, 1974 -Cowx, 1990 -Cowx and Lamarque, 1990
Quality Assurance Officer
-Bachelor of Science in chemistry or a related field of study -Familiarity with QA/QC practices and methodologies -Familiarity with the WAPB QAPP and data qualification methodologies
-Ensure adherence to QA/QC requirements of WAPB QAPP -Evaluate data collected by sampling crews for adherence to project Work Plan -Review data collected by field sampling crews for completeness and accuracy -Perform a data quality analysis of data generated by the project -Assign data quality levels based on the data quality analysis -Import data into the AIMS II database -Ensure that field sampling methodology audits are completed according to WAPB procedures
-IDEM 2004, 2012b -U.S. EPA 2006 documentation on QAPP Development and data qualification -AIMS II Database User Guide
II. Measurement/Data Acquisition
Sampling Sites/Sampling Design As is described in the “Performance Monitoring in Targeted Watersheds Objective” section of this work plan, the target sites were sampled previously and cited on the 303(d) list of impaired waterbodies.
Site reconnaissance activities are conducted in-house and through physical site visits. In-house activities include preparation and review of site maps and aerial photographs. Physical site visits include verification of accessibility, safety considerations, equipment needed to properly sample the site, and property owner consultations, if required. Final coordinates for each site will be confirmed during the reconnaissance activities for assessing that current conditions have not significantly changed using a Trimble Juno TM SB Global Positioning System (GPS) with an accuracy of one to three meters. These coordinates will also be confirmed in the AIMS II database.
2016 Performance Monitoring WP for Selected Sub-watersheds B-028-OWQ-WAP-TGM-16-W-R0
December 14, 2016
13
Table 1 provides a list of the selected sampling sites with the Site Number, AIMS Site Number, 12-Digit Hydrologic Unit Code (HUC) name and code, Stream Name, Location, County, and the Latitude and Longitude of each site. Figures 1 and 2 depict the various sampling site locations for this project.
Sampling Methods and Sample Handling Bacteriological Sampling
The bacteriological sampling will be conducted by one team consisting of one or two staff. The work effort will require an average of one hour per site per week. Samples will be collected in an IDEM E. coli Mobile Laboratory equipped with all materials and equipment necessary for the Colilert® E. coli Test Method. Five samples from each site (9 sites total) will be collected at equally spaced intervals over a thirty day period. Staff will collect the samples in a 120 mL pre-sterilized wide mouth container from the center of flow (if stream is wadeable) or from the shoreline using a pole sampler (if not). All samples will be consistently labeled, cooled, and held at a temperature less than 10ºC during transport. All E. coli samples will be collected on a schedule such that any sampling crew can deliver them to the IDEM E. coli Laboratory for analyses within the bacteriological holding time of six hours. All supplies will be obtained from IDEXX Laboratories, Inc., Westbrook, Maine.
Water Chemistry Sampling – All samples
During three discrete sampling events, one team of two staff will collect water chemistry grab samples record in situ water chemistry measurements as described below in the section for In situ Water Chemistry Measurements. Staff will also note physical site descriptions on the IDEM Stream Sampling Field Data Sheet (Attachment 1). All water chemistry sampling will adhere to the Water Quality Surveys Section Field Procedure Manual (IDEM 2002). Water chemistry sampling is typically completed within 30 minutes per site, depending on accessibility. General Chemistry and Nutrient test methods and reporting limits can be viewed in Table 8.
In situ Water Chemistry Measurements
Dissolved Oxygen (DO), pH, water temperature, specific conductance, and DO percent saturation will be measured with a Datasonde during each sampling event regardless of the media type being collected. Measurement procedures and operation of the Datasonde shall be performed according to the manufacturers’ manuals (Hydrolab Corporation 2002; YSI 2002) and Sections 2.10 – 2.13 of the Water Quality Surveys Section Field Procedure Manual (IDEM 2002). Turbidity will be measured with a Hach™ turbidity kit and will be written in the comments under the in situ parameter measurements. If a Hach™ turbidity kit is not available, the Datasonde measurement for turbidity will be recorded. All in situ measurements taken from the Datasonde, Hach™ and weather codes at each site will be recorded on the IDEM Stream Sampling Field Data Sheet (Attachment 1). The same protocol will be used with all calibration equipment (Temperature/pH probe, Winkler DO, Hach™ pre-calibrated gels) at one site, once per week. A photo will also be taken upstream and downstream of the site during each sampling event.
Fish Community Sampling
The fish community sampling will be completed by teams of three to five staff. Sampling will be performed using various standardized electrofishing methodologies, depending on stream size and site accessibility. Fish assemblage assessments will be performed in a sampling reach of 15 times the average wetted width, with a minimum reach of 50 meters and a maximum reach of 500 meters (Simon 1990; Simon and Dufour 1998, 2005; U.S. EPA 1995). An attempt will be made to sample all habitat types available within the sample reach to ensure adequate representation of the fish community present at the time of the sampling event. If depth and velocity of the stream has not drastically changed, the list of electrofishers to be utilized should nearly match the type of equipment used during the original sampling event which include: the Smith-Root LR-24 or LR-20B Series backpack electrofishers, the Smith-Root model 2.5 Generator Powered Pulsator electrofisher with RCB-6B junction box and a dropper
boom array outfitted in a canoe or possibly a 12 foot Loweline boat, or for non-wadeable sites the
Smith-Root Type VI-A electrofisher assembled in a 16 foot Loweline boat (IDEM 1992a, 1992b, 1992c, 1992d).

2016 Performance Monitoring WP for Selected Sub-watersheds B-028-OWQ-WAP-TGM-16-W-R0
December 14, 2016
14
Sample collections during high flow or turbid conditions will be avoided due to: 1) low collection rates, which result in non-representative samples; and 2) safety considerations for the sampling team. Sample collections during late autumn and seasonal cold temperatures will be avoided due to the lack of responsiveness to the electrical field by some species that can also result in samples that are not representative of the streams fish assemblage (Simon 1990; U.S. EPA 1995).
Fish will be collected using dip nets with fiberglass handles and netting of 1/8-inch bag mesh. Fish collected in the sampling reach will be sorted by species into baskets and buckets. Young-of-the year fish less than 20 millimeters (mm), total length, will not be retained in the community sample (Simon 1990; U.S. EPA 1995).
Prior to processing fish specimens and completion of the fish collection datasheet (Attachment 2), one to two individuals per species will be preserved in 10% formaldehyde solution for future reference if the following three conditions are met: (1) there are more than 10 individuals for that species collected in the sampling reach; (2) the specimens can be positively identified; and (3) the individuals for preservation are small enough to fit in a 2000 mL jar. Fish specimens should also be preserved if they cannot be positively identified in the field (especially those that co-occur like the striped and common shiner), individuals that appear to be hybrids or have anomalies, as well as dead specimens that are taxonomically valuable for un-described taxa (like the red shiner or jade darter), life history studies, or research projects. If there are few individuals captured or the specimens are too large to preserve, a photo of key characteristics will be taken for later examination. All field staff on the project should attend the Taxonomic characteristics review for possible species encountered in the basin of interest by the IDNR Nongame Aquatic Biologist, as well as personal review of lab practice and reference samples with dichotomous keys.
Data will be recorded for non-preserved fish on the fish collection datasheet (Attachment 2) consisting of the following: number of individuals, minimum and maximum total length (mm), mass weight in grams (g), and number of individuals with deformities, eroded fins, lesions, tumors, and other anomalies. Once the data have been recorded, specimens will be released within the sampling reach if possible. Data will be recorded for preserved fish specimens following taxonomic identification in the laboratory.
Macroinvertebrate Sampling
Macroinvertebrate sampling will not be conducted on sites in the selected Busseron Creek sub-watersheds (see Table 2 for selected sub-watershed) as historically, fish community sampling was the only biological parameter collected. It was determined that for the purpose of this project, improvement or success can only be confirmed by the re-analysis of parameters previously sampled parameters which initially impaired the site in 2007.
Macroinvertebrate collection will occur on one site (16W102) in the Eagle Creek sub-watershed (HUC 051202011103). This site is currently impaired for IBC (resulting from a 1999 macroinvertebrate study) and E. coli (the result of a 2001 TMDL study which did not collect biological community information) on the 303(d) list. It was the only site selected for IBC and E.coli due to the convenience of having two available parameters for potential delisting on one AU.
Macroinvertebrate community sampling may be conducted immediately following the fish community sampling event or on a different date by crews of two to three staff. Samples are collected using a modification of the U.S. EPA Rapid Bioassessment Protocol multi-habitat (MHAB) approach using a D-frame dipnet (Barbour et al. 1999; IDEM 2010a; Klemm et al. 1990; Plafkin et al. 1989). The IDEM MHAB approach is composed of a 1-minute ”kick” sample collected within a riffle or run (collected by disturbing 1 square meter of stream bottom substrate and collecting the dislodged macroinvertebrates within the dipnet) and a 50-meter “sweep” sample of shoreline habitats (collected by disturbing habitats such as emergent vegetation, rootwads and rootmats, depositional zones, logs and sticks and collecting the dislodged macroinvertebrates within the dipnet). The 50 meter length of riparian corridor that is sampled at each site will be defined using a rangefinder or tape measure. If the stream is too deep to wade, a boat will be used to sample the 50 meter zone along the shoreline that has the best available potential habitat. The 1-minute “kick” and 50-meter “sweep” samples are combined in a bucket of water which will
2016 Performance Monitoring WP for Selected Sub-watersheds B-028-OWQ-WAP-TGM-16-W-R0
December 14, 2016
15
be elutriated through a U.S. standard number 35 (500 µm) sieve a minimum of five times so that all rocks, gravel, sand and large pieces of organic debris are removed from the sample. The remaining sample is then transferred from the sieve to a white plastic tray. While still on-site, the collector will conduct a 15-minute pick of macroinvertebrates at a single organism rate with an effort to pick for maximum organism diversity through turning and examination of the entire sample in the tray. The resulting picked sample will be preserved in 70% isopropyl alcohol and returned to the laboratory for identification at the lowest practical taxonomic level (usually genus or species level, if possible) and evaluated using the MHAB macroinvertebrate IBI. Before leaving the site, an IDEM OWQ Macroinvertebrate Header Form (Attachment 3) and QHEI will be completed for the sample.
Habitat Assessments
Habitat assessments will be completed immediately following macroinvertebrate and fish community sample collections at each site using a slightly modified version of the Ohio Environmental Protection Agency (OHEPA) Qualitative Habitat Evaluation Index (QHEI), 2006 edition (OHEPA 2006; Rankin 1995). The modifications include additional fields for substrate and instream cover; however these modifications do not alter the calculations. A separate QHEI (Attachment 4) must be completed for these two media types since the sampling reach length is different (i.e. 50 meters standard for macroinvertebrates and between 50 and 500 meters for fish, depending on the stream width).
Analytical Methods Bacteriological Sampling
Bacteriological samples will be analyzed using the Standard Method (SM) 9223B Enzyme Substrate Coliform Test Method (see Table 9 for quantification limits). Samples will be collected using 120 mL pre-sterilized wide mouth containers and adhere to the six hour holding time (Table 7). Analytical results from the IDEM E. coli Laboratory include quality control (QC) check sample results from which precision, accuracy, and completeness can be determined for each batch of samples. Raw data are archived by analytical batch for easy retrieval and review. Chain of custody physical procedures must be followed by the crew chief including: recording time of collection, time of setup, time of reading the results, and time and method of disposal. All transfers to another party or repository should be noted with the date, time, and relinquishing/receiving individuals. Any method deviations will be thoroughly documented in the comments section of the raw data sheet.
All QA/QC samples will be tested according to the following guidelines:
Field Duplicate: Field Duplicates will be collected at a frequency of 1 per batch or at least 1 for
every 20 samples collected (≥ 5%).
Field Blank: Field Blanks will be collected at a frequency of 1 per batch or at least 1 for every
20 samples collected (≥ 5%).
Laboratory Blank: Laboratory Blanks (sterile laboratory water blanks) will be tested at a frequency
of 1 per day.
Positive Control: Each lot of media will be tested for performance using bacterial cultures for
positive E. coli.
Negative Controls: Each lot of media will be tested for performance using bacterial cultures for total
coliform other than E. coli and a noncoliform.
Quality assurance documentation for each batch of samples consists of a chain of custody form, a QA/QC summary sheet, and spreadsheets of results. This documentation is submitted to the Technical and Logistical Services Section for QA review and the assignment of an appropriate Data Quality Assessment (DQA) Level.
Water Chemistry Data—Nutrients and Hardness
2016 Performance Monitoring WP for Selected Sub-watersheds B-028-OWQ-WAP-TGM-16-W-R0
December 14, 2016
16
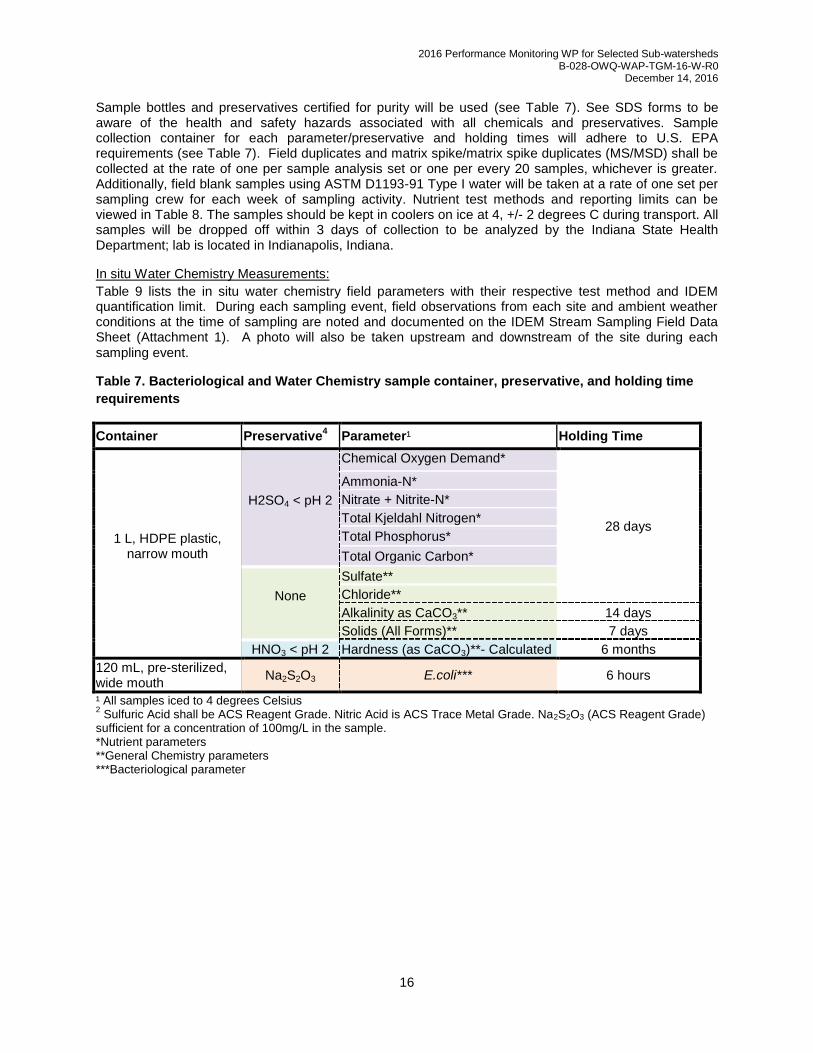
Sample bottles and preservatives certified for purity will be used (see Table 7). See SDS forms to be aware of the health and safety hazards associated with all chemicals and preservatives. Sample collection container for each parameter/preservative and holding times will adhere to U.S. EPA requirements (see Table 7). Field duplicates and matrix spike/matrix spike duplicates (MS/MSD) shall be collected at the rate of one per sample analysis set or one per every 20 samples, whichever is greater. Additionally, field blank samples using ASTM D1193-91 Type I water will be taken at a rate of one set per sampling crew for each week of sampling activity. Nutrient test methods and reporting limits can be viewed in Table 8. The samples should be kept in coolers on ice at 4, +/- 2 degrees C during transport. All samples will be dropped off within 3 days of collection to be analyzed by the Indiana State Health Department; lab is located in Indianapolis, Indiana.
In situ Water Chemistry Measurements:
Table 9 lists the in situ water chemistry field parameters with their respective test method and IDEM quantification limit. During each sampling event, field observations from each site and ambient weather conditions at the time of sampling are noted and documented on the IDEM Stream Sampling Field Data Sheet (Attachment 1). A photo will also be taken upstream and downstream of the site during each sampling event.
Table 7. Bacteriological and Water Chemistry sample container, preservative, and holding time
requirements
Container Preservative4 Parameter¹ Holding Time
1 L, HDPE plastic, narrow mouth
H2SO4 < pH 2
Chemical Oxygen Demand*
28 days
Ammonia-N*
Nitrate + Nitrite-N*
Total Kjeldahl Nitrogen*
Total Phosphorus*
Total Organic Carbon*
None
Sulfate**
Chloride**
Alkalinity as CaCO3** 14 days
Solids (All Forms)** 7 days
HNO3 < pH 2 Hardness (as CaCO3)**- Calculated 6 months
120 mL, pre-sterilized, wide mouth
Na2S2O3 E.coli*** 6 hours
¹ All samples iced to 4 degrees Celsius 2 Sulfuric Acid shall be ACS Reagent Grade. Nitric Acid is ACS Trace Metal Grade. Na2S2O3 (ACS Reagent Grade)
sufficient for a concentration of 100mg/L in the sample. *Nutrient parameters **General Chemistry parameters ***Bacteriological parameter

2016 Performance Monitoring WP for Selected Sub-watersheds B-028-OWQ-WAP-TGM-16-W-R0
December 14, 2016
17
Table 8. Water chemistry and Bacteriological Test Methods and Reporting Limits
Parameter Test Method IDEM Reporting Limit (mg/L)
ISDH Lab Reporting Limit (mg/L)
Chemical Oxygen Demand (Low level)* SM5220D 10.0 10.000
Ammonia-N* EPA 350.1 0.10 0.100
Nitrate + Nitrite-N* EPA 353.1 0.1 0.100
Total Kjeldahl Nitrogen* EPA 351.2 0.30 0.300
Total Phosphorus* EPA 365.1 0.3 0.030
Total Organic Carbon* SM5310B 1.0 1.000
Sulfate** EPA 375.2 0.5 5.000
Chloride** SM4500Cl-E 1.0 5.000
Alkalinity as CaCO3** EPA 310.2 10.0 10.000
Solids, Suspended Total, (TSS) ** SM2540D 4.0 6.000
Solids, Total (TS) ** SM2540B 1.0 10.000
Solids, Total Dissolved (TDS) ** SM2540C 10.0 10.000
Calcium 200.7,200.8 (used to calculate hardness as CaCO3) 0.200
Magnesium 200.1, 200.8 (used to calculate hardness as CaCO3) 0.200
Hardness (as CaCO3) ** - Calculated SM2340B 0.4 2.0
Hardness (as CaCO3) ** - Colorimetric EPA 130.1 1.0 30.000
*Nutrient parameters **General chemistry parameters
Table 9. In situ Water Chemistry and Bacteriological parameters showing method and IDEM
quantification limit
Parameters Method1 IDEM Quantification Limit
E. coli (Enzyme Substrate Coliform Test)*** SM 9223B 21 MPN / 100 mL
Dissolved Oxygen (data sonde optical) ASTM D888-09 0.05 mg/L
Dissolved Oxygen (data sonde) SM 4500-OG 0.03 mg/L
Dissolved Oxygen (Winkler Titration) SM 4500-OC3 0.20 mg/L
Dissolved Oxygen % Saturation (data sonde optical) ASTM D888-09 0.05 %
Dissolved Oxygen % Saturation (data sonde) SM 4500-OG 0.01 %
pH (data sonde) EPA 150.2 0.10 S.U.
pH (field pH meter) SM 4500H-B3 0.10 S.U.
Specific Conductance (data sonde) SM 2510B 1.00 μmhos/cm
Temperature (data sonde) SM 2550B(2) 0.1 Degrees Celsius (°C)
Temperature (field meter) SM 2550B(2)3 0.1 Degrees Celsius (°C)
Turbidity (Hach™ turbidity kit) EPA 180.1 0.05 NTU4
1 SM = Standard Method
2 MPN (Most Probable Number) = 1 CFU (Colony Forming Unit)
3 Method used for Field Calibration Check
4 NTU = Nephelometric Turbidity Unit(s)

2016 Performance Monitoring WP for Selected Sub-watersheds B-028-OWQ-WAP-TGM-16-W-R0
December 14, 2016
18
***Bacteriological parameter
Laboratory Competency and Certifications The ISDH Laboratory offers organic and inorganic analysis. The laboratory participates annually in multiple proficiency test studies. In addition, ISDH certifies Indiana laboratories for drinking water methods. ISDH itself is certified for drinking water methods for the analysis of nitrate, nitrite, fluoride, arsenic, lead, and copper.
Quality Control and Custody Requirements Quality assurance protocols will follow part B5 of the “Quality Assurance Project Plan for the Indiana Surface Water Quality Monitoring and Total Maximum Daily Load (TMDL) Program,” Revision 3, by Timothy Bowren and Dr. Syed Ghiasuddin (IDEM 2004).
The IDEM Biological Samples Field Chain of Custody Form is used to track fish and macroinvertebrate samples from the field to the laboratory (Attachment 5). Fish taxonomic identifications made in the laboratory may be verified by regionally recognized non-IDEM freshwater fish taxonomists for potentially questionable identification when compared to distribution records of the IDNR Nongame Aquatic Biologist, or if the identifying taxonomist(s) deems it necessary. Records of laboratory identifications and QA/QC of taxonomic work is maintained by the laboratory supervisor of the Probabilistic Monitoring Section of IDEM. All data: 1) are checked for completeness; 2) have calculations performed; 3) are entered into the database; and 4) are checked again for data entry errors.
Field Instrument Testing and Calibrations The Datasonde used for collecting in situ water chemistry will be calibrated immediately prior to each week’s sampling (IDEM 2002). Calibration results and drift values will be recorded, maintained, stored, and archived in log books located in the calibration laboratories at the Shadeland facility. The drift value is the difference between two successive calibrations. If a drift value fails, the Datasonde will read “Fail.” If failure occurs, perform corrective measures such as changing solutions, pH probes, or DO membranes, as stated in the users’ manuals. After corrective measures have been performed, correctly re-calibrate the failed media, and continue. Field parameter calibrations for in situ water chemistry will conform to the procedures as described in the instrument users’ manuals (Hydrolab Corporation 2002; YSI 2002). The DO component of the calibration procedure will be conducted using the air calibration method. The unit will be field checked for accuracy once during the week by comparison with a Winkler DO test. Field tests for Hach™ turbidity, pH and temperature meters will also be used once per week. A Winkler DO test will be conducted at all sites where the DO concentration is 4.0 mg/L or less. Weekly calibration verification results will be recorded on the stream sampling field data sheets (Attachment 1) and entered into the AIMS II database.
Field Analysis Data
In situ water chemistry field data are collected in the field using calibrated or standardized equipment. Calculations may be done in the field (preferred) or later at the office. Analytical results, which have limited QC checks, are included in this category. Detection limits and ranges have been set for each analysis (Table 4). Quality control checks (such as duplicate measurements, measurements of a secondary standard, or measurements using a different test method or instrument) which are performed on field or laboratory data are usable for estimating precision, accuracy, and completeness for the project.
III. ASSESSMENT/OVERSIGHT Field and laboratory performance and system audits will be performed to ensure good quality data. Audit checklists are currently in progress
Data Quality Assessment Levels The samples and various types of data collected by this program are intended to meet the quality assurance criteria and DQA Levels as described in the WAPB QAPP (IDEM 2004, pp 128-129).

2016 Performance Monitoring WP for Selected Sub-watersheds B-028-OWQ-WAP-TGM-16-W-R0
December 14, 2016
19
IV. DATA VALIDATION AND USABILITY Quality assurance reports to management and data validation and usability are also important components of the QAPP which insures good quality data for this project. A quality assurance audit report will be submitted for this project should problems arise and need to be investigated and corrected. Data validation and usability will be achieved through data reduction (the process of converting raw analytical data into final results in proper reporting units), data validation (the process of qualifying analytical/ measurement data on the performance of field and laboratory QC measures incorporated into the sampling and analysis procedures), and data reporting (the detailed description of the data deliverables used to completely document the calibration, analysis, QC measures, and calculations).
Data Qualifier Flags The various data qualifiers and flags that will be used for quality assurance and validation of the data are found on pages 130-131 of the WAPB QAPP (IDEM 2004).
Data Usability
The environmental data collected and its usability are qualified and classified into one or more of the four categories: Acceptable Data, Enforcement Capable Results, Estimated Data, and Rejected Data as described on page 130 of the WAPB QAPP (IDEM 2004).
Information, Data, and Reports
Performance monitoring data that indicates water quality improvement as defined by U.S. EPA’s Office of Water’s National Water Program Measures WQ-SP12.N11 and WQ-10 will be used to write up Measure W reports and Success Stories to be submitted to U.S. EPA. Sites be assessed to see if restoration activities have improved the water quality on individual AUID stream segments will be included in Measure W reports. Success Stories occur when an entire 12-digit HUC is delisted for an impairment; 40% improvement is necessary for a Success Story delisting. Additionally, the data will be recorded in the AIMSII database and used in the Indiana Integrated Water Monitoring and Assessment Report. All data and reports will be made available to public and private entities which may find the data useful for municipal, industrial, agricultural, and recreational decision making processes (TMDL, National Pollutant Discharge Elimination System (NPDES) permit modeling, watershed restoration projects, water quality criteria refinement, etc.). (US EPA 2005)
Laboratory and Estimated Cost Laboratory analysis and data reporting for this project will comply with the WAPB QAPP (IDEM 2004), Request for Proposals (RFP) 12-48 (IDEM 2012a), and the OWQ Quality Management Plan (IDEM 2012b). Analytical tests on general water chemistry and nutrient outlined in Table 7 will be conducted by the Indiana State Department of health; located in Indianapolis, IN. Three rounds of water chemistry on 6 sites in Busseron Creek sub-watersheds, with QA/QC (Field Blank, MS/MSD, and Duplicate samples), will be completed at no direct cost. Supplies for the bacteriological sampling in Eagle Creek sub-watersheds will come from IDEXX Laboratories, Inc., Westbrook, Maine. All fish and macroinvertebrate samples will be collected and analyzed by IDEM staff.
Reference Manuals and Personnel Safety All staff members participating in the field component of this study are required to have completed Basic First Aid and Cardio-Pulmonary Resuscitation (CPR) training. According to the memorandum “Change in status of Water Assessment Branch staff in accordance with the Agency training policy”, dated November 29, 2010, OWQ Watershed Assessment and Planning Branch staff are exempt from initial and annual training requirements set forth in Section 6.0 of the IDEM Health and Safety Training Policy (IDEM 2010b). The memorandum also states “as an alternative to the training requirements of the policy, the Branch will conduct in-service training at a minimum of four (4) hours per year on topics directly related to duties performed by staff.” New hires or those changing job responsibilities without the minimum four hour training must be accompanied in the field by a staff member who has met the requirements of the Branch Health and Safety training.

2016 Performance Monitoring WP for Selected Sub-watersheds B-028-OWQ-WAP-TGM-16-W-R0
December 14, 2016
20
Field personnel collecting water chemistry and bacteriological samples will follow policies and procedures established in the Surveys Section Field Procedures Manual (IDEM 2002) and the Hazardous Communication Plan Supplement (IDEM 1997). Field personnel collecting fish and macroinvertebrate community samples must read and comply with:
The Biological Studies Section SOP Manual, Section II (Hazard Communications Manual) (IDEM 1992e), which includes four yellow three-ring binders consisting of:
o Safety Manual o Hazard Communication SOP o Occupational Safety and Health Administration Handbooks o Material Safety Data Sheets
“Field and Laboratory Operating Procedures for use, handling and storage of chemicals in the laboratory” (Newhouse 1998)
Sampling on surface waters requires safety consciousness of staff members and the use of specialized equipment; thus, staff will comply with the IDEM Personal Protective Equipment (PPE) Policy (IDEM 2008). If an injury or illness arises in the field, staff will follow the IDEM Injury and Illness Resulting from Occupational Exposure Policy (IDEM 2016c). Operating in and around waterbodies carries inherent risks of drowning; thus, personnel involved in sample collection will wear appropriate clothing and PPE when operating boats or sampling in deep water or swift currents. According to the memorandum “Use of Personal Flotation Devices (PFDs) by Branch Personnel” dated February 29, 2000, staff must wear U.S. Coast Guard approved Type I, II, or III PFDs whenever:
the planned work requires them to enter the water and the maximum water depth at any place at the work site is over their knee (note that this depth depends on the employee but it will usually be between 12 and 20 inches or 300-500 mm) or
the employee is in a watercraft of any kind that is being launched, is in the water, or is being retrieved from the water or
the employee must work from structures that do not possess guard rails and are over or alongside water where the water depth is or could reasonably be expected to be 3 feet deep.
In addition, when work is being done in boats on co-jurisdictional waters (as defined by Indiana Code (IC) 14-8-2-315) or during hours of darkness on any waters of the state, all personnel in the watercraft must wear a high intensity whistle and Safety of Life at Sea (SOLAS) certified strobe light.
No sampling will be done on co-jurisdictional waters or during hours of darkness. Safety issues are the responsibility of all crew members; however, any questions in the field should be directed to the field crew leader. The field crew leader is responsible for the completion of all work listed in the workplan, the health and safety aspects of the sampling event, and successful interactions with landowners and members of the public.

2016 Performance Monitoring WP for Selected Sub-watersheds B-028-OWQ-WAP-TGM-16-W-R0
December 14, 2016
21
REFERENCES
Barbour, M.T., J. Gerritsen, B.D. Snyder and J.B. Stribling. 1999. Rapid Bioassessment Protocols for Use in Streams and Wadeable Rivers: Periphyton, Benthic Macroinvertebrates and Fish, Second Edition. EPA/841/B-99/002. U.S. Environmental Protection Agency; Office of Water; Washington, D.C. https://nepis.epa.gov/Exe/ZyNET.exe/20004OQK.TXT
Code of Federal Regulations (CFR). 40 CFR Part 136, Appendix B Revised March 12, 2007. Available at http://www.gpo.gov/fdsys/pkg/CFR-2012-title40-vol24/pdf/CFR-2012-title40-vol24-part136-appB.pdf
Hydrolab Corporation. 2002, revision c. Quanta Water Quality Monitoring System Operating Manual. Loveland, Colorado. Available at http://www.hachhydromet.com/web/ott_hach.nsf/id/pa_users_manuals_e.html
IAC (Indiana Administrative Code), Title 327 Water Pollution Control Division, Article 2. Water Quality Standards. Last updated June 11, 2014. Available at http://www.in.gov/legislative/iac/iac_title?iact=327
IC (Indiana Code), Title 14 Natural and Cultural Resources, Article 8 General Provisions and Definitions. Approved Feburary 27, 2013. Available at http://www.in.gov/legislative/ic/2010/title14/ar8/ch2.pdf
IDEM. 1992a, revision 1. Section 3, Quality Assurance Project Plan, Development of Biological Criteria (Fish) for the Ecoregions of Indiana. Biological Studies Section, Surveillance and Standards Branch, Office of Water Management, Indiana Department of Environmental Management, Indianapolis, Indiana.*
IDEM. 1992b, revision 1. Section 4, Standard Operating Procedures for Fish Collections, Use of Seines, Electrofishers, and Sample Processing. Biological Studies Section, Surveillance and Standards Branch, Office of Water Management, Indiana Department of Environmental Management, Indianapolis, Indiana.*
IDEM. 1992c, revision 1. Section 5, Standard Operating Procedures for Conducting Rapid Assessment of Ambient Water Quality Using Fish (RBP-V). Biological Studies Section, Surveillance and Standards Branch, Office of Water Management, Indiana Department of Environmental Management, Indianapolis, Indiana.*
IDEM. 1992d, revision 1. Section 11, Standard Operating Procedures-Appendices of Operational Equipment Manuals and Procedures. Biological Studies Section, Surveillance and Standards Branch, Office of Water Management, Indiana Department of Environmental Management, Indianapolis, Indiana.*
IDEM. 1992e, revision 1. Section 2, Biological Studies Section Hazards Communications Manual (List of Contents). Biological Studies Section, Surveillance and Standards Branch, Office of Water Management, Indiana Department of Environmental Management, Indianapolis, Indiana.*
IDEM. 1997. Water Quality Surveys Section Laboratory and Field Hazard Communication Plan
Supplement. IDEM 032/02/018/1998, Revised October 1998. Assessment Branch, Indiana Department of Environmental Management, Indianapolis, Indiana.*
IDEM. 2002. Water Quality Surveys Section Field Procedure Manual, Assessment Branch, Indiana
Department of Environmental Management, Indianapolis, Indiana. IDEM, April 2002. https://extranet.idem.in.gov/standards/docs/quality_improvement/qapps/owq_surveys_section_field_manual.pdf
2016 Performance Monitoring WP for Selected Sub-watersheds B-028-OWQ-WAP-TGM-16-W-R0
December 14, 2016
22
IDEM. 2004. Quality Assurance Project Plan (QAPP) for Indiana Surface Water Quality Monitoring
and Total Maximum Daily Load (TMDL) Program, (Rev. 3, Oct. 2004). https://extranet.idem.in.gov/standards/docs/quality_improvement/qapps/owq_surface_water_quality_tmdl.pdf
IDEM. 2008. IDEM Personal Protective Equipment Policy, revised May 1 2008. A-059-OEA-08-P-R0.
Office of External Affairs, Indiana Department of Environmental Management, Indianapolis, Indiana. https://extranet.idem.in.gov/standards/docs/policies/oea/Personal_Protective_Equipment_Policy.pdf
IDEM. 2010a. Multi-habitat (MHAB) Macroinvertebrate Collection Technical Standard Operating Procedure. S-001-OWQ-W-BS-10-T-R0. Watershed Planning and Assessment Branch, Office of Water Quality, Indiana Department of Environmental Management, Indianapolis, Indiana. https://extranet.idem.in.gov/standards/docs/sops/owq/S-001-OWQ-W-BS-10-S-R0.pdf
IDEM. 2010b. IDEM Health and Safety Training Policy, revised October 1 2010. A-030-OEA-10-P-R2.Office of External Affairs, Indiana Department of Environmental Management, Indianapolis, Indiana. https://extranet.idem.in.gov/standards/docs/policies/oea/A-30-OEA-10-P-R2.pdf
IDEM. 2010c. IDEM Injury and Illness Resulting from Occupational Exposure Policy, revised October 1 2010. A-034-OEA-10-P-R2. Office of External Affairs, Indiana Department of Environmental Management, Indianapolis, Indiana https://extranet.idem.in.gov/standards/docs/policies/aw/A-034-AW-16-P-R3.pdf
IDEM. 2011. DRAFT Indiana Water Quality Monitoring Strategy 2011-2019. B-001-OWQ-W-00-11-R0. Watershed Assessment and Planning Branch, Office of Water Quality, Indiana Department of Environmental Management, Indianapolis, Indiana.*
IDEM. 2012a. Request for Proposals 12-48, Solicitation for Analyses. IDEM. Indiana Department of Administration. Indianapolis, Indiana. http://www.in.gov/idem/files/idem_qmp_2012.pdf
IDEM. 2012b. IDEM Agency Wide Quality Management Plan. IDEM, Indiana Government Center North, 100 N. Senate Ave., Indianapolis, Indiana, 46204. Available at http://www.in.gov/idem/files/idem_qmp_2012.pdf
IDEM. 2014a. Indiana’s 2014 Consolidated Assessment and Listing Methodology (CALM) Revised. Edited by Jody Arthur. Office of Water Quality, Indiana Department of Environmental Management, Indianapolis, Indiana. Available at http://www.in.gov/idem/nps/files/ir_2014_report_apndx_h_calm.pdf (Appendix H - revised, Attachment 1)
IDEM. 2014b. 2014 303(d) List Submitted to U.S. EPA on April 1, 2014. Edited by Jody Arthur. Office of Water Quality, Indiana Department of Environmental Management, Indianapolis, Indiana. Available at https://secure.in.gov/idem/nps/3963.htm (Appendix H)
Jin, S., Yang, L., Danielson, P., Homer, C., Fry, J., and Xian, G. 2013. A comprehensive change detection method for updating the National Land Cover Database to circa 2011. Remote Sensing of Environment. 132: 159-175. www.mrlc.gov/downloadfile2.php?file=Preferred_NLCD11_citation.pdf
Klemm, D.J., P.A. Lewis, F.Fulk and J.M. Lazorchak. 1990. Macroinvertebrate Field and Laboratory Methods for Evaluating the Biological Integrity of Surface Waters. EPA/600/4-90/030. Environmental Monitoring Systems Laboratory, Monitoring Systems and Quality Assurance, Office of Research and Development, U.S. Environmental Protection Agency, Cincinnati, Ohio. https://nepis.epa.gov/Exe/ZyNET.exe/30000VCE.txt

2016 Performance Monitoring WP for Selected Sub-watersheds B-028-OWQ-WAP-TGM-16-W-R0
December 14, 2016
23
Newhouse, S.A. 1998. Field and laboratory operating procedures for use, handling and storage of chemicals in the laboratory. IDEM/32/03/007/1998. Biological Studies Section, Assessment Branch, Office of Water Management, Indiana Department of Environmental Management, Indianapolis, Indiana.*
Ohio Environmental Protection Agency (OHEPA). 2006. Methods for Assessing Habitat in Flowing Waters: Using the Qualitative Habitat Evaluation Index (QHEI). OHIO EPA Technical Bulletin EAS/2006-06-1. Revised by the Midwest Biodiversity Institute for State of Ohio Environmental Protection Agency, Division of Surface Water, Ecological Assessment Section, Groveport, Ohio. Report available at http://www.epa.state.oh.us/portals/35/documents/qheimanualjune2006.pdf
Plafkin, J.L., M.T. Barbour, K.D. Porter, S.K. Gross and R.M. Hughes. 1989. Rapid Bioassessment Protocols for Use in Streams and Rivers: Benthic Macroinvertebrates and Fish. EPA/440/4-89/001. Assessment and Watershed Protection Division, U.S. Environmental Protection Agency, Washington, D.C. Report available at http://nepis.epa.gov/Exe/ZyNET.exe/9100LGCA.TXT
Rankin, E.T. 1995. Habitat Indices in Water Resource Quality Assessments. pp. 181-208, Chapter 13, Biological Assessment and Criteria: Tools for the Risk-based Planning and Decision Making, edited by Wayne S. Davis and Thomas P. Simon, Lewis Publishers, Boca Raton, Florida.*
Simon, Thomas.P. 1990. Quality Assurance Program Plan: Development of Biological Criteria for the Ecoregions of Indiana. Region V, Environmental Sciences Division, Central Regional Laboratory, Organic Chemistry Section: Biology Team, U.S. Environmental Protection Agency, Chicago, Illinois.*
Simon, T.P. and R.L. Dufour. 1998. Development of Index of Biotic Integrity Expectations for the Ecoregions of Indiana V: Eastern Cornbelt Plain. EPA 905/R-96/004. Water Division, Watershed and Non-Point Branch, U.S. Environmental Protection Agency Region V, Chicago, Illinois. Report available at http://nepis.epa.gov/Exe/ZyNET.exe/2000BST2.TXT
Simon, T.P. and R.L. Dufour. 2005. Guide to appropriate metric selection for calculating the Index of Biotic Integrity (IBI) for Indiana Large and Great Rivers, Inland Lakes, and Great Lakes nearshore. U.S. Department of the Interior, Fish and Wildlife Service, Bloomington Field Office, Bloomington, Indiana. http://monitoringprotocols.pbworks.com/f
U.S. EPA. 1995. Region 5 R-EMAP Full Proposal: Spatial Evaluation of the Eastern Corn Belt Plain Rivers and Streams for the Development of Reference Condition using EMAP Sampling Design and Indicators, with Comparison of Results to Nonrandom Intensive Survey results in Ohio. U.S. Environmental Protection Agency, Region V, Water Division, Monitoring Standards and Assessment Section, Chicago, Illinois.*
U. S. EPA. 2005. Guidance for 2006 Assessment, Listing and Reporting Requirements Pursuant
to Sections 303(d), 305(b) and 314 of the Clean Water Act, July 29, 2005. Washington, D.C.: U.S. Environmental Protection Agency. https://www.epa.gov/sites/production/files/2015-10/documents/2006irg-report.pdf
U.S. EPA. 2006. Guidance on Systematic Planning Using the Data Quality Objectives Process.
EPA/240/B-06/001. U.S. EPA, Office of Environmental Information, Washington D.C. https://www.epa.gov/sites/production/files/documents/guidance_systematic_planning_dqo_process.pdf
U.S. EPA. 2016 FY16 NWPG Water Quality Measure Definitions
Available at https://www.epa.gov/sites/production/files/2015-10/documents/fy_2016_nwpg_measure_definitions_water_quality_-_copy.pdf
U.S. EPA and the USGS. 2005. National Hydrography Dataset Plus – NHD Plus. Edition 1. Horizon Systems Corporation. http://www.horizon-systems.com/NHDPlus/

2016 Performance Monitoring WP for Selected Sub-watersheds B-028-OWQ-WAP-TGM-16-W-R0
December 14, 2016
24
YSI Incorporated. 2002, revision b. 6-Series Environmental Monitoring Systems Manual, Yellow Springs, Ohio. Available at
http://www.ysi.com/mwg-internal/de5fs23hu73ds/progress?id=fdaTJVUSbg *This document may be inspected at the Watershed and Assessment Branch office, located at 2525 North Shadeland Avenue, Indianapolis, IN.

2016 Performance Monitoring WP for Selected Sub-watersheds B-028-OWQ-WAP-TGM-16-W-R0
December 14, 2016
25
DISTRIBUTION LIST Electronic Distribution Only: Name and Organization Jody Arthur IDEM/OWQ/WAPB (Technical E7) Timothy Bowren IDEM/OWQ/WAPB/Technical and Logistical Services
Section Timothy Beckman IDEM/OWQ/WAPB/Targeted Monitoring Section Cory Fischer IDEM/OWQ/WAPB/Watershed Planning and Restoration
Section Angie Brown IDEM/OWQ/WAPB/Watershed Planning and Restoration
Section Joshua Brosmer IDEM/OWQ/WAPB/Watershed Planning and Restoration
Section Chelsea Cottingham IDEM/OWQ/WAPB/Watershed Planning and Restoration Section Jessica Faust IDEM/OWQ/WAPB/Watershed Planning and Restoration Section Anna Colindres IDEM/OWQ/WAPB/Targeted Monitoring Section Kevin Crane IDEM/OWQ/WAPB/Probabilistic Monitoring Section Todd Davis IDEM/OWQ/WAPB/Probabilistic Monitoring Section Monika Elion IDEM/OWQ/WAPB/Targeted Monitoring Section Tim Fields IDEM/OWQ/WAPB/Probabilistic Monitoring Section Kevin Gaston IDEM/OWQ/WAPB/Probabilistic Monitoring Section Paul Higginbotham IDEM/OWQ (Deputy Assistant Commissioner) David Jordan IDEM/OWQ/WAPB/Technical and Logistical Services
Section Paul McMurray IDEM/OWQ/WAPB/Probabilistic Monitoring Section Myra McShane IDEM/OWQ/WAPB/Technical and Logistical Services
Section Martha Clark Mettler IDEM/OWQ (Assistant Commissioner) Stacy Orlowski IDEM/OWQ/WAPB/Probabilistic Monitoring Section David Parry IDEM/Office of Program Support/Quality Assurance Program Marylou Renshaw IDEM/OWQ/WAPB (Branch Chief) Joe Schmees IDEM/OWQ/WAPB/Watershed Planning and Restoration
Section Stacey Sobat IDEM/OWQ/WAPB/Probabilistic Monitoring Section (Section
Chief) Michael Spinar IDEM/Office of Program Support/Quality Assurance Program Jim Stahl IDEM/OWQ/WAPB (Technical E7) Mike Sutton IDEM/OWQ/WAPB/Technical and Logistical Services
Section (Section Chief) Cyndi Wagner IDEM/OWQ/WAPB/Targeted Monitoring Section (Section
Chief) Kayla Werbianskyj IDEM/OWQ/WAPB/Targeted Monitoring Section
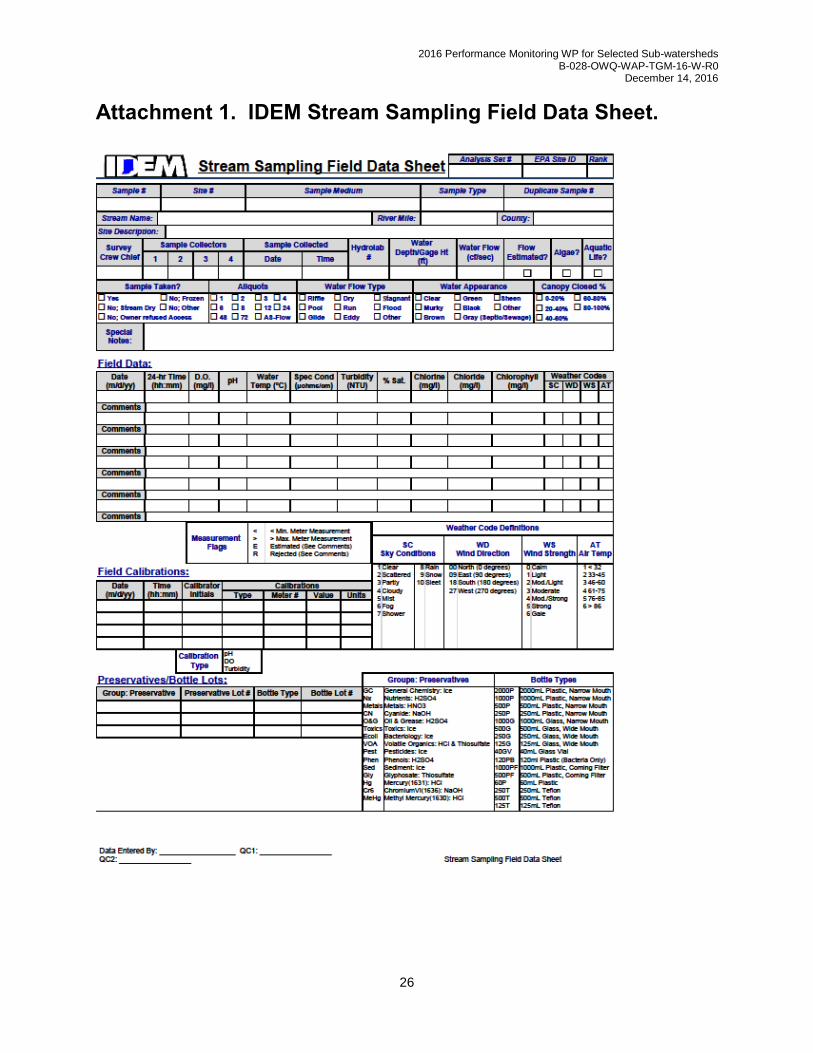
2016 Performance Monitoring WP for Selected Sub-watersheds B-028-OWQ-WAP-TGM-16-W-R0
December 14, 2016
26
Attachment 1. IDEM Stream Sampling Field Data Sheet.

2016 Performance Monitoring WP for Selected Sub-watersheds B-028-OWQ-WAP-TGM-16-W-R0
December 14, 2016
27
Attachment 2. IDEM Fish Collection Data Sheet (front).

2016 Performance Monitoring WP for Selected Sub-watersheds B-028-OWQ-WAP-TGM-16-W-R0
December 14, 2016
28
Attachment 2. IDEM Fish Collection Data Sheet (back)

2016 Performance Monitoring WP for Selected Sub-watersheds B-028-OWQ-WAP-TGM-16-W-R0
December 14, 2016
29
Attachment 3. IDEM Office of Water Quality Macroinvertebrate Header Form

2016 Performance Monitoring WP for Selected Sub-watersheds B-028-OWQ-WAP-TGM-16-W-R0
December 14, 2016
30
Attachment 4. IDEM OWQ Biological Qualitative Habitat Evaluation Index (front).

2016 Performance Monitoring WP for Selected Sub-watersheds B-028-OWQ-WAP-TGM-16-W-R0
December 14, 2016
31
Attachment 4 (continued). IDEM OWQ Biological QHEI (back).

2016 Performance Monitoring WP for Selected Sub-watersheds B-028-OWQ-WAP-TGM-16-W-R0
December 14, 2016
32
Attachment 5. IDEM Biological Samples Field Chain of
Custody Form.
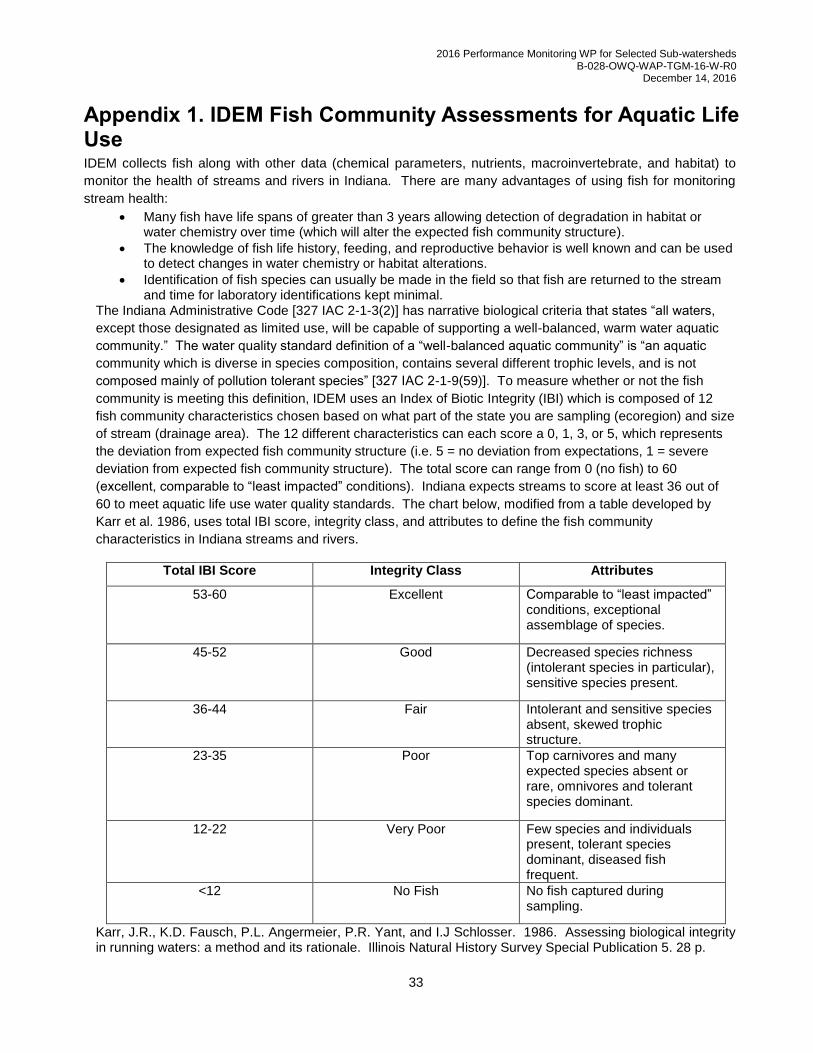
2016 Performance Monitoring WP for Selected Sub-watersheds B-028-OWQ-WAP-TGM-16-W-R0
December 14, 2016
33
Appendix 1. IDEM Fish Community Assessments for Aquatic Life Use IDEM collects fish along with other data (chemical parameters, nutrients, macroinvertebrate, and habitat) to
monitor the health of streams and rivers in Indiana. There are many advantages of using fish for monitoring
stream health:
Many fish have life spans of greater than 3 years allowing detection of degradation in habitat or water chemistry over time (which will alter the expected fish community structure).
The knowledge of fish life history, feeding, and reproductive behavior is well known and can be used to detect changes in water chemistry or habitat alterations.
Identification of fish species can usually be made in the field so that fish are returned to the stream and time for laboratory identifications kept minimal.
The Indiana Administrative Code [327 IAC 2-1-3(2)] has narrative biological criteria that states “all waters,
except those designated as limited use, will be capable of supporting a well-balanced, warm water aquatic
community.” The water quality standard definition of a “well-balanced aquatic community” is “an aquatic
community which is diverse in species composition, contains several different trophic levels, and is not
composed mainly of pollution tolerant species” [327 IAC 2-1-9(59)]. To measure whether or not the fish
community is meeting this definition, IDEM uses an Index of Biotic Integrity (IBI) which is composed of 12
fish community characteristics chosen based on what part of the state you are sampling (ecoregion) and size
of stream (drainage area). The 12 different characteristics can each score a 0, 1, 3, or 5, which represents
the deviation from expected fish community structure (i.e. 5 = no deviation from expectations, 1 = severe
deviation from expected fish community structure). The total score can range from 0 (no fish) to 60
(excellent, comparable to “least impacted” conditions). Indiana expects streams to score at least 36 out of
60 to meet aquatic life use water quality standards. The chart below, modified from a table developed by
Karr et al. 1986, uses total IBI score, integrity class, and attributes to define the fish community
characteristics in Indiana streams and rivers.
Total IBI Score Integrity Class Attributes
53-60 Excellent Comparable to “least impacted” conditions, exceptional assemblage of species.
45-52 Good Decreased species richness (intolerant species in particular), sensitive species present.
36-44 Fair Intolerant and sensitive species absent, skewed trophic structure.
23-35 Poor Top carnivores and many expected species absent or rare, omnivores and tolerant species dominant.
12-22 Very Poor Few species and individuals present, tolerant species dominant, diseased fish frequent.
<12 No Fish No fish captured during sampling.
Karr, J.R., K.D. Fausch, P.L. Angermeier, P.R. Yant, and I.J Schlosser. 1986. Assessing biological integrity in running waters: a method and its rationale. Illinois Natural History Survey Special Publication 5. 28 p.

2016 Performance Monitoring WP for Selected Sub-watersheds B-028-OWQ-WAP-TGM-16-W-R0
December 14, 2016
34
Some examples of metrics and fish specimens for the Index of Biotic Integrity (IBI) looking at species
composition, trophic levels, and tolerance to water pollution or habitat disturbance.
1. Number of Species (generally more species = better quality stream)
2. Number of Darter, Madtom, Sculpin Species (species require high dissolved oxygen and clean rocky substrates so higher number = better quality stream)
o Examples: rainbow darter, brindled madtom, mottled sculpin
% Large River Individuals (species require habitats typical in great rivers in terms of bottom
substrates, current velocity, backwater areas, etc. so higher percentage = better quality river)
o Examples: chestnut lamprey, channel catfish, bullhead minnow, silver chub
3. % Headwater Individuals (species in small streams occupying permanent habitat with low environmental stress so greater percentage = better quality stream)
o Examples: western blacknose dace, southern redbelly dace, fantail darter
Number of Sunfish or Centrarchidae Species (species occupy pools which act as “sinks” for potential
pollutants and silt so fewer number of these species = low quality stream)
o Examples: rock bass, bluegill, largemouth bass
4. Number of Sucker or Round Body Sucker Species (species do not tolerate habitat and water quality degradation so more = better quality stream)
o Examples: black redhorse, northern hog sucker
Number of Minnow Species (generally more minnow species = better quality stream)
o Examples: spotfin shiner, silverjaw minnow, hornyhead chub
5. Number of Sensitive Species (species sensitive to pollution so more species = better quality stream) o Examples: greenside darter, smallmouth bass, longear sunfish
6. % Tolerant Individuals (species tolerant to pollution so greater percentage = low quality stream) o Examples: yellow bullhead, green sunfish, central mudminnow
7. % Omnivore/Detritivore Individuals (species that consume at least 25% plant and 25% animal material which makes them opportunistic feeders when other food sources are scarce; thus, greater percentage = lower quality stream)
o Examples: bluntnose minnow, white sucker, gizzard shad
8. % Insectivore/Invertivore Individuals (species whose diet is mainly benthic insects so the metric is a reflection of the food source; thus, lower percentage = lower quality stream)
o Examples: blackstripe topminnow, emerald shiner, logperch

2016 Performance Monitoring WP for Selected Sub-watersheds B-028-OWQ-WAP-TGM-16-W-R0
December 14, 2016
35
9. % Carnivore Individuals (species whose diet is carnivorous and also reflects the availability of the food source; too high or too low percentage of carnivores = lower quality stream and imbalance of trophic levels)
o Examples: spotted bass, grass pickerel
% Pioneer Individuals (species that are first to colonize a stream after environmental disturbance so
higher percentage of pioneer individuals = lower quality stream)
o Examples: creek chub, central stoneroller, johnny darter
10. Number of Individuals (generally more individuals = better quality stream)
11. % Simple Lithophilic Individuals (species that require clean gravel or cobble for successful reproduction since they simply broadcast their eggs on the substrate, fertilize, and provide no parental care; thus, heavy siltation or environmental disturbance will result in a lower percentage of simple lithophilic species = lower quality stream)
o Examples: bigeye chub, striped shiner, orangethroat darter
12. % Individuals with Deformities, Eroded Fins, Lesions, and Tumors (DELT’s) (diseased individuals with external anomalies as a result of bacterial, fungal, viral, and parasitic infections, chemical pollutants, overcrowding, improper diet, and other environmental degradation. Percentages should be absent or very low naturally so higher percentage = low quality stream)
o Examples: deformed blackstripe topminnow, creek chub with tumors

2016 Performance Monitoring WP for Selected Sub-watersheds B-028-OWQ-WAP-TGM-16-W-R0
December 14, 2016
36
Appendix 2. Calculating IDEM Macroinvertebrate Index of Biotic Integrity (mIBI) The purpose of this document is to describe the laboratory processing and data analysis procedures used by the Indiana Department of Environmental Management (IDEM) to calculate the macroinvertebrate Index of Biotic Integrity (mIBI). Standard operating procedures (SOPs) are being developed to describe these processes, but it may be some time before they are finalized. An SOP describing the methods used by IDEM to collect macroinvertebrate samples with a multi-habitat (MHAB) sampling method is available at http://monitoringprotocols.pbworks.com/f/S-001-OWQ-W-BS-10-S-R0.pdf. The index period for collection of macroinvertebrate samples with the MHAB sampling method is July 15 to October 30. The entire sample is processed in the laboratory as subsampling has already been performed in the field. All macroinvertebrate individuals are counted with the exception of empty snail and clam shells, micro-crustaceans (Ostracoda, Branchiopoda, Copepoda), larval and pupal insect exuviae, and terrestrial insects (including the terrestrial adults of aquatic insect larvae); invertebrate specimens missing their head are also excluded. The level of taxonomic resolution used in the identification of macroinvertebrates may depend in large part on the condition (instar and physical condition) of the specimens and the availability of taxonomic resources that are comprehensive and appropriate for Indiana's fauna. Specimens are generally identified to the “lowest practical" taxonomic level. Oligochaeta (aquatic worms, Hirudinea and Branchiobdellida), Planaria and Acari are only identified to family or a higher level; freshwater snails and clams are identified to genus; freshwater crustacea are identified to genus (Amphipoda and Isopoda) or species (Decapoda); aquatic insects are identified to family (Collembola and several Dipteran families) or genus and species (all other insects). The following table lists insect genera that are often identified to species (and may contain multiple species in a sample) and taxonomic resources commonly used by IDEM biologists for their identification (full citations for these resources are listed in the Taxonomic References at the end of this document. Ephemeroptera: Baetidae: Baetis (separate B. intercalaris and B. flavistriga with Moriharra and McCafferty 1979, leave everything else at Baetis) Caenidae: Caenis: Provonsha 1990 Heptageniidae: Mccaffertium (formerly Stenonema subgenus Mccaffertium): Bednarik and McCafferty 1979 Odonata: Gomphidae: Dromogomphus: Westfall and Tennessen 1979 Coenagrionidae: Argia and Enallagma: Westfall and May 1996 Hemiptera: Corixidae: Trichocorixa and Palmacorixa: Hungerford 1948, Hilsenhoff 1984 Megaloptera: Corydalidae: Chauliodes and Nigronia: Rasmussen and Pescador 2002 Coleoptera: Haliplidae: Peltodytes: Brigham 1996 Dytiscidae: Neoporus, Heterosternuta, Laccophilus, Coptotomus: Larson et al. 2000. Hydrophilidae: Tropisternus, Berosus, Enochrus: Hilsenhoff 1995A and 1995B. Elmidae: Stenelmis, Dubiraphia, Optioservus: Hilsenhoff and Schmude, Hilsenhoff 1982 Trichoptera: Philopotamidae: Chimarra: Hilsenhoff 1982 Leptoceridae: Nectopsyche: Glover and Floyd 2004 Hydropsychidae: Hydropsyche: Schuster and Etnier 1978 Diptera: Chironomidae: Ablabesmyia: Roback 1985 (sub-genus/ species group) Polypedilum: Maschwitz and Cook 2000 (sub-genus/ species group) Cricotopus/Orthocladius: Merritt et al 2007 (sub-genus/ species group) After all organisms in the sample have been identified to the lowest practical taxon, those taxa are then associated with their corresponding tolerance, functional feeding group and habit values (found in the spreadsheet "Indiana Macroinvertebrate Attributes"). Organisms without a tolerance value, functional feeding

2016 Performance Monitoring WP for Selected Sub-watersheds B-028-OWQ-WAP-TGM-16-W-R0
December 14, 2016
37
group or habit are not included in the calculations for those specific metrics (this may become more evident while looking at the metric example on page 3). For taxa metrics, all of the taxa listed for a specific group (EPT, Diptera) are counted, regardless of level of identification (i.e.,. if there were 4 taxa under the Chironomidae family (1 family level ID, 1 Cricotopus genus level ID, and 2 distinct species level IDs under the Cricotopus genus) this would be considered 4 taxa). The metrics are then calculated as follows: 1 - Total Number of Taxa: Numerical count of all identified taxa in the sample 2 - Total Number of Individuals: Numerical count of the number of individual specimens in the sample 3 - Total Number of EPT Taxa: Numerical count of all Ephemeroptera, Plecoptera and Trichoptera taxa in the sample 4 - Total Number of Diptera Taxa: Numerical count of all Diptera taxa in the sample 5 - % Orthocladiinae + Tanytarsini of Chironomidae: Number of individuals in the chironomid subfamily Orthocladiinae and tribe Tanytarsini divided by the total number of Chironomidae in the sample 6 - % Non-insect (minus crayfish): Number of individuals, except for crayfish, that are not in the Class Insecta (Isopoda, Amphipoda, Acari, snails, freshwater clams, Oligochaeta, Nematoda, Nematomorpha) divided by the total number of individuals in the sample 7 - % Intolerant: Number of individuals with a tolerance value of 0-3 divided by the total number of individuals in the sample 8 - % Tolerant: Number of individuals with a tolerance value of 8-10 divided by the total number of individuals in the sample 9 - % Predators: Number of individuals with a functional feeding group designation of "Predator" divided by the total number of individuals in the sample 10 - % Shredders + Scrapers: Combined number of individuals in the functional feeding groups "Shredder" and "Scraper" divided by the total number of individuals in the sample 11 - % Collector-Filterers: Number of individuals in the functional feeding group "Collector-Filterer" divided by the total number of individuals in the sample 12 - % Sprawlers: Number of individuals with a habit specificity of "Sprawler" divided by the total number of individuals in the sample These metric values are then scored as a 1, 3 or 5 according to the criteria in the following table:
Metric 1 3 5
Number of Taxa < 21 ≥ 21 and <41 ≥ 41
Number of Individuals < 129 ≥ 129 and < 258 ≥ 258
Number of EPT Taxa
Drainage Area: < 5 mi2 < 2 ≥ 2 and < 4 ≥ 4
Drainage Area: ≥ 5 and < 50 mi2 < 4 ≥ 4 and < 8 ≥ 8
Drainage Area: ≥ 50 mi2 < 6 ≥ 6 and < 12 ≥ 12
% Orthocladiinae + Tanytarsini of Chironomidae ≥ 47 ≥ 24 and < 47 < 24
% Non-insects Minus Crayfish ≥ 35 ≥ 18 and < 35 < 18
Number of Diptera Taxa < 7 ≥ 7 and < 14 ≥ 14
% Intolerant < 15.9 ≥ 15.9 and < 31.8 ≥ 31.8
% Tolerant ≥ 25.3 ≥ 12.6 and < 25.3 < 12.6
% Predators < 18 ≥ 18 and < 36 ≥ 36
% Shredders + Scrapers < 10 ≥ 10 and < 20 ≥ 20
% Collector-Filterers ≥ 20 ≥ 10 and < 20 < 10
% Sprawlers < 3 ≥ 3 and < 6 ≥ 6
Most scoring classifications are the same regardless of stream drainage area; the exception is the "Number of EPT Taxa" metric which increases with increasing drainage area. After all metrics have been scored, the individual metric scores are summed and the total is the mIBI score for that particular site. Scores less than 36 are considered impaired while those greater than or equal to 36 are unimpaired.
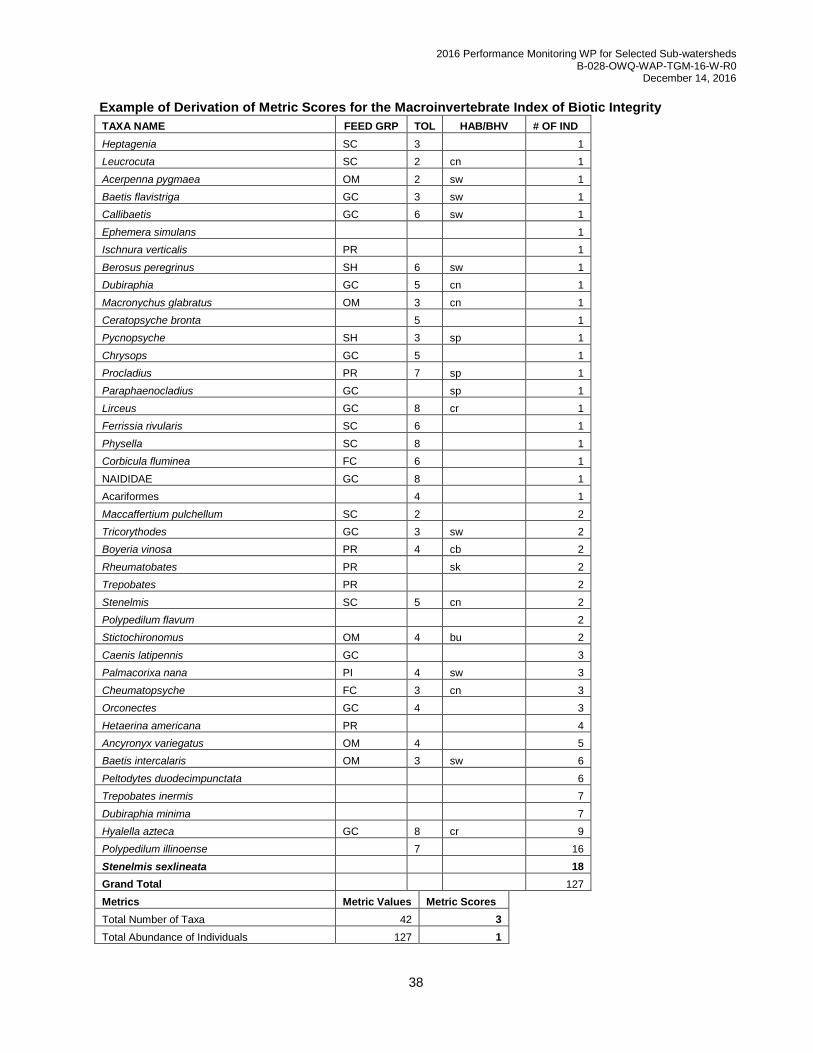
2016 Performance Monitoring WP for Selected Sub-watersheds B-028-OWQ-WAP-TGM-16-W-R0
December 14, 2016
38
Example of Derivation of Metric Scores for the Macroinvertebrate Index of Biotic Integrity
TAXA NAME FEED GRP TOL HAB/BHV # OF IND
Heptagenia SC 3
1
Leucrocuta SC 2 cn 1
Acerpenna pygmaea OM 2 sw 1
Baetis flavistriga GC 3 sw 1
Callibaetis GC 6 sw 1
Ephemera simulans
1
Ischnura verticalis PR
1
Berosus peregrinus SH 6 sw 1
Dubiraphia GC 5 cn 1
Macronychus glabratus OM 3 cn 1
Ceratopsyche bronta 5
1
Pycnopsyche SH 3 sp 1
Chrysops GC 5
1
Procladius PR 7 sp 1
Paraphaenocladius GC sp 1
Lirceus GC 8 cr 1
Ferrissia rivularis SC 6
1
Physella SC 8
1
Corbicula fluminea FC 6
1
NAIDIDAE GC 8
1
Acariformes 4
1
Maccaffertium pulchellum SC 2
2
Tricorythodes GC 3 sw 2
Boyeria vinosa PR 4 cb 2
Rheumatobates PR
sk 2
Trepobates PR
2
Stenelmis SC 5 cn 2
Polypedilum flavum
2
Stictochironomus OM 4 bu 2
Caenis latipennis GC
3
Palmacorixa nana PI 4 sw 3
Cheumatopsyche FC 3 cn 3
Orconectes GC 4
3
Hetaerina americana PR
4
Ancyronyx variegatus OM 4
5
Baetis intercalaris OM 3 sw 6
Peltodytes duodecimpunctata
6
Trepobates inermis
7
Dubiraphia minima
7
Hyalella azteca GC 8 cr 9
Polypedilum illinoense 7
16
Stenelmis sexlineata
18
Grand Total
127
Metrics Metric Values Metric Scores
Total Number of Taxa 42 3
Total Abundance of Individuals 127 1

2016 Performance Monitoring WP for Selected Sub-watersheds B-028-OWQ-WAP-TGM-16-W-R0
December 14, 2016
39
Number of EPT Taxa 13 5
% Orthocladinae + Tanytarsinii of Chironomidae 4.55 5
% Non-Insects - Crayfish 11.81 5
Number of Diptera Taxa 6 1
% Intolerant Taxa (Score 0 - 3) 14.96 1
% Tolerant Taxa (Score 8 - 10) 9.45 5
% Predators 9.45 1
% Shredders + Scrapers 7.87 1
% Collector-Filterers 3.15 5
% Sprawlers 2.36 1
MIBI Score
34
Taxonomic References
Bednarik A.F. and W.P. McCafferty. 1979. Biosystematic revision of the genus Stenonema Ephemeroptera: Heptageniidae). Canadian Bulletin of Fisheries and Aquatic Sciences 201: 1-73. http://www.famu.org/mayfly/pubs/pub_b/pubbednarika1979p1.pdf Brigham, W.L. 1996. Key to adult Peltodytes of the U.S. and Canada (Coleoptera: Haliplidae). http://www.inhs.uiuc.edu/biod/waterbeetles/haliplidae/peltodytes/key-us.html Glover, J.B. and M. A. Floyd. 2004. Larvae of the genus Nectopsyche (Trichoptera:Leptoceridae) in eastern North America, including a new species from North Carolina. Journal of the North American Benthological Society 23(3) 526-541. Hilsenhoff WL. 1982. Using a biotic index to evaluate water quality in streams. Department of Natural Resources, Technical Bulletin 132, Madison, Wisconsin. http://www.famu.org/mayfly/pubs/pub_h/pubhilsenhoffw1982p1.pdf Hilsenhoff, W.L. 1984. Aquatic Hemiptera of Wisconsin. Great Lakes Entomologist 17: 29-50. Hilsenhoff, W.L. 1995. Aquatic Hydrophilidae and Hydraenidae of Wisconsin (Coleoptera). I. Introduction, key to genera of adults, and distribution, habitat, life cycle, and identification of species of Helophorus Fabricius, Hydrochus Leach, and Berosus Leach (Hydrophilidae), and Hydraenidae. The Great Lakes Entomologist 28(1): 25-53. Hilsenhoff, W.L. 1995. Aquatic Hydrophilidae and Hydraenidae of Wisconsin (Coleoptera). II. Introduction, key to genera of adults, and distribution, habitat, life cycle, and identification of species of Hydrobini and Hydrophili (Hydrophilidae: Hydrohilinae). The Great Lakes Entomologist 28(2): 97-126. Hilsenhoff, W.L. and K.L. Schmude. 1992. Riffle beetles of Wisconsin (Coleoptera: Dryopidae, Elmidae, Lutrochidae, Psepheniidae) with notes on distribution, habitat, and identification. The Great Lakes Entomologist 25(3): 191-213. Hungerford H.B. 1948. The Corixidae of the Western Hemisphere (Hemiptera). Reprint of The University of Kansas Science Bulletin 32:1-827, reprinted (1977) by Entomological Reprint Specialists: Los Angeles, California. Larson, D.J., Y. Alarie, and R.E. Roughley. 2000. Predaceous Diving Beetles (Coleoptera: Dytiscidae) of the Nearctic Region, with emphasis on the fauna of Canada and Alaska. NRC Research Press, Ottawa. Maschwitz, D.E. and E. F. Cook. 2000. Revision of the Nearctic Species of the Genus Polypedilum Kieffer (Diptera: Chironomidae) in the Subgenera P. (Polypedilum) Kieffer and P. (Urespedilum) Oyewo and Saether. Ohio Biological Survey Bulletin (New Series) 12(3). 135 pp.

2016 Performance Monitoring WP for Selected Sub-watersheds B-028-OWQ-WAP-TGM-16-W-R0
December 14, 2016
40
Morihara D.K. and McCafferty W.P. 1979. The Baetis larvae of North America (Ephemeroptera: Baetidae). Transactions of the American Entomological Society 105:139-221. http://www.famu.org/mayfly/pubs/pub_m/pubmoriharad1979p139.pdf Provonsha A.V. 1990. A revision of the genus Caenis in North America (Ephemeroptera: Caenidae). Transactions of the American Entomological Society 116:801-884. http://www.famu.org/mayfly/pubs/pub_p/pubprovonshaa1990p801.pdf Rasmussen, A.K. and M.L. Pescador. 2002. A Guide to the Megaloptera and Aquatic Neuroptera of Florida. http://publicfiles.dep.state.fl.us/dear/labs/biology/biokeys/megaloptera.pdf Roback, S.S. 1985. The immature chironomids of the eastern United States VI - genus Ablabesmyia. Proceedings of the Academy of Natural Sciences of Philadelphia 137(2): 153-212. Schuster, G.A. and D.A. Etnier. 1978. Manual for the Identification of the Larvae of the Caddisfly Genera Hydropsyche Pictet and Symphitopsyche Ulmer in Eastern and Central North America (Trichoptera:Hydropsychidae) EPA -600-4-78-060. http://www.epa.gov/bioiweb1/pdf/EPA-600-4-78-060AManualfortheidenticationofthecaddisfly_shusterandetnier.pdf Westfall, M.J., Jr. and M.L. May. 2006. Damselflies of North America (Revised Edition). Westfall, M.J. Jr. and K.J. Tennessen. 1979. Taxonomic clarification within the genus Dromogomphus Selys (Odonata: Gomphidae). Florida Entomologist 62(3). 266-273. http://fulltext10.fcla.edu/DLData/SN/SN00154040/0062_003/98p0013e.pdf If you have further questions regarding the IDEM mIBI please contact: Paul D. McMurray, Jr. Environmental Manager Indiana Department of Environmental Management
Office of Water Quality, Watershed Assessment and Planning Branch
Probabilistic Monitoring Section 100 N. Senate Ave. MC65-40-2 Shadeland Indianapolis, IN 46204-2251 317-308-3210 [email protected] Todd E. Davis Environmental Manager Indiana Department of Environmental Management
Office of Water Quality, Watershed Assessment and Planning Branch Probabilistic Monitoring Section 100 N. Senate Ave. MC65-40-2 Shadeland Indianapolis, IN 46204-2251 317-308-3188 [email protected]