2016 HUMAN CAPITAL INVESTMENT CONFERENCE. talent... · 2016-11-13 · 2016 HUMAN CAPITAL INVESTMENT...
34
2016 HUMAN CAPITAL INVESTMENT CONFERENCE RITZ-CARLTON CHICAGO | NOVEMBER 15-16, 2016 UTILIZING TALENT ANALYTICS AND METRICS TO MAKE BETTER WORKFORCE DECISIONS Helen Friedman Workforce Analytics & Planning, Global Practice Leader, Willis Towers Watson Rick M. Sherwood Client Relationship Director, Willis Towers Watson
Transcript of 2016 HUMAN CAPITAL INVESTMENT CONFERENCE. talent... · 2016-11-13 · 2016 HUMAN CAPITAL INVESTMENT...

2016 HUMAN CAPITAL INVESTMENT CONFERENCE RITZ-CARLTON CHICAGO | NOVEMBER 15-16, 2016
UTILIZING TALENT ANALYTICS AND METRICS TO MAKE BETTER WORKFORCE DECISIONS
Helen Friedman Workforce Analytics &
Planning, Global Practice Leader,
Willis Towers Watson
Rick M. Sherwood Client Relationship Director, Willis Towers Watson

Utilizing Talent Analytics and Metrics to Make Better Workforce Decisions
© 2016 Willis Towers Watson. All rights reserved.
Helen Friedman and Rick Sherwood
November 15, 2016
Agenda
© 2016 Willis Towers Watson. All rights reserved. Proprietary and Confidential. For Willis Towers Watson and Willis Towers Watson cl ient use only. 2
Context setting: We live in a world of change and variance
Establishing metrics that matter
Harnessing your data for evidence-based workforce management
The art of what’s possible: The Allina Health story
Taking the next step

Current outlook for Human Capital Risk:
Four near-term trends impacting talent productivity and quality…
1 Skill
Shortages
2 Contingent
Workforce
3 Alternative Work
Arrangements
4 Workforce
Wellness
© 2016 Willis Towers Watson. All rights reserved. Proprietary and Confidential. For Willis Towers Watson and Willis Towers Watson cl ient use only. 3

Pace of change Time to reach 50 million users
Telephone Radio TV Internet Angry Birds Space
75 Years
38 Years
13 Years
4 Years 35 Days
Source: Attributed to Carl Benedikt Frey and Michael Osborne (Oxford Martin School, University of Oxford) and G. Kofi Annan, author; note: some figures disputed
© 2016 Willis Towers Watson. All rights reserved. Proprietary and Confidential. For Willis Towers Watson and Willis Towers Watson cl ient use only. 4

Variance matters: What’s worth analyzing? Challenges attracting employees in key workforce segments remain high overall—even more so for organizations operating in emerging economies
Mature Markets Emerging Markets
28%
45%
55% 54% 56%
44%
57%
66%
77% 76%
20%
10%
0%
30%
40%
50%
60%
70%
80%
90%
All employees Diverse employee
populations
Critical-skill employees
High-potential employees
Top-performing employees
All employees Diverse employee
populations
Critical-skill employees
High-potential employees
Top-performing employees
Attraction Challenges
Nearly half (48%) of employers report
hiring activity increased
© 2016 Willis Towers Watson. All rights reserved. Proprietary and Confidential. For Willis Towers Watson and Willis Towers Watson cl ient use only. 5
Source: Willis Towers Watson 2016 Talent Management & Rewards Survey

Establishing metrics that matter
© 2016 Willis Towers Watson. All rights reserved. Proprietary and Confidential. For Willis Towers Watson and Willis Towers Watson cl ient use only. 6

What gets leadership attention?
2016 Wll1s T owers Watson All rights reseiVed Propnetary and Confidential For Willis Towers Watson and WilliS Towers Watso n client use only WillisTowerswatson 1•11111•1 7

Group discussion: Business/Organizational strategy
© 2016 Willis Towers Watson. All rights reserved. Proprietary and Confidential. For Willis Towers Watson and Willis Towers Watson cl ient use only. 8
As you think about your organization overall and key priorities over the
next 2-3 years, what’s most important and why?
First, answer the question for your organization and then compare notes
with others at your table to see if they have similar priorities?

© 2016 Willis Towers Watson. All rights reserved. Proprietary and Confidential. For Willis Towers Watson and Willis Towers Watson cl ient use only. 9
Group discussion: Customer value drivers
Which of the following are the primary drivers of customer experience and profitable
revenue growth for your organization (no more than four factors can be selected)?
Image
Having preferred
brand recognition
Quality
Being perceived as
having superior
services and
products
Speed
Acting quickly
Size / Scale
Being largest
provider of
services or
products
Breadth of
Services
Offering a wide
variety of services
and products
Customer Service
Being responsive;
having strong
relationships
Efficiency
Producing services
and products with
minimal wasted
effort
Cost
Offering the lowest
cost or “value” for
services or products
delivered
Reliability
Providing
consistent services
and products over
time
Other (please
specify):
Incremental
Innovation
Being able to
improve existing
services and
products
Proximity
Being easily
available to internal
and/or external
customers
Customization /
Tailoring
Meeting exacting
customer
requirements
Large-Scale
Innovation
Transforming the
landscape of
services and
products

When it comes to selecting metrics, focus should be on factors
where business value is driven
Each point of the talent life cycle presents a different lens in which organizations can
track and monitor key metrics and outcomes…
…..and the types and number of metrics that should be tracked depend on a variety of key factors, including :
How relevant is the metric to the overall organizational strategy?
What is the depth of the available data?
Will tracking the metric allow for meaningful impact on the organization?
Does the metric allow us to get better risk leverage?
© 2016 Willis Towers Watson. All rights reserved. Proprietary and Confidential. For Willis Towers Watson and Willis Towers Watson cl ient use only. 10

© 2016 Willis Towers Watson. All rights reserved. Proprietary and Confidential. For Willis Towers Watson and Willis Towers Watson cl ient use only. 11
Please identify the top-7 most influential factors to ensure that you have the right talent, at
the right time, in the right place, with the right skills at the right cost to drive organizational or business unit value.
Group discussion: Metrics that matter
Sourcing and
Selection
Assessment Development
and
Deployment
Rewards Engagement
and Retention
Leadership Operational
Efficiency /
Controls
Organizational
Outcomes
Number of
New Hires
Proficiency
Level
Attendance in
Training
Programs
Base Pay
Distribution
Engagement
Distribution
Managerial
Capability
Headcount Revenue per
Employee
Internal vs.
External Fill
Ratio
Promotion
Likelihood
Cost of Training Overtime Cost
and Volatility
Turnover by
Performance
Rating
Span of Control Vacancy or Run
Rate
(Percentage of
Open Positions)
Revenue per
Unit of
Compensation
Time to Fill Performance
Rating
Distribution
Internal
Transfers
Bonus
Distribution
Turnover by
Tenure
Performance
Distribution
Workforce
Effective
Capacity or
“Utilization”
Operating Profit
/ NOI per
Employee
Quality of Hire Potential (e.g.,
learning agility)
Rating
Cross-Function
/ Division
Transfers
Performance-
Based Pay
Change
Turnover in
Pivotal Roles
Time in Position Productivity per
Employee
Operating Profit
/ NOI per Unit of
Compensation
New Hire Pay
Premium
Percent on
Performance
Plans
Cross-
Geography
Transfers
Allocation of
Fixed vs.
Variable Labor
Cost
Turnover Cost Turnover and
Retirement Risk
Productivity per
Unit of
Compensation
New Customer
Volume per
Sales Rep
New Hire
Retention
Personality
Assessment
Time in Position Total Labor
Cost
Retirement by
Age/Service
Replacement
Risk
Error Rate by
Team Tenure
Average New
Sale per Unit of
Sales Rep
Compensation
Other: Other: Other: Other: Other: Other: Other: Other:

Group discussion: Metrics overall are interesting … metrics by
segments tend to be informative Looking at your top-seven metrics in combination, select the five highest value segments by
which to dissect these metrics overall. How do these selections compare to current segmentations being used by your organization?
Examples of Value-Based Segmentation
© 2016 Willis Towers Watson. All rights reserved. Proprietary and Confidential. For Willis Towers Watson and Willis Towers Watson cl ient use only. 12
Basic Next-Generation Advanced
Structural Demographic Strategic
Business Unit Age Pivotal Role
Region / Location Service Performance Rating
Department /
Function
Time in Position Potential Rating
Grade / Level Diversity Growth Area
Job Family Education Talent Pools
Employee Type
(FLSA)
Lifestyle Choices Pipeline / Feeder
Role

Last concept: Sequencing … not all measures can or should be included in
Version 1.0
SAMPLE
© 2016 Willis Towers Watson. All rights reserved. Proprietary and Confidential. For Willis Towers Watson and Willis Towers Watson cl ient use only. 13

Organizational Value
Fe
as
ibilit
y
High Low
Hig
h
© 2016 Willis Towers Watson. All rights reserved. Proprietary and Confidential. For Willis Towers Watson and Willis Towers Watson cl ient use only. 14
Lo
w
Group discussion: Since we already picked metrics of high value,
how feasible is it to produce your selected metrics today?

Bringing it all together
Prioritization Identifying direct and
indirect representations of
workforce factors driving
strategy execution
Strategic Focus Focusing on business
drivers to both guide and
stress test metric selection
Sequencing Recognizing that—to be
strtegic in the long term—it
is critical to be practical in
the short term
Segmentation Telling the story behind the
story … looking for variance
that will materially change
overall results
Effective
Workforce
Dashboard
© 2016 Willis Towers Watson. All rights reserved. Proprietary and Confidential. For Willis Towers Watson and Willis Towers Watson cl ient use only. 15

Harnessing your data for evidence-
based workforce management
© 2016 Willis Towers Watson. All rights reserved. Proprietary and Confidential. For Willis Towers Watson and Willis Towers Watson cl ient use only. 16

Analytic methods can vary significantly
Outcome
Modeling/
Controlled
Evaluation Projections/
Future-State
Modeling
Trending
Bench-
marking
External
Reference Point
Directional Future Risk Outcome
Insight Management Optimization
Return on Investment
How are we performing
relative to benchmarks?
Foundational
Complex
Analytical
Sophisticatio
n
How are we
performing over time?
How do we predict
performance?
How do we drive
performance?
Predictive Analytics
How are we
performing today?
Internal
Tracking
Dashboard/
Metrics
Reporting
Global
Data
Warehouse
How do we access data
to monitor performance?
Data
Management
We started
© 2016 Willis Towers Watson. All rights reserved. Proprietary and Confidential. For Willis Towers Watson and Willis Towers Watson cl ient use only. 17

Thinking broadly about data to provide insights on workforce
dynamics
© 2016 Willis Towers Watson. All rights reserved. Proprietary and Confidential. For Willis Towers Watson and Willis Towers Watson cl ient use only. 18

Internal structured data: Informs current-state “shape” of the
organization and workforce movement by level, etc.
Outsourced function Typical Example: Manufacturing
© 2016 Willis Towers Watson. All rights reserved. Proprietary and Confidential. For Willis Towers Watson and Willis Towers Watson cl ient use only. 19
Highly-technical job family

Internal unstructured data: Highlights potential future-state skills
needed and current-state gaps
© 2016 Willis Towers Watson. All rights reserved. Proprietary and Confidential. For Willis Towers Watson and Willis Towers Watson cl ient use only. 20
Analytical oSpeed t
wo execution
rship
Business Acumen Relationship BuildingAgility
Leadershipmanagement risk taking
FlexibilityGlobal Mindset
TEAMWORK
CREATIVITY
Collaboration

External structured data: Identifies market benchmarks as reference
points to inform internal decision-making
Base Pay
Bonus
Total Rewards
Market competitiveness: Most think they are paid at or above market Overall, how do you think the value of each of the following compares to that offered for similar positions in
other organizations?
Pay fairness
Half think they are paid
fairly, but 1 in 5 disagree 50 %
Paid fairly compared to
others in other companies
51%
Paid fairly compared to
others in my organization
Source: Willis Towers Watson 2016 Talent Management & Rewards Survey
© 2016 Willis Towers Watson. All rights reserved. Proprietary and Confidential. For Willis Towers Watson and Willis Towers Watson cl ient use only. 21
23% 38% 39%
33% 36% 31%
18% 43% 39%
0% 10% 20% 30% 40% 50% 60% 70% 80% 90% 100%
Below Average Average Above Average

External unstructured data: Leverages market insights to identify
Growth in share
of non-employee talent expected over next three
years
25% 24% 54% 46%
emerging trends
The use of non-employee talent is increasing and having an impact on businesses
Source: Willis Towers Watson 2016 Talent Management & Rewards Survey
© 2016 Willis Towers Watson. All rights reserved. Proprietary and Confidential. For Willis Towers Watson and Willis Towers Watson cl ient use only. 22
Of all managers
say they manage at least one contingent worker
on their team
Of all managers
say they manage at least one contractor
Of companies
report changing their workforce activities enabling
them to use more non-employee
talent due to technology now or in in the next
three years

Group discussion: What’s been your experience?
© 2016 Willis Towers Watson. All rights reserved. Proprietary and Confidential. For Willis Towers Watson and Willis Towers Watson cl ient use only. 23
To what degree do you leverage:
Internal structured data
Internal unstructured data
External structured data
External unstructured data
What would be the one new dataset that you would consider based on this discussion?

Insert text
Insert text
Technology—like the WTW Talent Analytics Software—can and
should enable and scale your approach
Insert text
Review headcount trends, labor flows,
labor composition and key counts
Drill into various aspects of the employment
life cycle (including Sourcing and Selection,
Performance, Rewards, Development and
Retention), Diversity and Manager
Effectiveness
Support annual and multi-year workforce
planning activities, including automated
development of baseline assumptions
based on historical experience by major
role category
Create and publish additional
dashboards to support HR or business-
generated research questions or
address unique needs for specific
business areas (for Super Users)
Standard Workforce
Dashboard (Module 1)
Out-of-the-Box
Workforce Analytics (Module 1)
Standard Projections (Module 2)
Designer/Custom
Dashboards (Module 3)
Supports controlled evaluation to highlight
which individual variable “cause” various
workforce outcomes, all else equal
Outcome Modeling (Beta)
© 2016 Willis Towers Watson. All rights reserved. Proprietary and Confidential. For Willis Towers Watson and Willis Towers Watson cl ient use only. 24

The art of what’s possible: The Allina
Health story
© 2016 Willis Towers Watson. All rights reserved. Proprietary and Confidential. For Willis Towers Watson and Willis Towers Watson cl ient use only. 25

Allina Health leverages a strong workforce
to deliver exceptional health care and support services
to the people in its communities.
Allina Health operates
hospitals, clinics, home care and additional care services
in the Twin Cities metropolitan area and regional communities
throughout Minnesota and western Wisconsin.
© 2016 Willis Towers Watson. All rights reserved. Proprietary and Confidential. For Willis Towers Watson and Willis Towers Watson cl ient use only. 26
27,000 Employees
6,000 Associated and
employed
physicians
4,000 Volunteers

Allina Health’s journey
Result Approach Key Issues Background
Use Willis Towers
Watson Talent Analytics
Software to show
where (and to what degree) we
are exposed to key workforce risks and the
consequences on key workforce
outcomes
Pronounced
critical-skill gaps
How do we attract
and retain the right talent?
Hard to
anticipate talent needs and identify
workforce risks
Complex
market environment
Where are we at
risk of losing key resources due to
upcoming
retirements?
Where do our labor
costs exceed targets based on
the way we’ve
sourced talent?
Ability to
identify and
interpret
workforce
risks quickly
and to take
targeted
actions has
become a key
competitive
advantage
© 2016 Willis Towers Watson. All rights reserved. Proprietary and Confidential. For Willis Towers Watson and Willis Towers Watson cl ient use only. 27
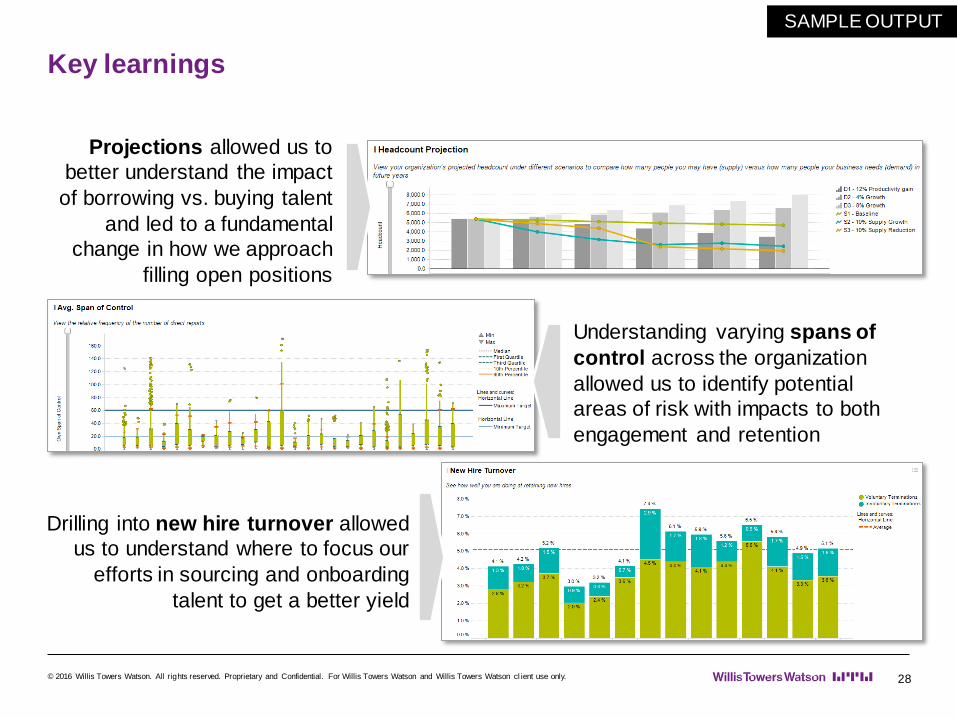
Key learnings
Projections allowed us to
better understand the impact
of borrowing vs. buying talent
and led to a fundamental
change in how we approach
filling open positions
Understanding varying spans of
control across the organization
allowed us to identify potential
areas of risk with impacts to both
engagement and retention
Drilling into new hire turnover allowed
us to understand where to focus our
efforts in sourcing and onboarding
talent to get a better yield
SAMPLE OUTPUT
© 2016 Willis Towers Watson. All rights reserved. Proprietary and Confidential. For Willis Towers Watson and Willis Towers Watson cl ient use only. 28

Taking the next step
© 2016 Willis Towers Watson. All rights reserved. Proprietary and Confidential. For Willis Towers Watson and Willis Towers Watson cl ient use only. 29

Some “best practices”
© 2016 Willis Towers Watson. All rights reserved. Proprietary and Confidential. For Willis Towers Watson and Willis Towers Watson cl ient use only. 30
Know that a TOOL is not equal to SUCCESS
Recognize that it is as much about CHANGE MANAGEMENT as it is
about workforce analytics
Manage expectations on data QUALITY vs. data quantity
Think about CONTIUOUS IMPROVEMENT rather than seeking out
perfection
Build in EDUCATION—e.g., don’t expect comfort with analytic
methods or drawing insights
Do not wait to do ANYTHING until you have perfect data on
EVERYTHING
Rely on internal and external BENCHMARKS only as potential
reference points
Make workforce analytics (e.g., dashboarding) SOMEONE’S JOB

Some framing questions to test business needs
© 2016 Willis Towers Watson. All rights reserved. Proprietary and Confidential. For Willis Towers Watson and Willis Towers Watson cl ient use only. 31
Are business leaders asking for workforce analytics? … If not, what would you need to have to build the business case?
What workforce analytics are you doing today? … How are they being used by the business?
Do you already know the key metrics that deliver the highest yield? … If not, what steps could you take to identify potential high-yield metrics?
What are the major workforce pain points about which leaders are
concerned? … Have you looked at the data to identify the root cause of these workforce issues?

Questions?
2016 Wll1s T owers Wa tson All rights reseiVed Propnetary and Confidential For Willis Towers Watson and WilliS Towers Watson d 1ent use only WillisTowerswatson 1•11111•1 32
Contact information
Helen Friedman
+1 203 559 6882
Rick Sherwood
+1 312 201 5679
© 2016 Willis Towers Watson. All rights reserved. Proprietary and Confidential. For Willis Towers Watson and Willis Towers Watson cl ient use only. 33