2015 - ARYZTA
42
Interim Report and Accounts 2015
Transcript of 2015 - ARYZTA

Interim Report and Accounts
2015

Table of Contents
Interim Report 2015
Page
02 Interim Financial and Business Review
14 Bridge to Group Consolidated Income Statement
15 Group Condensed Interim Financial Statements
1
ARYZTA AG Interim Report 2015

1 Key performance highlights
Food Group– Revenue increase of 17.2% to €1.86bn. - Food Europe increased by 5.4% to €805.1m. - Food North America increased by 31.1% to €937.2m. - Food Rest of World increased by 8.5% to €115.6m.– EBITA increase of 15.8% to €224.8m. - Food Europe increased by 7.1% to €98.6m. - Food North America increased by 25.7% to €113.0m. - Food Rest of World increased by 8.1% to €13.2m.– EBITA increase of 13.0% to €219.4m using constant currency.– Food Group EBITA margin declined by 20bps to 12.1%.– Underlying fully diluted net profit increased 6.9% to €138.3m.– Underlying net profit conversion to cash 117.0% (January 2014: 93.2%).– Syndicated bank loan Net debt: EBITDA ratio of 2.49x.
Origin– Revenue increased by 2.7% to €531.6m.– EBITA increased by 2.4% to €4.1m.– Contribution from associates and joint ventures decreased by (6.1)% to €6.3m.– Underlying fully diluted EPS decreased by (2.2)% to 5.80 cent.
Group– Group revenue increased by 13.6% to €2.39bn.– Group EBITA increased by 15.5% to €229.0m.– Group EBITA margin increased by 20bps to 9.6%– Underlying fully diluted net profit increased by 6.6% to €144.5m.– Underlying fully diluted EPS increased by 5.9% to 161.4 cent.
Commenting on the results, ARYZTA AG Chief Executive Officer Owen Killian said:
“Revenue growth of 17.2% to €1.86bn underscores the substantial expansion of our Food Group business over the last six months. Our Customer Centric strategy is working and generating positive demand for our bakeries. Optimising our bakery capacity through SKU rationalisation continues to negatively impact underlying revenue growth in North America, reflecting the timing of replacement volume. However, this process will reduce investment capital requirements and positively impact return on invested capital and net cash generation over the next three years.
Our European performance remains resilient, being well positioned and well invested to benefit from continued strong growth in the In-Store Bakery channel. The restructuring of our flatbread business into a 50/50 JV will reduce European revenues by 6% over the next 12 months. Our immediate focus is to generate sustainable underlying revenue growth, while optimising our production for higher returns and increased free cash flow.
Weak underlying revenue growth, combined with favourable currency translation, suggests underlying fully diluted EPS at the lower end of our 7%-12% guidance.”
Interim Report 2015
Interim Financial and Business Review
2
ARYZTA AG Interim Report 2015

Interim Financial and Business Review (continued)
2 ARYZTA Group – Income Statement Six month period ended 31 January 2015
in EUR `000 January 2015 January 2014 % Change
Group revenue 2,389,469 2,102,800 13.6%
EBITA 228,954 198,254 15.5%
EBITA margin 9.6% 9.4% –
Associates and JVs, net 5,730 6,693 –
EBITA incl. associates and JVs 234,684 204,947 14.5%
Finance cost, net (44,131) (26,005) –
Hybrid instrument accrued dividend (14,359) (14,258) –
Pre-tax profits 176,194 164,684 –
Income tax (28,199) (25,193) –
Non-controlling interests (3,468) (3,913) –
Underlying fully diluted net profit 144,527 135,578 6.6%
Underlying fully diluted EPS (cent) 161.4c1 152.4c1 5.9%
1 ARYZTA January 2015 weighted average number of ordinary shares used to calculate diluted earnings per share is 89,553,157 (January 2014: 88,951,383).
2 See glossary in section 18 for definitions of financial terms and references used in the financial and business review.
3 ARYZTA Group – Underlying revenue growth Six month period ended 31 January 2015
in EUR million
Food Europe
Food North America
Food Rest of World
Total Food Group Origin
ARYZTA Group
Group revenue 805.1 937.2 115.6 1,857.9 531.6 2,389.5
Underlying growth 2.4% (5.8)% 7.1% (0.9)% (5.4)% (1.5)%
Acquisitions, net 1.7% 29.6% – 14.1% 3.4% 11.4%
Currency 1.3% 7.3% 1.4% 4.0% 4.7% 3.7%
Revenue Growth 5.4% 31.1% 8.5% 17.2% 2.7% 13.6%
4 ARYZTA Group – Segmental EBITA Six month period ended 31 January 2015
in EUR `000
January 2015
January 2014
% Change
EBITA Margin 2015
EBITA Margin2014
% Change
Food Group
Food Europe 98,635 92,097 7.1% 12.3% 12.1% 20 bps
Food North America 112,974 89,899 25.7% 12.1% 12.6% (50)bps
Food Rest of World 13,235 12,246 8.1% 11.5% 11.5% – bps
Total Food Group 224,844 194,242 15.8% 12.1% 12.3% (20)bps
Origin 4,110 4,012 2.4% 0.8% 0.8% – bps
Total Group EBITA 228,954 198,254 15.5% 9.6% 9.4% 20bps
Associates & JVs, net
Food JV (554) – (100.0)%
Origin associates & JV 6,284 6,693 (6.1)%
Total associates & JVs, net 5,730 6,693 (14.4)%
EBITA incl. associates and JVs 234,684 204,947 14.5%
3
ARYZTA AG Interim Report 2015

5 Food Group – Income Statement Six month period ended 31 January 2015
in EUR `000 January 2015 January 2014 % Change
Group revenue 1,857,870 1,585,194 17.2%
EBITA 224,844 194,242 15.8%
EBITA margin 12.1% 12.3% –
JV (554) – –
EBITA incl. JV 224,290 194,242 15.5%
Finance cost, net (41,342) (23,631) –
Hybrid instrument accrued dividend (14,359) (14,258) –
Pre-tax profits 168,589 156,353 –
Income tax (27,890) (24,824) –
Non-controlling interests (2,386) (2,125) –
Underlying net profit 138,313 129,404 6.9%
6 Food Group businessARYZTA’s Food Group business is primarily focused on speciality baking, a niche segment of the overall bakery market. Speciality bakery ensures the best value, variety, taste and convenience to consumers at the point of sale. ARYZTA’s customer channels consist of a mix of large retail, convenience and independent retail, Quick Serve Restaurants (‘QSR’) and other foodservice categories.
Food Group revenue grew by 17.2% to €1.86bn, entirely due to acquisitions and currency. Underlying revenue declined in the period by (0.9)%, reflecting the impact of the ongoing capacity optimisation strategy and its associated SKU rationalisation. As communicated during Q1, these efforts are aimed at freeing capacity for larger customers without increasing investment capital. The negative impact from these strategies will continue into the second half, albeit at a decreasing rate. The contribution to revenue growth from acquisitions was strong at 14.1%. The first half also benefited from a favourable currency impact of 4.0%, primarily as a result of the strengthening of the US Dollar.
Food Group EBITA increased by 15.8% to €224.8m, while EBITA margins declined by (20) bps to 12.1%, reflecting the short-term reduced operating leverage as a result of the capacity optimisation efforts in North America.
Food Group 2015 underlying revenue growth during the quarters to date, and the comparative quarters during the prior year, were as follows:
Q1 2015 Q2 2015 H1 2015
Food Europe 3.1% 1.7% 2.4%
Food North America (3.2) % (8.4) % (5.8)%
Food Rest of World 6.1 % 8.1 % 7.1%
Total Food Group 0.5 % (2.4)% (0.9)%
Q1 2014 Q2 2014 H1 2014 Q3 2014 Q4 2014 FY 2014
Food Europe 0.7 % 2.6 % 1.7 % 4.1 % 1.2 % 2.1%
Food North America 1.7 % (2.1) % (0.2) % 2.7 % 2.7 % 1.3%
Food Rest of World 8.9 % 2.9 % 5.9 % 7.4 % 12.6 % 7.9%
Total Food Group 1.8 % 0.3 % 1.1 % 3.7 % 2.6 % 2.1%
Interim Financial and Business Review (continued)4
ARYZTA AG Interim Report 2015

7 Food EuropeFood Europe outperformed in the first half, with revenue growth of 5.4% to €805.1m, of which underlying revenue increased by 2.4%, compared to European GDP growth of 1.3%. European GDP is expected to improve due to the ECB programme of quantitative easing. However, the positive impact of the European monetary policies have yet to substantially translate into improved consumer spending, which benefits out of home food consumption.
Growth in the speciality bakery segment in Europe remains polarized at the premium and value channels and categories, with the middle market remaining under pressure.
ARYZTA Bakeries Europe and ARYZTA Food Solutions are both well positioned toparticipate in market growth opportunities. European Bakeries outperformed Food Solutions in underlying growth, reflecting the strong growth in the In-Store Bakery ('ISB') segment within the large retail channel.
In addition, acquisitions contributed 1.7% and there was also a favourable currency impact of 1.3%.
Food Europe EBITA increased by 7.1% to €98.6m, while EBITA margins also increased by 20 bps to 12.3%, primarily as a result of improved operating leverage arising from increased volume.
During January 2015, the Group agreed to exchange certain assets within the Food Europe operating segment for a 50% interest in Signature Flatbreads (UK) Ltd. Signature is a pioneering flatbread producer in India and the UK, producing an innovative range of authentic Indian breads, as well as high-quality international flatbreads, tortillas, pizza bases and pittas. The transaction is expected to formally complete during the second half of 2015. This will result in the loss of approximately €100m of annualized revenue,commencing in the second half of the year.
During the period, Food Europe incurred cash non-recurring costs of €9.8m,primarily related to advisory, severance or staff-related costs, either as part offinalising certain ATI programme projects or in connection with the Signature Flatbreads Joint Venture transaction. Food Europe also invested €20.0m in completing the ERP roll-out in certain locations, as well as adding additional functionality to the existinginstallations. A further €82.6m was invested in a variety of bakery expansion-related capital projects, primarily the expansion of additional In-Store-Bakery capacity within Continental Europe.
Interim Financial and Business Review (continued)5
ARYZTA AG Interim Report 2015

8 Food North AmericaFood North America first half underlying revenue declined by (5.8%), significantly underperforming compared to the improving North American GDP growth of 2.2%. The improving macroeconomic environment in North America reflects falling unemployment and record new household formations by millennials. This in turn has impacted out-of-home food consumption trends, with strong growth in premium and fresh driving channel and operator switching. According to the USDA, food consumed out of home has risen steadily over the past 45 years and is now at its highest level, approaching 50% of total US household food expenditure.
Food North America revenue increased by 31.1% to €937.2m. While underlying revenue declined by (5.8)%, there was a strong contribution of 29.6% from acquisitions and a favourable currency impact of 7.3%. The decline in underlying revenue reflects the timing impact of the capacity optimisation strategy within North America to free up capacity for higher volume customers. This strategy will continue to impact Food North America underlying revenue development in the second half of the year, albeit at a decreasing rate, as replacement volumes begin to rebuild from the planned customer pipeline. As a result of these efforts, management expects to be able to reduce capital allocations during the current and future years.
North America EBITA increased by 25.7% to €113.0m, while Food North America EBITA margins decreased by (50)bps to 12.1%, reflecting the impact of decreased operating leverage, as post rationalisation lower volumes were left to absorb existing overhead costs during this short-term transitional period.
In North America, cash costs for non-recurring items totalled €8.0m, primarily related to severance and staff-related costs paid in connection with employees whose services were discontinued or costs for other advisory services associated with integrating and aligning the operational processes of recently acquired businesses to those of the existing Food Group network. An additional €10.6m was invested in deploying the ERP system within recently acquired businesses and expanding functionality for existing ERP installations. An additional €57.5m was invested in a variety of bakery expansion-related capital projects, primarily in expanding two customer focused bakeries in the United States. Additional non-cash asset write-downs of €9.0m were also recorded in North America for obsolete distribution assets, due to the reduction in activities related to those assets.
9 Food Rest of World Food Rest of World revenues increased by 8.5% to €115.6m, with a strong underlying growth contribution of 7.1% and a favourable currency impact of 1.4%. The underlying revenue growth relates primarily to an increase in production volumes, as capacity continues to be optimised within the region.
Food Rest of World EBITA increased by 8.1% to €13.2m as a result of the increased production, while maintaining EBITA margins at 11.5%.
Interim Financial and Business Review (continued)6
ARYZTA AG Interim Report 2015

10 Integration and capital investments As part of the Pineridge and Cloverhill acquisitions during the prior year, the Food Group announced an estimated €70.0m investment related to integrating the ERP systems and aligning the operational processes of those businesses into the existing Food Group network.
During the period, the Food Group has incurred the following costs related to the integration and rationalisation activities and other capital expenditures:
in EUR `000 Food Group Integration Investments
Acquisition, disposal and restructuring-related costs Cash
Total integration Non-cash Total
Period ended 31 January 2015 20,002 – 20,002 18,722 38,724
Investment capital expenditure
Optimisation- related& ERP
Totalintegration
Expansion- related Total
Period ended 31 January 2015 – 30,524 30,524 141,571 172,095
Total integration investment 20,002 30,524 50,526
Estimated integration investment 70,000
As part of restructuring the business, as well as optimising manufacturing capacities to address market growth opportunities such as expansion into In-Store-Bakery in Europe and focus on higher margin “on trend” consumer driven volumes in North America, the Food Group has experienced significantly higher capital intensity during recent years.
While management expects 2015 investment capital expenditure in line with the previous estimates of €300m, as a result of the SKU rationalisation efforts in North America and review of the overall production capacities throughout the Food Group, managementexpects capital investments will reduce going forward. By 2017, management expects that investment capital expenditure will begin to normalize at approximately 3 – 4% of revenue, in line with depreciation and underlying revenue growth expectations. These reductions in capital allocations will in turn lead to a substantial expansion in cash generated from activities after investment capital expenditure.
11 Financial position ARYZTA’s 68.1% subsidiary and separately listed company, Origin Enterprises plc (‘Origin’), has separate funding structures, which are financed without recourse to ARYZTA. Origin’s net debt amounted to €161.2m as of 31 January 2015.
In October 2014, the Group repaid the CHF 400m perpetual callable subordinated instrument (‘Hybrid Instrument’) funded in October 2010, in line with the initial call date associated with that instrument.
In October 2014, the Group issued a CHF 190m Hybrid Instrument with a 3.5% coupon. This Hybrid Instrument is undated, with an initial call date in April 2020. In November 2014, the Group issued a €250m Hybrid Instrument with a 4.5% coupon. This Hybrid Instrument is undated, with an initial call date in March 2019.
Interim Financial and Business Review (continued)7
ARYZTA AG Interim Report 2015
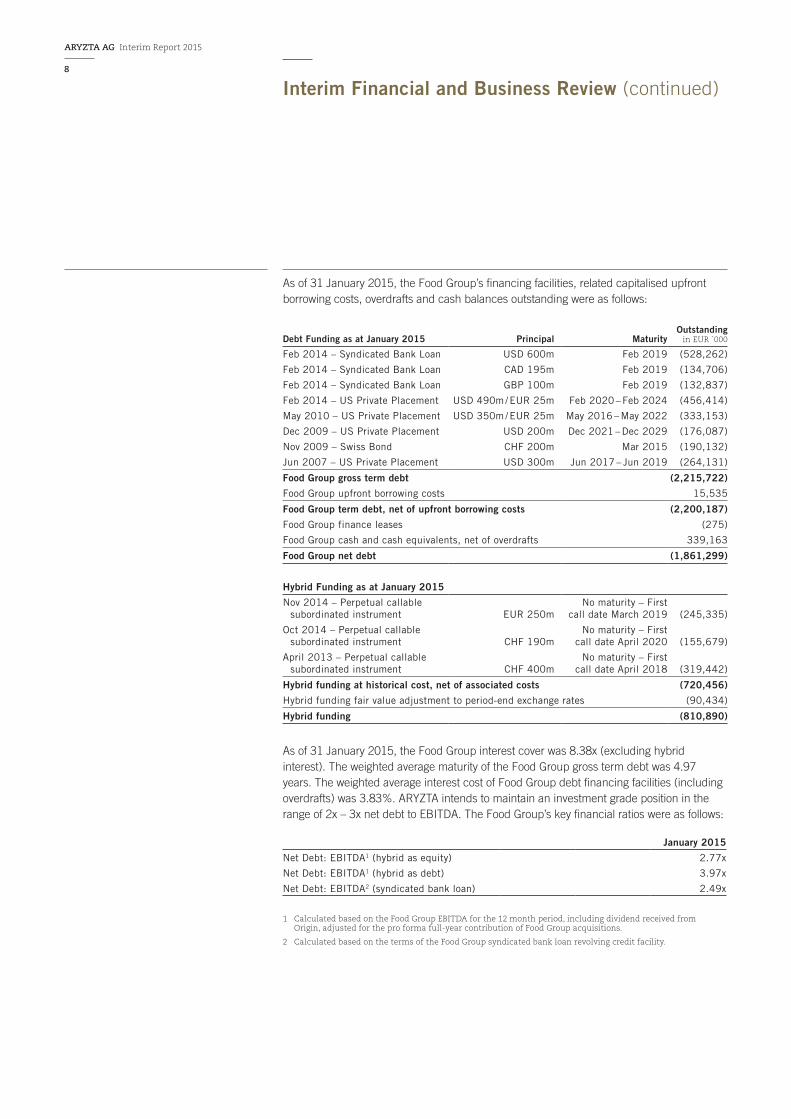
As of 31 January 2015, the Food Group’s financing facilities, related capitalised upfront borrowing costs, overdrafts and cash balances outstanding were as follows:
Debt Funding as at January 2015 Principal MaturityOutstanding
in EUR `000
Feb 2014 – Syndicated Bank Loan USD 600m Feb 2019 (528,262)
Feb 2014 – Syndicated Bank Loan CAD 195m Feb 2019 (134,706)
Feb 2014 – Syndicated Bank Loan GBP 100m Feb 2019 (132,837)
Feb 2014 – US Private Placement USD 490m / EUR 25m Feb 2020 – Feb 2024 (456,414)
May 2010 – US Private Placement USD 350m / EUR 25m May 2016 – May 2022 (333,153)
Dec 2009 – US Private Placement USD 200m Dec 2021 – Dec 2029 (176,087)
Nov 2009 – Swiss Bond CHF 200m Mar 2015 (190,132)
Jun 2007 – US Private Placement USD 300m Jun 2017 – Jun 2019 (264,131)
Food Group gross term debt (2,215,722)
Food Group upfront borrowing costs 15,535
Food Group term debt, net of upfront borrowing costs (2,200,187)
Food Group finance leases (275)
Food Group cash and cash equivalents, net of overdrafts 339,163
Food Group net debt (1,861,299)
Hybrid Funding as at January 2015
Nov 2014 – Perpetual callable subordinated instrument EUR 250m
No maturity – First call date March 2019 (245,335)
Oct 2014 – Perpetual callable subordinated instrument CHF 190m
No maturity – First call date April 2020 (155,679)
April 2013 – Perpetual callable subordinated instrument CHF 400m
No maturity – First call date April 2018 (319,442)
Hybrid funding at historical cost, net of associated costs (720,456)
Hybrid funding fair value adjustment to period-end exchange rates (90,434)
Hybrid funding (810,890)
As of 31 January 2015, the Food Group interest cover was 8.38x (excluding hybridinterest). The weighted average maturity of the Food Group gross term debt was 4.97 years. The weighted average interest cost of Food Group debt financing facilities (including overdrafts) was 3.83%. ARYZTA intends to maintain an investment grade position in the range of 2x – 3x net debt to EBITDA. The Food Group’s key financial ratios were as follows:
January 2015
Net Debt: EBITDA1 (hybrid as equity) 2.77x
Net Debt: EBITDA1 (hybrid as debt) 3.97x
Net Debt: EBITDA2 (syndicated bank loan) 2.49x
1 Calculated based on the Food Group EBITDA for the 12 month period, including dividend received from Origin, adjusted for the pro forma full-year contribution of Food Group acquisitions.
2 Calculated based on the terms of the Food Group syndicated bank loan revolving credit facility.
Interim Financial and Business Review (continued)8
ARYZTA AG Interim Report 2015

1 The Food Group term debt maturity profile is set out as at 31 January 2015. Food Group gross term debt at 31 January 2015 is €2,215.7m. Food Group net debt at 31 January 2015 is €1,861.3m, which also includes overdrafts and finance leases, and is net of cash and related capitalised upfront borrowing costs.
2 Incorporating the drawn amount on the Revolving Credit Facility of €795.8m as at 31 January 2015, which represents 36% of the Food Group gross term debt.
The principal euro foreign exchange currency rates used by the Group for the preparation of these Interim Financial Statements are as follows:
CurrencyAverage
H1 2015Average
H1 2014%
ChangeClosing
H1 2015Closing
FY 2014%
Change
CHF 1.1894 1.2314 3.4% 1.0519 1.2169 13.6%
USD 1.2548 1.3510 7.1% 1.1358 1.3430 15.4%
CAD 1.4226 1.4191 (0.2)% 1.4476 1.4611 0.9%
GBP 0.7872 0.8430 6.6% 0.7528 0.7933 5.1%
Interim Financial and Business Review (continued)
17%6%
5%
2%38%²
2%8%
36%2%
2%3%
10%
7%
Food Group Gross Term Debt Maturity Profile (excluding hybrid)¹
9
ARYZTA AG Interim Report 2015

Food Group cash generation
in EUR `000 January 2015 January 2014
EBIT 140,420 134,701
Amortisation 84,424 59,541
EBITA 224,844 194,242
Depreciation and ERP amortisation 64,990 46,422
EBITDA 289,834 240,664
Working capital movement (40,319) (10,768)
Working capital movement from debtor securitisation 90,699 (1,494)
Maintenance capital expenditure (46,637) (22,867)
Dividends received from Origin 17,056 16,388
Hybrid dividend paid1 (16,815) (16,221)
Interest and income tax paid (54,397) (41,436)
Other non-cash income (1,533) (386)
Cash flow generated from activities 237,888 163,880
Investment capital expenditure2 (172,095) (122,892)
Cash flows generated from activities after investment capital expenditure 65,793 40,988
Underlying net profit 138,313 129,404
Food Group net debt and investment activity
in EUR `000 January 2015 January 2014
Food Group opening net debt as at 1 August (1,642,079)3 (849,228)
Cash flows generated from activities 237,888 163,880
Hybrid instrument proceeds, net of repayment and issuance costs 69,334 –
Origin tender offer proceeds – 71,789
Net debt cost of acquisitions – (83,712)
Acquisition and restructuring-related cash flows (39,705) (33,388)
Investment capital expenditure2 (172,095) (122,892)
Contingent consideration (3,280) (777)
Dividends paid (4,330) (3,248)
Foreign exchange movement4 (305,292) 15,766
Other5 (1,740) 1,472
Food Group closing net debt as at 31 January (1,861,299) (840,338)3
1 Hybrid dividends paid have been reclassified and included within Cash generated from activities. This reclassification was made to apply consistent treatment between these cash payments and the associated Hybrid instrument accrued dividend, which is included as an expense within the Group and Food Group underlying income statements.
2 Includes expenditure on intangible assets.
3 The movement in the Food Group closing net debt position from 31 January 2014 to 1 August 2014 relates primarily to the funding of €779.1m of acquisitions during that period, including the acquisitions of Pineridge and Cloverhill.
4 Foreign exchange movement for the period ended 31 January 2015 primarily attributable to the fluctuation in the US Dollar to euro rate from July 2014 (1.3430) to January 2015 (1.1358) and in the Swiss Franc to euro rate from July 2014 (1.2169) to January 2015 (1.0519).
5 Other comprises primarily proceeds from disposal of property, plant and equipment, and amortisation of financing costs.
Interim Financial and Business Review (continued)10
ARYZTA AG Interim Report 2015

12 Net assets, goodwill & intangibles
Group Balance Sheet in EUR `000
Total Group January 2015
Total Group July 2014
Property, plant and equipment 1,542,685 1,374,010
Investment properties 32,271 30,716
Goodwill and intangible assets 3,942,771 3,690,597
Deferred tax on acquired intangibles (259,532) (255,639)
Associates and joint venture 91,835 54,911
Other financial assets 70,530 42,586
Working capital (217,024) (197,394)
Other segmental liabilities (148,576) (122,708)
Segmental net assets 5,054,960 4,617,079
Net debt (2,022,503) (1,653,991)
Deferred tax, net (112,177) (105,799)
Income tax (59,204) (60,152)
Derivative financial instruments (22,991) (5,680)
Net assets 2,838,085 2,791,457
Food Group Balance Sheet in EUR `000
Food Group January 2015
Food Group July 2014
Property, plant and equipment 1,448,055 1,283,584
Investment properties 24,696 23,141
Goodwill and intangible assets 3,786,566 3,539,225
Deferred tax on acquired intangibles (250,244) (246,717)
Joint venture 31,302 –
Other financial assets 26,852 –
Working capital (285,635) (149,277)
Other segmental liabilities (105,832) (93,481)
Segmental net assets 4,675,760 4,356,475
Investment in and receivable from Origin 46,526 46,515
Net debt (1,861,299) (1,642,079)
Deferred tax, net (111,721) (102,102)
Income tax (41,543) (41,019)
Derivative financial instruments (22,244) (4,465)
Net assets 2,685,479 2,613,325
Interim Financial and Business Review (continued)11
ARYZTA AG Interim Report 2015

13 Return on invested capital
in EUR million
Food Europe
Food North
America
Food Rest of
World
Total Food
Group Origin3
ARYZTA Group3
31 January 2015
Group share net assets1 1,875 2,571 230 4,676 443 5,119
EBITA incl. associates and JVs1 239 255 26 520 93 613
ROIC 12.7%2 9.9%2 11.5% 11.1% 20.9% 12.0%
31 July 2014
Group share net assets1 1,811 2,303 243 4,357 432 4,789
EBITA incl. associates and JVs1 237 261 26 524 93 617
ROIC 13.1% 11.3% 10.6% 12.0% 21.5% 12.9%
1 See glossary in section 18 for definitions of financial terms and references used.
2 Re-translating January 2015 pro forma EBITA and JV contribution at closing foreign exchange rates would result in an ROIC of 13.2% for Food Europe and 10.9% for Food North America.
3 Origin net assets adjusted for the put option liability and fluctuation in average working capital by €63.6m (July 2014: €171.8m).
4 The Food Group WACC on a pre-tax basis is currently 7.4% (July 2014: 7.0%).
14 OriginOrigin is a leading agri-services group focused on integrated agronomy and agri-inputs in the UK, Ireland, Poland and Ukraine.
Origin’s separately published results, which were released on 12 March 2015, are available at www.originenterprises.com.
15 OutlookWeak underlying revenue growth, combined with favourable currency translation,suggests underlying fully diluted EPS at the lower end of our 7% – 12% guidance.
16 Principal risks and uncertaintiesThe Board and senior management have invested significant time and resources in identifying specific risks across the Group, and in developing a culture of balanced risk minimisation. The Board considers the risks and uncertainties disclosed on page 58 of the ARYZTA AG 2014 Annual Report and Accounts to continue to reflect the principal risks and uncertainties of the Group over the remaining six months of the financial year.
17 Forward looking statementThis report contains forward looking statements, which reflect management’s current views and estimates. The forward looking statements involve certain risks and uncertainties that could cause actual results to differ materially from those contained in the forward looking statements. Potential risks and uncertainties include such factors as general economic conditions, foreign exchange fluctuations, competitive product and pricing pressures and regulatory developments.
Interim Financial and Business Review (continued)12
ARYZTA AG Interim Report 2015
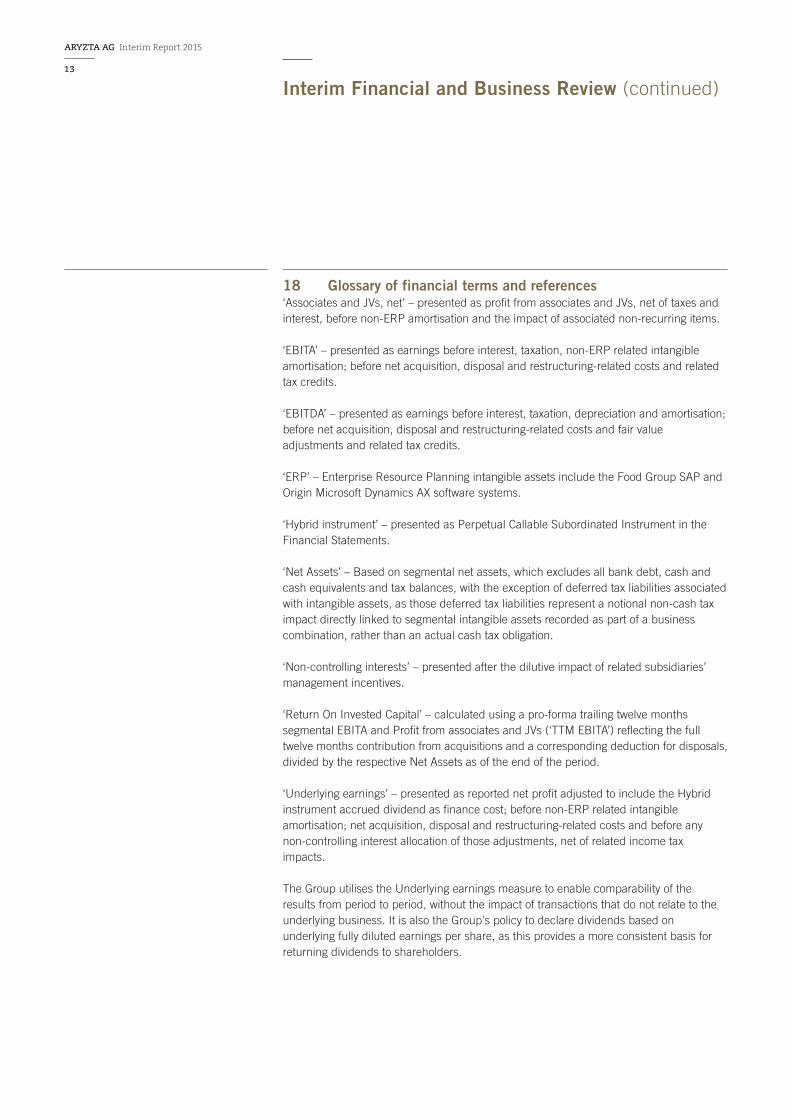
18 Glossary of financial terms and references‘Associates and JVs, net’ – presented as profit from associates and JVs, net of taxes andinterest, before non-ERP amortisation and the impact of associated non-recurring items.
‘EBITA’ – presented as earnings before interest, taxation, non-ERP related intangibleamortisation; before net acquisition, disposal and restructuring-related costs and related tax credits.
‘EBITDA’ – presented as earnings before interest, taxation, depreciation and amortisation;before net acquisition, disposal and restructuring-related costs and fair valueadjustments and related tax credits.
‘ERP’ – Enterprise Resource Planning intangible assets include the Food Group SAP andOrigin Microsoft Dynamics AX software systems.
‘Hybrid instrument’ – presented as Perpetual Callable Subordinated Instrument in theFinancial Statements.
‘Net Assets’ – Based on segmental net assets, which excludes all bank debt, cash andcash equivalents and tax balances, with the exception of deferred tax liabilities associatedwith intangible assets, as those deferred tax liabilities represent a notional non-cash taximpact directly linked to segmental intangible assets recorded as part of a businesscombination, rather than an actual cash tax obligation.
‘Non-controlling interests’ – presented after the dilutive impact of related subsidiaries’ management incentives.
‘Return On Invested Capital’ – calculated using a pro-forma trailing twelve months segmental EBITA and Profit from associates and JVs (‘TTM EBITA’) reflecting the full twelve months contribution from acquisitions and a corresponding deduction for disposals, divided by the respective Net Assets as of the end of the period.
‘Underlying earnings’ – presented as reported net profit adjusted to include the Hybrid instrument accrued dividend as finance cost; before non-ERP related intangible amortisation; net acquisition, disposal and restructuring-related costs and before any non-controlling interest allocation of those adjustments, net of related income tax impacts.
The Group utilises the Underlying earnings measure to enable comparability of the results from period to period, without the impact of transactions that do not relate to the underlying business. It is also the Group's policy to declare dividends based on underlying fully diluted earnings per share, as this provides a more consistent basis for returning dividends to shareholders.
Interim Financial and Business Review (continued)13
ARYZTA AG Interim Report 2015

in EUR `000
Food Group January 2015
Origin January 2015
Origin non-controlling
interestsTotal Group
January 2015Total Group
January 2014
Group revenue 1,857,870 531,599 – 2,389,469 2,102,800
EBITA 224,844 4,110 – 228,954 198,254
Associates and JVs, net (554) 6,284 – 5,730 6,693
EBITA incl. associates and JVs 224,290 10,394 – 234,684 204,947
Finance cost, net (41,342) (2,789) – (44,131) (26,005)
Hybrid instrument accrued dividend (14,359) – – (14,359) (14,258)
Pre-tax profits 168,589 7,605 – 176,194 164,684
Income tax (27,890) (309) – (28,199) (25,193)
Non-controlling interests (2,386) – (1,082) (3,468) (3,913)
Underlying fully diluted net profit 138,313 7,296 (1,082) 144,527 135,578
Underlying fully diluted EPS (cent) – 5.80c1 161.4c2 152.4c2
Underlying net profit reconciliation
in EUR `000
Food Group January 2015
Origin January 2015
Origin non-controlling
interestsTotal Group
January 2015Total Group
January 2014
Reported net profit3 56,208 2,048 (653) 57,603 40,582
Intangible amortisation 84,424 3,492 – 87,916 62,400
Tax on amortisation (17,919) (561) – (18,480) (14,537)
Share of associate intangible amortisation, net of tax – 1,038 – 1,038 –
Hybrid instrument accrued dividend (14,359) – – (14,359) (14,258)
Net acquisition, disposal and restructuring-related costs 38,724 1,354 – 40,078 70,503
Tax on asset write-downs and costs arising on integration (8,765) (75) – (8,840) (8,392)
Non-controlling interest portion of acquisition, disposal and restructuring-related costs – – (407) (407) (720)
Underlying net profit 138,313 7,296 (1,060) 144,549 135,578
Dilutive impact of Origin management incentives – – (22) (22) –
Underlying fully diluted net profit 138,313 7,296 (1,082) 144,527 135,578
Underlying fully diluted EPS (cent) – 5.80c1 161.4c2 152.4c2
1 Origin January 2015 underlying fully diluted EPS is calculated using the weighted average number of shares in issue of 125,714,124 (January 2014: 134,296,257).
2 ARYZTA January 2015 weighted average number of ordinary shares used to calculate diluted earnings per share is 89,553,157 (January 2014: 88,951,383).
3 Food Group reported net profit excludes dividend income of €17,056,000 (January 2014: €16,388,000) from Origin.
Bridge to Group Consolidated Income Statementfor the six months ended 31 January 2015
14
ARYZTA AG Interim Report 2015

Six months ended 31 January
in EUR `000 Notes2015
Unaudited2014
Unaudited
Revenue 3 2,389,469 2,102,800
Cost of sales (1,753,529) (1,580,026)
Distribution expenses (214,176) (186,379)
Gross profit 421,764 336,395
Selling expenses (99,579) (96,406)
Administration expenses (220,607) (173,975)
Operating Profit 4 101,578 66,014
Share of profit after tax of associates and joint ventures 4,074 6,030
Profit before financing income, financing costs and income tax expense 4 105,652 72,044
Financing income 2,200 3,515
Financing costs (46,331) (29,520)
Profit before income tax expense 61,521 46,039
Income tax expense (879) (2,264)
Profit for the period 60,642 43,775
Attributable as follows:
Equity shareholders 57,603 40,582
Non-controlling interests 3,039 3,193
Profit for the period 60,642 43,775
Six months ended 31 January
Earnings per share for the period Notes2015
Euro cent2014
Euro cent
Basic earnings per share 7 48.8 29.9
Diluted earnings per share 7 48.3 29.6
The notes on pages 23 to 41 are an integral part of these Group consolidated financial statements.
Group Consolidated Income Statement for the six months ended 31 January 2015
15
ARYZTA AG Interim Report 2015

Group Consolidated Statement of Comprehensive Incomefor the six months ended 31 January 2015
Six months ended 31 January
in EUR `000 Notes2015
Unaudited2014
Unaudited
Profit for the period 60,642 43,775
Other comprehensive income/(loss)
Items that may be reclassified subsequently to profit or loss:
Foreign exchange translation effects
– Foreign currency net investments 361,317 (82,416)
– Foreign currency borrowings 8 (321,652) 14,614
Cash flow hedges
– Effective portion of changes in fair value of cash flow hedges (21,088) (1,732)
– Fair value of cash flow hedges transferred to income statement 3,100 (2,584)
– Deferred tax effect of cash flow hedges 1,428 585
– Share of joint ventures and associates gain/(loss) on cash flow hedges, net of deferred tax 2,967 (122)
Total of items that may be reclassified subsequently to profit or loss 26,072 (71,655)
Items that may not be reclassified to profit or loss:
Defined benefit plans
– Actuarial (loss)/gain on Group defined benefit pension plans 9 (24,713) 4,888
– Deferred tax effect of actuarial loss/(gain) 4,755 (748)
– Share of associates’ actuarial (loss)/gain on defined benefit plans, net of deferred tax (353) 2,153
Total of items that may not be reclassified to profit or loss (20,311) 6,293
Total other comprehensive income/(loss) 5,761 (65,362)
Total comprehensive income/(loss) for the period 66,403 (21,587)
Attributable as follows:
Equity shareholders of the Company 61,983 (27,607)
Non-controlling interests 4,420 6,020
Total comprehensive income/(loss) for the period 66,403 (21,587)
The notes on pages 23 to 41 are an integral part of these Group consolidated financial statements.
16
ARYZTA AG Interim Report 2015

in EUR `000 Notes
31 January 2015
Unaudited
31 July 2014
Audited
Assets
Non-current assets
Property, plant and equipment 1,542,685 1,374,010
Investment properties 32,271 30,716
Goodwill and intangible assets 3,942,771 3,690,597
Investments in associates and joint ventures 91,835 54,911
Other receivables 70,530 42,586
Deferred income tax assets 88,769 72,748
Derivative financial instruments – 342
Total non-current assets 5,768,861 5,265,910
Current assets
Inventory 454,596 362,469
Trade and other receivables 396,722 614,326
Derivative financial instruments 3,363 1,077
Cash and cash equivalents 8 872,579 694,838
Total current assets 1,727,260 1,672,710
Total assets 7,496,121 6,938,620
The notes on pages 23 to 41 are an integral part of these Group consolidated financial statements.
Group Consolidated Balance Sheetas at 31 January 2015
17
ARYZTA AG Interim Report 2015

Group Consolidated Balance Sheetas at 31 January 2015 (continued)
in EUR `000 Notes
31 January 2015
Unaudited
31 July 2014
Audited
Equity
Called up share capital 1,172 1,172
Share premium 773,735 773,735
Retained earnings and other reserves 1,983,447 1,928,798
Total equity attributable to equity shareholders 2,758,354 2,703,705
Non-controlling interests 79,731 87,752
Total equity 2,838,085 2,791,457
Liabilities
Non-current liabilities
Interest-bearing loans and borrowings 8 2,253,941 1,898,435
Employee benefits 9 38,145 12,451
Deferred income from government grants 19,641 21,261
Other payables 78,737 73,742
Deferred income tax liabilities 460,478 434,186
Derivative financial instruments 8,856 3,445
Contingent consideration 3,300 7,100
Total non-current liabilities 2,863,098 2,450,620
Current liabilities
Interest-bearing loans and borrowings 8 641,141 450,394
Trade and other payables 1,068,342 1,174,189
Income tax payable 59,204 60,152
Derivative financial instruments 17,498 3,654
Contingent consideration 8,753 8,154
Total current liabilities 1,794,938 1,696,543
Total liabilities 4,658,036 4,147,163
Total equity and liabilities 7,496,121 6,938,620
The notes on pages 23 to 41 are an integral part of these Group consolidated financial statements.
18
ARYZTA AG Interim Report 2015

Group Consolidated Statement of Changes in Equity for the six months ended 31 January 2015
for the six months ended 31 January 2015 in EUR `000
Share capital
Share premium
Treasury shares
Other equity
reserve
Cash flow
hedge reserve
Revalua- tion
reserve
Share- based
payment reserve
Foreign currency
trans- lation
reserveRetained earnings
Total share-
holders equity
Non controlling
interests Total
At 1 August 2014 1,172 773,735 (55) 604,446 (3,616) 13,322 19,454 (29,045) 1,324,292 2,703,705 87,752 2,791,457
Profit for the period – – – – – – – – 57,603 57,603 3,039 60,642
Other comprehensive (loss)/ income – – – – (14,661) – – 35,326 (16,285) 4,380 1,381 5,761
Total comprehensive (loss)/income – – – – (14,661) – – 35,326 41,318 61,983 4,420 66,403
Issue of perpetual callable subordinated
instruments (note 10) – – – 401,014 – – – – – 401,014 – 401,014
Redemption of perpetual callable subordinated instrument (note 10) – – – (285,004) – – – – (46,676) (331,680) – (331,680)
Release of treasury shares due to exercise of LTIP – – 7 – – – – – – 7 – 7
Share-based payments – – – – – – 2,777 – – 2,777 – 2,777
Transfer of share-based payment reserve to retained earnings – – – – – – (19,919) – 19,919 – – –
Equity dividends – – – – – – – – (65,034) (65,034) – (65,034)
Dividends to non-controlling interests – – – – – – – – – – (12,307) (12,307)
Dividend accrued on perpetual callable subordinated instrument (note 10) – – – – – – – – (14,359) (14,359) – (14,359)
Total contributions by and distributions to owners of the company – – 7 116,010 – – (17,142) – (106,150) (7,275) (12,307) (19,582)
Non-controlling interests acquired – – – – – – – – (59) (59) (134) (193)
Total transactions with owners of the company recognised directly in equity – – 7 116,010 – – (17,142) – (106,209) (7,334) (12,441) (19,775)
At 31 January 2015 1,172 773,735 (48) 720,456 (18,277) 13,322 2,312 6,281 1,259,401 2,758,354 79,731 2,838,085
The notes on pages 23 to 41 are an integral part of these Group consolidated financial statements.
19
ARYZTA AG Interim Report 2015

Group Consolidated Statement of Changes in Equity (continued)for the six months ended 31 January 2015
for the six months ended 31 January 2014 in EUR `000
Share capital
Share premium
Treasury shares
Other equity
reserve
Cash flow
hedge reserve
Revalua- tion
reserve
Share- based
payment reserve
Foreign currency
trans- lation
reserveRetained earnings
Total share-
holders equity
Non controlling
interests Total
At 1 August 2013 1,172 773,735 (56) 604,446 (106) 13,380 8,862 (7,726) 1,269,312 2,663,019 97,610 2,760,629
Profit for the period – – – – – – – – 40,582 40,582 3,193 43,775
Other comprehensive (loss)/income – – – – (3,644) – – (69,509) 4,964 (68,189) 2,827 (65,362)
Total comprehensive (loss)/income – – – – (3,644) – – (69,509) 45,546 (27,607) 6,020 (21,587)
Release of treasury shares due to exercise of LTIP – – 1 – – – – – – 1 – 1
Share-based payments – – – – – – 3,390 – – 3,390 – 3,390
Equity dividends – – – – – – – – (47,898) (47,898) – (47,898)
Dividends to non-controlling interests – – – – – – – – – – (10,751) (10,751)
Dividend accrued on perpetual callable subordinated instrument – – – – – – – – (14,258) (14,258) – (14,258)
Total contributions by and distributions to owners – – 1 – – – 3,390 – (62,156) (58,765) (10,751) (69,516)
Origin tender offer share buyback and dilution – – – – 13 (58) (5) 100 (1,772) (1,722) (26,526) (28,248)
Total transactions with owners recognised directly in equity – – 1 – 13 (58) 3,385 100 (63,928) (60,487) (37,277) (97,764)
At 31 January 2014 1,172 773,735 (55) 604,446 (3,737) 13,322 12,247 (77,135) 1,250,930 2,574,925 66,353 2,641,278
The notes on pages 23 to 41 are an integral part of these Group consolidated financial statements.
20
ARYZTA AG Interim Report 2015

Group Consolidated Cash Flow Statementfor the six months ended 31 January 2015
Six months ended 31 January
in EUR `000 Notes2015
Unaudited2014
Unaudited
Cash flows from operating activities
Profit for the period 60,642 43,775
Income tax expense 879 2,264
Financing income (2,200) (3,515)
Financing costs 46,331 29,520
Share of profit after tax of associates and joint ventures (4,074) (6,030)
Net loss on disposals and asset write downs 4 18,722 49,918
Other restructuring-related payments in excess of current-period costs (20,656) (15,342)
Depreciation of property, plant and equipment 59,647 46,216
Amortisation of intangible assets 97,573 66,382
Recognition of deferred income from government grants (1,643) (1,794)
Share-based payments 5 2,524 3,390
Other (3,924) (1,980)
Cash flows from operating activities before changes in working capital 253,821 212,804
Increase in inventory (78,264) (57,377)
Decrease in trade and other receivables 225,645 144,947
Decrease in trade and other payables (212,481) (189,233)
Cash generated from operating activities 188,721 111,141
Interest paid, net (41,645) (28,433)
Income tax paid (18,271) (17,751)
Net cash flows from operating activities 128,805 64,957
The notes on pages 23 to 41 are an integral part of these Group consolidated financial statements.
21
ARYZTA AG Interim Report 2015

Group Consolidated Cash Flow Statement (continued)for the six months ended 31 January 2015
Six months ended 31 January
in EUR `000 Notes2015
Unaudited2014
Unaudited
Cash flows from investing activities
Proceeds from sale of property, plant and equipment 303 2,638
Purchase of property, plant and equipment
– maintenance capital expenditure (51,604) (28,998)
– investment capital expenditure (134,574) (80,233)
Purchase of intangible assets (37,776) (43,450)
Grants received – 63
Acquisitions of subsidiaries and businesses, net of cash acquired 11 – (90,971)
Proceeds from disposal of Origin joint venture 475 94,002
Dividends received 2,651 1,703
Contingent consideration paid (3,280) (777)
Net cash flows from investing activities (223,805) (146,023)
Cash flows from financing activities
Issue of perpetual callable subordinated instruments 10 401,014 –
Repayment of perpetual callable subordinated instrument 10 (331,680) –
Gross drawdown of loan capital 8 87,561 138,768
Gross repayment of loan capital 8 (59,610) –
Capital element of finance lease liabilities 8 (81) (600)
Dividend paid on perpetual callable subordinated instrument (16,815) (16,221)
Acquisition of non-controlling interest (193) –
Origin tender offer paid to non-controlling interests and related costs – (28,432)
Dividends paid to non-controlling interests (12,307) (10,751)
Net cash flows from financing activities 67,889 82,764
Net increase in cash and cash equivalents 8 (27,111) 1,698
Translation adjustment 8 10,129 (1,776)
Net cash and cash equivalents at start of period 8 438,807 392,476
Net cash and cash equivalents at end of period 8 421,825 392,398
The notes on pages 23 to 41 are an integral part of these Group consolidated financial statements.
22
ARYZTA AG Interim Report 2015

1 Basis of preparationThe Group Condensed Consolidated Interim Financial Statements (hereafter the ‘Interim Financial Statements’) have been prepared in accordance with International Accounting Standard 34, Interim Financial Reporting (‘IAS 34’).
These Interim Financial Statements do not include all the information and disclosures required in the annual financial statements and should be read in conjunction with the Group’s most recent Annual Financial Statements in respect of the year ended 31 July 2014, which have been prepared in accordance with International Financial Reporting Standards (‘IFRS’).
These Interim Financial Statements for the six months ended 31 January 2015 and the comparative figures for the six months ended 31 January 2014 are unaudited and have not been reviewed by the auditors. The extracts from the Group’s Annual Financial Statements for the year ended 31 July 2014 represent an abbreviated version of the Group’s full accounts for that year, on which the auditors issued an unqualified audit report.
Certain amounts in the 31 January 2014 and 31 July 2014 comparative financial statement figures and related notes have been reclassified to conform to the 31 January 2015 presentation. The reclassifications were made for presentation purposes to better align the Group's financial statement presentation to a more commonly used approach and have no effect on total revenues, expenses, profit for the period, total assets, total liabilities, total equity or cash flow classifications as previously reported.
Income tax expense is recognised based upon the best estimate of the average annual income tax rate expected for the full year.
The principal euro foreign exchange currency rates used by the Group for the preparation of these Interim Financial Statements are as follows:
CurrencyAverage
H1 2015Average
H1 2014%
ChangeClosing
H1 2015Closing
FY 2014%
Change
CHF 1.1894 1.2314 3.4% 1.0519 1.2169 13.6%
USD 1.2548 1.3510 7.1% 1.1358 1.3430 15.4%
CAD 1.4226 1.4191 (0.2)% 1.4476 1.4611 0.9%
GBP 0.7872 0.8430 6.6% 0.7528 0.7933 5.1%
Notes to the Group Condensed Interim Financial Statementsfor the six months ended 31 January 2015
23
ARYZTA AG Interim Report 2015

2 Accounting policiesExcept as described below, the Interim Financial Statements have been prepared on the basis of the accounting policies, significant judgements, key assumptions and estimates, as set out on pages 75 to 88 of the ARYZTA AG 2014 Annual Report and Accounts.
The IFRS applied by the Group in preparation of these financial statements are those that were effective for accounting periods beginning on or before 1 August 2014. The following standards and interpretations, issued by the International Accounting Standards Board (‘IASB’) and the IFRS Interpretations Committee, are effective for the first time in the current financial year and have been adopted by the Group:
– Amendment to IAS 32 – Offsetting financial assets and financial liabilities– Amendment to IAS 39 – Novation of Derivatives and Continuation of Hedge Accounting– IFRIC 21 – Levies– Improvements to IFRSs (2010-2014)
While the above standards and interpretations adopted by the Group modify certain presentation and disclosure requirements, these requirements are not significantly different than information presented as part of the 31 July 2014 year-end financial statements and have no material impact on the consolidated results or financial position of the Group.
The Group has not applied early adoption of any standards which are not yet effective.
Notes to the Group Condensed Interim Financial Statements (continued)for the six months ended 31 January 2015
24
ARYZTA AG Interim Report 2015

3 Analysis by business segment
I) Segment revenue and result
Food Europe
Food North America
Food Rest of World
Total Food Group Origin Total Group
Six months ended 31 January
Six months ended 31 January
Six months ended 31 January
Six months ended 31 January
Six months ended 31 January
Six months ended 31 January
in EUR `000 2015 2014 2015 2014 2015 2014 2015 2014 2015 2014 2015 2014
Segment revenue1 805,143 764,001 937,171 714,683 115,556 106,510 1,857,870 1,585,194 531,599 517,606 2,389,469 2,102,800
Operating profit/(loss) 34,061 28,608 59,869 32,389 7,766 5,610 101,696 66,607 (118) (593) 101,578 66,014
Share of profit/(loss) after tax of associates and joint ventures (554) – – – – – (554) – 4,628 6,030 4,074 6,030
Profit before financing income, financing cost and income tax expense 33,507 28,608 59,869 32,389 7,766 5,610 101,142 66,607 4,510 5,437 105,652 72,044
Financing income2 689 2,166 1,511 1,349 2,200 3,515
Financing costs2 (42,031) (25,797) (4,300) (3,723) (46,331) (29,520)
Profit before income tax expense as reported in Group Consolidated Income Statement 59,800 42,976 1,721 3,063 61,521 46,039
1 There were no significant intercompany revenues between business segments.
2 Financing income / (costs) and income tax expense are managed on a centralised basis for the Food Group and separately for Origin. Therefore these items are not allocated between business segments for the purposes of presenting information to the Chief Operating Decision Maker.
Notes to the Group Condensed Interim Financial Statements (continued)for the six months ended 31 January 2015
25
ARYZTA AG Interim Report 2015

II) Segment assetsFood
EuropeFood
North AmericaFood
Rest of WorldTotal
Food Group Origin Total Group
in EUR `000
as at 31 Jan
2015
as at 31 Jul 2014
as at 31 Jan
2015
as at 31 Jul 2014
as at 31 Jan
2015
as at 31 Jul 2014
as at 31 Jan
2015
as at 31 Jul 2014
as at 31 Jan
2015
as at 31 Jul 2014
as at 31 Jan
2015
as at 31 Jul 2014
Segment assets excluding investments in associates and joint ventures 2,347,525 2,315,520 3,096,590 2,770,263 306,365 310,814 5,750,480 5,396,597 618,565 675,521 6,369,045 6,072,118
Investments in associates and joint ventures and related financial assets 58,154 – – – – – 58,154 – 104,211 97,497 162,365 97,497
Segment assets 2,405,679 2,315,520 3,096,590 2,770,263 306,365 310,814 5,808,634 5,396,597 722,776 773,018 6,531,410 6,169,615
Reconciliation to total assets as reported in the Group Consolidated Balance Sheet
Derivative financial instruments 698 847 2,665 572 3,363 1,419
Cash and cash equivalents 786,230 555,262 86,349 139,576 872,579 694,838
Deferred income tax assets 83,951 68,938 4,818 3,810 88,769 72,748
Total assets as reported in Group Consolidated Balance Sheet 6,679,513 6,021,644 816,608 916,976 7,496,121 6,938,620
III) Segment liabilitiesFood
EuropeFood
North AmericaFood
Rest of WorldTotal
Food Group Origin Total Group
in EUR `000
as at 31 Jan
2015
as at 31 Jul 2014
as at 31 Jan
2015
as at 31 Jul 2014
as at 31 Jan
2015
as at 31 Jul 2014
as at 31 Jan
2015
as at 31 Jul 2014
as at 31 Jan
2015
as at 31 Jul 2014
as at 31 Jan
2015
as at 31 Jul 2014
Segment liabilities 530,658 504,389 525,354 467,559 76,862 68,174 1,132,874 1,040,122 343,576 512,414 1,476,450 1,552,536
Reconciliation to total liabilities as reported in the Group Consolidated Balance Sheet
Interest-bearing loans and borrowings 2,647,529 2,197,341 247,553 151,488 2,895,082 2,348,829
Derivative financial instruments 22,942 5,312 3,412 1,787 26,354 7,099
Current and non-intangible deferred income tax liabilities 237,215 212,059 22,935 26,640 260,150 238,699
Total liabilities as reported in Group Consolidated Balance Sheet 4,040,560 3,454,834 617,476 692,329 4,658,036 4,147,163
Notes to the Group Condensed Interim Financial Statements (continued)for the six months ended 31 January 2015
26
ARYZTA AG Interim Report 2015

4 Net acquisition, disposal and restructuring-related costsIn accordance with IAS 1, the Group Consolidated Income Statement is presented by function. As outlined below, management has identified certain acquisition, disposal and restructuring-related costs within each functional area that do not relate to theunderlying business of the Group. Due to the relative size or nature of these items, they have been presented as a separate component of operating profit in the table below, along with related income tax impacts, and have been excluded from the calculation of underlying fully diluted net profit (note 7), to enable comparability of the Group’sunderlying results from period to period.
IFRS Income
Statement
Net acquisition, disposal,
restructuring-related costs
Intangible amortisation
Financial Business
Review
IFRS Income
Statement
Net acquisition, disposal,
restructuring-related costs
Intangible amortisation
Financial Business
Review
in EUR `000 2015 2015 2015 2015 2014 2014 2014 2014
Revenue 2,389,469 – – 2,389,469 2,102,800 – – 2,102,800
Cost of sales (1,753,529) 14,565 – (1,738,964) (1,580,026) 47,835 – (1,532,191)
Distribution expenses (214,176) 3,226 – (210,950) (186,379) 3,964 – (182,415)
Gross profit 421,764 17,791 – 439,555 336,395 51,799 – 388,194
Selling expenses (99,579) 129 – (99,450) (96,406) 1,240 – (95,166)
Administration expenses (220,607) 21,540 87,916 (111,151) (173,975) 16,801 62,400 (94,774)
Operating profit 101,578 39,460 87,916 228,954 66,014 69,840 62,400 198,254
Share of profit after tax of associates and joint ventures 4,074 618 1,038 5,730 6,030 663 – 6,693
Profit before financing income, financing costs and income tax expense 105,652 40,078 88,954 234,684 72,044 70,503 62,400 204,947
Notes to the Group Condensed Interim Financial Statements (continued)for the six months ended 31 January 2015
27
ARYZTA AG Interim Report 2015

Food Europe
Food North America
Food Rest of World
Total Food Group Origin Total Group
Six months ended 31 January
Six months ended 31 January
Six months ended 31 January
Six months ended 31 January
Six months ended 31 January
Six months ended 31 January
in EUR `000 Notes 2015 2014 2015 2014 2015 2014 2015 2014 2015 2014 2015 2014
Asset disposal and write-down on contribution to JV 4.1 (9,740) – – – – – (9,740) – – – (9,740) –
Acquisition and disposal-related costs 4.2 (1,942) (682) (155) (1,498) – – (2,097) (2,180) – (912) (2,097) (3,092)
Restructuring-related costs 4.3
Asset write-downs and disposals – (19,207) (8,982) (28,829) – (1,882) (8,982) (49,918) – – (8,982) (49,918)
Severance and other staff-related costs (3,768) (5,101) (2,924) (2,083) (18) – (6,710) (7,184) (601) (834) (7,311) (8,018)
Advisory and other costs (4,045) (6,194) (4,892) (2,618) (2,258) – (11,195) (8,812) (753) (663) (11,948) (9,475)
Total restructuring-related costs (7,813) (30,502) (16,798) (33,530) (2,276) (1,882) (26,887) (65,914) (1,354) (1,497) (28,241) (67,411)
Total acquisition, disposal and restructuring-related costs (19,495) (31,184) (16,953) (35,028) (2,276) (1,882) (38,724) (68,094) (1,354) (2,409) (40,078) (70,503)
4.1 Asset disposal and write-down on contribution to Joint VentureDuring January 2015, the Group agreed to exchange certain assets within the Food Europe operating segment, which historically generated approximately €100,000,000 in annual revenues, for a 50% interest in Signature Flatbreads (UK) Ltd.
As the €56,256,000 total estimated fair value of the Group’s 50% interest and the associated Vendor Loan Note receivable from the Joint Venture were less than the €66,099,000 carrying value of the associated net assets, an estimated loss on asset disposal and write-downs on contribution to joint venture in the amount of €9,740,000 has been reflected in the financial statements during the period ended 31 January 2015, net of associated foreign exchange gains of €103,000.
The transaction is expected to formally complete during the second half of 2015.
4.2 Acquisition and disposal-related costsDuring the period ended 31 January 2015 the Group incurred acquisition and disposal-related costs of €2,097,000 (2014: €3,092,000). These costs include due diligence and other professional service fees primarily related to the joint venture transaction with Signature Flatbreads (UK) Ltd.
Notes to the Group Condensed Interim Financial Statements (continued)for the six months ended 31 January 2015
28
ARYZTA AG Interim Report 2015
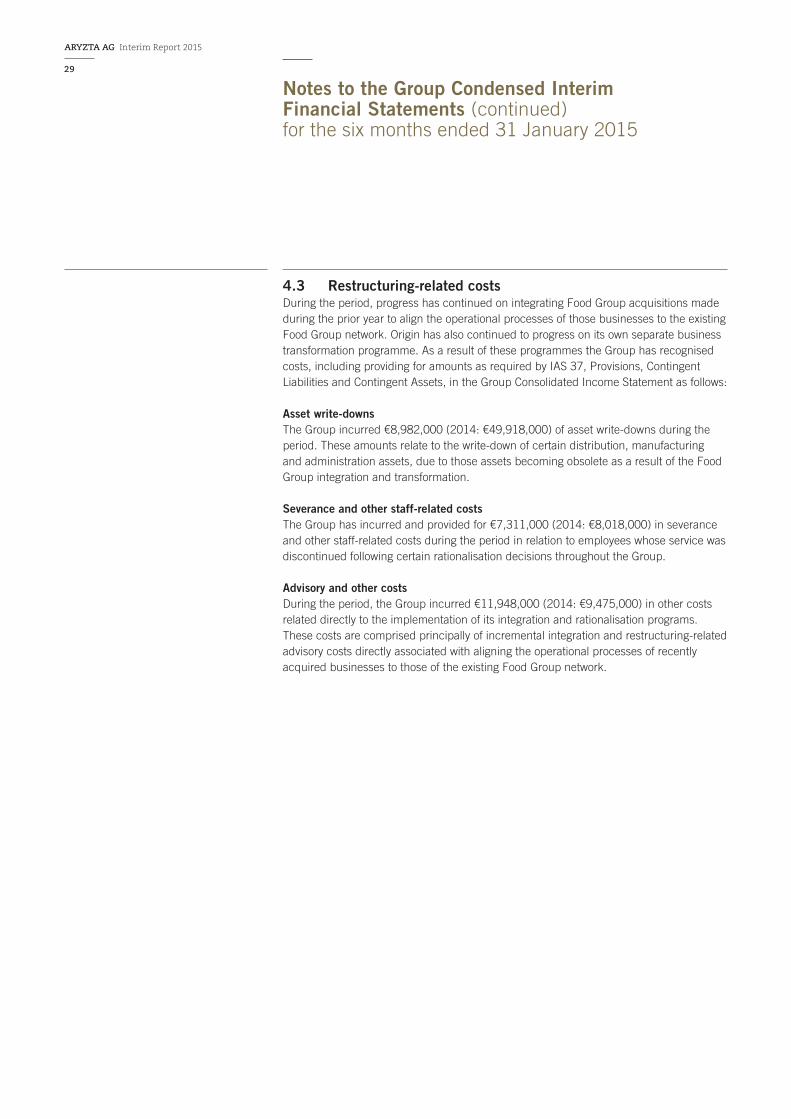
4.3 Restructuring-related costsDuring the period, progress has continued on integrating Food Group acquisitions made during the prior year to align the operational processes of those businesses to the existing Food Group network. Origin has also continued to progress on its own separate business transformation programme. As a result of these programmes the Group has recognised costs, including providing for amounts as required by IAS 37, Provisions, Contingent Liabilities and Contingent Assets, in the Group Consolidated Income Statement as follows:
Asset write-downs The Group incurred €8,982,000 (2014: €49,918,000) of asset write-downs during the period. These amounts relate to the write-down of certain distribution, manufacturing and administration assets, due to those assets becoming obsolete as a result of the Food Group integration and transformation.
Severance and other staff-related costsThe Group has incurred and provided for €7,311,000 (2014: €8,018,000) in severance and other staff-related costs during the period in relation to employees whose service was discontinued following certain rationalisation decisions throughout the Group.
Advisory and other costsDuring the period, the Group incurred €11,948,000 (2014: €9,475,000) in other costs related directly to the implementation of its integration and rationalisation programs. These costs are comprised principally of incremental integration and restructuring-related advisory costs directly associated with aligning the operational processes of recently acquired businesses to those of the existing Food Group network.
Notes to the Group Condensed Interim Financial Statements (continued)for the six months ended 31 January 2015
29
ARYZTA AG Interim Report 2015

5 Share Based PaymentsThe Group has outstanding grants of equity-based incentives under the following LTIP plans:
– ARYZTA Matching Plan LTIP– ARYZTA Option Equivalent Plan LTIP– Origin Enterprises Matching Plan LTIP The total cost reported in the Group consolidated financial statements in the current period in relation to equity settled share-based payments is €2,777,000 (2014: €3,390,000), of which €2,524,000 (2014: €3,390,000) was reported in the Group Consolidated Income Statement.
Analysis of movements within the LTIP plans during the period are as follows:
5.1 ARYZTA Matching Plan LTIP
Matching Plan awards
Weighted conversion
price 2015 in CHF
Number of equity
entitlements 2015
Outstanding at beginning of the period 0.02 723,000
Exercised during the period 0.02 (327,052)
Forfeited during the period 0.02 (395,948)
Outstanding at the end of the period – –
Vested at end of the period – –
The performance conditions associated with 327,052 Matching Plan awards (173,359 of which were held by Executive Management) were fulfilled during the year ended 31 July 2014 and these awards were exercised during the period ended 31 January 2015. As the performance criteria for the remaining awards outstanding under the Matching Plan were not met, they were forfeited, as they are no longer capable of vesting.
No new equity entitlements were awarded under the Matching Plan during the period ended 31 January 2015.
Notes to the Group Condensed Interim Financial Statements (continued)for the six months ended 31 January 2015
30
ARYZTA AG Interim Report 2015

5.2 ARYZTA Option Equivalent Plan LTIP
Option Equivalent Plan awards
Weighted conversion
price 2015 in CHF
Number of equity
entitlements 2015
Outstanding at beginning of the period 39.59 2,095,500
Issued during the period 81.00 980,000
Exercised during the period 40.57 (501,000)
Outstanding at the end of the period 55.21 2,574,500
Vested at end of the period 39.36 1,594,500
Option Equivalent Plan awards outstanding by conversion price
Conversion
price in CHF
Number of equity
entitlements
Actual remaining life
(years)
Issued during financial year 2010 37.23 550,000 4.6
Issued during financial year 2012 39.95 962,500 6.7
Issued during financial year 2013 46.70 82,000 7.8
Issued during financial year 2015 81.00 980,000 9.7
As of 31 January 2015 55.21 2,574,500 7.4
Plan descriptionThe equity instruments granted under the ARYZTA Option Equivalent Plan LTIP are equity-settled share-based payments as defined in IFRS 2, Share-based Payment. The Group has no legal or constructive obligation to repurchase or settle the Option Equivalent awards in cash.
Vesting of the awards under the Option Equivalent Plan is conditional on compound annual growth in underlying fully diluted EPS (including the associated cost of any awards expected to vest) in three consecutive accounting periods exceeding the compound growth in the Euro-zone Core Consumer Price Index, plus 5%, on an annualised basis.
Awards under the Option Equivalent Plan are subject to additional conditions, including notably:
(a) the requirement to remain in service throughout the performance period; (b) the requirement that the ARYZTA Food Group's reported ROIC over the expected
performance period is not less than its weighted average cost of capital; and (c) the requirement that annual dividends to shareholders are at least 15% of the
underlying EPS during the performance period.
The Option Equivalent Plan awards granted in the periods before financial year 2015 can be exercised as of the time the performance conditions described above have been met, but no longer than ten years after grant date. Awards granted during financial year 2015, which meet the conditions for vesting after the three year performance period, are subject to additional conditions, including notably an additional two year holding period before they can be exercised.
Notes to the Group Condensed Interim Financial Statements (continued)for the six months ended 31 January 2015
31
ARYZTA AG Interim Report 2015

The Group’s compound annual growth in underlying fully diluted EPS for the three consecutive accounting periods ended 31 July 2014 was 10.8 %, which exceeded the growth in the Eurozone Core Consumer Price Index over the same period of 1.2 %, plus 5 %. Accordingly, the performance conditions associated with the Option Equivalent Plan awards outstanding as of 31 July 2014 were met. As a result, 1,445,500 Option Equivalent Plan awards (970,000 of which were held by Executive Management) vested during September 2014. Of these, 1,044,500 remain outstanding as at 31 January 2015.
550,000 additional Option Equivalent Plan awards, held by Executive Management, remain outstanding as of 31 January 2015 and were already fully vested and eligible to be exercised as of the beginning of the period.
During the period ended 31 January 2015, 501,000 vested Option Equivalent awards were exercised, in exchange for 256,703 shares. The weighted average share price at the time of these exercises was CHF 80.00 per share. The shares issued as part of these exercises were issued out of shares previously held in treasury.
The weighted average fair value assigned to share option equivalents granted under the ARYZTA Option Equivalent Plan LTIP during the period ended 31 January 2015 was CHF 11.93, which was determined using the Black-Scholes valuation model. The significant inputs into the model were the price of the shares as at the grant date, an expected option life of 5.5 years, expected share price volatility of 20.30 %, the exercise price of CHF 81.00 or €67.11, the expected dividend yield of 1.5 %, and the risk-free rate of 0.16%.
The weighted average exercise price of all Option Equivalent Plan awards that remain outstanding and for which the vesting conditions have been met is CHF 39.36.
5.3 Origin Enterprises Matching Plan LTIPNo significant activity occurred within the Origin Enterprises Matching Plan LTIP during the period.
6 DividendsThe proposed dividend covering the 12 month period ended 31 July 2014 of CHF 0.7646 (31 July 2013: CHF 0.6652) per registered share was approved at the annual general meeting held on 2 December 2014. The total resulting dividend of €65,034,000 (2014: €47,898,000) was paid in February 2015 to those shareholders holding shares in ARYZTA AG on 29 January 2015.
Notes to the Group Condensed Interim Financial Statements (continued)for the six months ended 31 January 2015
32
ARYZTA AG Interim Report 2015

7 Earnings per shareSix months ended
31 January
2015 2014
Basic earnings per share in EUR `000 in EUR `000
Profit attributable to equity shareholders 57,603 40,582
Perpetual callable subordinated instrument accrued dividend (14,359) (14,258)
Profit used to determine basic earnings per share 43,244 26,324
Weighted average number of ordinary shares ’000 ’000
Ordinary shares outstanding at 1 August1 88,175 88,120
Effect of vesting and exercise of equity instruments during the period2 380 14
Weighted average number of ordinary shares used to determine basic earnings per share 88,555 88,134
Basic earnings per share 48.8 cent 29.9 cent
2015 2014
Diluted earnings per share in EUR `000 in EUR `000
Profit used to determine basic earnings per share 43,244 26,324
Effect on non-controlling interests share of reported profits, due to dilutive impact of Origin management equity entitlements3 (6) –
Profit used to determine diluted earnings per share 43,238 26,324
Weighted average number of ordinary shares (diluted) ’000 ’000
Weighted average number of ordinary shares used to determine basic earnings per share 88,555 88,134
Effect of equity-based incentives with a dilutive impact2 998 817
Weighted average number of ordinary shares used to determine diluted earnings per share 89,553 88,951
Diluted earnings per share 48.3 cent 29.6 cent
1 Issued share capital excludes treasury shares.
2 The change in the equity instruments with a dilutive impact is due to continued vesting of management share-based incentives, offset by the impact of incentives exercised during the year, which are now included in the weighted average number of ordinary shares used to determine basic earnings per share.
3 Reflects the dilutive impact of equity entitlements granted to Origin senior management under the Origin Plan. These equity entitlements dilute the Group’s share of Origin profits available as part of its diluted earnings per share calculation.
Notes to the Group Condensed Interim Financial Statements (continued)for the six months ended 31 January 2015
33
ARYZTA AG Interim Report 2015

In addition to the basic and diluted earnings per share measures required by IAS 33, Earnings per Share, as calculated above, the Group also presents an underlying fully diluted earnings per share measure, in accordance with IAS 33 paragraph 73. This additional measure enables comparability of the Group’s underlying results from period to period, without the impact of transactions that do not relate to the underlying business. It is also the Group’s policy to declare dividends based on underlying fully diluted earnings per share, as this provides a more consistent basis for returning dividends to shareholders.
As shown below, for purposes of calculating this measure, the Group adjusts reported net profit by the following items and their related tax impacts:– includes the perpetual callable subordinated instrument accrued dividend as a
finance cost, as already included in the calculation of basic and diluted earnings per share;
– excludes intangible amortisation, except ERP intangible amortisation;– excludes net acquisition, disposal and restructuring-related costs; and– adjusts for the impact of dilutive instruments on non-controlling interests share
of adjusted profits.
Six months ended 31 January
2015 2014
Underlying fully diluted earnings per share in EUR `000 in EUR `000
Profit used to determine basic earnings per share 43,244 26,324
Amortisation of non-ERP intangible assets 87,916 62,400
Tax on amortisation of non-ERP intangible assets (18,480) (14,537)
Share of associate intangible amortisation, net of tax 1,038 –
Net acquisition, disposal and restructuring-related costs (note 4) 40,078 70,503
Tax on net acquisition, disposal and restructuring-related costs (8,840) (8,392)
Non-controlling interest portion of acquisition, disposal and restructuring-related costs (407) (720)
Effect on non-controlling interests share of adjusted profits due to dilutive impact of Origin management equity entitlements (22) -
Underlying fully diluted net profit 144,527 135,578
Weighted average number of ordinary shares used to determine basic earnings per share 88,555 88,134
Underlying basic earnings per share 163.2 cent 153.8 cent
Weighted average number of ordinary shares used to determine diluted earnings per share 89,553 88,951
Underlying fully diluted earnings per share 161.4 cent 152.4 cent
Notes to the Group Condensed Interim Financial Statements (continued)for the six months ended 31 January 2015
34
ARYZTA AG Interim Report 2015

8 Analysis of net debt
Analysis of net debt in EUR `000
1 August 2014 Cash flows
Non-cash movements
Translation adjustment
31 January 2015
Cash 694,838 145,293 – 32,448 872,579
Overdrafts (256,031) (172,404) – (22,319) (450,754)
Cash and cash equivalents 438,807 (27,111) – 10,129 421,825
Loans (2,092,264) (27,951) (1,986) (321,652) (2,443,853)
Finance leases (534) 81 – (22) (475)
Net debt (1,653,991) (54,981) (1,986) (311,545) (2,022,503)
Split of net debt in EUR `000
1 August 2014 Cash flows
Non-cash movements
Translation adjustment
31 January 2014
Food Group net debt (1,642,079) 87,817 (1,745) (305,292) (1,861,299)
Origin net debt (11,912) (142,798) (241) (6,253) (161,204)
Net debt (1,653,991) (54,981) (1,986) (311,545) (2,022,503)
Finance leases include amounts due within one year of €255,000 (July 2014: €276,000).
ARYZTA’s 68.1% subsidiary and separately listed company, Origin, has separate ring-fenced funding structures, which are financed without recourse to ARYZTA AG or any Group subsidiaries outside of the Origin Group.
Notes to the Group Condensed Interim Financial Statements (continued)for the six months ended 31 January 2015
35
ARYZTA AG Interim Report 2015

9 Employee BenefitsThe Group operates a number of defined benefit and defined contribution pension plans in various jurisdictions within both the Food Group and Origin business segments. The majority of plans are externally funded with plan assets held in corresponding separate trustee-administered funds, governed by local regulations and practice in each country.
The valuations of the defined benefit schemes used for the purposes of the following disclosures are those of the most recent actuarial reviews carried out at 31 January 2015 by an independent, qualified actuary. The valuations have been performed using the projected unit method.
Movement in net liability recognised in the Group Consolidated Balance Sheet in EUR `000
31 January 2015
31 July 2014
Total deficit in defined benefit plans at 1 August (10,885) (18,921)
Current service cost (1,992) (3,753)
Past service gain – 1,424
Settlement gain – 1,294
Employer contributions 3,440 4,983
Special contribution on scheme wind up – 6,500
Net interest expense (99) (434)
Actuarial loss on Group defined benefit pension plans (24,713) (1,852)
Other – (177)
Translation adjustments (2,127) 51
Total deficit in defined benefit plans (36,376) (10,885)
Deficit in Food Group defined benefit plans (17,248) (5,692)
Deficit in Origin defined benefit plans (19,128) (5,193)
Total deficit in defined benefit plans (36,376) (10,885)
Other1 (1,769) (1,566)
Total (38,145) (12,451)
1 Other includes provisions to meet unfunded pension fund deficiencies in a variety of insignificant subsidiaries.
The primary driver of the increase in the scheme deficits is the decrease in the discount rate assumptions used to calculate the present value of plan obligations. The discount rates used are detailed below:
Discount rate assumptions31 January
2015 31 July
2014
UK schemes 3.1% 4.4%
Switzerland schemes 0.7% 1.8%
Republic of Ireland schemes 1.9% 3.1%
France schemes 1.6% 2.5%
Notes to the Group Condensed Interim Financial Statements (continued)for the six months ended 31 January 2015
36
ARYZTA AG Interim Report 2015
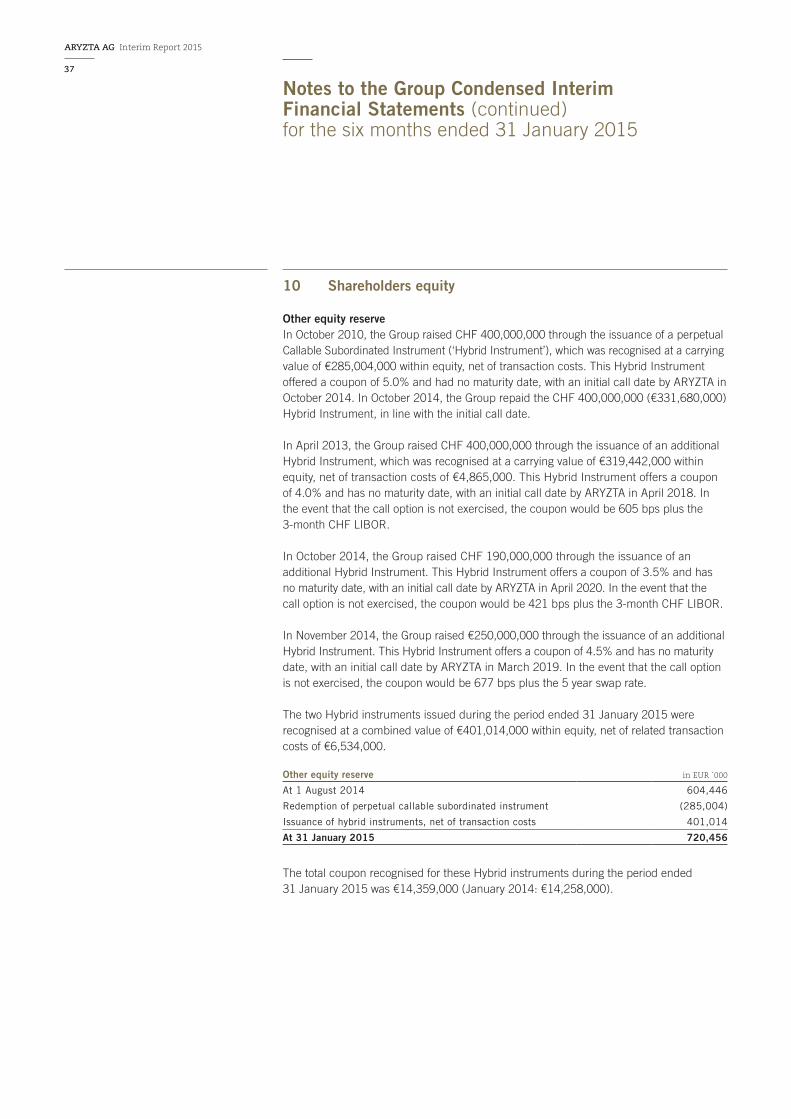
10 Shareholders equity
Other equity reserveIn October 2010, the Group raised CHF 400,000,000 through the issuance of a perpetual Callable Subordinated Instrument (‘Hybrid Instrument’), which was recognised at a carrying value of €285,004,000 within equity, net of transaction costs. This Hybrid Instrument offered a coupon of 5.0% and had no maturity date, with an initial call date by ARYZTA in October 2014. In October 2014, the Group repaid the CHF 400,000,000 (€331,680,000) Hybrid Instrument, in line with the initial call date.
In April 2013, the Group raised CHF 400,000,000 through the issuance of an additional Hybrid Instrument, which was recognised at a carrying value of €319,442,000 within equity, net of transaction costs of €4,865,000. This Hybrid Instrument offers a coupon of 4.0% and has no maturity date, with an initial call date by ARYZTA in April 2018. In the event that the call option is not exercised, the coupon would be 605 bps plus the 3-month CHF LIBOR.
In October 2014, the Group raised CHF 190,000,000 through the issuance of an additional Hybrid Instrument. This Hybrid Instrument offers a coupon of 3.5% and has no maturity date, with an initial call date by ARYZTA in April 2020. In the event that the call option is not exercised, the coupon would be 421 bps plus the 3-month CHF LIBOR.
In November 2014, the Group raised €250,000,000 through the issuance of an additional Hybrid Instrument. This Hybrid Instrument offers a coupon of 4.5% and has no maturity date, with an initial call date by ARYZTA in March 2019. In the event that the call option is not exercised, the coupon would be 677 bps plus the 5 year swap rate.
The two Hybrid instruments issued during the period ended 31 January 2015 were recognised at a combined value of €401,014,000 within equity, net of related transaction costs of €6,534,000.
Other equity reserve in EUR `000
At 1 August 2014 604,446
Redemption of perpetual callable subordinated instrument (285,004)
Issuance of hybrid instruments, net of transaction costs 401,014
At 31 January 2015 720,456
The total coupon recognised for these Hybrid instruments during the period ended 31 January 2015 was €14,359,000 (January 2014: €14,258,000).
Notes to the Group Condensed Interim Financial Statements (continued)for the six months ended 31 January 2015
37
ARYZTA AG Interim Report 2015
11 Business Combinations11.1 Acquisitions during the interim period ended 31 January 2015There were no acquisitions completed by the Group during the period ended 31 January 2015.
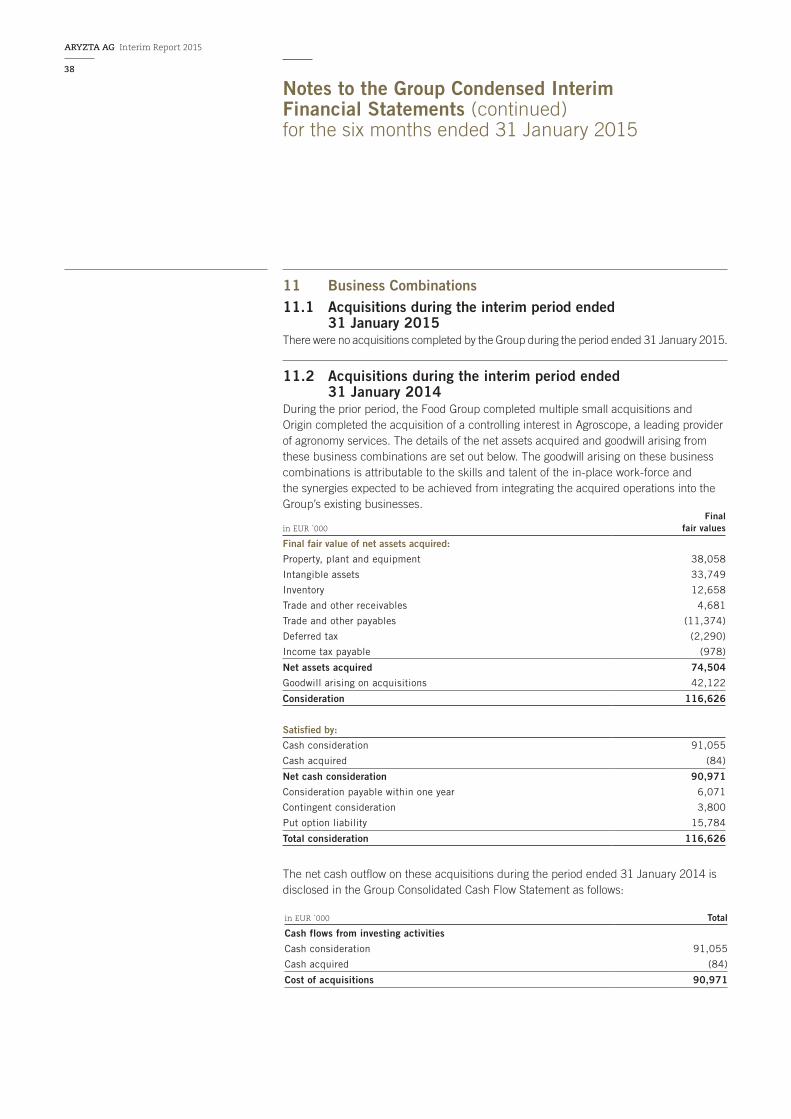
11.2 Acquisitions during the interim period ended 31 January 2014During the prior period, the Food Group completed multiple small acquisitions and Origin completed the acquisition of a controlling interest in Agroscope, a leading provider of agronomy services. The details of the net assets acquired and goodwill arising from these business combinations are set out below. The goodwill arising on these business combinations is attributable to the skills and talent of the in-place work-force and the synergies expected to be achieved from integrating the acquired operations into the Group’s existing businesses.
in EUR `000
Final fair values
Final fair value of net assets acquired:
Property, plant and equipment 38,058
Intangible assets 33,749
Inventory 12,658
Trade and other receivables 4,681
Trade and other payables (11,374)
Deferred tax (2,290)
Income tax payable (978)
Net assets acquired 74,504
Goodwill arising on acquisitions 42,122
Consideration 116,626
Satisfied by:
Cash consideration 91,055
Cash acquired (84)
Net cash consideration 90,971
Consideration payable within one year 6,071
Contingent consideration 3,800
Put option liability 15,784
Total consideration 116,626
The net cash outflow on these acquisitions during the period ended 31 January 2014 is disclosed in the Group Consolidated Cash Flow Statement as follows:
in EUR `000 Total
Cash flows from investing activities
Cash consideration 91,055
Cash acquired (84)
Cost of acquisitions 90,971
Notes to the Group Condensed Interim Financial Statements (continued)for the six months ended 31 January 2015
38
ARYZTA AG Interim Report 2015

As part of Origin’s acquisition of 60% of the ordinary shares of Agroscope, Origin has also entered into an arrangement under which the non-controlling shareholder has the right at various dates to sell the remaining 40% shareholding to Origin. In the event that this option is not exercised, Origin has a similar right to acquire the 40% shareholding. Accordingly, Origin recognised a put option liability at the fair value of the future estimated amount payable to exercise the option, which is included within other long-term liabilities in the ARYZTA Group consolidated balance sheet. This amount represents the fair value of the future estimated amount payable to exercise the option and was determined based on an agreed formula, which includes an expectation of future trading performance and timing of when the options are expected to be exercised, discounted to present value. The estimated amount payable will be adjusted in future periods through the income statement. There has been no material movement in the fair value of the put option liability since the date of acquisition.
Acquisition-related costs of €3,092,000 were charged to net acquisition, disposal and restructuring-related costs in the Group Consolidated Income Statement related to these transactions during the period ended 31 January 2014.
The identified intangibles associated with these acquisitions primarily includes the fair value of customer relationships. The income approach method was the basis for the fair value of these intangibles.
Other than the movements reflected above, and the results of foreign currency translation adjustments, there were no further adjustments to goodwill during the period. The Group tests goodwill annually for impairment, or more frequently if there are indications that goodwill might be impaired. No indication of impairment has been identified during the period ended 31 January 2015.
12 Contingent liabilitiesThe Group is not aware of any significant changes with regard to contingent liabilities, in comparison with the situation as of 31 July 2014.
13 SeasonalityDue to the nature of the Agri-services sector, Origin results are significantly impacted by seasonality as customers defer buying decisions until closer to the main springtime application period. This seasonality is also reflected in Origin’s increased inventory balance during January, compared to the July year-end balance.
Notes to the Group Condensed Interim Financial Statements (continued)for the six months ended 31 January 2015
39
ARYZTA AG Interim Report 2015

14 Related party transactionsThere have been no significant changes in related party transactions other than those described in the ARYZTA AG 2014 Annual Report and Accounts, which could have a material impact on the financial position or performance of the Group in the six months to 31 January 2015.
15 Estimates, risks and uncertainties The preparation of interim financial statements requires management to make judgements, estimates and assumptions that affect the application of accounting policies and the reported amounts of assets and liabilities, income and expense.
In preparing these condensed interim financial statements, the significant judgements made by management in applying the Group’s accounting policies and the key sources of estimation uncertainty were consistent with those risks outlined on page 146 of the ARYZTA AG 2014 Annual Report and Accounts.
During the period ended 31 January 2015:– Share-based payment awards have been granted, as outlined in note 5;– Estimated fair value of investment properties, financial instruments, exposures
to credit, liquidity, foreign exchange, interest rate or commodity price risk have remained consistent with 31 July 2014;
– No indication of impairment of goodwill has been noted; however, see the loss recognised on asset disposal and write-down on contribution to Joint Venture included in note 4;– Estimates associated with the provision for income tax and deferred income tax have
remained consistent with 31 July 2014; and– Estimates used in determining the net employee benefit obligation on Group
pension plans have remained consistent with 31 July 2014, with the exception of a change in the discount rates applied, as outlined in note 9.
The Board and senior management have invested significant time and resources in identifying specific risks across the Group, and in developing a culture of balanced risk minimisation. There have been no changes in the risk management department or any risk management policies since the year-end. The Board considers the risks and uncertainties disclosed on page 58 of the ARYZTA AG 2014 Annual Report and Accounts to continue to reflect the principal risks and uncertainties of the Group over the remaining six months of the financial year.
Notes to the Group Condensed Interim Financial Statements (continued)for the six months ended 31 January 2015
40
ARYZTA AG Interim Report 2015

16 Distribution of interim reportThe Annual Report and Accounts, Interim Management Statements, Interim Report and Accounts and other useful information about the Company, such as the current share price, is available on our website www.aryzta.com.
We confirm our responsibility for the half year interim results and that to the best of our knowledge:
– The condensed set of interim financial statements comprising the Group consolidated income statement, the Group consolidated statement of comprehensive income, the Group consolidated balance sheet, the Group consolidated statement of changes in equity, the Group consolidated cash flow statement and the related notes have been prepared in accordance with IAS 34, Interim Financial Reporting;
– The review of operations includes a fair review of the information required by:
a) Regulation 8 (2) of the Transparency (Directive 2004/109/EC) Regulations 2007, being an indication of important events that have occurred during the first six months of the financial year and their impact on the condensed set of financial statements; and a description of the principal risks and uncertainties for the remaining six months of the year; and
b) Regulation 8 (3) of the Transparency (Directive 2004/109/EC) Regulations 2007, being related party transactions that have taken place in the first six months of the current financial year and that have materially affected the financial position or performance of the entity during that period; and any changes in the related party transactions described in the last annual report that could do so.
The Group’s auditor has not audited these half year interim results.
On behalf of the Board
Denis Lucey Owen KillianChairman, Board of Directors CEO, Member of the Board
of Directors
16 March 2015
Notes to the Group Condensed Interim Financial Statements (continued)for the six months ended 31 January 2015
41
ARYZTA AG Interim Report 2015