2015 Annual Convention - NCPA Annual Convention ... Key Points from the Digest • Sales are steady....
36
2015 Annual Convention Date: Tuesday, October 13, 2015 Time: 9:45 am – 11:15 am Location: Gaylord National Harbor Resort and Convention Center, National Harbor 11 Title: NCPA Digest, Sponsored by Cardinal Health: A Guide to Improved Pharmacy Practice Sponsored by Cardinal Health ACPE # 207-000-15-127-L04-P 0.15 CEUs ACPE # 207-000-15-127-L04-T Activity Type: Application-based Speaker: Donna West-Strum, Chair and Associate Profess of Pharmacy Administration, Research Associate Professor, The University of Mississippi Richard Jackson, PhD, President, Community Pharmacy Consulting Pharmacist and Pharmacy Technician Learning Objectives: Upon completion of this activity, participants will be able to: 1. Discuss financial performance trends in independent community pharmacy in 2014. 2. Outline how to utilize pharmacy average data to benchmark individual performance indicators from a community pharmacy. 3. Summarize key data to collect to assess pharmacy niche performance. Disclosures: Donna West-Strum is receiving an honorarium for this program. The conflict of interest was resolved by peer review of the slide content. Richard Jackson is receiving an honorarium for this program. The conflict of interest was resolved by peer review of the slide content. NCPA’s education staff declares no conflicts of interest or financial interest in any product or service mentioned in this program, including grants, employment, gifts, stock holdings, and honoraria. NCPA is accredited by the Accreditation Council for Pharmacy Education as a provider of continuing pharmacy education. This program is accredited by NCPA for 0.15 CEUs (1.5 contact hours) of continuing education credit.
Transcript of 2015 Annual Convention - NCPA Annual Convention ... Key Points from the Digest • Sales are steady....
2015 Annual Convention
Date: Tuesday, October 13, 2015 Time: 9:45 am – 11:15 am Location: Gaylord National Harbor Resort and Convention Center, National Harbor 11 Title: NCPA Digest, Sponsored by Cardinal Health: A Guide to Improved Pharmacy
Practice Sponsored by Cardinal Health ACPE # 207-000-15-127-L04-P 0.15 CEUs
ACPE # 207-000-15-127-L04-T Activity Type: Application-based Speaker: Donna West-Strum, Chair and Associate Profess of Pharmacy Administration,
Research Associate Professor, The University of Mississippi Richard Jackson, PhD, President, Community Pharmacy Consulting
Pharmacist and Pharmacy Technician Learning Objectives: Upon completion of this activity, participants will be able to: 1. Discuss financial performance trends in independent community pharmacy in 2014. 2. Outline how to utilize pharmacy average data to benchmark individual performance indicators from a
community pharmacy. 3. Summarize key data to collect to assess pharmacy niche performance. Disclosures: Donna West-Strum is receiving an honorarium for this program. The conflict of interest was resolved by peer review of the slide content. Richard Jackson is receiving an honorarium for this program. The conflict of interest was resolved by peer review of the slide content. NCPA’s education staff declares no conflicts of interest or financial interest in any product or service mentioned in this program, including grants, employment, gifts, stock holdings, and honoraria.
NCPA is accredited by the Accreditation Council for Pharmacy Education as a provider of continuing pharmacy education. This program is accredited by NCPA for 0.15 CEUs (1.5 contact hours) of continuing education credit.

1
NCPA Digest, Sponsored by Cardinal Health: A Guide to Improved Pharmacy Practice
Donna West-Strum is receiving an honorarium for this program. The conflict of interest was resolved by peer review of the slide content.
Disclosure
1. Discuss financial performance trends in independent community pharmacy in 2014.
2. Outline how to utilize pharmacy average data to benchmark individual performance indicators from a community pharmacy.
3. Identify key data to collect to assess pharmacy niche performance.
Learning Objectives

2
Methodology
Summarizes data from independent pharmacies nationwide
Independent owners having completed at least one year of operations with dispensing business participate
Electronic data collection
Self-administered survey; data from 2014
Data analyzed and published
– Public and Member version
– Geographic region, third‐party volume, location comparisons
Define Independent Pharmacy
Independent pharmacy is independently owned, not publicly traded
37% are independents

3
Penny for your thoughts….
What words or few words come to your mind when you think of the financial health of independent pharmacy?
Key Points from the Digest
• Sales are steady. Watch expenses!
• Tips from the best financial performers.
• Monitor financial health.
• Vital to local community: access, economic, political, patient outcomes.
• Changing health care environment.
• Quality is top of mind
• Significant part of health care team
• What else besides prescriptions?
4
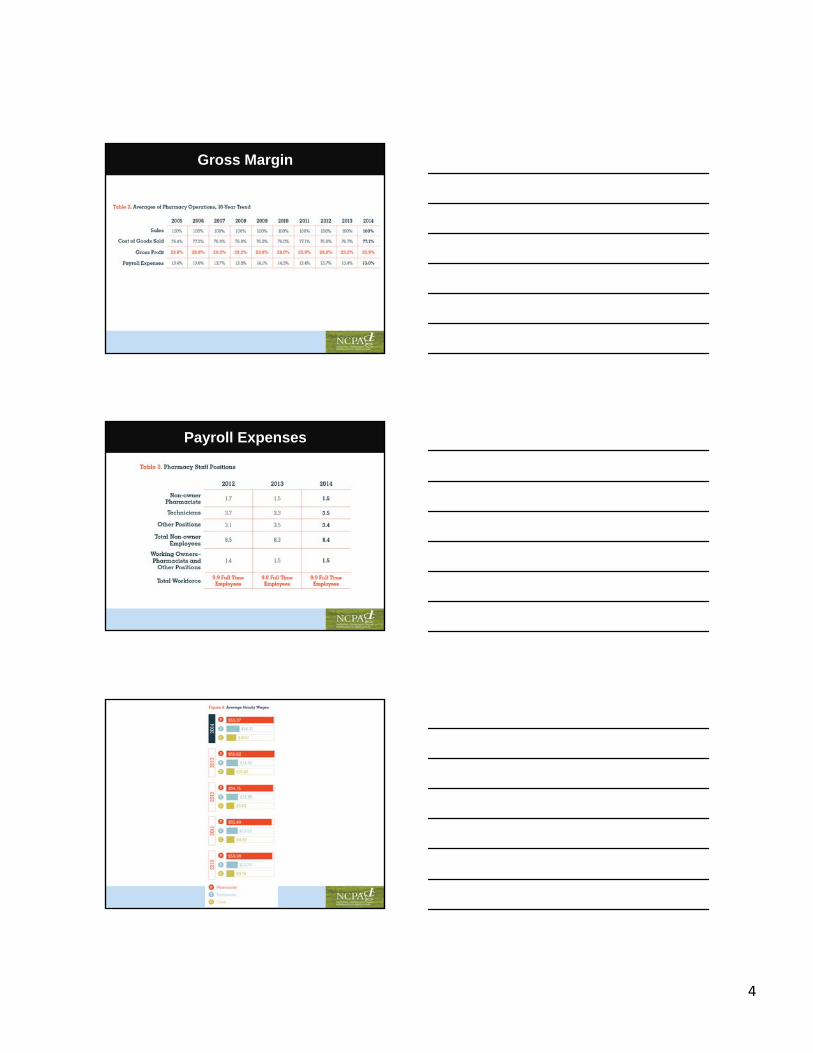
Gross Margin
Payroll Expenses

5
Cost of Dispensing
Total annual costs allocated to Rx department
Total annual number of Rxs dispensed
All pharmacies= $10.98, down from $11.17
Top Performers
All Top 25%
Sales $3,621,854 100% $3,705,691 100%
COGS $2,792,450 77.1% $2,671,803 72.1%
Gross margin
$829,404 22.9% $1,033,888 27.9%

6
Top Performers
*computer, rent, utilities, other expenses controlled by Top 25%
All Top 25%
Payroll expenses
$470,841 13.0% $463,211 12.5%
Other expenses*
$257,152 7.1% $211,224 5.7%
Net Profit $101,412 2.8% $359,452 9.7%
Financial Health
Critical Area Key Words
Profitability Gross Margin and Expense Controls
Productivity Staff Efficiency
Financial Position Managing Assets and Controlling Debt
Cash Flow Working Capital
Profitability Ratios
ALL Top 25%
PROFITABILITY RATIOS
2012 2013 2014 2012 2013 2014
Net operating income percentage
Net profit before
taxSales
2.9% 2.7% 2.7% 6.7% 6.4% 6.6%
Net operating income dollars before tax
Net profit before
tax
$95,845 $88,683 $88,021 $201,150 $198,212 $207,619

7
Productivity Ratios
ALL Top 25%
2012 2013 2014 2012 2013 2014
Sales per employee Sales# of employees incl.
owners
$498,374 $482,095 $448,727 $461,863 $459,032 $461,587
Staff costs per employee
Non-owner wage, tax, benefits
# of employees excluding owners
$49,782 $49,018 $45,021 $45,372 $45,988 $46,093
Prescription sales per square foot
Prescription salesPrescription dept.
square feet
$3,021 $3,107 $3,047 $3,103 $3,162 $3,184
All other sales per square foot
All other salesSquare feet excluding
prescription dept.
$124 $117 $112 $136 $141 $138
Total sales per square foot
Total salesSquare feet
$1,019 $1,089 $1,039 $1,059 $1,098 $1,109
Financial Position Ratios
FINANCIAL POSITION RATIOS
ALL Top 25%
Sales to assets
SalesTotal assets 4.9 4.7 4.5 5.59 5.51 5.56
Return on investment
Net operating income dollars
Net worth
20.2% 19.7
%
19.1% 50% 47% 45%
Cash Flow
2012 2013 2014
Current ratio Currentassets
Current liabilities
4.0 4.1 4.0
Quick ratio Cash + accounts
receivableCurrent
liabilities
1.66 1.73 1.70
8
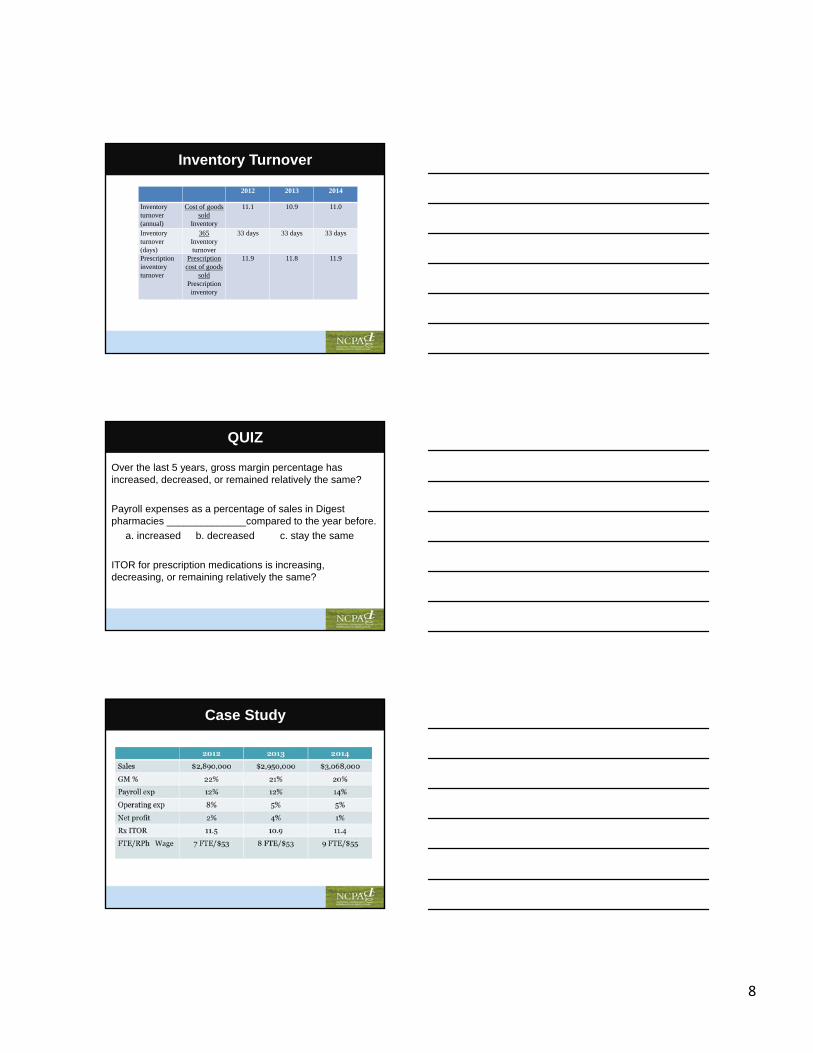
Inventory Turnover
2012 2013 2014
Inventory turnover (annual)
Cost of goods sold
Inventory
11.1 10.9 11.0
Inventory turnover (days)
365Inventory turnover
33 days 33 days 33 days
Prescription inventory turnover
Prescription cost of goods
soldPrescription
inventory
11.9 11.8 11.9
QUIZ
Over the last 5 years, gross margin percentage has increased, decreased, or remained relatively the same?
Payroll expenses as a percentage of sales in Digest pharmacies ______________compared to the year before.
a. increased b. decreased c. stay the same
ITOR for prescription medications is increasing, decreasing, or remaining relatively the same?
Case Study

9
Key Points from the Digest
• Sales are steady. Watch expenses!
• Tips from the best financial performers.
• Financially healthy.
• Working harder…..
• Vital to local community: access, economic, political, patient outcomes.
• Quality is top of mind
• Significant part of health care team
• What else besides prescriptions?
Vital to the Community
ACCESSRural: 33% serving population less than 10,000; Over 70% serving a population less than 50,000
Economic
Vital to the Community

10
Vital to the Community
Patient Outcomes
Leadership and Advocacy
Key Points from the Digest
• Working harder…..
• Vital to local community
• Changing health care environment
• Quality is top of mind
• Significant part of health care team
• What else besides prescriptions?
Quality is Top of Mind
Accreditation
EQUIPP- 78% monitor
quality measures using
EQUIPP or similar platform
Medicare Part D Star ratings,
Network decisions, P4P

11
Health Care Team
Health Care Team
Health Care Team: High Performance Pharmacies

12
2010 2011 2012 2013 2014
RxVolume
64,169 62,969 62,583 62,424 61,568
Prescription Volume
2010 2011 2012 2013 2014
RxVolume
64,169 62,969 62,583 62,424 61,568
Why??
13
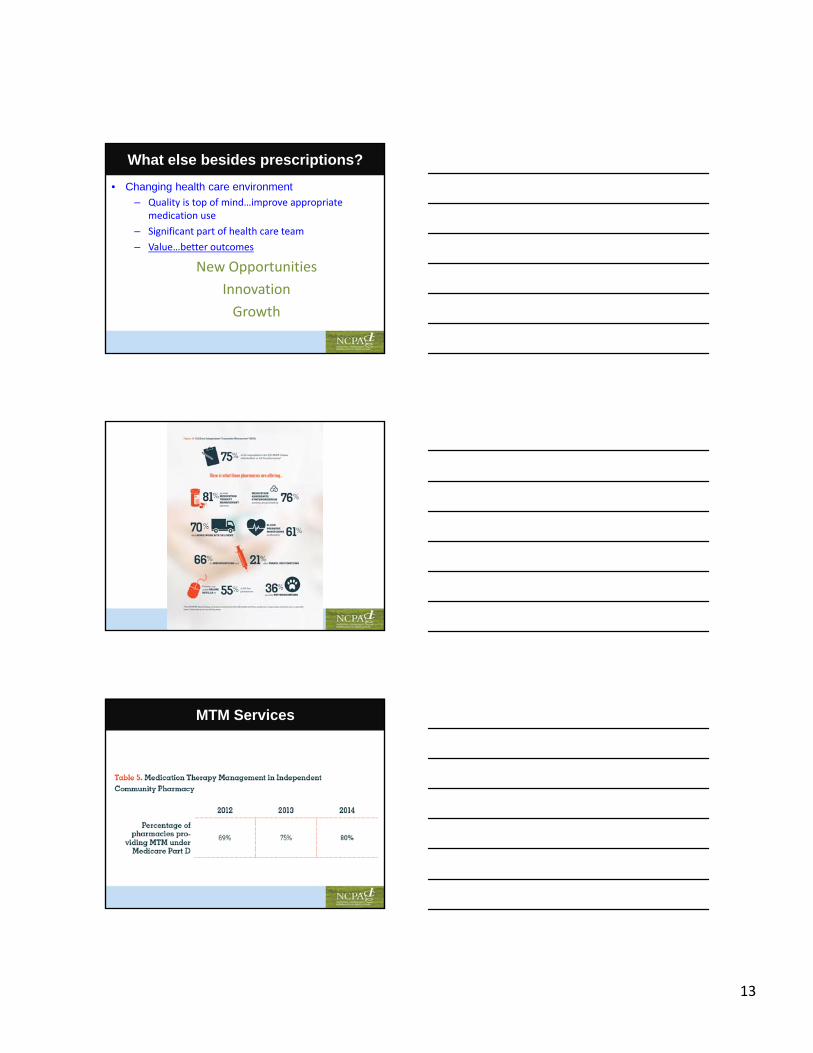
What else besides prescriptions?
• Changing health care environment
– Quality is top of mind…improve appropriate medication use
– Significant part of health care team
– Value…better outcomes
New Opportunities
Innovation
Growth
MTM Services

14
Adherence
Medication sync
– Increase prescription volume
– Streamlined workflow
– Better inventory control
– Easier to transition to patient care services
– Patients are more adherent

15
Patient Engagement
Identify New Niches
What types of financial information do you need to consider?
Look at the impact of your niche on P&L statement– Revenue generated from products and/or services
– Price and payer
– Cost of seeing a patient – allocate space (rent, electricity, etc); supplies; educational materials, staff
– Gross margin of products sold; space allocated to products; other specialty products
– Prescription volume trends
– Expenses‐ payroll, advertising, etc
– Ratios: Profitability, productivity, efficiency, cash flow

16
• Community pharmacists are staying competitive and growing as small businesses. They are financially healthy.
• Community pharmacists have great stories to tell about the many ways they care for their patients.
– Read the profiles in the DIGEST!
• They are leaders in the community. They impact the community economically as well as through their civic contributions.
• They are a vital part of the health care team.
Special thanks to….
• YOU for participating in survey
• Cardinal Health for funding
• NCPA staff
NCPA Digest, sponsored by Cardinal Health: A Guide to Improved Pharmacy Practice
Richard A. Jackson, Ph.D.Professor Emeritus, Mercer University College of Pharmacy and Health SciencesPresident, Community Pharmacy Consulting, Inc.

17
Disclosure
Richard Jackson is the President of Community Pharmacy Consulting. Mr. Jackson received an honorarium for this workshop. The conflict of interest was resolved by peer review of the slide content.
Improving Your Financial Picture
• More Profits
• Transferring Ownership
When is the Best Time to Answer a Question?
Answer: Before You Have To
18
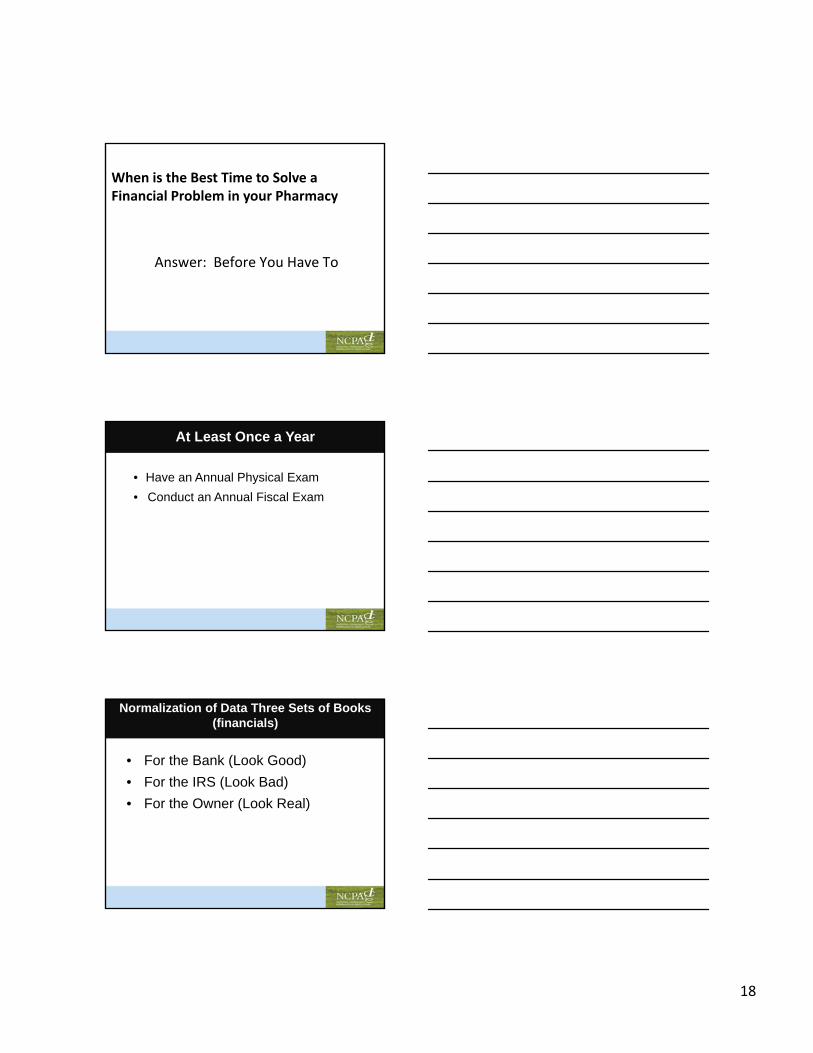
When is the Best Time to Solve a Financial Problem in your Pharmacy
Answer: Before You Have To
At Least Once a Year
• Have an Annual Physical Exam
• Conduct an Annual Fiscal Exam
Normalization of Data Three Sets of Books (financials)
• For the Bank (Look Good)
• For the IRS (Look Bad)
• For the Owner (Look Real)

19
Financial Analysis
• Comparative Analysis
• Ratio Analysis
• Identify Problems
• Describe Solutions (Action Plan)
• Define Measurable Outcomes (Goals)
• Measure Success
Comparative Analysis Income Statement
• Express Each Component of the Income Statement as a Percentage of Sales
• Compare to NCPA Digest Averages and Top 25%
Income Statement Analysis
• Cost of Goods Sold
• Expenses (Especially Personnel)

20
Comparative Analysis Balance Sheet
• Express Each Component of the Balance Sheet as a Percentage of Total Assets
• Compare with NCPA Digest Averages and Top 25%
Financial Ratio Analysis
• Profitability Ratios
• Productivity Ratios
• Financial Position Ratios
• Cash Flow Ratios
Profitability Ratios
• Net Profit Percentage
• Net Income $ (Net Profit plus Owner Salary)

21
Productivity Ratios
• Sales/Employee• Staff Salaries/Employee• Rx Sales/Sq. Ft.• Other Sales/Sq. Ft.• Total Sales/Sq. Ft.
Financial Position Ratios
• Sales/Assets
• Return on Investment (Net Profit/Net Worth)
• Debt/Net Worth
Cash Flow Ratios
• Current Ratio
• Quick or Acid Test Ratio
• Inventory Turnover
• Rx Inventory Turnover
• Accounts Receivable Turnover
• Accounts Payable Turnover

22
Areas For Improvement
• Profit
• Cost of Goods Sold
• Expenses
• Cash Flow
• Accounts Receivable
• Accounts Payable
• Inventory
Improving Profit Cost of Goods Sold
• Caveat: Even Small Differences Significant • Too high, not indication of too much
inventory
Beginning Inventory+ PurchasesCost of Goods Available for Sale- Ending InventoryCost of Goods Sold
Improving Profit Cost of Goods Sold
• Modify Pricing
• Evaluate Source of Supply
• Cash/Quantity Discounts
• Shoplifting/Pilferage
• Evaluate Third Parties

23
Third Party Dilemma Economics 101
In the long run, small business variable expenses do not increase in a linear fashion but stepwise.
Greatest variable expense is payroll.
Elementary Example
• 100 Rx’s/day
• Third party contract (Cost + $2.50) increases volume 10 Rx/Day to 110 Rx/Day
• Add 3 more contracts one at a time (Now 140/day)
• Hire part-time pharmacist 2 hours a day for $50/hour.
• Increased work 40%, same income
Improving Profits Expense Control
• Personnel (Salaries and Wages)
• Greatest Expense
• Example: Decrease payroll from 10% to 9% of sales and increase net profit $40,000 or over 30%
• To Decrease Payroll• Decrease Employees• Decrease Hours of Employees• Decrease Hours Pharmacy Open
24
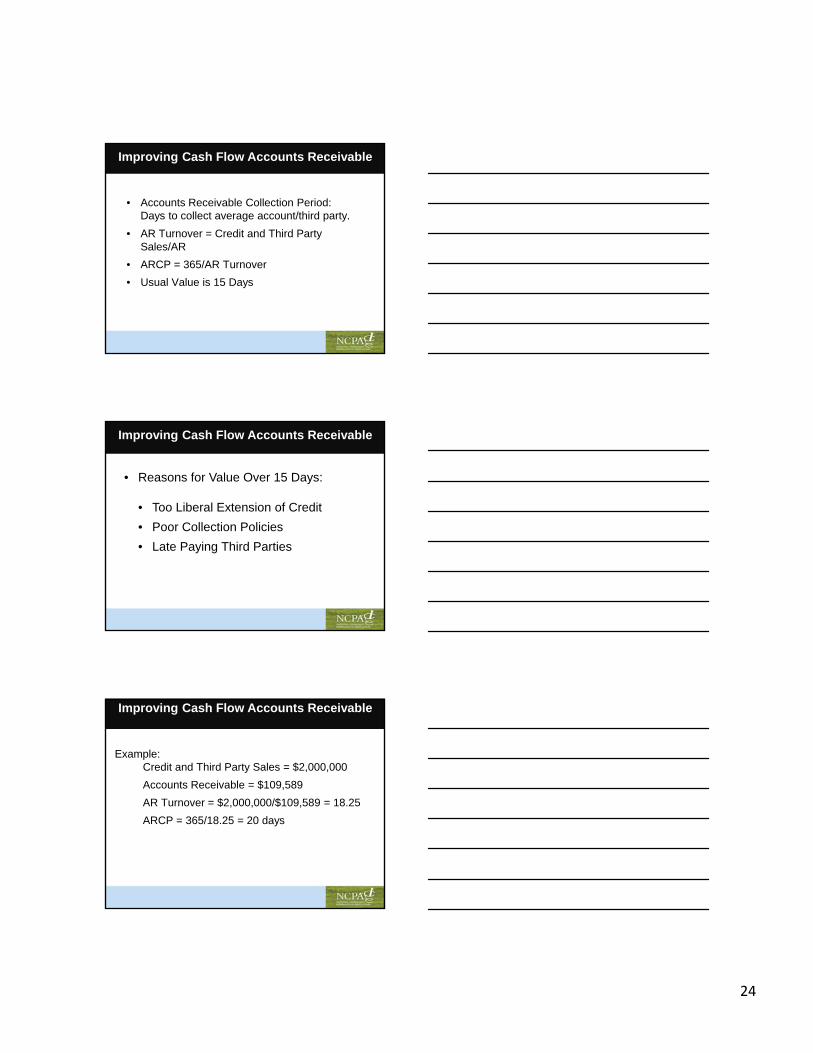
Improving Cash Flow Accounts Receivable
• Accounts Receivable Collection Period: Days to collect average account/third party.
• AR Turnover = Credit and Third Party Sales/AR
• ARCP = 365/AR Turnover
• Usual Value is 15 Days
Improving Cash Flow Accounts Receivable
• Reasons for Value Over 15 Days:
• Too Liberal Extension of Credit
• Poor Collection Policies
• Late Paying Third Parties
Improving Cash Flow Accounts Receivable
Example:Credit and Third Party Sales = $2,000,000
Accounts Receivable = $109,589
AR Turnover = $2,000,000/$109,589 = 18.25
ARCP = 365/18.25 = 20 days

25
Disclosure
To what would accounts receivable of $109,589 have to be reduced to produce an acceptable ARCP of 15 days?
AR Turnover = 365/15 = 24.5
AR Turnover = Charge and TP sales/AR
24.5 = $2,000,000/AR
Therefore, AR = $81,632
Improving Cash Flow Accounts Receivable
Improving Cash Flow Accounts Receivable
• How to Reduce Accounts Receivable
• More Selective Credit Extension• More Aggressive Credit Collection• Evaluation of Third Party Plans
Improving Cash Flow Accounts Payable
• Normal is 15 -25 Days
• Reasons for Too High Value (Low Cash)• Due to:
• High Accounts Receivable• High Inventory• Low Profits (High COGS, High Expenses)
26
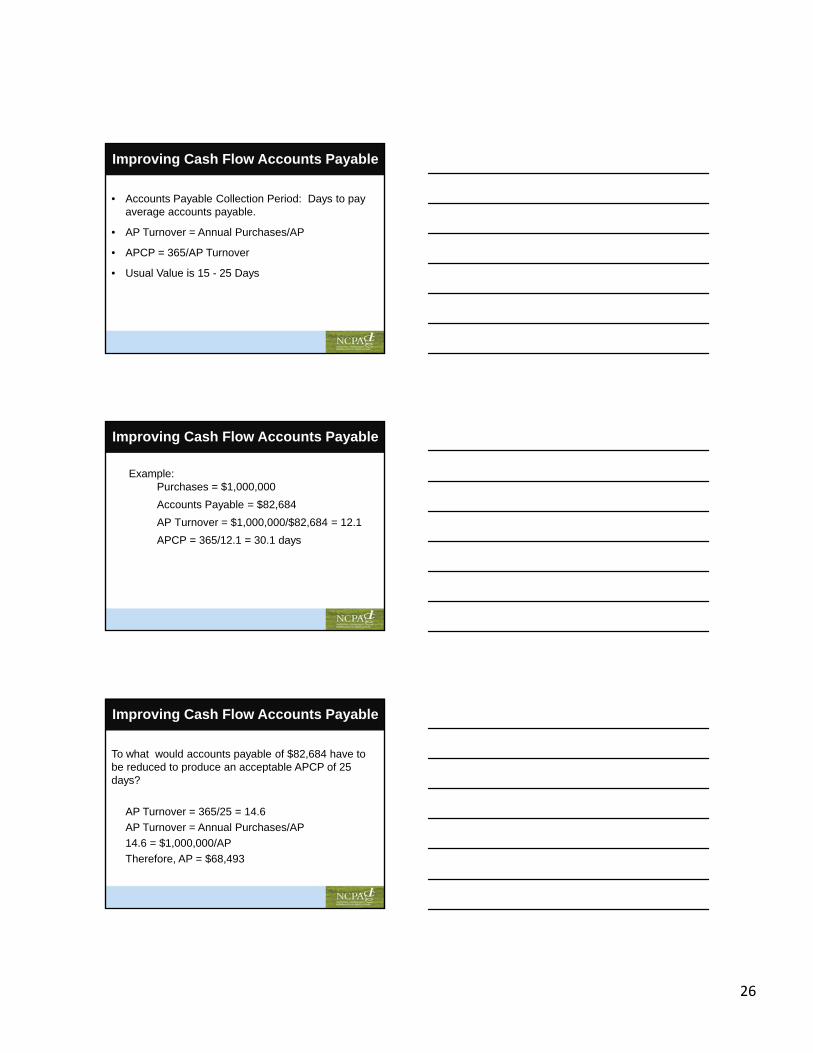
Improving Cash Flow Accounts Payable
• Accounts Payable Collection Period: Days to pay average accounts payable.
• AP Turnover = Annual Purchases/AP
• APCP = 365/AP Turnover
• Usual Value is 15 - 25 Days
Improving Cash Flow Accounts Payable
Example:Purchases = $1,000,000
Accounts Payable = $82,684
AP Turnover = $1,000,000/$82,684 = 12.1
APCP = 365/12.1 = 30.1 days
Improving Cash Flow Accounts Payable
To what would accounts payable of $82,684 have to be reduced to produce an acceptable APCP of 25 days?
AP Turnover = 365/25 = 14.6
AP Turnover = Annual Purchases/AP
14.6 = $1,000,000/AP
Therefore, AP = $68,493

27
Improving Cash Flow Accounts Payable
• How to Reduce Accounts Payable
• Increase Cash
• Decrease Accounts Receivable
• Decrease Inventory
• Increase Profits (Decrease COGS and Expenses)
Improving Cash Flow Inventory
• Largest Investment in Community Pharmacy
• Average Inventory
• Average Inventory Turnover
Improving Cash Flow Inventory
• Inventory Turnover = Cost of Goods Sold/Inventory
• Example:
• Cost of Goods Sold = $3,200,000
• Inventory = $400,000
• Inventory Turnover = $3,200,000/$400,000
• Inventory Turnover = 8.0

28
Improving Cash Flow Inventory
To what would inventory of $400,000 have to be reduced to produce a more acceptable inventory turnover of 10.0?
Inventory Turnover = COGS/InventoryIf Inventory Turnover = 10.0 then,10 = $3,200,000/InventoryTherefore, Inventory = $320,000A Reduction of Approximately $80,000 or $6,666 per month for 12 months
Improving Cash Flow Inventory
How to Reduce Inventory
Open to Buy (OTB) Budget
Open To Buy Budget
• Entire Pharmacy
• Department

29
Open To Buy Budget
• Determine monthly Purchase Budget to:
• Maintain desirable inventory level
• Achieve desirable inventory level
Personal Purchase Budget
• Monthly income previous month
• Expenditures previous month
Open-to-buy Budget: Based On Previous Months
• Sales
• Purchases

30
Open-to-buy Budget Adjusted Each Month
• Sales previous month compared to expected sales
• Purchases previous month compared to amount budgeted to purchase
Open To Buy Budget Example For October
• Projected sales this year: $200,000
• COGS = 75%
• Unadjusted Purchase Budget: $200,000 X 0.75 = $150,000
Assume Inventory at Desirable Level
Unadjusted Purchase Budget
• Amount of inventory to purchase (at cost) to replace “expected” sales

31
Adjustments To UPB
• Sales previous month compared to expected sales
• Purchases previous month compared to purchase budget
Adjustment For Sales
• Actual sales previous month (September) = $180,000
• Projected sales = $200,000
• Difference = $20,000
• Didn’t sell as much as projected
• Therefore, purchase less this month
• Adjustment = $20,000 x 0.75 = $15,000 (minus)
Adjustment For Purchases
• Purchase budget previous month (September) = $160,000
• Actual purchases = $150,000
• $160,000 - $150,000 = $10,000 (plus)
• Need to purchase ($10,000) more this month
32
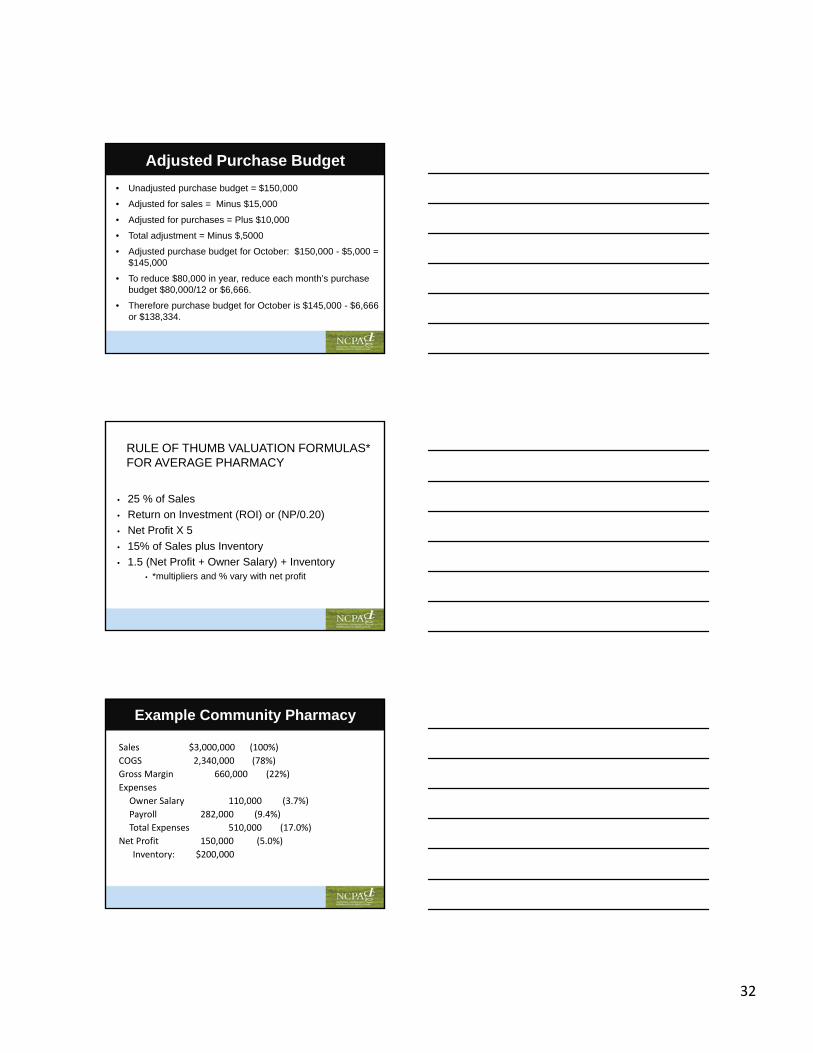
Adjusted Purchase Budget
• Unadjusted purchase budget = $150,000
• Adjusted for sales = Minus $15,000
• Adjusted for purchases = Plus $10,000
• Total adjustment = Minus $,5000
• Adjusted purchase budget for October: $150,000 - $5,000 = $145,000
• To reduce $80,000 in year, reduce each month’s purchase budget $80,000/12 or $6,666.
• Therefore purchase budget for October is $145,000 - $6,666 or $138,334.
RULE OF THUMB VALUATION FORMULAS*FOR AVERAGE PHARMACY
• 25 % of Sales
• Return on Investment (ROI) or (NP/0.20)
• Net Profit X 5
• 15% of Sales plus Inventory
• 1.5 (Net Profit + Owner Salary) + Inventory• *multipliers and % vary with net profit
Example Community Pharmacy
Sales $3,000,000 (100%)
COGS 2,340,000 (78%)
Gross Margin 660,000 (22%)
Expenses
Owner Salary 110,000 (3.7%)
Payroll 282,000 (9.4%)
Total Expenses 510,000 (17.0%)
Net Profit 150,000 (5.0%)
Inventory: $200,000

33
Impact On Selling Price
• Decrease COGS 1% to 77%
OR
• Decrease Payroll 1% to 8.4%
Impact On Selling Price
Now
Decrease COGS 1% to 77% OR
Payroll 1% to 8.4% ($30,000)
Decrease COGS 1% to 77% AND
Payroll 1% to 8.4% ($30,000)
X(NP + OS) + Inventory
$590,000 $693,000 $808,000
Average $685,000 $823,250 $964,500
Difference $138,250 $279,500
Impact On Selling Price
Now
Decrease COGS 1% to 77% OR
Payroll 1% to 8.4% ($30,000)
Decrease COGS 1% to 77% AND
Payroll 1% to 8.4% ($30,000)
% of Sales $750,000 $900,000 $1,050,000
ROI/NP $750,000 $900,000 $1,050,000
% Sales + Inventory
$650,000 $800,000 $950,0000

34
In Summary: Ways To Use Benchmarks
• Improving Profit
• Decreasing Cost of Goods Sold
• Decreasing Expense (Personnel)
• Improving Cash Flow
• Increasing Cash
• Decreasing Accounts Receivable
• Decreasing Accounts Payable
• Decreasing Inventory