2015 Annual Convention - NCPA · 2015 Annual Convention Date: Monday, ... resolved by peer review...
24
2015 Annual Convention Date: Monday, October 12, 2015 Time: 8:00 am – 9:30 am Location: Gaylord National Harbor Resort and Convention Center, National Harbor 11 Title: Profit Mastery: It’s All About Gross Margin ─ the Primary Controllable Profit Drivers Sponsored by PCCA ACPE # 207-000-15-115-L04-P 0.15 CEUs ACPE # 207-000-15-115-L04-T Activity Type: Application-based Speaker: Steve LeFever, MBA, CFE, Chairman and Founder, Business Resource Services Pharmacist and Pharmacy Technician Learning Objectives: Upon completion of this activity, participants will be able to: 1. Apply gross margin drivers to your pharmacy financial information. 2. Calculate the effects of different management decisions on gross margin. 3. Relate gross profit roadmap to your pharmacy’s financial management. Disclosures: Steve LeFever is the Chairman and Founder of Business Resources Services. The conflict of interest is resolved by peer review of the slide content. NCPA’s education staff declares no conflicts of interest or financial interest in any product or service mentioned in this program, including grants, employment, gifts, stock holdings, and honoraria. NCPA is accredited by the Accreditation Council for Pharmacy Education as a provider of continuing pharmacy education. This program is accredited by NCPA for 0.15 CEUs (1.5 contact hours) of continuing education credit.
Transcript of 2015 Annual Convention - NCPA · 2015 Annual Convention Date: Monday, ... resolved by peer review...

2015 Annual Convention
Date: Monday, October 12, 2015 Time: 8:00 am – 9:30 am Location: Gaylord National Harbor Resort and Convention Center, National Harbor 11 Title: Profit Mastery: It’s All About Gross Margin ─ the Primary Controllable Profit Drivers
Sponsored by PCCA ACPE # 207-000-15-115-L04-P 0.15 CEUs
ACPE # 207-000-15-115-L04-T Activity Type: Application-based Speaker: Steve LeFever, MBA, CFE, Chairman and Founder, Business Resource Services Pharmacist and Pharmacy Technician Learning Objectives: Upon completion of this activity, participants will be able to: 1. Apply gross margin drivers to your pharmacy financial information. 2. Calculate the effects of different management decisions on gross margin. 3. Relate gross profit roadmap to your pharmacy’s financial management. Disclosures: Steve LeFever is the Chairman and Founder of Business Resources Services. The conflict of interest is resolved by peer review of the slide content. NCPA’s education staff declares no conflicts of interest or financial interest in any product or service mentioned in this program, including grants, employment, gifts, stock holdings, and honoraria.
NCPA is accredited by the Accreditation Council for Pharmacy Education as a provider of continuing pharmacy education. This program is accredited by NCPA for 0.15 CEUs (1.5 contact hours) of continuing education credit.


PROFIT MASTERY: It's All About Gross Margin -
the Primary Controllable Profit Drivers
Washington, DC October 12, 2015 8:00 am - 9:30 am
Program Sponsored byPCCA
by
Steve LeFever Chairman
Business Resource Services, Inc.
Business Resource Services Inc.
Phone 1-800-488-3520 Seattle, WA

Statements and Ratio Analysis
DEFINITION......Financial position refers to the economic condition of your business in comparison to its own past performance and to other companies of similar size.
REVIEW..............Section One reviewed the basic legal and tax issues affecting all businesses. The information in this section actually provides the means for a critical analysis of management roles and business organization in relation to both tax and non-tax issues.
IMPACT ..............Determining your financial position is crucial to “fine tuning” your management decisions. It provides the level of detail a business owner needs to make sound choices.
RESULTS ............The information derived from financial position calculations lets you focus your attention on the causes of your business’ financial strengths and weaknesses. With this information you can take positive action to keep what is working and to improve what isn’t.
The Goal:
Determining your solvency, risk, and efficiency
The Tools:
Statement Spread Sheets Financial Management Ratios
Cause and Effect “Road Map”
©BRS 2015 2 NCPA Conference 2015

Key Terms
Assets ...................................................................... Everything that the business owns — including such items as cash, inventory, prepaid expenses, and vehicles.
Balance Sheet................................................. A statement of financial position that shows the assets, liabilities and net worth of the business.
Current Assets ............................................... What the business owns that’s expected to be turned into cash within one year — such as accounts receivable and inventory.
Liabilities ............................................................ What the business owes to creditors — to the people who supply funds that must be repaid. Debt is another term for liability.
Current Liabilities...................................... Obligations that are due to be repaid within one year.
Long-Term Debt .......................................... Obligations that are scheduled to be repaid in a period greater than one year.
Net Worth .......................................................... What the business owes to the owners — the investment that the owners have in the company. Also called owners’ equity.
Retained Earnings ...................................... The net profits (positive or negative) from the income statement that are left to accumulate in the business.
Leverage .............................................................. The increased rate of return that is made on net worth by using debt to acquire assets.
Income Statement ....................................... The summary of the revenues, costs and expenses of a company that are recognized during an accounting period.
Gross Profit ...................................................... Sales minus the Cost of Goods Sold, which is the cost of buying raw materials and producing finished goods.
Net Profit............................................................. The amount remaining after all expenses have been met. The difference between total sales and total costs and expenses.
©BRS 2015 3 NCPA Conference 2015

Seven Steps to Business Success
1. Plan Properly before start up
2. Monitor financial position
3. Understand the relationship between price, volume,and costs
4. Manage Cash Flow
5. Manage Growth6. Borrow Properly
7. Plan for transition
Financial Operating Cycle
Assets = Liabilities + Net Worth Sales
Balance Sheet
Efficiency
Income Statement
1. To pay for new assets2. To pay off debt3. To pay out to the owners
Net Profit
Uses of Profits:
Net Profits Cash Flow
4

Case Study Lake’s Pharmacy
Brad and René Lake’s Pharmacy originally opened in 1997 in a small town just outside of a large metro area. (They had both worked for a family owned pharmacy for 10 years.)
The new business was a gradual success based on the strength of Brad and René’s experience and their desire to provide a full service pharmacy.
Both of them enjoyed the great growth in their community as the metropolitan area expanded into their community. Last year, they began to plan an expansion of their location, with a section of the new facility set aside for cognitive and disease state management services. This year, they opened the enlarged store and increased the hours of operations from 55 hours per week to 58 hours per week. They also invested $50,000 to help pay for the leasehold improvements. Brad and René have increased their participation in third-party prescriptions from 50% to 83% over the three years as a way to attract more business to their improved location.
It's now the end of their fiscal year, and they have come to you for financial assistance. They are flushed with excitement, telling you things will be great if they can just get the funds they need to get “over the hump.” They brush off any talk of problems as “only temporary.”
What observations can you offer?
ACTION STEPS:
Step 1. Gather accurate financial information.
Step 2. Package the information so you can see relationships.
Step 3. Calculate financial ratios.
Step 4. Record your industry composites (if available).
Step 5. Compare your results.
Step 6. Analyze the possible causes of problems.
Step 7. Take action — formulate a plan, implement it, and monitor the results.
5
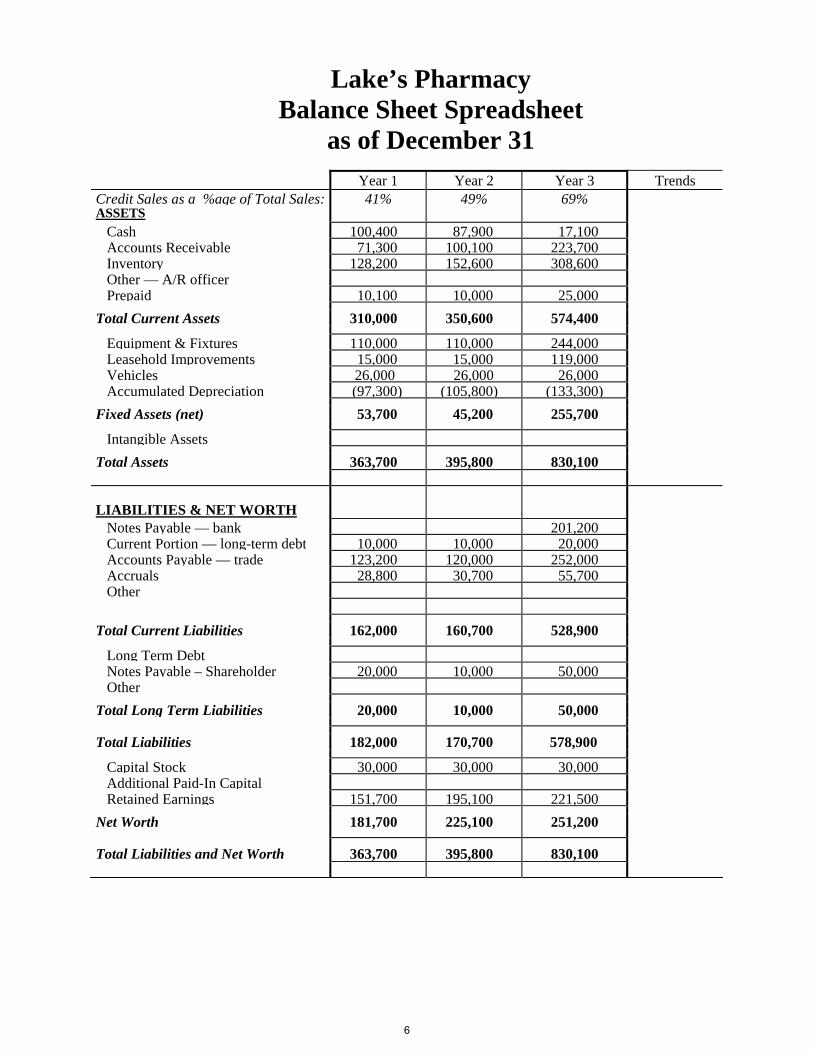
Lake’s Pharmacy Balance Sheet Spreadsheet
as of December 31 Year 1 Year 2 Year 3 Trends
Credit Sales as a %age of Total Sales: 41% 49% 69% ASSETS Cash 100,400 87,900 17,100 Accounts Receivable 71,300 100,100 223,700 Inventory 128,200 152,600 308,600 Other — A/R officer Prepaid 10,100 10,000 25,000 Total Current Assets 310,000 350,600 574,400
Equipment & Fixtures 110,000 110,000 244,000 Leasehold Improvements 15,000 15,000 119,000 Vehicles 26,000 26,000 26,000 Accumulated Depreciation (97,300) (105,800) (133,300) Fixed Assets (net) 53,700 45,200 255,700
Intangible Assets Total Assets 363,700 395,800 830,100
LIABILITIES & NET WORTH Notes Payable — bank 201,200 Current Portion — long-term debt 10,000 10,000 20,000 Accounts Payable — trade 123,200 120,000 252,000 Accruals 28,800 30,700 55,700 Other
Total Current Liabilities 162,000 160,700 528,900
Long Term Debt Notes Payable – Shareholder 20,000 10,000 50,000 Other Total Long Term Liabilities 20,000 10,000 50,000
Total Liabilities 182,000 170,700 578,900
Capital Stock 30,000 30,000 30,000 Additional Paid-In Capital Retained Earnings 151,700 195,100 221,500 Net Worth 181,700 225,100 251,200
Total Liabilities and Net Worth 363,700 395,800 830,100
6

Lake’s Pharmacy Income Statement Spreadsheet
for the 12 months ending December 31 Year 1 Year 2 Year 3 Trends
Square Footage 1700sq’ 1700sq’ 3000sq’
Sales Prescriptions 1,377,000 1,558,000 2,614,500 Other Sales 323,000 342,000 535,500
Total Sales 1,700,000 1,900,000 3,150,000
Cost of Goods Sold 1,261,400 1,451,600 2,545,200
Gross Profit 438,600 448,400 604,800
Expenses
Owner’s Compensation 95,000 95,000 90,000 Salaries and Wages 134,500 148,800 231,000 Payroll Taxes & Benefits 26,600 28,900 45,000 Rent 26,000 26,000 40,000 Utilities 8,500 8,600 12,500 Prescription Containers 5,000 5,700 7,500 Telephone 5,500 5,800 8,300 Delivery Expenses 5,100 5,600 8,000 Repairs and Maintenance 1,600 1,700 3,500 Auto Expenses 1,700 1,900 2,300 Travel & Schools 2,800 4,800 3,900 Computer Expenses 3,200 3,900 8,000 Postage 3,300 4,000 6,100 Bank Fees 2,500 3,100 4,100 Advertising 12,200 13,500 23,000 Professional Services 4,600 7,500 7,700 Office Supplies & Expenses 8,700 9,400 11,200 Insurance 8,500 8,900 17,000 Bad debts 800 600 200 Depreciation 8,500 8,500 27,500 Other 3,750 1,100 1,400
Total Expenses 367,350 393,300 558,200
Operating Profit 70,250 55,100 46,600
Interest 2,250 3,900 15,000 Other Income
Net Profit Before Taxes 68,000 51,200 31,100
Tax 12,000 7,800 4,700
Net Profit After Tax 56,000 43,400 26,400
FTE Employees 5 5.5 8
7

Lake’s Pharmacy Ratio Analysis Spreadsheet
Year 1 Year 2 Year 3Industry Composite
RMA*
Calculations, Trends, or
Observations BALANCE SHEET RATIOS: Stability (or “Staying Power”) 1. Current Current Assets
Current Liabilities 1.91 2.18 3.6
2. Quick Cash + Accts. Rec.
Current Liabilities 1.06 1.17 1.55
3. Debt-to-Worth Total Liabilities
Net Worth 1.00 .76 0.48
INCOME STATEMENT RATIOS: Profitability (or “Earning Power”) 4. Gross Margin Gross Profit
Sales 25.8% 23.6% 23.2%
5 Net Margin Net Profit Before Tax
Sales 4.0% 2.7% 2.7%
PRODUCTIVITY RATIOS: 6. Sales per Employee Sales
Total Employees $283M $271M $447K
7. Sales per Sq. Foot Sales
Square Feet $1,000 $1,118 $1,161
ASSET MANAGEMENT RATIOS: Overall Efficiency Ratios 8. Sales-to-Assets Sales
Total Assets 4.67 4.80 5.47
9. Return on Assets Net Profit Before Tax
Total Assets 18.7% 12.9% 12.56%
10. Return onInvestment
Net Profit Before Tax
Net Worth 37.4% 22.8% 23%
11. GMROI Gross Profit $’s
Inventory 3.42 2.94 3.27
ASSET MANAGEMENT RATIOS: Working Capital Cycle Ratios 12. Inventory
TurnoverCost of Goods Sold
Inventory 9.8 9.5 10.4
13. InventoryTurn-Days
365
Inventory Turnover 37 38 35
14. Accounts Receivable Turnover
Credit Sales
Accounts Receivable 9.8 9.3 24.3
15. Accounts Receivable Turn-Days
365
Accts. Rec. Turnover 37 39 15
16. Accounts PayableTurnover
Cost of Goods Sold
Accounts Payable 10.2 12.1 24.3
17. Average PaymentPeriod-Days
365
Accts. Pay. Turnover 36 30 15
All values from 2009 NCPA Digest
8

9

1
Low Gross Margin (Ratio #4)
No Cash Discounts on Payables
Low
Productivity
Poor
Inventory
Control
ShrinkageBookkeeping
Errors
Poor
Buying
Poor
Pricing
Low Gross
Margin
Their Peers’ Margin: 23.2%
Low Gross Margin (Ratio #4)
What’s their Low Gross Margin costing?
Their Margin in Year 3: 19.2%
Difference 4%
Sales in Year 3: ~ $3,150,000 X
margin difference: ~ X .04
Margin $ Left on the Table: $126,000
Primary Impact: Profit
©BRS 2015 10 NCPA Conference 2015

1
Low Gross Margin (Ratio #4)
No Cash Discounts on Payables
Low
Productivity
Poor
Inventory
Control
ShrinkageBookkeeping
Errors
Poor
Buying
Poor
Pricing
Low Gross
Margin$126,000 (P)
Employee Productivity
• Peers achieve $447,000 in sales/employee
• $3,150,000 / $447,000 = 7 employees (target)
• S t a f f costs = $90,000 + $231,000 + $45,000 =
$366,000
• $366,000 / 8 staff = ~$45,000 per employee
• Therefore, a reduction to target (7) would save$45,000
©BRS 2015 11 NCPA Conference 2015

1
Discounts on Payables
• H i s current cash position does not allow them totake these discounts
• C O G S ~ $2,500,000
• I f they take discounts on 50% of this and thediscount offered it 2% …
$1,250,000 x .02 = $25,000 in missed discounts
Poor buying and poor pricing
• I f he can manage just a 1% improvement in eachof these areas:
– Buying: 1% x $2,500,000 = $25,000
– Pricing: 1% x $3,150,000 ~ $31,000
©BRS 2015 12 NCPA Conference 2015

1
Low Gross Margin (Ratio #4)
No Cash Discounts on
Payables
Low Productivity
Poor
Inventory
Control
ShrinkageBookkeeping
ErrorsPoor Buying
Poor
Pricing
Low Gross
Margin$126,000 (P)
$ 45,000 (P) $25,000 (P)
$31,000 (P)
Other Considerations
- Inventory - A/R - Hidden Costs - Proper Financing
$ 25,000 (P)
©BRS 2015 13 NCPA Conference 2015

Mark-Up Versus Margin: Clarifying the Issue
There are many people who believe mark-up and margin are the same thing — and sometimes they are. But generally they're not. The issue is how to arrive at a target selling price when you know the cost. The important concern here is the amount of gross profit dollars contributed from sales to cover general overhead.
Here's a simple example to illustrate the point:
Item selling price: $ 1.50
Item cost: $ 1.00
Does this price-cost relationship represent 50% mark-up or 33% mark-up?
Regardless of your answer, we can safely say that this example represents a gross profit margin of 33%. The standard income statement format gives us the following:
Gross Profit Margin = Gross Profit Dollars (GPM) Total Sales
Since: Total Sales $1.50– Cost of Goods Sold 1.00
Gross Profit .50
Gross Profit Margin % = .50 = .33 = 331/3% 1.50
©BRS 2015 14 NCPA Conference 2015

The Real Question Is: what mark-up does this represent? Or, stated another way, how much do you have to mark up a product over cost to produce a 331/3% gross profit margin? The answer here depends on how you define mark-up. Here are the two possible definitions:
Definition A (the common definition):
Mark-Up = Selling Price – Cost Cost
= 1.50 – 1.00 1.00
= 50%
Definition B (as defined by retailers):
Mark-Up = Selling Price – Cost Selling Price
= 1.50 – 1.00 1.50
= 331/3%
It's important to note that either definition of mark-up leads to a 331/3% gross profit margin. Using the more conventional definition, it requires a 50% mark-up to produce a 331/3% gross profit margin, but retailers would say it requires a 331/3% mark-up. In other words, mark-up and margin are the same thing when using the retail definition.
We believe that confusion — and errors! — arise when you hear someone say the mark-up and the margin are the same (Definition B), then conclude that you simply multiply the cost by the mark-up (Definition A) to get the margin.
15

Here's an example: you assume that you can get a 40% margin by using a 40% mark-up (Definition A), so you do the following with an item costing $1.00:
WRONG!
$1.00 40% = $0.40 mark-up
Selling Price = $1.40
But this does not yield a 40% margin:
Sales $1.40– Cost 1.00 Gross Profit $0.40
Gross Profit Margin = Sales – Cost Sales
= 1.40 – 1.00 1.40
= 28.6%
As you can see, marking up the cost 40% produces only a 28.6% gross profit margin. Such a mistake would produce a shortfall of 12% — or $120,000, if sales were $1,000,000.
The moral: understand how to set prices; it's the gross profit you need. Mark-up only represents a concept to produce gross profit. If you confuse these issues, it can cost you dearly in dollars and cents.
Standard (Definition A) MARK-UP/MARGIN Table
COSTMARGIN % MULTIPLIER MARK-UP %
662/3% 3.00 200%
60% 2.50 150%
50% 2.00 100%
331/3% 1.50 50%
25% 1.33 331/3%
Now try a few examples using a cost of $1.00 to verify that it works — and how it works.
16

Lake’s Pharmacy Ratio Analysis Spreadsheet
Year 1 Year 2 Year 3Industry Composite
Calculations, Trends, or
Observations
BALANCE SHEET RATIOS: Stability (or “Staying Power”) 1. Current Current Assets
Current Liabilities 1.91 2.18 1.09 3.60 574,400
528,900
2. Quick Cash + Accts. Rec.
Current Liabilities 1.06 1.17 0.46 1.55 240,800
528,900
3. Debt-to-Worth Total Liabilities
Net Worth 1.00 .76 2.3 0.48 578,900
251,200
INCOME STATEMENT RATIOS: Profitability (or “Earning Power”) 4. Gross Margin Gross Profit
Sales 25.8% 23.6% 19.2% 23.2% 604,800
3,150,000
5 Net Margin Net Profit Before Tax
Sales 4.0% 2.7% 1.0% 2.7% 31,100
3,150,000
PRODUCTIVITY RATIOS: 6. Sales per Employee Sales
Total Employees $340K $345K $394K $447K 3,150,000
8
7. Sales per Sq. Foot Sales
Square Feet $1,000 $1,118 $1,050 $1,161 3,150,000
3,000
ASSET MANAGEMENT RATIOS: Overall Efficiency Ratios 8. Sales-to-Assets Sales
Total Assets 4.67 4.80 3.79 5.47 3,150,000
830,100
9. Return on Assets Net Profit Before Tax
Total Assets 18.7% 12.9% 3.7% 12.56% 31,100
830,100
10. Return onInvestment
Net Profit Before Tax
Net Worth 37.4% 22.8% 12.4% 23% 31,100
251,200
11. GMROI Gross Profit $’s
Inventory 3.42 2.94 1.96 3.27 604,800
308,600
ASSET MANAGEMENT RATIOS: Working Capital Cycle Ratios 12. Inventory
TurnoverCost of Goods Sold
Inventory 9.8 9.5 8.2 10.4 2,545,200
308,600
13. InventoryTurn-Days
365
Inventory Turnover 37 38 45 35 365/ 8.2
14. Accounts Receivable Turnover
Credit Sales
Accounts Receivable
9.8 9.3 9.7 24.3 3,150,000x.69223,700
15. Accounts Receivable Turn-Days
365
Accts. Rec. Turnover 37 39 38 15 365/ 9.7
16. Accounts PayableTurnover
Cost of Goods Sold
Accounts Payable 10.2 12.1 10.1 24.3 2,545,200
252,000
17. Average PaymentPeriod-Days
365
Accts. Pay. Turnover 36 30 36 18 365/10.1
All values from 2009 NCPA Digest
17

Profit Mastery Assessment (PMA) Summary Report Lake’s Pharmacy
Cash Profit (NPBT) Inventory $64,000
Hidden Costs & Interest $16,000
A/R $134,200
Hidden Costs & Interest $33,550
Gross Margin $126,000
Labor $45,000
Buying $25,000
Pricing $31,000
Cash Discounts $25,000
Refinance $102,500
Other Other Other Totals $300,700 $175,500
©BRS 2015 18 NCPA Conference 2015

$126
K (P
)
$45K
(P)
$25K
(P)
$25K
(P)
$31K
(P)
$64K
(C)
$49,
550
(P)
$134.2
K (
C)
$102.5
K (C
)
©BRS 2015 19 NCPA Conference 2015


NCPA National Convention October 12, 2015Washington, DC
Program Title: “Profit Mastery: It's All About Gross Margin - the Primary Controllable Profit Drivers”
(1 Hour 30 Minutes)
Assessment Questions (Answers in BOLD)
1. The Financial Operating Cycle includes:
a. The P&Lb. The Balance Sheetc. Company Tax Returnd. Bank Loanse. Inventory
2. Which of the following are uses for net profit in a pharmacy business?
a. Dividendsb. Repay Debtc. Open A New Locationd. Lease Equipmente. Buy Assets
3. Identify the three basic components of the Working Capital Cycle. Cash, Inventory,Accounts Receivable
4. A pharmacy’s Debt-to-Worth ratio moves from 2.1 to 3.7 from one year to the next. Is the companybecoming more, or less, risky? More
5. Identify at lease two possible causes of a shrinking gross profit margin.
Shrinkage Poor bookkeeping Poor pricing Poor inventory control Not taking discounts Low productivity Poor buying
©BRS 2015 20 NCPA Conference 2015

Steve LeFever, Chairman and Founder, Profit Mastery
Finance = boring. For Steve LeFever, this equation doesn’t work.
With a superior command of his subject material, he makes finance compelling, interesting, and funny. Steve’s unique ability to take complex topics and translate them into plain English separates him from the crowd.
Our clients routinely tell us they never expected to take away so much new knowledge from a keynote speech. Steve has a rare skill – being able to motivate business owners and advisors to enthusiastically explore the financial workings of a business and change the areas that need changing. Steve will make you believe that finance ≠ boring; instead you’ll agree with him when he says, “Finance is fun!”
Compelling Subject Matter - Financial management education is repeatedly cited as the single greatest need for business owners across all industries. Steve LeFever is the acknowledged expert on the subject. Our educational programs take the mystery out of the numbers. Audience members with differing levels of expertise will gain specific tools that can be applied immediately to improve the financial health of their companies.
Industry Knowledge - Steve possesses a breadth of knowledge and experience in banking, finance, and small business management. His work with the Risk Management Association (RMA), the Association of Small Business Development Centers (ASBDC), and financial institutions around the globe help keep his insights sharp and his information relevant to business owners, operators, and managers.
Part comedian, part financial manager, former commercial banker, current entrepreneur, and 100% world-class presenter, Steve drives home his message with a no-nonsense, laugh-out-loud approach that makes him the top-rated presenter at virtually every conference he attends. For over 20 years, Steve has combined humor and practical knowledge in hard-hitting, substantive presentations. His ratings currently rank him as the highlight of our clients’ conventions in a wide spectrum of industries.
An internationally-recognized author and advocate for independent business, Steve’s book, “Profit Mastery: Knowledge-Driven Financial Performance” has sold over one million copies.
Steve has travelled widely, and the Profit Mastery program has been presented on three continents in eight languages over two decades to hundreds of thousands of business owners, managers, commercial bankers, accountants, and business coaches.
Bio
Profit Mastery 200 First Avenue West Suite 301 Seattle, WA 98119Toll Free 800.488.3520 Email [email protected] Web profitmastery.net
© 2015 Busines Resource Services