Franklin County Sanitary Landfill - Landfill Gas (LFG) to Liquefied ...

2015. 12. 8
Sung-Sik Moon, Director General
Department of Environmental Industry Support

2
I. KEITI Introduction
II. Green Public Procurement & GHG Reduction
III. Domestic Waste Management Policy
V. Overseas Project on Waste to Energy
Table of Contents

3
I. KEITI Introduction

4
HR 430 employees
385 million USDBudge
I. KEITI Introduction

5
I. KEITI Introduction
Train environmental Industry ·Technical
professional and Create Jobs
Collect Environmental Industry, ·Technical
Information, Utilization and Education, PR
Develop environmental industry and
support expansion to overseas market
Environment loan, Eco-friendly
creative economy center
operation of 5 overseas offices
Promote green product life
Promote eco-friendly management and low
carbon management by company
Relieve environmental damage and
manage chemical materials
Manage eco-friendly product, support
environmental healthㆍsafety for the
vulnerable social group
Operate Environmental Mark, Carbon
Achievement Carbon score label
Certificationㆍverification
environmental technology and
certification of green technology
Train professionals and
provide informationCertification Evaluation
Develop environmental industry Distribute eco-friendly
business models
Support environmental health ‧
safety management
Environmental Technology (R&D)
Planning, Evaluation, Management
Environmental Technology R&D
Key Functions and Programs

6
I. KEITI Introduction
UAE
Japan
Nicaragua
Angola
Libya
Tunisia
Brazil
Colombia
Turkey
U.KGermany
China
Thailand
Russia
Ireland
PhilippinesMalaysia
Kuwait
Italy
Pakistan
USA
Tanzania
Vietnam
Indonesia
Cambodia
AzerbaijanUzbekistan
Mozambique
Mongolia
Algeria
Chile
Peru
Australia
Sri Lanka
Turkmenistan
Iran
Ghana Nigeria
Saudi Arabia
Switzerland
Romania
FranceBangladesh
Canada
Mexico
Conggo
India
Bulgaria
28.3%
34.5%
Middle East
/Afirca
Asia
20.5%
China
USA/Japan/Europe
10.7%
5.9%
414 environmental cooperation projects in 75 countries (2014)
KEITI’s overseas cooperation
Central South America
Master Plan
20 countries 19 projects
Feasibility Study
52 countries 137 projects
Market Pioneering
13 countries
Joint International
Localization
23 countries 245 projects

7
II. GPP & GHG reduction
8
Purpose: energy and waster savings, prevent wasteful use of resources and
environmental pollution, contribute to sustainable development by
encouraging green purchasing in public sectors
Public org. are obliged by the Act to produce and report to MOE
- Implementation Plan with voluntary GPP targets
- Performance Report with the amount of green product purchased
II. GPP& GHG reduction
Product groups
Number of Products
Certification Authority
Website
Good Recycled MarkKorea Eco-Label
153 categories including office
equipment, construction materials
2,092 companies, 13,345 products (As of Oct. 2015)
Ministry of Environment
http://www.ecoi.go.kr
15 categories including waste paper,
glass
183 companies, 224 products(As of Oct. 2015)
Ministry of Trade, Industry and Energy
http://www.gr.or.kr
Act on Promotion of Green Products Purchase

9
MOE Overall Management
PPSExecuting & Monitoring
Centralized GPP
KEITICollating GPP plans/records
& Evaluating
State AgenciesExecute GPP
Provide direction and
supervision
Provide technical
Assistance
Submit Implementation Plan
and Records via GPIP
Commission Procurement
over certain thresholds
Execute GPP
Over certain thresholds
Report the monitoring
and evaluation results
Provide centralized GPP
records via KONEPS
Provide green products
information
II. GPP& GHG reduction
Institutional arrangement of GPP in Korea

10
The total amount of green public purchase rose steadily following the adoption of the
Act on Promotion of Green Purchase from 2005
II. GPP& GHG reduction
Performance of the GPP in Korea
0.79 0.86
1.34
1.58 1.63 1.64 1.65 1.73
2.04
2.20
0.00
0.50
1.00
1.50
2.00
2.50
2005 2006 2007 2008 2009 2010 2011 2012 2013 2014
Total expenditure in green purchase(billion USD)

11
The Act was instrumental in nurturing eco
products and producers in both quantity and
quality
Market competitiveness of eco products
increased in terms of price and quality
The market share of eco-labeled products
reached at 37 billion USD in 2014
GPP play a key role in greening the relevant
industries
II. GPP& GHG reduction
Performance of the GPP in Korea
Unit(billion USD)
companies
pcroducts
Sales figures

12
The purchase of energy and water saving products resulted in 543,000 tons of CO2
reduction in 2014 and 4.8 million tons of CO2 emission reduction for the past 10 years
The environmental benefits from GPP are 3.8 billion USD in 2014, and 12.3 billion USD
for the past 9 years
II. GPP& GHG reduction
Performance of the GPP in Korea
554696 656 708 660 701
1,821
2,745
3,823
108
316495
601 620 538 544 491 532 543
0
500
1000
1500
2000
2500
3000
3500
4000
4500
2005 2006 2007 2008 2009 2010 2011 2012 2013 2014
Environmental Benefits
(million USD)
GHG emission reduction
(thousand ton)

13
III. Domestic Waste Management Policy

14
Waste
Discharge
& Collection
Separate waste
discharge & collection
Automatic waste
collection system
Waste
Pre-treatment
Waste Recycling
Demolition waste
Separation & Sorting
Middle
processing
of waste
Incinerators
MBT
Pyrolysis
Waste
to energy
Combustible Waste
to Energy
Organic Waste to
Gas Energy
LFG Power
Bioreactor
Final
Disposal
Sanitary Landfill
Maintenance &
Restoration
of non-sanitary
landfill
Sustainable landfill
Stepwise technologies for waste treatment in Korea
III. Domestic Waste Management Policy

15
To build Resource Recirculation Society, Waste to Energy Activities have been
under study and commercially utilized
Process Advantage Disadvantage
Incinerator (WTE)
Decrease of Final Waste
Sanitary Treatment
Energy Recovery (Heat + Power)
High Construction and O&M
Cost
Refuse Derived FuelCombustible Waste Recycling
Energy Recovery
Not economical
(Low Yield & low sales cost)
Difficult in Control
Organic Waste to Biogas CH4 Production (To be used as fuel)
Sludge to Compost High Cost & Technology
Landfill Gas to EnergyGHGs Reduction (CH4 Utilization)
Energy Recovery (Heat + Power)Irregular LFG Production
Bioreactor + LFG Energy
(Improved LFG Utilization)
More GHGs Reduction(CH4 Utilization)
More Energy Recovery(Heat + Power)
Landfill Early Stabilization
Added bioreactor system
Cost
Advantages and disadvantages of waste treatment technologies
III. Domestic Waste Management Policy

16
ProcessConstruction
Cost(USD/30y)
Energy
Recovery(%)
Endurance
Period(year)
Total Operating
Cost(USD)
Days of
operation(day/year)
Incineration 600 million(Excl. Landfill construction)
20 ~ 30 30 450 million 330
RDF 200 million(Excl. Landfill construction)
10 ~ 15 30 300 million 265
Landfill Gas
to Energy120 million 5 ~ 10
30+20(Depends on the site size)
60 + 10 million 365
Bioreactor +
LFG Energy130 million 7 ~ 15
30+10(During
+After operation)
75 + 5 million(During
+After operation)
365
Comparison of Construction Cost in South Korea (Capacity of treatment : 1,000ton/day)
UNFCCC’s CDM projects of LFG
Country No. Business itemRegistration
date
Reduction
(tCO2e/y)
IRR (%)
Including CER
Peru 708 Huaycoloro landfill gas capture and combustion 2007.05 298,996 21.2
China 887Shenzhen Xiaping Landfill Gas Collection
and Utilization Project2007.05 471,619 30.0
Korea 941 Sudokwon Landfill Gas Electricity Generation Project 2007.04 1,210,342 5.9
Mexico 1123 Ciudad Juarez Landfill Gas to Energy Project 2007.11 170,499 10.2
Cost comparison in each technology
III. Domestic Waste Management Policy

17
Demand for Korean model is high among the developing countries
Economic and environmental benefit
Greenhouse gas reduction → Reduce the risk of global Climate Change
☞ A strong chance as GCF business model
Home
Waste
LandfillLFG Power
Plant
Electricity
Produces
Goes to Landfill
Produces methane
Generates
Supplies
Landfill GasPower Plant
Project
Mitigation
EconomicBenefit
RenewableEnergy
CDMProject
LFG Power Plant Project
III. Domestic Waste Management Policy

18
1991
2000
2006
2013`
1991 Established SUDOKWON Landfill Site
Operation and Management Corp.
1992 Initial intake of wastes
2000 2nd landfill opened for usage(1st landfill closed
2004 Acquired an ISO 14001 accreditation
2013 Opened Dream
Park
golf club
History of SUDOKWON Landfill Site
III. Domestic Waste Management Policy

19
Size(10,000 m2) Capacity
(10,000 tons]Life Time
Total Landfill Others
1,541 1,405 136 22,80030 years from
now
Landfill size and Capacity
야생화단지
4th Landfill Site
3rd Landfill Site 1st Landfill Site
WildflowerComplex
Reports Complex
Waterway
2nd Landfill Site)
SUDOKWON Landfill Overview
III. Domestic Waste Management Policy

20
Solid Recovered Fuel Plant
Design Capacity: 200 ton/d
Converting wastes into fuel and
energy
Eco-Friendly SanitaryLandfill Operation
Quick, Safe & Sanitary
landfill operating system
Eco-friendly Waste
management technology
Leachate Treatment Technology
Design Capacity : 6,700 ton/d
(Daily processing amount: 4,300
ton/d)
Aim to ‘Zero discharge Leachate
Treatment System’
Sludge Recovery Plant
Capacity : 2,000 ton/d
Turning sewage sludge into fuel
50MW LFG Power Plant
CDM Project for Recycling LFG
UNFCCC Issue more than 800,000 CO2 tons of CERs annually to SL
Corp.
SUDOKWON Landfill Overview
III. Domestic Waste Management Policy

21
Environmental Effect
The total issued CERs : 6 million CO2 tons
(As of August, 2015)
2 million CO2 tons sales: about $ 3milions
CDM project period for 10 years (2007 ~
2017)
Total CERs about 8million CO2 tons
Odor prevention
Greenhouse gas reduction
Prevention of LFG explosion
Equivalent to substitution for
crude oil worth 55 mil. USD
Sales of power $40 million/y
Energy supply 180,000 homes
Job creation
Possibility of overseas project
Economic Effect CDM Project
Utilizing LGF generated from landfill waste processing as the source of energy
→ import-substituting effect by generating new and renewable energy
Recognized by UNFCCC as a CDM project
→ Actively engaging in international efforts to respond to climate change
50 MW LFG Power Plant & CDM Project
LandfillManifold Station for
Gas Transmission
50MW Landfill GasPower Generation
III. Domestic Waste Management Policy

22
V. Overseas Project on Waste to Energy
23
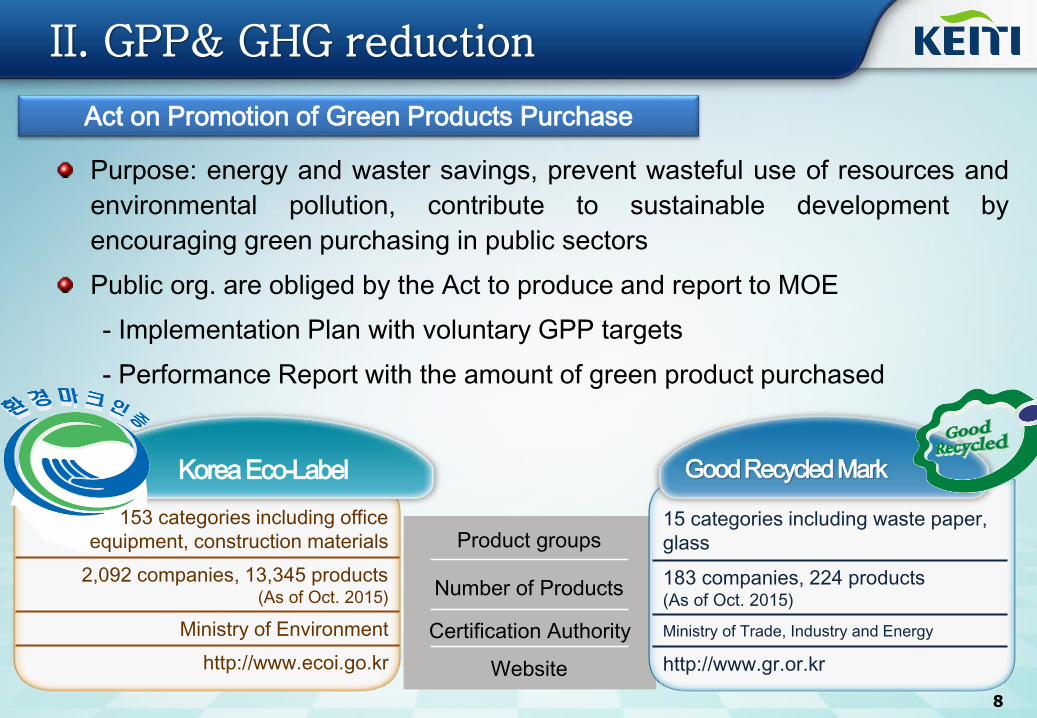
V. Overseas project on Waste to Energy
Governmental financial
support
PPPGrant & Loan
combined
support
ODA Fund
R&D SupportJoint
International
Localization
Attract investment to
countries for export
Type of financing on Environmental Project
24
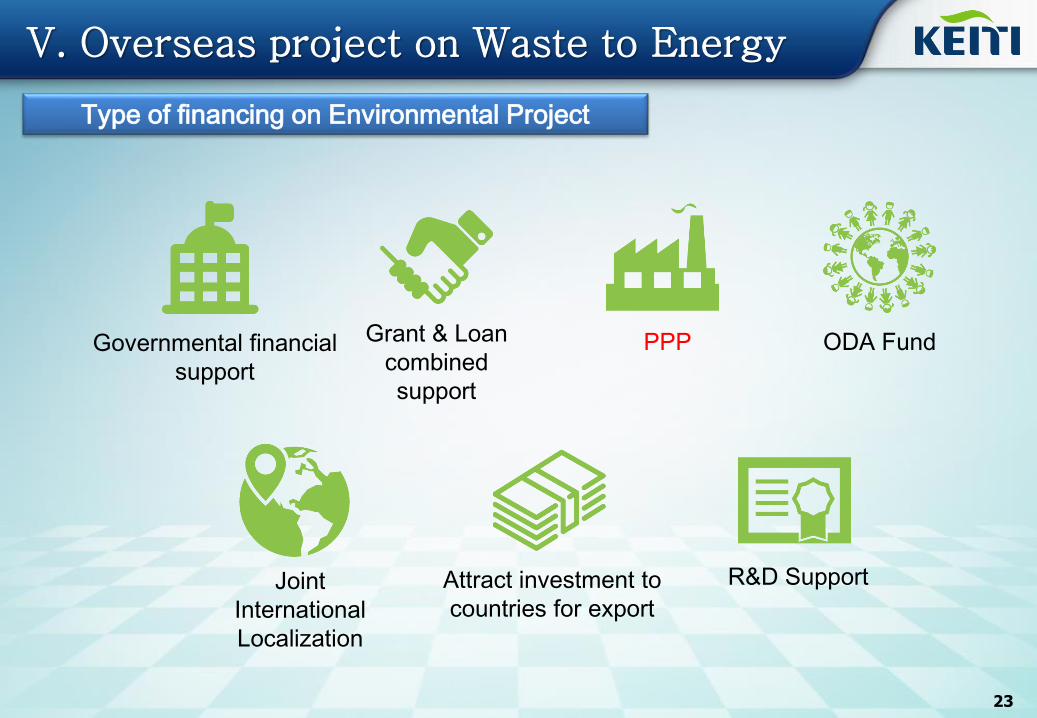
Lima Centro
30km
Project Site
Population : 1.55million persons
Collection area : 15 points
Development of Landfill Power Plant at Lima, in Peru
Project
Backgroud
Lima city’s landfills emit a large amount of LFG and cause global warming
even though the city has proper waste collection systems
Collecting LFG utilizing it as fuel to produce electricity will reduce the
GHG emissions and bring economic benefits
V. Overseas project on Waste to Energy

25
Project
Summary
Waste generation : 7,918 ton/d
Landfill size : 107 ha, waste in-take 1,500 ton/d
Project Scope : Construction of 7.4 MW LFG power plant, LFG collection
system with bioreactor, Power generation system, power grid system
Project Period : 22 years (Construction: 2 years, operation: 20 years)
Project Cost : USD 26.69 million
Propulsion
Details
March 2012 : Completion of Feasibility Study supported by KEITI
July 2015 : Submission of GCF Proposal (DOHWA → CAF → GCF Secretariat)
Dec., 2015 : PPP proposal preparation & SPC establishment
Early 2016 : Final approval of GCF proposal (expected)
Executive Summary
V. Overseas project on Waste to Energy

26
DOHWA
Consortium
(DOHWA, SLC,
Others)
LFG development project
SPC
GCF PSF
EquityLURIN Landfill
(Portillo Grande)EPC/O&M
LIMA
Municipality
Permission and
approval for project
Land provision
/monitoring
PERU Power
AuthorityFinancial Investor
(FI)
PPA
(including MRG)Senior Loan
Accredited entities
(CAF)
Peruvian
Local
Company
Partnership
Loan
29.69 mil. USD
4.8 mil. USD
19.2 mil. USD
5.7mil. USD
Governance Structure of the Project
V. Overseas project on Waste to Energy

27
YearLFG emission
(㎥/min)
LFG collection
(70%)
Baseline
methane
Emission
(tCO2)
Average Power
generation
(MW)
Baseline Power
Plant Emission
(tCO2)
Project emission
(tCO2)
Total Emission
Reduction
(1,000 tCO2eq)
Cumulative
Emission
Reduction
(1,000 tCO2eq)
2016 72.86 51.00 200,962 5.30 26,022 3,361 224 440
2020 81.99 57.39 226,141 6.30 30,932 3,361 254 1,410
2025 89.86 62.90 247,853 6.30 30,932 3,361 275 2,747
2030 95.24 66.67 262,708 7.40 36,333 3,361 296 4,182
2034 98.40 68.88 271,416 7.40 36,333 3,361 304 5,386
Average 87.41 61.19 241,107 6.43 31,570 3,361 269
LFG generated is estimated to be average of 61.2㎥/ min during the project period
Power production the LFG is expected to be up to 7.4 MW (average 6.43MW)
Reduction of 5.4 million tons of CO2eq for 20 years
Expectation of Landfill Gas & CO2 emission reduction (Normal condition)
V. Overseas project on Waste to Energy

28
Economic
BenefitsSocial
Benefits
Environmental
Benefits
Technical
Benefits
Revenue from electricity generation
Lima city could receive excess earnings
Job creation : Job opportunity
of local community during
construction and operation
Reduce Greenhouse gas
5,400,000 tCO2eq for 20years
(269,000 tCO2eq per year)
LFG collection : odor reduction,
well–being of its citizens
Systematic treatment
of leachate– environmental
enhancement such as prevention
of water pollution
Technical Transfer & Training- Bioreactor method
- Soil covering technology
- LFG refining & storage tech
- Gas engine generation tech
- Monitoring Tech on LFG
emission and reduction
Reduce potential gas explosion
and fire on the landfill
Becoming successful case of
GHG reduction activity
Benefits of the project
V. Overseas project on Waste to Energy