
Landfill Gas Model for the Philippines and LFG Energy...
45
Landfill Gas Model for the Philippines and LFG Energy Project Evaluation and Assessment Philippine Landfill Forum Bryce Lloyd February 21-22, 2012 Manila, Philippines
Transcript of Landfill Gas Model for the Philippines and LFG Energy...
Landfill Gas Model for the Philippines and LFG Energy Project Evaluation and
Assessment
Philippine Landfill Forum
Bryce Lloyd February 21-22, 2012 Manila, Philippines
Presentation Outline
• GMI - Philippine LFG Model • Comparison to IPCC model • LFG and ER Estimation • LFG Project Assessment • LFG Project Evaluation • Q&A
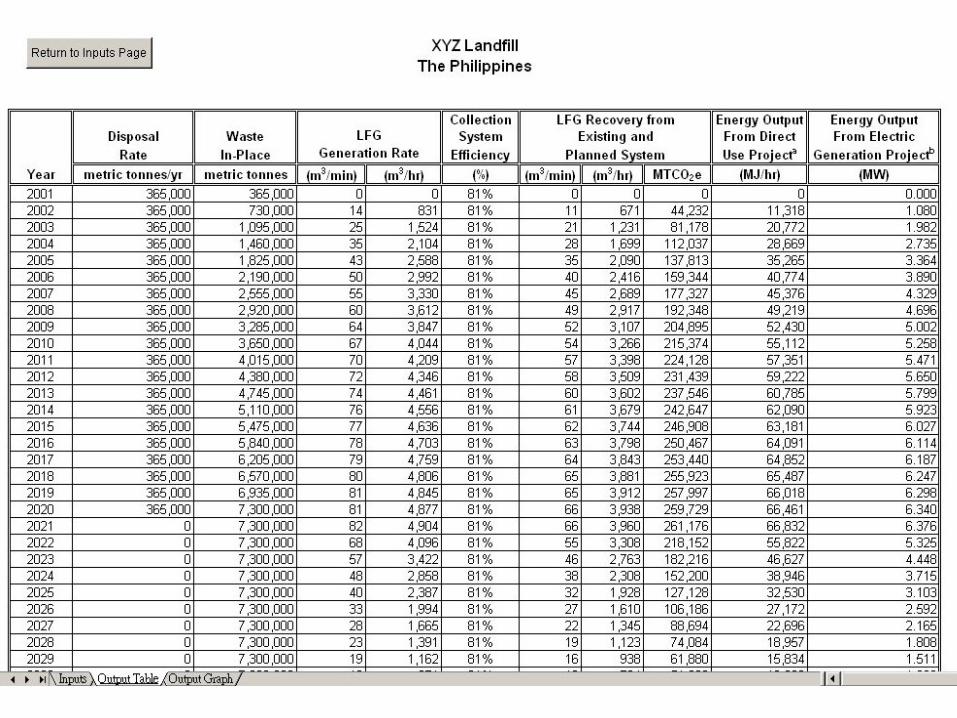
Philippines Landfill Gas Model Version 1.0
Provides landfill owners, operators, and developers with a realistic tool to evaluate the feasibility and potential benefits of recovering and utilizing LFG for production of energy for various potential end uses.
Available on the web at the following link: http://www.epa.gov/lmop/international/index.html • Based on USEPA LandGEM and IPCC guidelines
• Excel® spreadsheet - FOD model
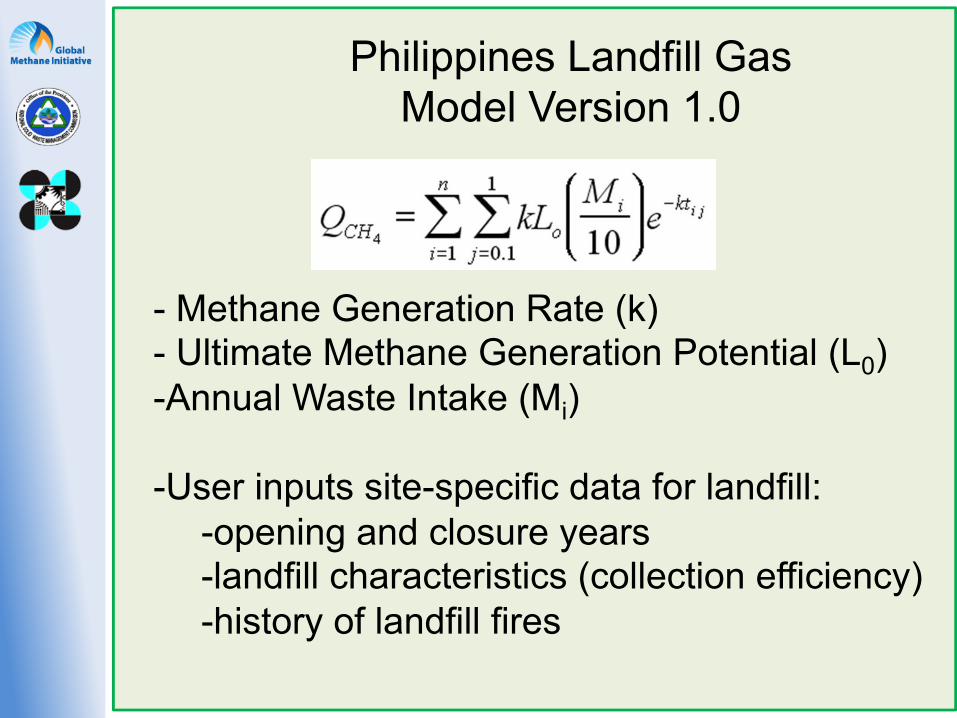
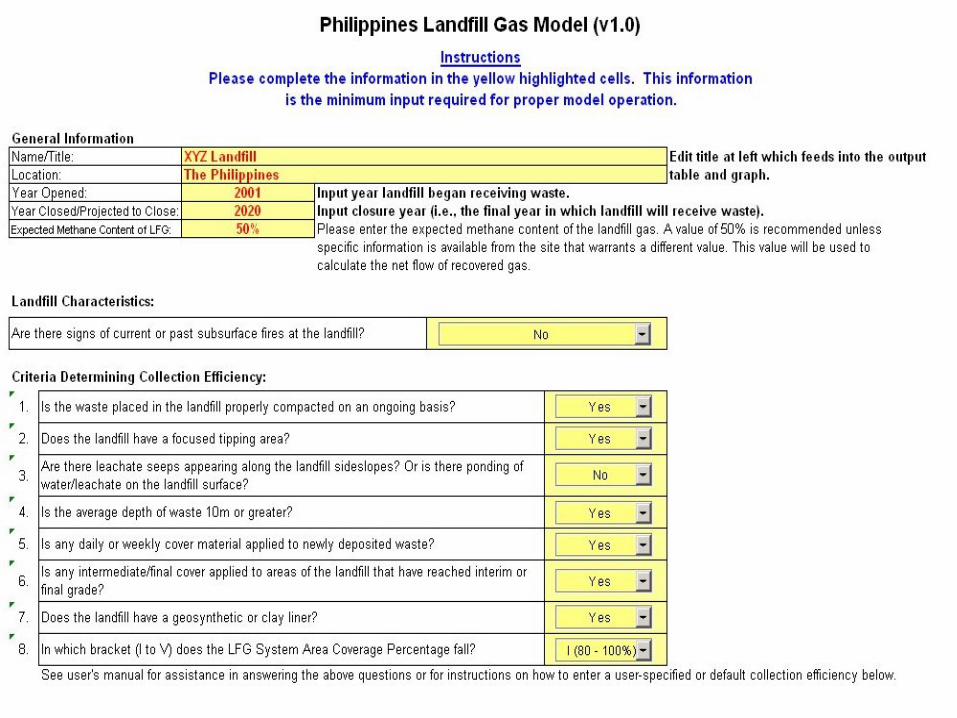
- Methane Generation Rate (k) - Ultimate Methane Generation Potential (L0) - Annual Waste Intake (Mi) - User inputs site-specific data for landfill:
- opening and closure years - landfill characteristics (collection efficiency) - history of landfill fires
Philippines Landfill Gas Model Version 1.0
Philippines Landfill Gas Model Version 1.0
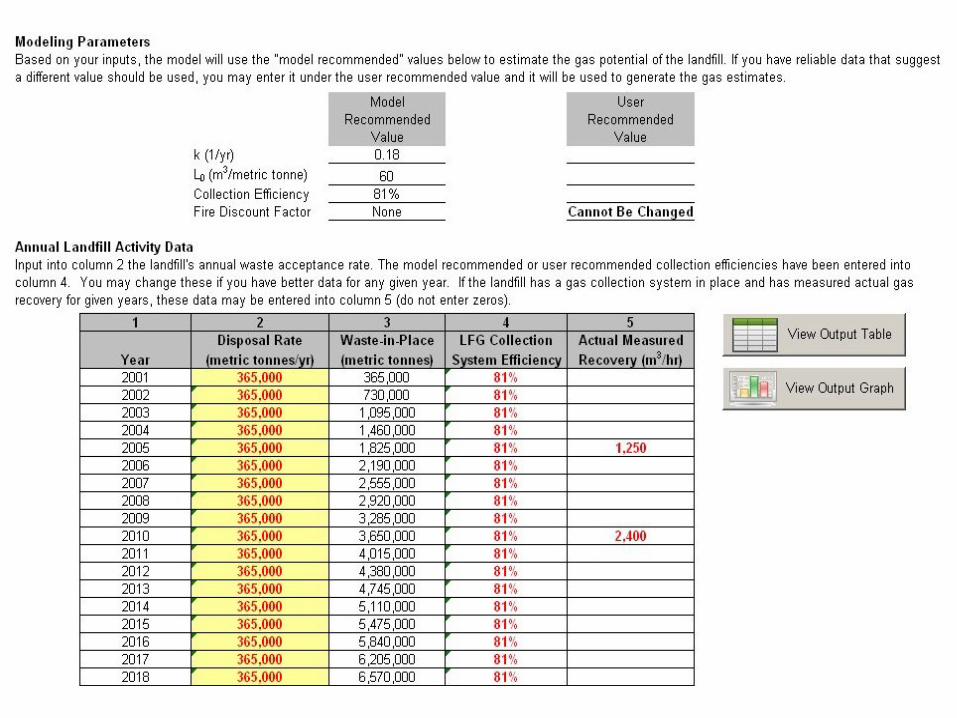
• Based on the user’s input, the model calculates recommended values for the following parameters: – k (Methane Generation Rate) – L0 (Ultimate Methane Generation Potential) – Fire Discount Factor – Collection Efficiency
• The model estimates LFG generation and recovery rates with parameters using waste intake and recommended values (or user defined values)
• The recommended values for model parameters were developed using data on Philippines’ – Average waste composition across a number of
cities and regions – Waste disposal methods and practices – Waste composition from various regions – Observed landfill operating practices and
conditions • Model allows users to override default parameters
(only recommended when confident values are obtained)
Philippines Landfill Gas Model Version 1.0
Methane Generation Rate (k)
• The recommended default average k value for Philippines is 0.18
• In very dry areas (annual rainfall <
1,000mm) and/or for landfills with very dry wastes (water content < 30%), a lower value of k (e.g., 0.10) may be appropriate
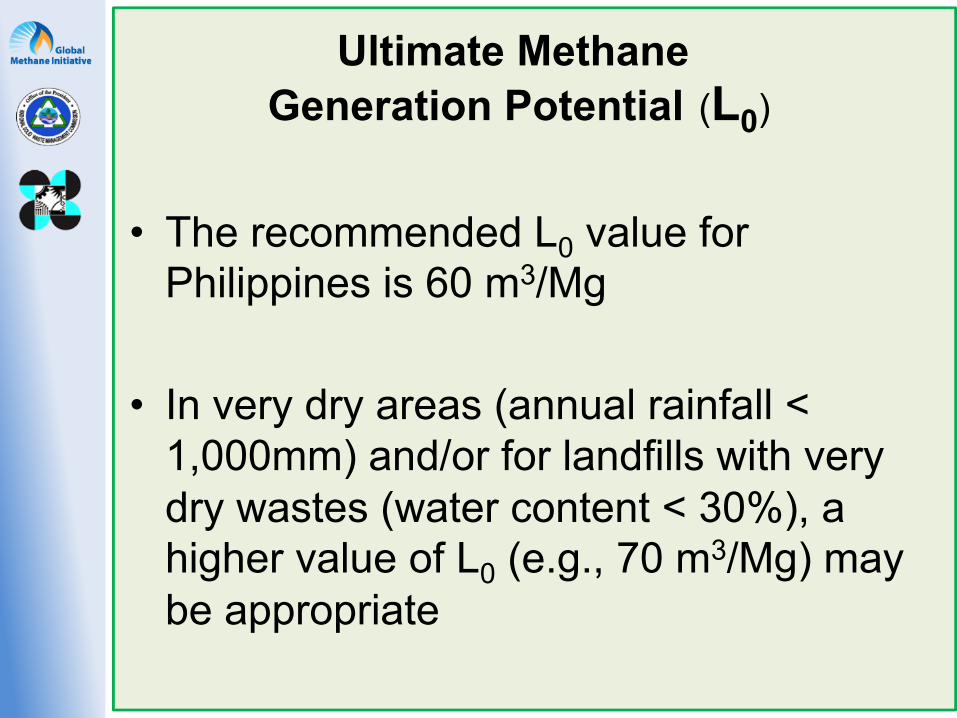
• The recommended L0 value for Philippines is 60 m3/Mg
• In very dry areas (annual rainfall <
1,000mm) and/or for landfills with very dry wastes (water content < 30%), a higher value of L0 (e.g., 70 m3/Mg) may be appropriate
Ultimate Methane Generation Potential (L0)
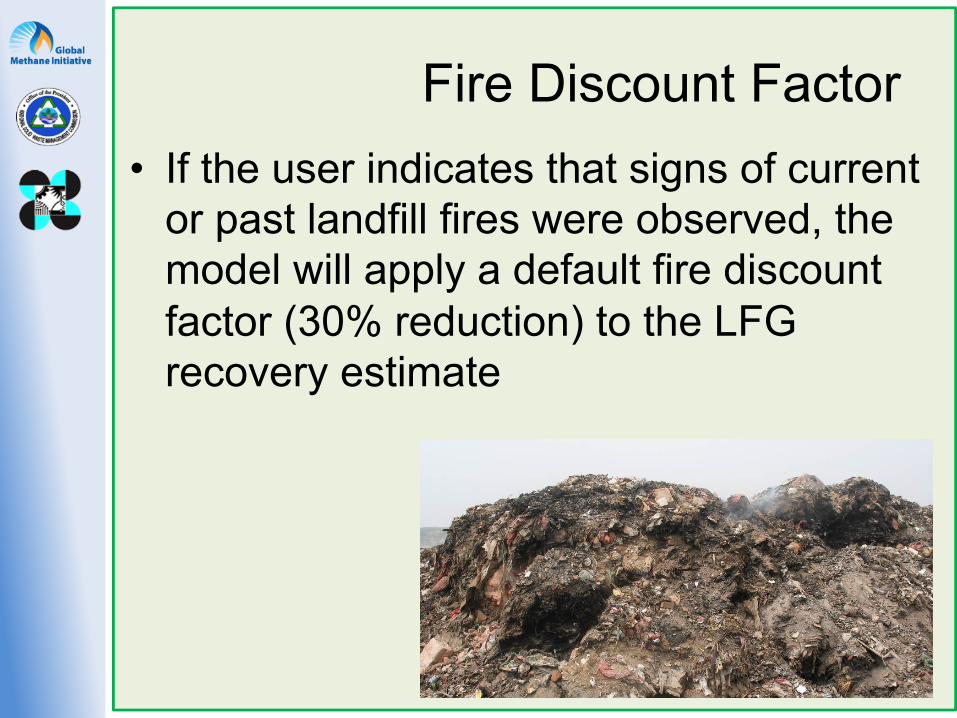
Fire Discount Factor • If the user indicates that signs of current
or past landfill fires were observed, the model will apply a default fire discount factor (30% reduction) to the LFG recovery estimate
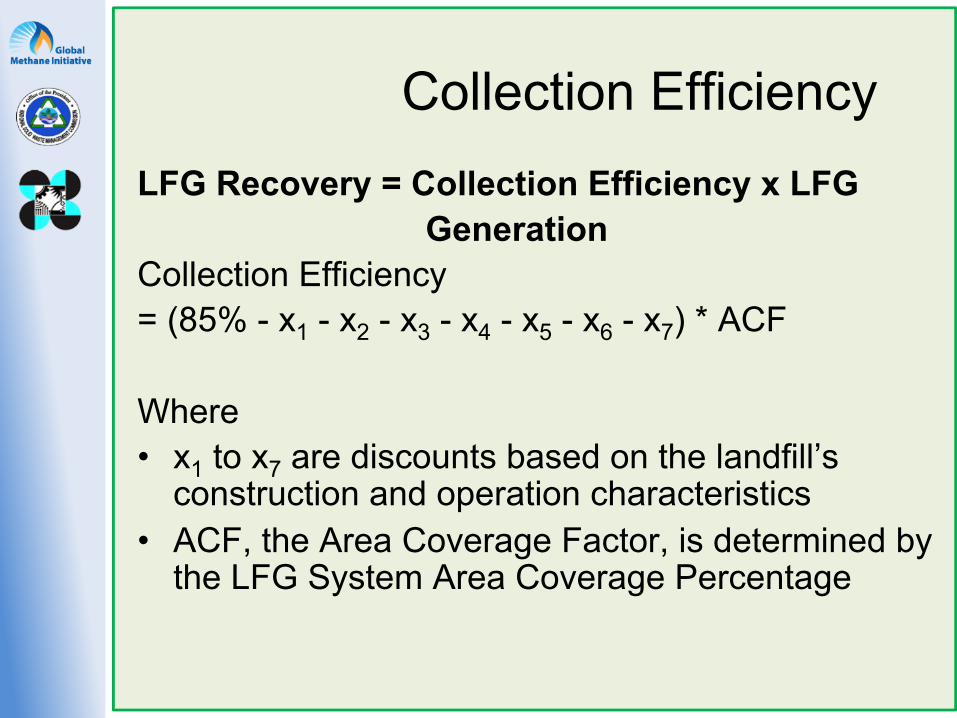
Collection Efficiency LFG Recovery = Collection Efficiency x LFG Generation Collection Efficiency = (85% - x1 - x2 - x3 - x4 - x5 - x6 - x7) * ACF Where • x1 to x7 are discounts based on the landfill’s
construction and operation characteristics • ACF, the Area Coverage Factor, is determined by
the LFG System Area Coverage Percentage
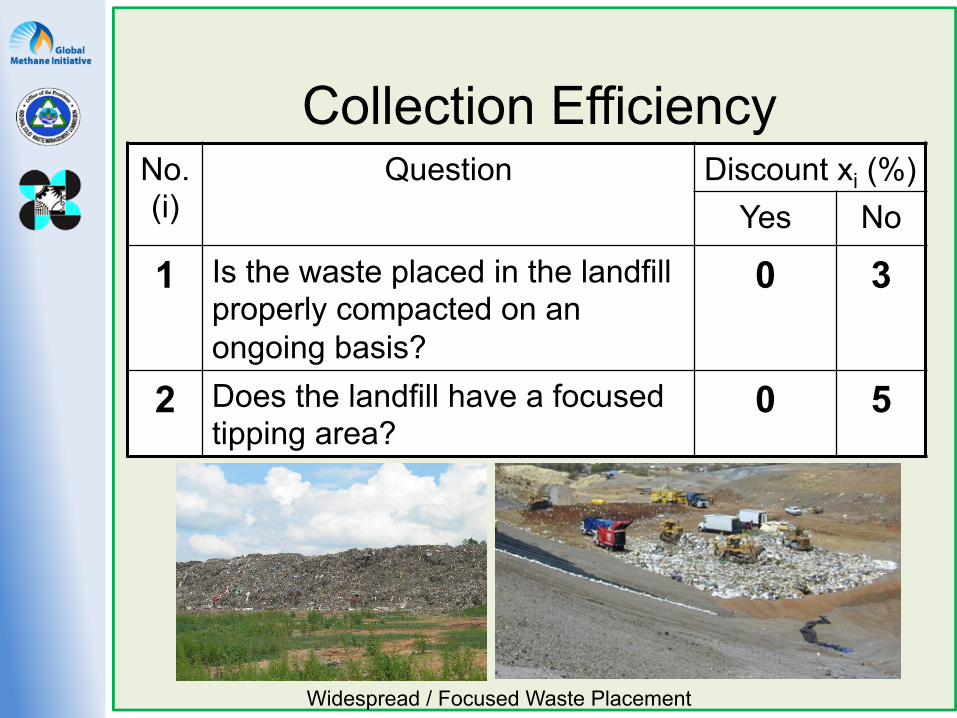
No. (i)
Question Discount xi (%) Yes No
1 Is the waste placed in the landfill properly compacted on an ongoing basis?
0 3
2 Does the landfill have a focused tipping area?
0 5
Widespread / Focused Waste Placement
Collection Efficiency

No. (i)
Question Discount xi (%)
Yes No 3 Are there leachate seeps
appearing along the landfill sideslopes? Or is there ponding of water/leachate on the landfill surface?
10 0
Collection Efficiency
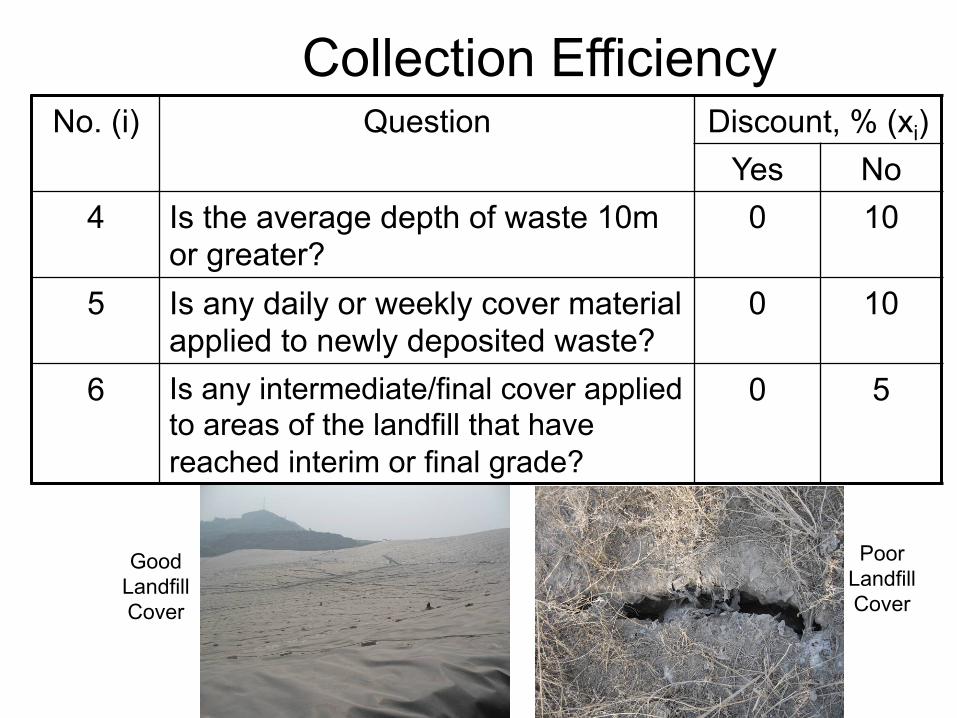
No. (i) Question Discount, % (xi) Yes No
4 Is the average depth of waste 10m or greater?
0 10
5 Is any daily or weekly cover material applied to newly deposited waste?
0 10
6 Is any intermediate/final cover applied to areas of the landfill that have reached interim or final grade?
0 5
Poor Landfill Cover
Good Landfill Cover
Collection Efficiency
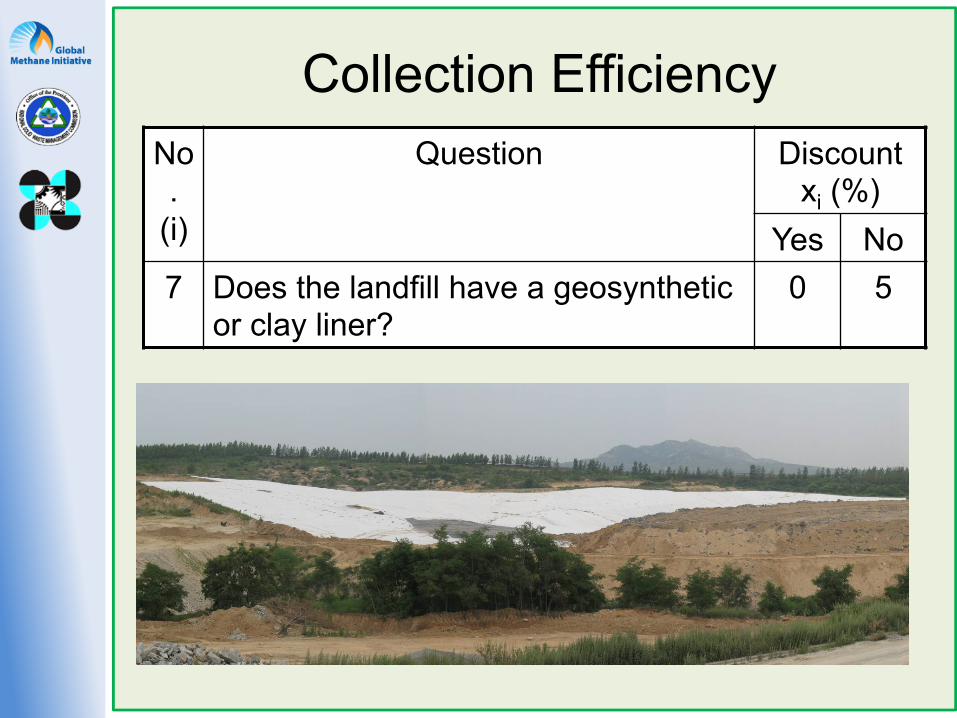
No.
(i)
Question Discount xi (%)
Yes No 7 Does the landfill have a geosynthetic
or clay liner? 0 5
Collection Efficiency
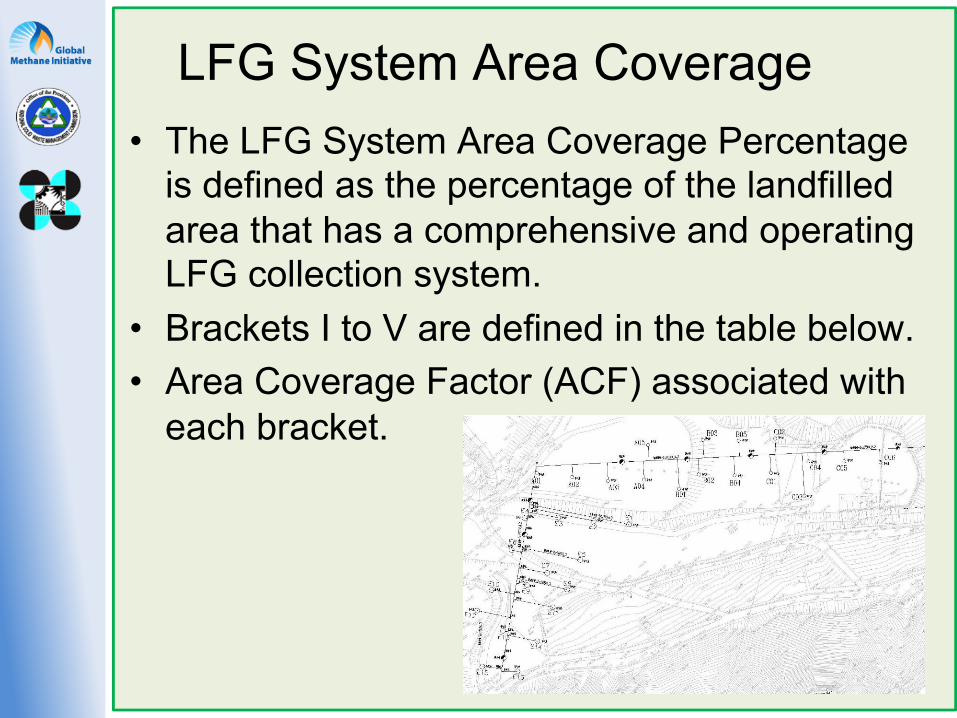
LFG System Area Coverage • The LFG System Area Coverage Percentage
is defined as the percentage of the landfilled area that has a comprehensive and operating LFG collection system.
• Brackets I to V are defined in the table below. • Area Coverage Factor (ACF) associated with
each bracket.
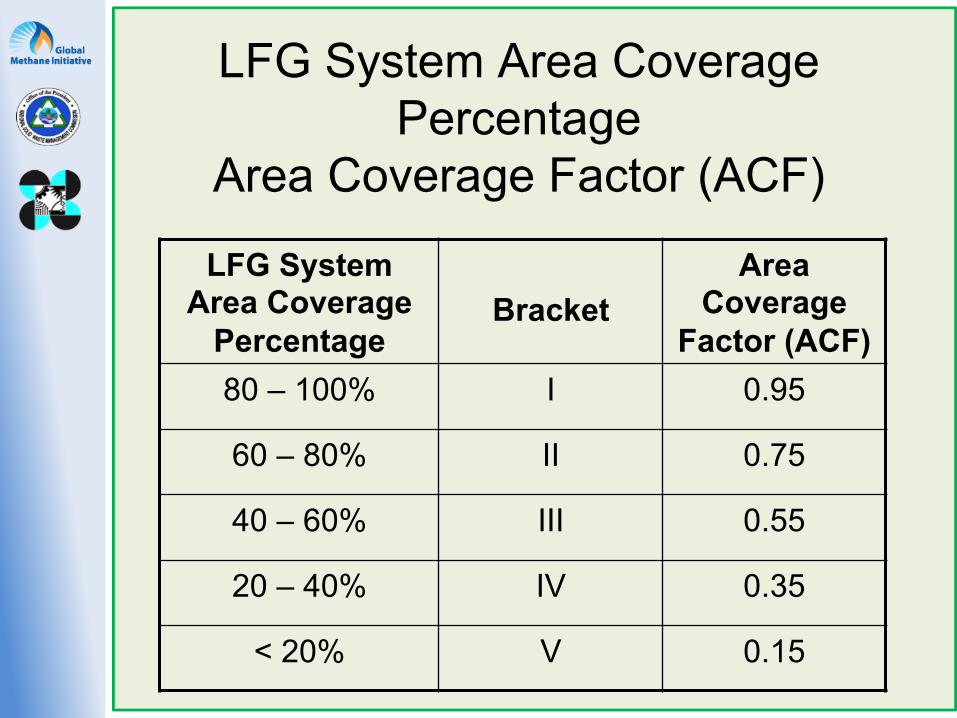
LFG System Area Coverage Percentage
Area Coverage Factor (ACF)
LFG System Area Coverage
Percentage
Bracket Area
Coverage Factor (ACF)
80 – 100% I 0.95
60 – 80% II 0.75
40 – 60% III 0.55
20 – 40% IV 0.35
< 20% V 0.15
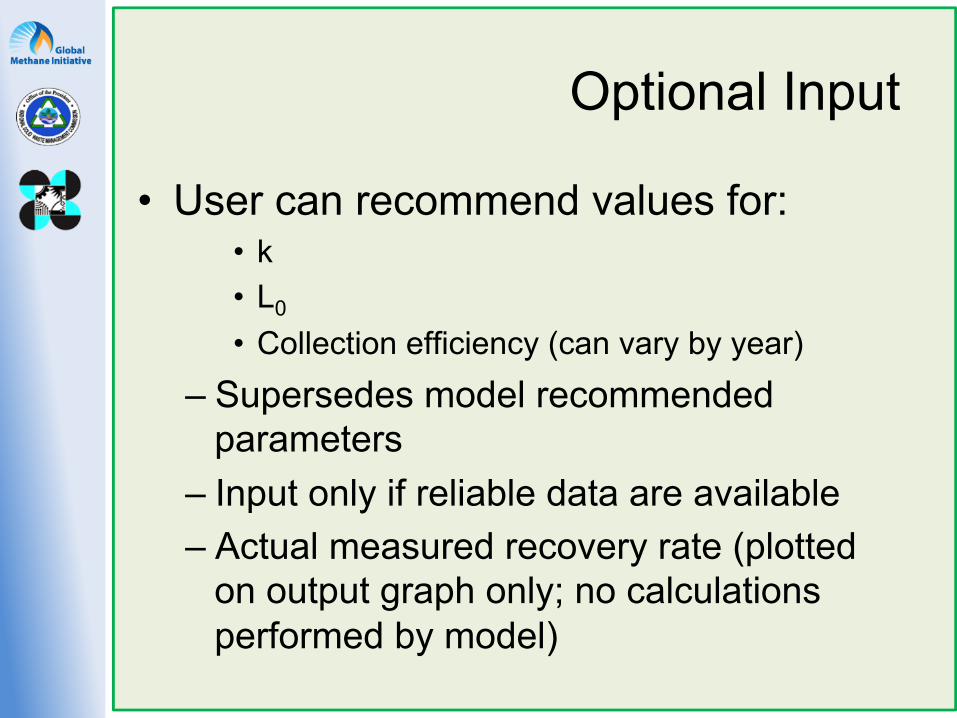
Optional Input
• User can recommend values for: • k • L0 • Collection efficiency (can vary by year)
– Supersedes model recommended parameters
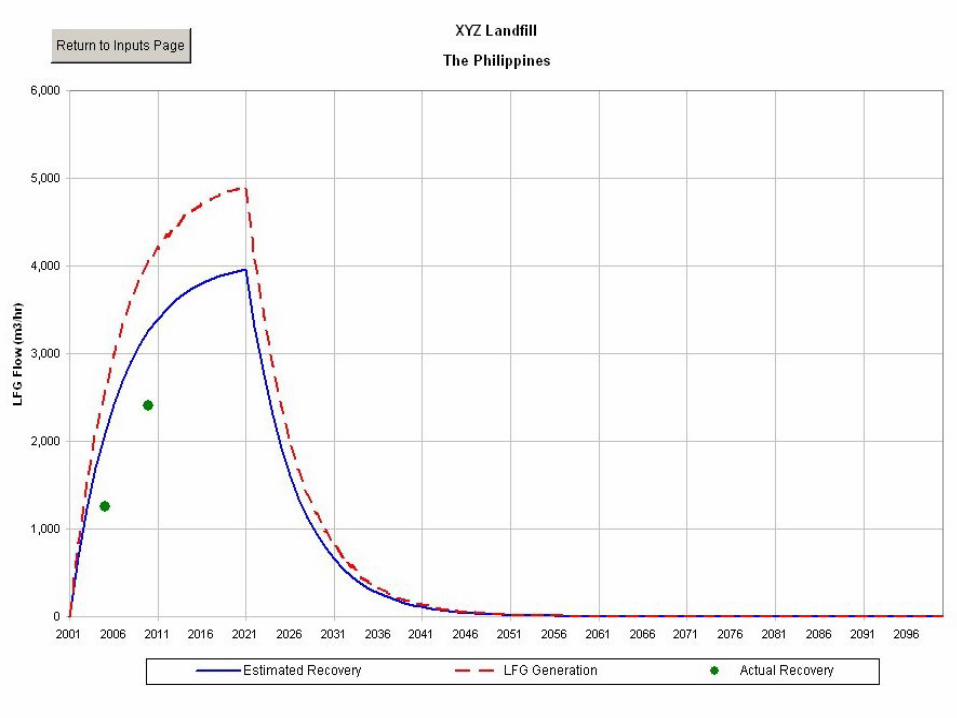
– Input only if reliable data are available – Actual measured recovery rate (plotted
on output graph only; no calculations performed by model)
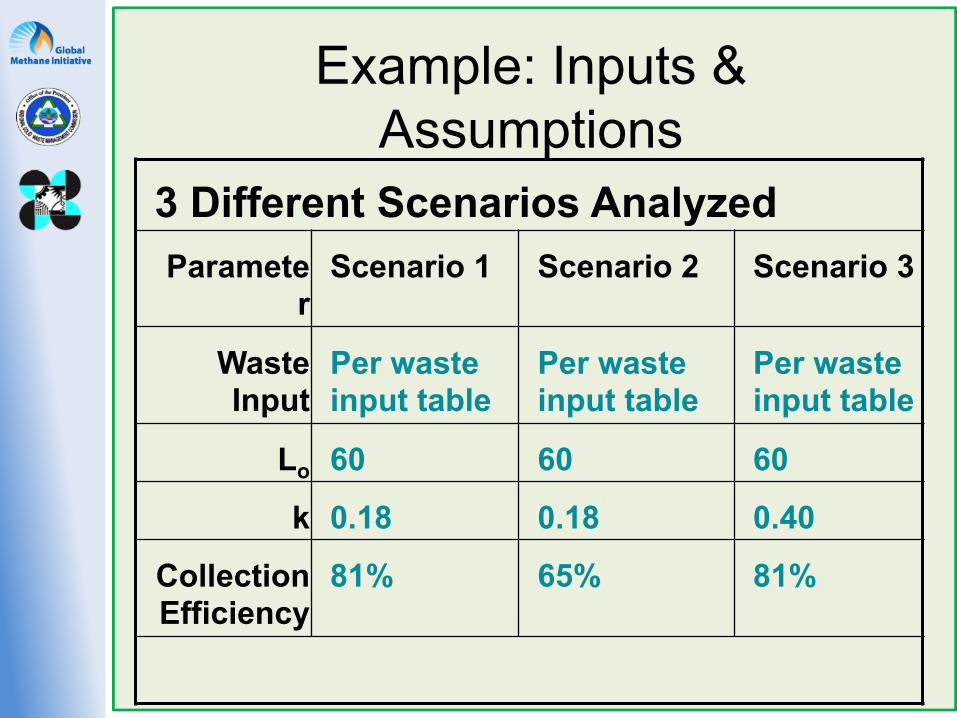
Example: Inputs & Assumptions
3 Different Scenarios Analyzed Paramete
r Scenario 1 Scenario 2 Scenario 3
Waste Input
Per waste input table
Per waste input table
Per waste input table
Lo 60 60 60
k 0.18 0.18 0.40
Collection Efficiency
81% 65% 81%
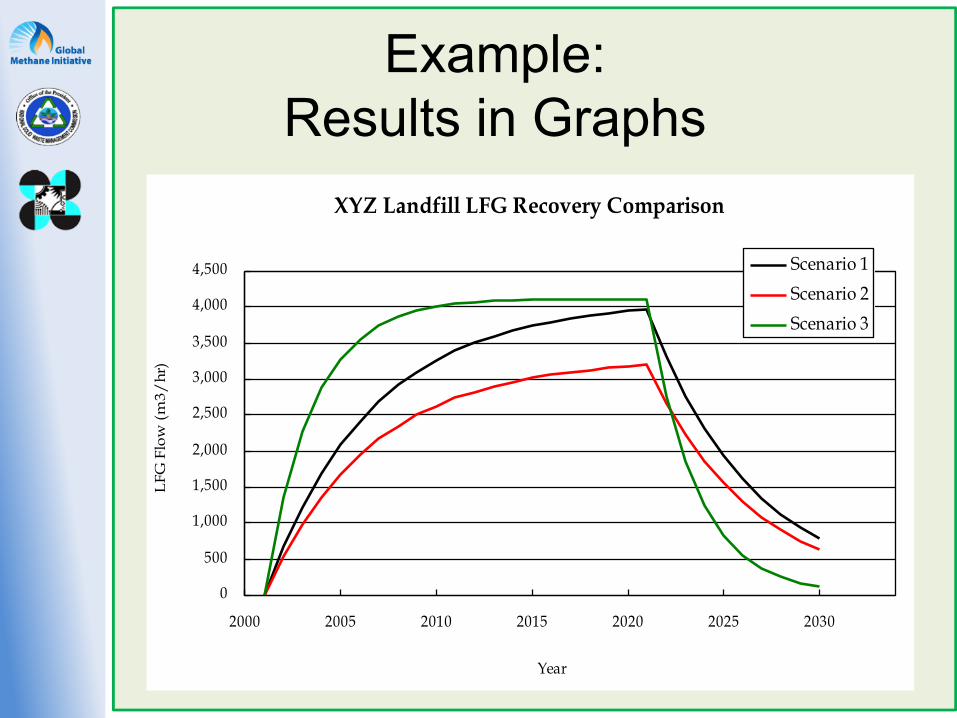
Example: Results in Graphs
XYZ Landfill LFG Recovery Comparison
0
500
1,000
1,500
2,000
2,500
3,000
3,500
4,000
4,500
2000 2005 2010 2015 2020 2025 2030
Year
LFG
Flo
w (
m3/
hr)
Scenario 1
Scenario 2
Scenario 3
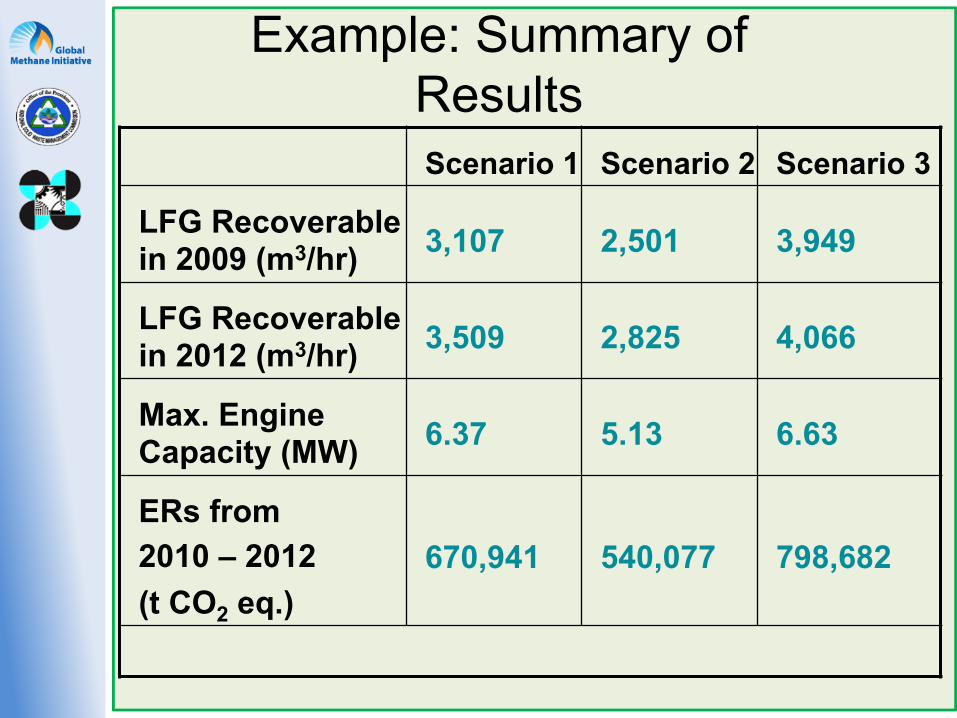
Example: Summary of Results Scenario 1 Scenario 2 Scenario 3
LFG Recoverable in 2009 (m3/hr) 3,107 2,501 3,949
LFG Recoverable in 2012 (m3/hr) 3,509 2,825 4,066
Max. Engine Capacity (MW)
6.37 5.13 6.63
ERs from 2010 – 2012 (t CO2 eq.)
670,941 540,077 798,682
Comparison to IPCC model • CDM Executive Board (EB) released a
“Tool to determine methane emissions from avoided from dumping waste at a solid waste disposal site” EB26 Meeting Report Annex 14 for CDM project methane calculations
• Parameters chosen according to the IPCC 2006 Guidelines for National Greenhouse Gas Inventories followed Ø Oxidation Factor Ø Fraction of Methane in landfill gas Ø Fraction of degradable organic carbon Ø Methane Correction Factor Ø Fraction of Degradable Organic Carbon by waste Ø Decay rate of each type of waste
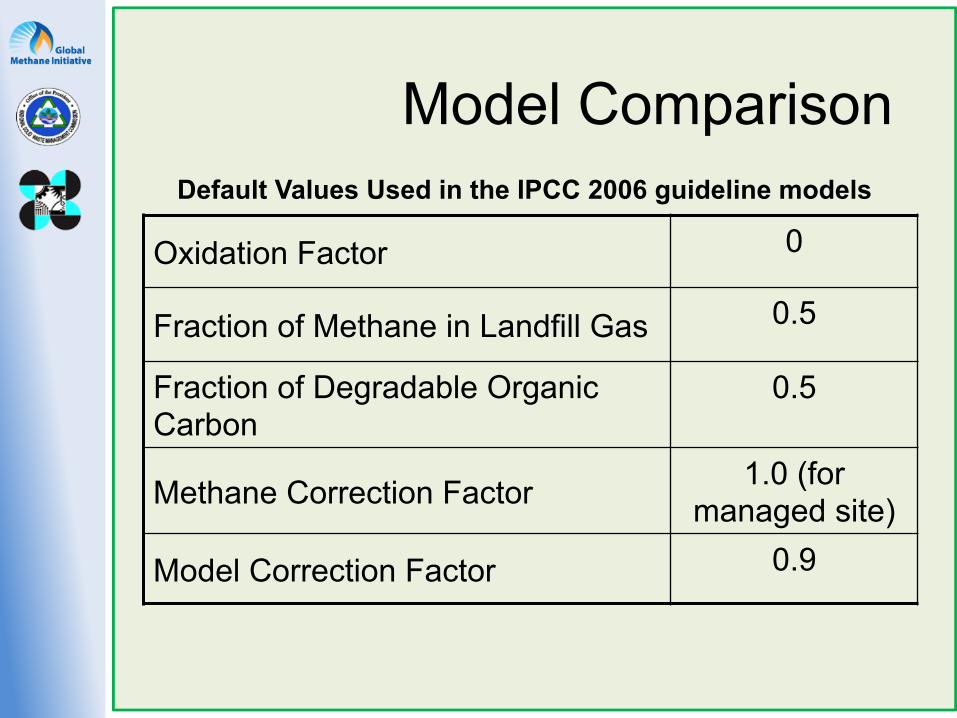
Model Comparison Default Values Used in the IPCC 2006 guideline models
Oxidation Factor 0
Fraction of Methane in Landfill Gas 0.5
Fraction of Degradable Organic Carbon
0.5
Methane Correction Factor 1.0 (for managed site)
Model Correction Factor 0.9
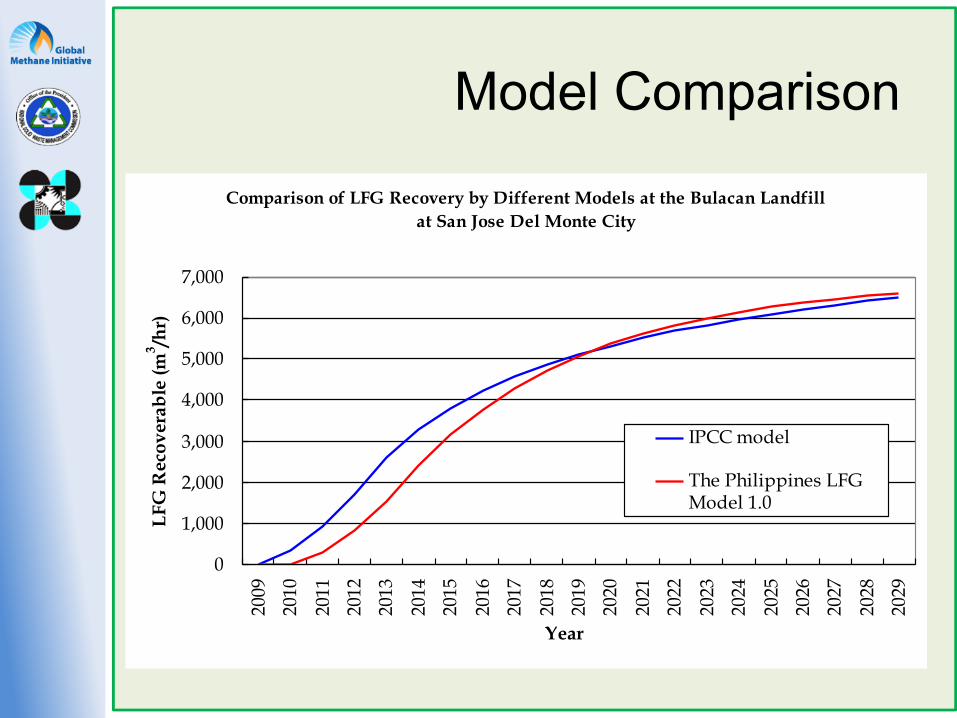
Model Comparison
Comparison of LFG Recovery by Different Models at the Bulacan Landfillat San Jose Del Monte City
0
1,000
2,000
3,000
4,000
5,000
6,000
7,00020
09
2010
2011
2012
2013
2014
2015
2016
2017
2018
2019
2020
2021
2022
2023
2024
2025
2026
2027
2028
2029
Year
LFG
Rec
over
able
(m3 /h
r)
IPCC model
The Philippines LFGModel 1.0
LFG Assessment and Evaluation
• How do you decide if a landfill site is a good candidate for an LFGE project?
• Experienced LFG professionals assess the landfill
using expertise gained at other sites and thought the employment of a variety of tools: - Computer modeling (i.e. LFG generation model) - Monitoring equipment (calibrated) - Site specific data collection - Precise observation of design and operating practices - In-depth technical analysis - Financial pro-forma
Assessments Tier
• Tier 1:Desktop Studies - Data collection via questionnaire - Perform LFG modelling from data collected
• Tier 2:Landfill Site Assessment – Data Verification – Interview with landfill personnel – Site Monitoring/Observation
• Tier 3:Landfill Pump Test – Pump test to verify Tier 2 outcome
Tier I - Required Information
• Necessary landfill details, including: – Waste Composition – Waste Inflow Profile – Date opened and closed (actual or projected) – Waste in place – Landfilling Practices – Landfill Gas Management – Landfill Cover System – Surface Water Management – Leachate Management
• The above information can be collected conveniently through a landfill questionnaire
32
Data Analysis • Collect Data and perform screening analysis to check:
– Annual waste intake matches with waste in place
– Both weight and volume of waste in place provided, so to determine density and level of compaction
– Waste inflow data corresponds to regional development data
– Waste composition data is in line with expectations (national studies)
33
Pros and Cons • Pros
– Short turnaround, only simple analysis required
• Cons – Have not understood landfill conditions thoroughly – Data solely provided by landfill and may not fit the
assessment requirements – Assumptions required when data is incomplete or
missing
A Tier II assessment is required to more accurately project LFG generation and recovery.
34
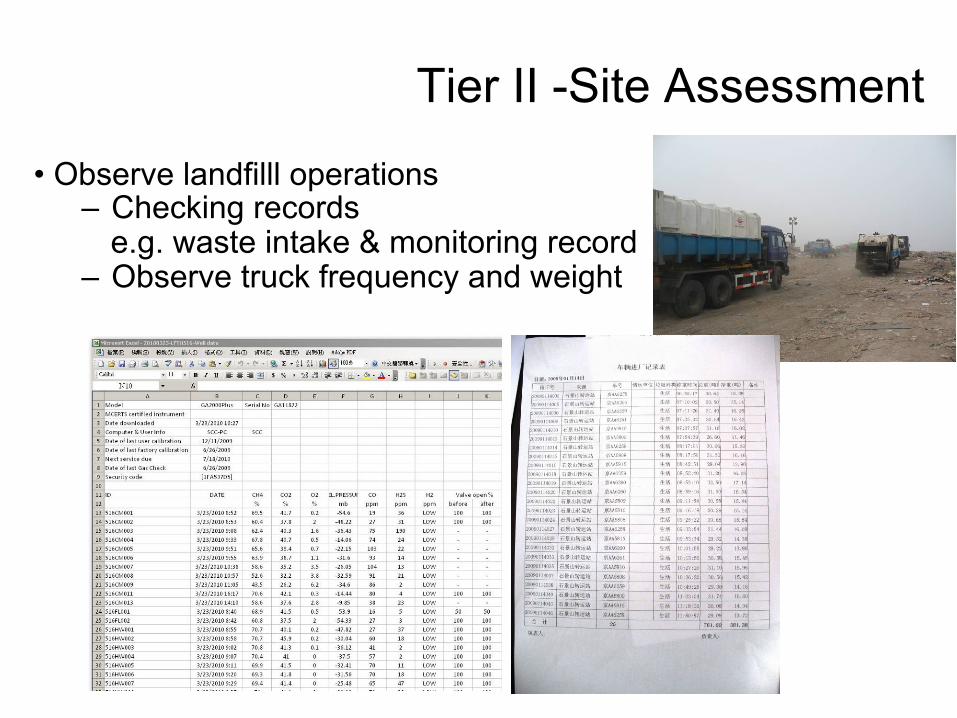
Tier II -Site Assessment
• Observe landfilll operations – Checking records
e.g. waste intake & monitoring record – Observe truck frequency and weight
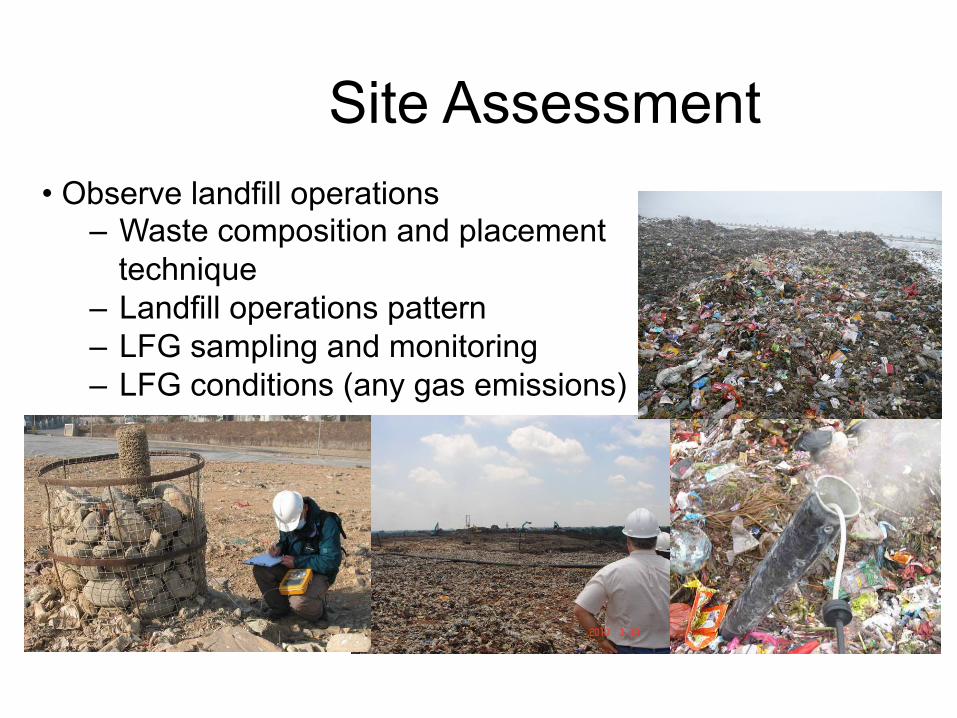
Site Assessment • Observe landfill operations
– Waste composition and placement technique
– Landfill operations pattern – LFG sampling and monitoring – LFG conditions (any gas emissions)
36
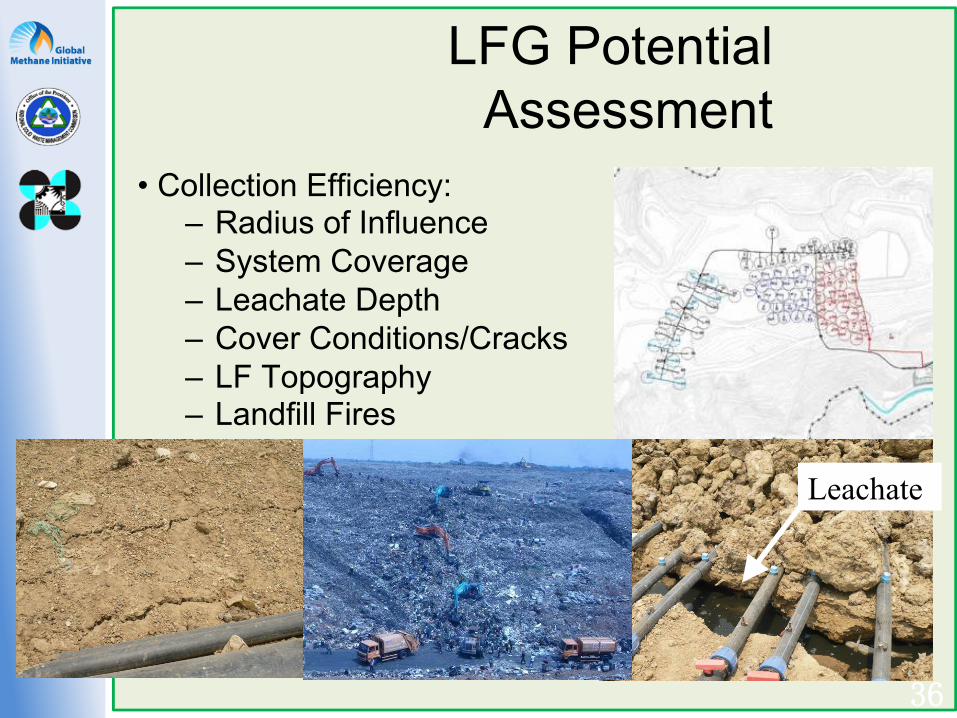
LFG Potential Assessment
• Collection Efficiency: – Radius of Influence – System Coverage – Leachate Depth – Cover Conditions/Cracks – LF Topography – Landfill Fires
Leachate
Pros and Cons • Pros
– More complete understanding of actual landfill conditions and operating practices;
– Use data collection to assess factors affecting gas generation and recovery
– Adjust screening level model • Cons
– Time consuming – Non-invasive analysis of the landfill conditions
Tier III assessment (landfill pump test) is required to further estimate landfill gas potential
37
38
§ Assess gas reservoir within the test area § Adjust gas estimation using test data and
observed Radius of Influence § Extrapolate gas extraction data to the
entire landfill site § Adjust gas modeling results § Also referred to as a “bankable” feasibility
study
Tier III- Pump Test
39
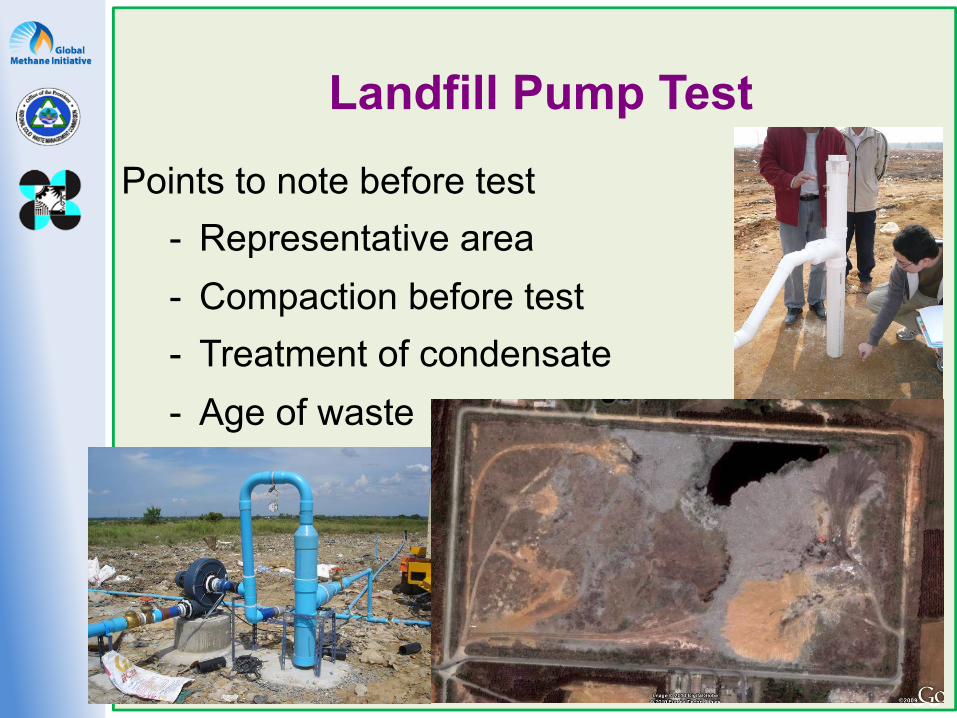
Points to note before test - Representative area - Compaction before test - Treatment of condensate - Age of waste
Landfill Pump Test
40
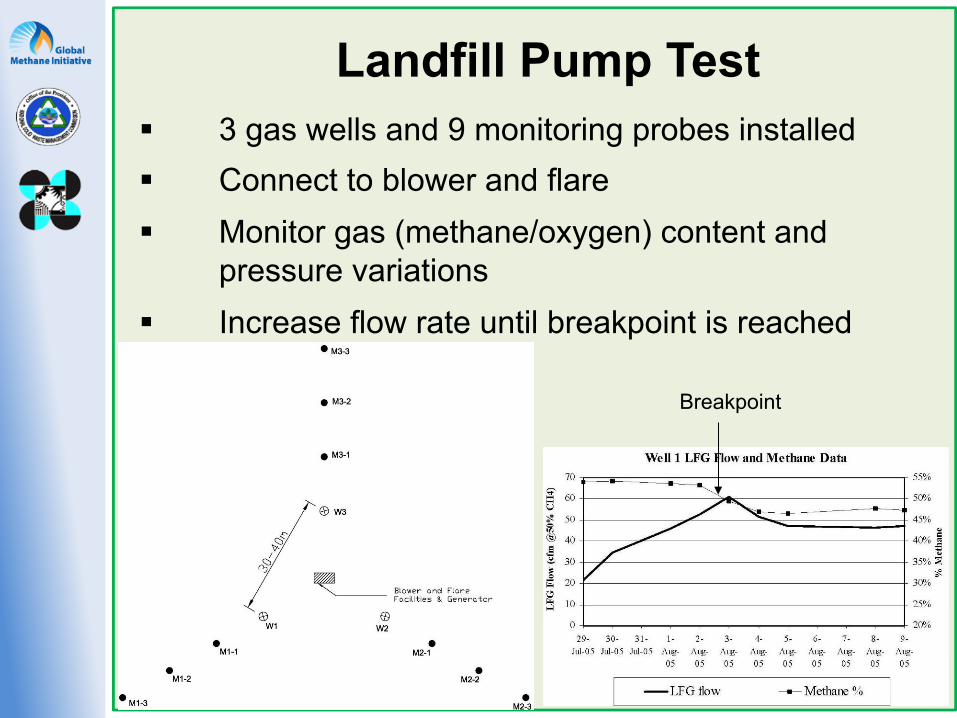
§ 3 gas wells and 9 monitoring probes installed § Connect to blower and flare § Monitor gas (methane/oxygen) content and
pressure variations § Increase flow rate until breakpoint is reached
Landfill Pump Test
Breakpoint
Assessment and Evaluation of LFGE Projects
3 stages to determine landfill gas potential, each with pros and cons
The level of assessment performed on a landfill depends on not only the gas generation and recovery potential, but also other critical factors, such as: – Cooperation of owner / operator – Landfill design and operating practices; – Energy markets; and – Carbon finance and renewable incentives
Financial Evaluation of LFGE projects
Economic analyses performed to evaluate project financial performance.
Typical considerations include, but are not limited to:
• NPV • IRR • Payback period • Cash flow • Sensitivity analyses
Evaluation of risk profile • Currency risk • Political risk • Technology risk • Payment risk (buyer insolvency) • Risk of changes to KP (post 2012) • Other Cap and Trade schemes
All project costs must be considered
Be sure to consider all revenue streams – CER / ERU / VER – Power / Gas / Energy sales – Fossil fuel emission offsets – Renewable energy credits
Intangibles – social & environmental benefits
Evaluation of LFGE project Cost and Revenue Streams
CAPEX • PDD Documentation • Design • Permitting • Construction • Validation
OPEX • Operation • Verification • Monitoring • Periodic Maintenance