2014 Wheat Research Review
140
On-Farm Cropping Trials Northwest & West Central Minnesota and 2014 Minnesota Wheat Research Review
Transcript of 2014 Wheat Research Review

Page 1
On-Farm Cropping Trials Northwest & West Central
Minnesota and 2014 Minnesota Wheat Research Review

Page 2
On-Farm Cropping TrialsThe mission of the NWROC is to contribute, within the framework of the Minnesota Agricultural Experiment Station (MAES) and the College of Food, Agricultural, and Natural Resource Sciences to the acquisition, interpretation and dissemination of research results to the people of Minnesota, with application to the knowledge base of the United States and World. Within this framework, major emphasis is placed on research and education that is relevant to the needs of northwest Minnesota, and which includes projects initiated by Center scientists, other MAES scientists and state or federal agencies.
Contributors to the On-Farm Trials include: Russ Severson, Extension Educator, Extension Regional Office, U of M Crookston, [email protected]; Doug Holen, Extension Educator, Extension Regional Office, Fergus Falls, [email protected]; Phillip Glogoza, Extension Educator, Extension Regional Office, Moorhead, [email protected]; Jochum Wiersma, Small Grain Specialist, Crookston, [email protected]; Howard Person, Extension Educa-tor, Pennington and Marshall Counties, Thief River Falls, [email protected]; Jim Orf, Dept Agronomy & Plant Genet-ics, St. Paul, [email protected]; Jeff Coulter, Extension Agronomist, Dept of Agronomy, St. Paul, [email protected]; Albert Sims, Soil Scientist, Crookston, [email protected]; J Dan Kaiser, Extension Soil Scientist, St. Paul, [email protected]; Randy Nelson, Extension Educator, Clay County, MN, [email protected]; This project was made possible thanks to the hard work of many people. This includes farmers, County and Regional Extension Educators, and specialists who conducted these trials, and their names are listed. Previous On-Farm Cropping Trials booklets can be found at http://smallgrains.org/wheat-research-reports/
2014 Wheat Research ReviewResearchers submit progress reports on projects funded partially or in full by the committee’s recommendation. Re-search progress is communicated to the public. Crop scientists participate in a research reporting session held each year that is open to the public. The Council feels this committee has been an efficient vehicle for not only prioritizing wheat checkoff funds, but also in improving the dissemination of results.Better practices to plant better wheat is our goal. To that end, we encourage your input on this committee, and your feedback on the wheat research projects that are funded by the Minnesota Wheat Checkoff.
Members of the 2014 - 2015 Small Grains Research & Communications Committee include Brian Borge; Tony Brateng, Ryan Casavan, Wensman Seed; Mark Fillbrandt, Bigg Dogg Agg; David Garrett; Doug Holen, U of M Extension Service; Carter Hontvet; Peter Hvidsten; Scott Lee; Kevin Leiser; Richard Magnusson; Dave Willis, Agaassiz Crop Management; Greg LeBlanc, MN Wheat Council, David Torgerson, MN Wheat; Jochum Wiersma, U of M Small Grains Specialist; Marv Zutz, MN Barley.
Information about the committee and previously funded research can be found online at www.smallgrains.org. Click on the Research Committee tab.
This is the seventh year the Research Review and On-Farm Cropping Trials have been combined into one booklet. Up until then, these reports have been published separately.

Page 3
Table of Contents:
Wheat Yield and Protein as Influenced by In-Furrow (down the tube) Phosphorus, Potassium and Coated Urea [ESN] ~ Nancy Jo Ehlke, Dept. of Agronomy and Plant Genetics, U of M, St. Paul
Use of Recurrent Mass Selection to Pre-Breed Hard Red Winter Wheat for Resistance to Major Biotrophic and Nectrotrophic Diseases ~ Francois Marais, Dept. of Plant Sciences, NDSU, Fargo
Exploiting Genetic Variation for Wheat Improvement in the Northern Great Plains ~ Brian J. Steffenson, Dept. of Plant Pathology, U of M, St. Paul
Spring Wheat Responses to Starter Fertilizer Micronutrient and Root Inoculant ~ Amitava Chatterjee, Dept. of Soil Science, NDSU, Fargo
Accelerated Breeding for Resistance to Fusarium Head Blight~ Karl Glover, Plant Science Dept., SDSU, Brookings
Strategies for Meeting N Requirements of Wheat with New Fertilizer and Fertilizer Additives ~ Joel Ransom, Dept. of Plant Sciences, NDSU, Fargo
Optimum Use of Nitrogen Fertilizers to Maximize Spring Wheat Grain Yield and Protein Concentration ~ Albert Sims, NWROC, Crookston
Reduction in Colon Cancer Risk by Red Wheat Consumption ~ Daniel Gallaher, Dept. of Food Science and Nutrition, U of M, St. Paul
Variation in Response to Sulfur Among Spring Wheat Genotypes ~ Daniel Kaiser, Dept. of Soil, Water and Climate, U of M, St. Paul
University of Minnesota Wheat Breeding Program ~ James Anderson, Dept. of Agronomy and Plant Genetics, U of M, St. Paul
Evaluating a New Rapid Technique to Assess Spring Wheat Flour Performance ~ Franciso Diez-Gonzalez, Dept. of Food and Nutrition, U of M, St. Paul
Evaluating Wheat Germplasm and Wheat Varieties for Waterlogging Tolerance ~ Xinhua Jin, Dept. of Agricultural and Biosystems Engineering, NDSU, Fargo
Minnesota Small Grain Pest Survey Scouting ~ Doug Holen, U of M Extension Regional Office, Morris
Assessing Gluten Quality - Acquisition of Front Face Fluorescence Spectrophotometer to Study Gluten Quality ~ Franciso Diez-Gonzalez, Dept. of Food and Nutrition, U of M, St. Paul
Seed Treatment Trial Evaluating the Effectiveness of Different Active Ingredients Against Latent Root Rot and Crown Rots of Wheat ~ Madeleine Smith, Dept. of Plant Pathology, NWROC, Crookston
Continuing Breeding Adapted Spring Wheat Cultivars to Better Serve Minnesota Wheat Growers ~ Mohamed Mergoum, Dept. of Plant Sciences, NDSU, Fargo
Optimum Seeding Rates for Diverse HRSW Varieties ~ Jochum Wiersma, Dept. of Agronomy & Plant Genetics, NWROC, Crookston
Progress Report to Minnesota Wheat Research and Promotion Council on the Spring Wheat Protein Spread Project ~ Frayne Olson, Dept. of Agribusiness and Applied Economics, NDSU
2014 Minnesota Wheat, Barley and Oat Variety Performance – Preliminary Report
2014 North Dakota Hard Red Spring Wheat Variety Trial Results and Selection Guide - Preliminary Report
Wheat Research Reports - Funded in part by the Minnesota Wheat check-off
15
14
On-Farm Cropping Trials For NW & WC MN 2014 Statewide Small Grains Pest Survey
Foliar Fertilizer Application for Hard Red Spring Wheat
Nitrogen Rate on Irrigated Hard Red Spring Wheat
Corn Hybrid Response to Seedling Rate in NW MN
Pre-Plant Versus Side Dress Nitrogen for Corn in Northwest Minnesota
Corn Response to Sulfur Fertilizer - Mahnomen/Marshall Counties
On-Farm Evaluation of Cover Crops following Corn Silage - Stearns County
2014 Corn Hybrid Trials - Marshall/Polk/Mahnomen Counties Soybean Response to Micronutrients in NW MN
Yield and Quality of Organically Grown Soybean Treated with a Plant Stimulant - Clay County
Soybean Variety Evaluations by UMN Soybean Breeding Project - Northwest Minnesota
Soybean Seeding Rate x Planting Date x Seed Treat
2014 Northern Minnesota & Eastern North Dakota Coordinated RR Soybean Variety Trials
47
1112
13
27
29
30
36
37
58
62
83
65
69
70
72
73
77
78
85
91
94
99
103
105
110
116
131
9
117

Page 4
For Additional Information: Phil Glogoza, Doug Holen, Jochum Wiersma, and Madeleine Smith
Project Funding Provided by: Minnesota Association of Wheat Growers
2014 Statewide Small Grains Pest Survey
Cooperator: Minnesota Association of Wheat Growers, NDSU IPM Survey
Purpose of Study: The objective of this project was to allow for timely small grain crop staging and pest identification across the state of MN in order to inform producers of current crop conditions and potential threats. Information was released through media (e.g., radio, internet-based news releases, archived web pages, consultant conversations and e-mail. The survey was conducted in coordination with the established NDSU IPM Survey, providing extensive, continuous coverage of small grains across MN and ND.
Results: Field surveys were initiated the last week of May. Delayed planting conditions resulted in most of the crop being in the initial leaf to tillering stages, however there was earlier planting of a portion of the crop and reflected in some locations in the jointing stage (see map for Growth Stages - June 9 to 20).
The most important insect related production issues were the appearance of cereal aphids which reached threshold levels in some regions of both states.
Small grain diseases by prevalence were Tan Spot, occurring throughout the region; Bacterial Leaf Streak in SW and WC MN; Septoria occurring with high incidences in NW MN; Barley Yellow Dwarf incidence was found where aphids established in WC MN; and, Head blight (scab) in SW and WC MN where wet conditions during heading contributed to higher than forecasted infections.
When reviewing the maps. Incidence is defined as “the percent of sampled plants with the disease.” Severity is defined as “the percent of plant tissue that is diseased on affected plants.” Therefore, maps that report incidence are reporting percent plants affected. Severity tells us how bad infections were.
To receive notification of the survey, subscribe to the Northwest Cropping Issues Newsletter at:
http://nwroc.umn.edu/Cropping_Issues/index.htm
Archived maps are maintained by NDSU and can be found at:
http://nwroc.umn.edu/Cropping_Issues/index.htm
O n - F a r m C r o p p I n g T r I a l s
Small Grain Field Locations Visited for Survey
Surveyed Fields

Page 5
For Additional Information: Phillip Glogoza, Doug Holen, Jochum Wiersma and Madeleine Smith
Small Grains Crop Survey (continued) — Statewide
Page 6
For Additional Information: Phillip Glogoza, Doug Holen, Jochum Wiersma and Madeleine Smith
Small Grains Crop Survey (continued)— Statewide

Page 7
For Additional Information: Contact Daniel Kaiser ([email protected])
Project Funding Provided by: West-Central Inc.
Foliar Fertilizer Application for Hard Red Spring Wheat
Nearest Town: Fergus Falls—Otter Tail County Soil Type: Formdale - Buse Complex Experimental Design: Factorial design within a randomized complete block design with 4 replications Factor 1: Wheat Variety (Faller, Glenn, Mayville, RB07, Select, and Vantage) Factor 2: Foliar fertilizer source 1) No foliar fertilizer 2) 28% Urea ammonium nitrate solution (28-0-0) 3) Copper-field™ (21-0-0-0.3 Cu-0.15 Fe) Foliar rates applied a total of 15 lbs of N per acre 5 GPA 28%; 7.5 GPA Copper-field N-tense™ and Trophy Gold™ were added each at a rate of 0.25% v/v All treatments applied with water at a total spray volume of 12 GPA Soil Test Data: Bray P1-P: 16 ppm Ammonium acetate K: 204 ppm pH: 6.7 Soil organic matter: 5.0% DTPA: Cu 1.9 ppm Fe 38.8 ppm
Purpose of Study: To compare sources of nitrogen for post-anthesis application to wheat for increasing protein concentration among six hard red spring wheat varieties.
Results:
Treatments compared two sources of foliar nitrogen. The 28% UAN treatment contained roughly 1/2 of the total nitrogen in the urea for. The copper-field treatment contained a higher percentage, 3/4, of the total nitrogen in the urea form. The copper-field also contained iron and copper in the chelated for.
Treatment main effects are summarized in Table 1. Yield varied among varieties with Faller producing the greatest grain yield and Glenn the least. Grain protein concentration response was the inverse of grain yield as expected.
Foliar application of the two fertilizer sources affected grain yield and grain protein concentration. Grain yield did not differ between the 28% and the non-fertilizer control. The copper-field treatment generally reduced yield. Grain protein concentration was increased by 0.2-0.3% on average for both foliar treatments. Increased protein concentration for the copper-field treatment may have been due to decreased grain yield.
O n - F a r m C r o p p I n g T r I a l s
Table 1. Summary of main treatment effects for hard red spring wheat grain yield and protein concentration and protein yield.
Grain ProteinYield Main Effect Yield Protein
Variety -bu/acre- ---%--- --lb/acre-- Faller 89a 12.1f 638ab Glenn 59d 14.2c 506d Mayville 61d 14.9a 548c RB07 72b 14.0d 607b Select 65c 13.4e 524cd Vantage 75b 14.7b 664a
Foliar None 72a 13.7b 591a 28% 73a 14.0a 612a Copper-field 65b 13.9a 540b
Statistics (P>F)Variety <0.001 <0.001 <0.001 Foliar <0.001 <0.01 <0.001 Var. x Foliar 0.03 0.01 0.02
Page 8
For Additional Information: Contact Daniel Kaiser ([email protected])
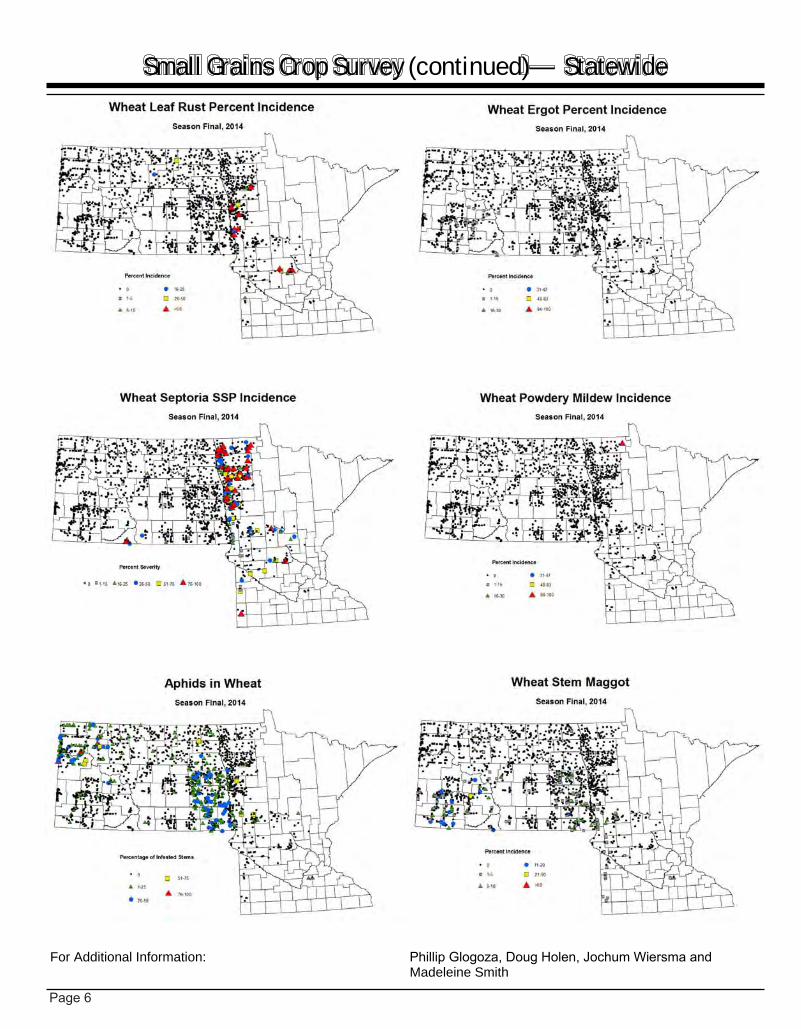
Foliar Fertilizer Application for Hard Red Spring Wheat (continued)
Foliar damage varied by foliar fertilizer source and by variety. Foliar damage was generally greater for plots treated with Copper-field. The only variety that did not exhibit greater damage with Copper-field was Faller while RB07 exhibited the greatest total damage. Increased damage was likely due to the higher percentage of total N as urea in Copper-field. Lower rates of this produce are typically suggested. In this study we wanted to compare equal amounts of total applied N. The amount of N applied post-anthesis, 15 lbs, it typically suggested for increasing protein concentration. Damage potential of the fertilizer source should be a major consideration when choosing a product to apply
Grain yield was not increased or decreased similarly across all varieties. Although a lowering trend in grain yield existed, statistically the yield of Faller, Glenn, and Select did not differ among treatment. No treatment differed relative the control for Mayville. Vantage and RB07 both had lower yield for the Copper-field treatment. The large yield reduction for RB07 was consistent with the greater leaf damage from the foliar application. A lower application rate may have resulted in less damage and a smaller or no reduction in grain yield.
Grain protein concentration was increased by foliar fertilizer but only for the varieties Faller and Glenn. Grain protein concentration was slightly decreased by foliar fertilizer use for the variety Vantage. There was no effect on grain protein concentration for the varieties Mayville, RB07, and Select. There was no indication why specific varieties responded for both grain yield and grain protein concentration.
Fergus Falls, 2014 HRSW Grain Protein Data
Gra
in P
rote
in C
once
ntra
tion
(%)
10
12
14
16
No Foliar28% UANCopperfieldTM
Faller Glenn Mayville RB07 Select Vantage
ns
ns
ns
a
b
a
a
b
aa ab
b
Fergus Falls, 2014 HRSW Grain Yield Data
Yie
ld @
13%
moi
stur
e (b
ushe
ls/a
cre)
40
50
60
70
80
90
100No Foliar28% UANCopperfieldTM
Faller Glenn Mayville RB07 Select Vantage
ns
ns
ns
a
abb
a
ab
b
a
ab
b
Fergus Falls, 2014 HRSW Foliar Damage
Uppe
r lea
f are
a da
mag
ed (%
)
0
10
20
30
40
50No Foliar28% UANCopperfieldTM
Faller Glenn Mayville RB07 Select Vantage
a
b
a
b
c
a
b
c
a
b
c
a
b
c
a
a
b
c

Page 9
For Additional Information: Contact Daniel Kaiser ([email protected])
Project Funding Provided by: Minnesota Wheat Research and Communication Council
Nitrogen Rate on Irrigated Hard Red Spring Wheat
Nearest Town: Staples, MN (Wadena Co.) Soil Type: Verndale loamy sand Previous Crop: Edible bean Experimental Design: Factorial within a randomized complete block design with 4 replications Factor 1: wheat variety (Faller, Mayville, and RB07) Factor 2: nitrogen rate (0, 60, 120, 180, 240, and 300 lbs N per acre) Nitrogen was split applied with 50% applied at emergence and 50% at the boot stage Preliminary Soil Test: 16 lb N per acre at 2’ depth Bray P1-P: 43 ppm Ammonium acetate K: 88 ppm 1.6% Soil organic matter pH: 7.3
Purpose of Study: The purpose of this study was to determine optimum nitrogen rates for hard red spring wheat grown on an irrigated sandy soil. We also wanted to determine if varieties varied in their potential response to S.
Results:
The varieties were selected based on tissue analysis for a survey of HRSW varieties utilizing the variety trials. Flag leaf nitrogen concentration was surveyed. The varieties selected exhibited differences in their response to nitrogen in environments that vary in nitrogen availability. One variety was selected that responded less in a high N environment (Faller), one was deemed as average (Mayville), and one as above average (RB07).
There was no difference in the response to nitrogen among the three varieties studied. Faller did result in a greater yield per acre than Mayville or RB07 but the amount of N required to maximize yield was similar. Total protein produced per acre (protein yield) also differed for variety and nitrogen rates. Since protein yield was highly dependent on yield there was a similar lack of interaction between variety and nitrogen rate on protein yield.
Grain protein concentration was the only measured variation that exhibited an interaction between variety and nitrogen rate.
O n - F a r m C r o p p I n g T r I a l s
HRSW Grain Yield Data: Staples 2014
Nitrogen Rate Applied (lb N per acre)0 60 120 180 240 300
HR
SW G
rain
Yie
ld (b
ushe
ls/a
cre)
20
30
40
50
60
70
80
90
FallerMayvilleRB07
Table 1. Summary of statistical significance for grain yield and protein concentration data and protein yield per acre.
Grain ProteinYield Yield Protein
-----------------P>F-----------------Variety <0.001 <0.001 <0.01 Nrate <0.001 <0.001 <0.001 Variety x N rate 0.99 0.04 0.95

Page 10
For Additional Information: Contact Daniel Kaiser ([email protected])
N Rate on Irrigated Hard Red Spring Wheat (continued)The interaction between variety and nitrogen rate
that occurred for grain protein concentration could not be easily explained and was likely due to differences in the effect of variety for various nitrogen rates.
Grain protein concentration was generally maximized by around 240 lbs of applied nitrogen for all varieties. Grain protein concentration did appear to plateau around the highest nitrogen rates applied.
Grain yield was maximized by 164 lbs of applied N. Grain protein yield per acre was maximized by an additional 20-30 lbs of N which was nearly half what is usually required for field in Northwest Minnesota. Residual N was low (near 15 lbs) and likely did not contribute to the yield response. The amount of N needed to maximize yield only is comparable to the amount required for non-irrigated soil in northwest Minnesota. The major difference in nitrogen management is that split application of N should be favored for coarse textured irrigated soils to ensure adequate N is available.
Maximum return to nitrogen rates are summarized in Table 2 for various price rations. Since grain protein concentration were relatively high in this study (greater than 14%) for all varieties discounts could not be incorporated into the economic analysis. The amount of N applied in irrigation water also should be considered. Water from the irrigation well at Staples was sampled but the data are not currently available. Nitrate applied towards the middle to end of he growing season could have resulted in the high grain protein concentration.
HRSW Grain Protein Data: Staples 2014
Nitrogen Rate Applied (lb N per acre)0 60 120 180 240 300
HR
SW G
rain
Pro
tein
(%)
15
16
17
18
19
FallerMayvilleRB07
HRSW Grain ProteinYield Data: Staples 2014
Nitrogen Rate Applied (lb N per acre)0 60 120 180 240 300
HR
SW G
rain
Pro
tein
Yie
ld (l
b/ac
re)
200
300
400
500
600
700
800
900
FallerMayvilleRB07
Table 2. Maximum return to nitrogen data for irrigated wheat summarized for various price ratios (price of N: value per bushel HRSW) based on data collected in 2014 at Staples, MN.
Price Ratio -$1 MRTN +$1 -------------------------------------------lb N/ac-----------------------------------------
0.00 153 164 na 0.05 136 148 160 0.10 118 130 142 0.15 101 113 125 0.20 83 95 107

Page 11
For Additional Information: Jeff Coulter, Jerry Buckley, Howard Person, and Nathan Jonhnson, Univ. of MN Extension
Funding provided by the MN Corn Growers Association and DuPont Pioneer. Thanks to NDSU for planting the East Grand Forks, Hendrum, Mahnomen, and Newfolden locations. Thanks to the Northwest Research and Outreach Center for help with the research at Crookston.
Corn Hybrid Response to Seeding Rate in Northwestern MN
Locations: Crookston, MN (Polk Co.), East Grand Forks, MN (Polk Co.), Hendrum, MN (Norman Co.), Mahnomen, MN (Mahnomen Co.), and Newfolden, MN (Marshall Co.) Plot Layout: Hybrid and seeding rate combinations replicated 4 times at each location
Objectives: Evaluate corn response to seeding rate for three hybrids of differing comparative relative maturity (CRM).
Results: Average corn grain yield ranged from 134 to 181 bu/acre among locations. Corn grain yield was affected by seeding rate at all locations. Seeding rates of 34,700 or higher produced the greatest yield at all locations.
Yield differed among hybrids at Crookston, East Grand Forks, and Mahnomen, MN. At each of these three locations, yield was greatest with the 86 CRM hybrid, intermediate with the 80 CRM hybrid, and least with the 74 CRM hybrid. Yield did not differ among hybrids at the two lowest yielding locations (Hendrum and Newfolden, MN).
As expected, grain moisture at harvest was greatest with the 86 CRM hybrid and least with the 74 CRM hybrid at each location. Grain moisture did not differ between the 74 and 80 CRM hybrids at Hendrum, MN.
O n - F a r m C r o p p I n g T r I a l s
Hybrid Compara�ve
rela�ve maturity
Crookston East Grand Forks Hendrum Mahnomen Newfolden
‐‐‐‐‐‐‐‐‐‐‐‐ Yield (bu/A)† ‐‐‐‐‐‐‐‐‐‐‐‐ P7443R 74 159 c‡ 167 c 155 a 138 c 134 a 39V07 80 174 b 180 b 145 a 150 b 136 a
P8640AM 86 191 a 196 a 152 a 174 a 131 a ‐‐ Grain moisture at harvest (%)† ‐‐
P7443R 74 20.8 c‡ 14.0 c 18.4 b 16.3 c 21.9 c 39V07 80 24.9 b 16.8 b 19.3 b 17.3 b 25.0 b
P8640AM 86 31.1 a 19.6 a 24.7 a 22.4 a 32.3 a † Data averaged across ve seeding rates. At Crookston, data also are averaged across three plan�ng dates.
‡ Within a given loca�on, yield or grain moisture values followed by the same le�er do not differ at the 10% probability level.
Seeding rate Crookston East Grand
Forks Hendrum Mahnomen Newfolden
seeds/A ‐‐‐‐‐‐‐‐‐‐‐‐ Yield (bu/A)† ‐‐‐‐‐‐‐‐‐‐‐‐ 23,100 163 c‡ 173 b 142 b 143 b 124 c 28,900 174 b 176 b 140 b 158 a 130 bc 34,700 178 ab 185 a 163 a 158 a 135 ab 40,500 182 a 185 a 157 a 161 a 143 a 46,300 175 ab 185 a 151 ab 151 a 136 ab
† Data averaged across three hybrids. At Crookston, data also are averaged across three plan�ng dates.
‡ Within a given loca�on, yield values followed by the same le�er do not differ at the 10% probability level.

Page 12
For Additional Information: Contact Daniel Kaiser ([email protected])
Project Funding Provided by: Minnesota Corn Research and Promotion Council
Pre-plant versus side-dress Nitrogen for corn in NW Minnesota
Nearest Town: Waubun (Mahnomen Co.) & Hendrum (Norman Co.) Soil Type: Mahnomen County: Sverdrup sandy loam Norman County: Fargo silty clay Row Width: 30” Experimental Design: Split plot within a randomized complete block design Main plot pre-plant nitrogen rates: 0, 40, 80, 120, 160, and 200 lbs N per acre Split plot side-dress N (pre-plant N + side-dress N): 0 + 120, 40 + 80, 80 + 40, 120 + 40, 160 + 40, and 200 + 40 lbs N/acre Nitrogen source: urea (46-0-0) Side-dress urea treated with Agrotain and applied between V4-V6 4 replications Previous Crop: Mahnomen County: previous crop soybean Norman County: previous crop spring wheat
Purpose of Study: To determine if split application of nitrogen would result in greater corn yield in Northwest Minnesota
Results: Corn grain yield was increased by pre-plant nitrogen at both
locations. Economic optimum nitrogen rates (EONR) for both locations were near 100 lbs of N per acre.
Side-dress application of nitrogen increased corn grain yield for the lowest two pre-plant application rates, 0 and 40 lbs of N per acre. There was no yield advantage of split application of nitrogen for pre-plant nitrogen rates 80 lbs of N or greater.
Side-dress application of nitrogen did not increase yield for applied N rates higher than the EONR. Application of 120 lbs of N resulted in similar yield when applied all as a pre-plant or a side-dress application.
The data provides evidence that a single pre-plant application of nitrogen alone may be enough to result in maximum corn grain yield even if early season rainfall may favor leaching losses
O n - F a r m C r o p p I n g T r I a l s
Table 1. Summary of economic optimum nitrogen rates using the maximum return to N model for two locations in Northwest Minnesota during 2014.
Ratio of Price N:Price per bushel of corn Location 0.00 0.05 0.10 0.15 0.20 0.25
-------------------lb N/acre------------------Mahnomen 107 107 107 107 107 107
Norman 99 93 88 82 77 71
Mahnomen County 2014
0 50 100 150 200
Cor
n G
rain
Yie
ld (b
u/ac
)
100
120
140
160
180
200
Pre-plant NSide-dress N
Pre-plant Nitrogen Rate (lbs N/ac)
Norman County 2014
0 50 100 150 200
Cor
n G
rain
Yie
ld (b
u/ac
)
60
80
100
120
140
160
180
200
Pre-plant NSide-dress N
Pre-plant Nitrogen Rate (lbs N/ac)

Page 13
For Additional Information: Contact Daniel Kaiser ([email protected])
Project Funding Provided by: Minnesota Corn Research and Promotion Council
Corn Response to Sulfur Fertilizer—Mahnomen/Marshall Co.
Nearest Town: Waubun (Mahnomen Co.) & New Folden (Marshall Co.) Soil Type: Mahnomen County: Fargo silty clay Marshall County: Grimstad fine sandy loam Row Width: 30” Experimental Design: Randomized complete block design Four sulfur rates: 0, 10, 20, and 30 lbs S per acre Sulfur source: ammonium sulfate (21-0-0-24) Sulfur applied at or prior to planting 4 replications
Purpose of Study: To determine if sulfur can increase corn yield on high organic matter soils in Northwest Minnesota.
Results:
Yield potential was generally affected by wet then dry weather conditions at each location.
Yield data exhibited large variability especially at the Norman location. Some plot data was discarded that was abnormally low yielding.
Corn grain yield was not increased at either location nor did the two site average differ indicating no benefit from sulfur fertilizer application at either site.
There was no statistical difference in grain moisture taken at harvest. The Norman site did exhibit a slight increasing trend in grain moisture with increasing sulfur rate. Typically sulfur has been shown decrease moisture of the harvested grain. The corn exhibited greater moisture stress at the Norman site. The increase in grain moisture may have been a result of sulfur and an positive benefit for corn grown under nitrogen or moisture stress.
This data supports previous research in a lack of response to sulfur on soils with high organic matter concentration.
O n - F a r m C r o p p I n g T r I a l s
Table 1. Summary of corn grain yield (adjusted to 15.5% moisture) response to sulfur rate at locations in NW Minnesota.
Sulfur Rate Marshall Norman Average - lb S/ac - ----------Bushels/acre----------
0 153 132 144 10 155 127 143 20 152 128 143 30 156 133 146 Statistical Significance
P>F ns ns ns
Table 2. Summary of corn grain moisture response to sulfur rate at locations in NW Minnesota.
Sulfur Rate Marshall Norman Average -lb S/ac- ----------------%----------------
0 20.5 16.7 18.6 10 20.1 16.7 18.4 20 22.1 18.5 20.3 30 20.1 18.0 19.0 Statistical Significance
P>F ns ns ns

Page 14
For Additional Information: Jodi DeJong-Hughes, [email protected]
Project Funding Provided by: MN Corn Growers and MN SARE
On-Farm Evaluation of Cover Crops following Corn Silage - Stearns Co.
Cooperator: Dan Ley Nearest Town: Roscoe Soil Type: Sandy Loam Tillage: No till Previous Crop: Corn Silage Planting Date: May 16, 2014 Row Width: 30” Fertilizer: Within UMN rec’s Planting Population: 29,000 Harvest Date: October 20, 2014 Experimental Design: Replicated, randomized complete block
Partners: Stearns Co SWCD and NRCS
Purpose of Study: Row crop systems using conventional tillage allow the soil to be idle from October/November through April/May. This often leaves the soil vulnerable to wind and water erosion, and nutrient loss due to leaching and runoff.
Cover crops are one tool that growers can utilize to protect and enhance their most valuable resource: productive soil. Lack of knowledge about this practice creates a barrier to adoption. While time is limited to establish cover crops after corn for grain or soybeans are harvested, there is a small window to seed cover crops after corn is harvested for silage.
Objectives: Evaluate cereal rye cover crop establishment using three different seeding methods: no-till drill (Photo 1), broadcast and incorporate, slurry seeding and no cover crop to determine differences in the subsequent corn yield.
Results:Cover crops were planted 9/11/13 right at silage harvest. The field received 1.5” of rain 2-3 days later. This greatly improved the chance of successful establishment. Rye growth was about 6-8” before cold temps ended the season. The spring was very wet and terminating the rye was not completed until the rye was 10-14” tall.
Where the rye was very thick and tall (no-till drill and broadcast-incorporate), had a negative effect on emergence and corn growth (Table 1, Photo 2). The slurry seed rye did not have the full emergence and therefore had similar corn emergence and growth as using no cover crops (Table 1). Plant growth factors affected crop yield, with more rye biomass negatively effecting yield (Table 1).
Conclusion: While cover crops offer soil protection and other benefits, a spring cover crop must be treated as a weed and terminated at 2-4 inches or it could negatively effect the primary crop yield.
O n - F a r m C r o p p I n g T r I a l s
Photo 1. No-till drill planting fall cereal rye.
TRT
June 8 Stand
(plants/a)
June 8 Height
(inches) Corn Yield
(bu/a)
Slurry Seeded 26,917 a 19.4 b 148 a
No-tillDrill 23,667 b 16.2 c 117 b
Bdcst Incorp 18,917 c 15.2 c 94 c
No Cov-er Crop 27,750 a 20.5 a 154 a
Means followed by different letters are significantly different at the 95% confidence level.
Table 1. Fall cover crop seeding methods and corn growth and yield response.
Photo 2. Corn planted into fall broadcast cereal rye.

Page 15
2014 Corn Hybrid Trials— Mahnomen/Polk/Marshall Counties
Cooperator: Duane Pazdernik (Mahnomen), Matthew Kruger (Polk), Rodney Liedberg (Marshall) Nearest Town: Mahnomen, East Grand Forks, Newfolden Previous Crop: Soybean (Mahnomen), Soybean (Polk), Wheat (Marshall) Planting Date: Mahnomen and East Grand Forks sites planted 5/23 and Newfolden site 5/27 Row Width: 30” rows Harvest Date: Mahnomen 10/23, Sherack 10/24, Newfolden10/31 Experimental Design: Alpha Lattice Design with 4 replications
Purpose of Study: Evaluate the performance of commercially available corn hybrids in Northwestern MN
Results: Yield and moisture data from 4 replications is summarized in the tables below. Yields are adjusted to 15.5% moisture. There were significant differences in moisture and yield between corn hybrids at all locations.
O n - F a r m C r o p p I n g T r I a l s
Corn Hybrid Trial - Mahnomen
Company Hybrid RM Moisture Yield
Peterson Farms Seed 71D83 83 19.1 156.7Dairyland DS-6284 84 22.0 157.6NuTech 5N-186 86 19.6 159.4Peterson Farms Seed 98E84 84 18.0 161.0Thunder 6382 VT2P RIB 82 19.9 165.3Thunder 5181 RR 81 18.5 165.7Nuseed 8202 VP3220 82 18.4 166.7Channel 181-92VT2PRIB 81 17.9 167.0Stine R9206RR 89 21.0 168.6Mycogen 2Y189 85 20.6 169.1Dairyland DS-7085 85 18.9 169.4Integra 3912 89 23.5 170.4Channel 183-23VT2PRIB 83 18.5 170.5NK N23M-3011A 88 19.8 170.5Nuseed 8504 VT2P 85 18.6 170.9NuTech 5B-290 90 22.3 171.0Mycogen 2G164 85 18.6 171.6Integra 9361 86 19.2 172.2NK N19L-3110A 85 18.7 172.7NK N20Y-3220 85 18.9 173.0Thunder 6385 VT2P RIB 85 19.3 173.1
PreliminaryNorth zone, early maturing (<81) corn hybrid trial results for a single location, Marshall Co., MN, 2014.Brand Variety RM Moisture Yield
(%) (bu/a)NuTech/G2 Genetics 5H‐7802 78 25.2 135.5NuTech/G2 Genetics 3F‐775™ 75 21.6 134.2Peterson Farms Seed 71N78 78 20.7 132.0Mustang 1278VT2P 78 21.2 130.9Wensman Seed W 8076VT2RIB 79 22.5 128.8NuTech/G2 Genetics 5Z‐379™ 79 25.1 124.9Thunder 4578 RR 78 21.6 121.7Legacy Seeds L‐1814 VT2PRO 79 24.3 119.5Mustang 1279VT2P 79 23.3 118.7Dahlman R39‐11 78 27.5 118.7NK N07H‐3110 77 19.0 118.6Peterson Farms Seed 71C80 80 22.8 117.3Legend Seeds LS 9279 VT2PRIB 79 23.9 116.6REA Hybrids 1B102 76 25.4 116.4Proseed 1377 77 23.0 116.2Proseed 1280 80 23.9 113.7NorthStar Genetics ‐ Viking VS 80‐580 80 24.8 112.3Nuseed 2771 GT 77 27.4 111.5Thunder 4377 RR 77 28.8 109.8Mycogen 2D095 80 29.2 109.0Wensman Seed W 80809VT2PRO 80 24.5 108.8Thunder 6180 VT2P RIB 80 25.3 107.2Nuseed 8001 VT2P 80 25.7 107.0REA Hybrids 1B801 80 22.9 106.6REA Hybrids 1B790 79 24.5 106.5Partners Brand PB 5030GT 80 31.1 99.8NK N09V‐3110 79 25.3 99.7Partners Brand PB 4833RR 78 30.2 92.8Mean 24.7 115.5CV (%) 4.7 6.9LSD (0.1) 2.4 13.9
2014 Corn Hybrid Trials— Marshall/Polk/Mahnomen Counties
Purpose of Study: Evaluate the performance of commercially available corn hybrids in Northwestern MN.
Results: Yield and moisture data from 4 replications is summarized in the tables below. Yields are adjusted to 15.5% moisture.There were significant differences in moisture and yield between corn hybrids at all locations.
Cooperator: Duane Pazdernik (Mahnomen), Matthew Kruger (Polk), Rodney Liedberg (Marshall)Nearest Town: Mahnomen, East Grand Forks, NewfoldenPrevious Crop: Soybean (Mahnomen), Soybean (Polk), Wheat (Marshall)Planting Date: Mahnomen and East Grand Forks sites planted 5/23 and Newfolden site 5/27
Row Width: 30” rowsHarvest Date: Mahnomen 10/23, Sherack 10/24, Newfolden10/31
Experimental Design Alpha Lattice Design with 4 replications

Page 16
PreliminaryNorth zone, late maturing (>81) corn hybrid trial results for a single location, Marshall Co., MN, 2014.Brand Variety RM Moisture Yield
(%) (bu/a)Legacy Seeds L‐2314 VT2PRO 83 26.3 141.5REA Hybrids 2V550 85 27.0 131.7Legacy Seeds L‐2213 VT2PRO 82 23.2 128.4REA Hybrids 2B850 85 28.4 126.3Producers Hybrids 4363 VT2RIB 83 24.0 125.0Thunder 4585 RR 85 27.0 124.9Dahlman R41‐28VT2PRIB 81 23.8 124.0Hyland Seeds 3175 84 32.4 123.6Thunder 5181 RR 81 22.7 122.7Wensman Seed W 80841VT2RIB 84 25.6 121.1Nuseed 8504 VT2P 85 27.4 120.1Partners Brand Check PB 5203 29.4 119.0Peterson Farms Seed 71D83 83 24.8 118.2Thunder 6385 VT2P RIB 85 25.1 118.1Thunder 4383 VT2P RIB 83 24.3 116.7Proseed 1185 85 31.2 116.6NorthStar Genetics ‐ Viking VS 85‐572 85 25.5 116.4Hyland Seeds 8166RA 83 29.3 115.8NorthStar Genetics ‐ Viking VS 81‐481 81 27.1 115.1Peterson Farms Seed 98E84 84 37.0 114.5Proseed 1283 83 25.8 114.1Hyland Seeds 4164 83 28.4 113.6Hyland Seeds Check 8180 32.4 113.1REA Hybrids 1B820 82 25.2 112.9NuTech/G2 Genetics 3F‐781™ 81 23.9 112.3Legacy Seeds L‐1943 VT2PRO 81 23.0 112.2Partners Brand PB 5203GT 82 31.1 111.4Legend Seeds LS 9482 VT2PRIB 82 27.0 111.2Thunder 6382 VT2P RIB 82 28.9 110.4Hyland Seeds 8180RA 84 31.9 110.0NuTech 5N‐183 83 28.5 107.8Mycogen 2Y189 85 33.1 104.1Mycogen 2R158 83 30.7 103.8Nuseed 8202 VP3220 82 31.0 102.6Proseed 1382 82 28.3 100.9Partners Brand Check PB 4833RR 28.3 99.7Hyland Seeds 8201RA 84 36.6 92.2Hyland Seeds Check 8201RA 37.8 90.2Mean 28.2 114.8CV (%) 4.7 6.9LSD (0.1) 2.4 13.9
Page 17
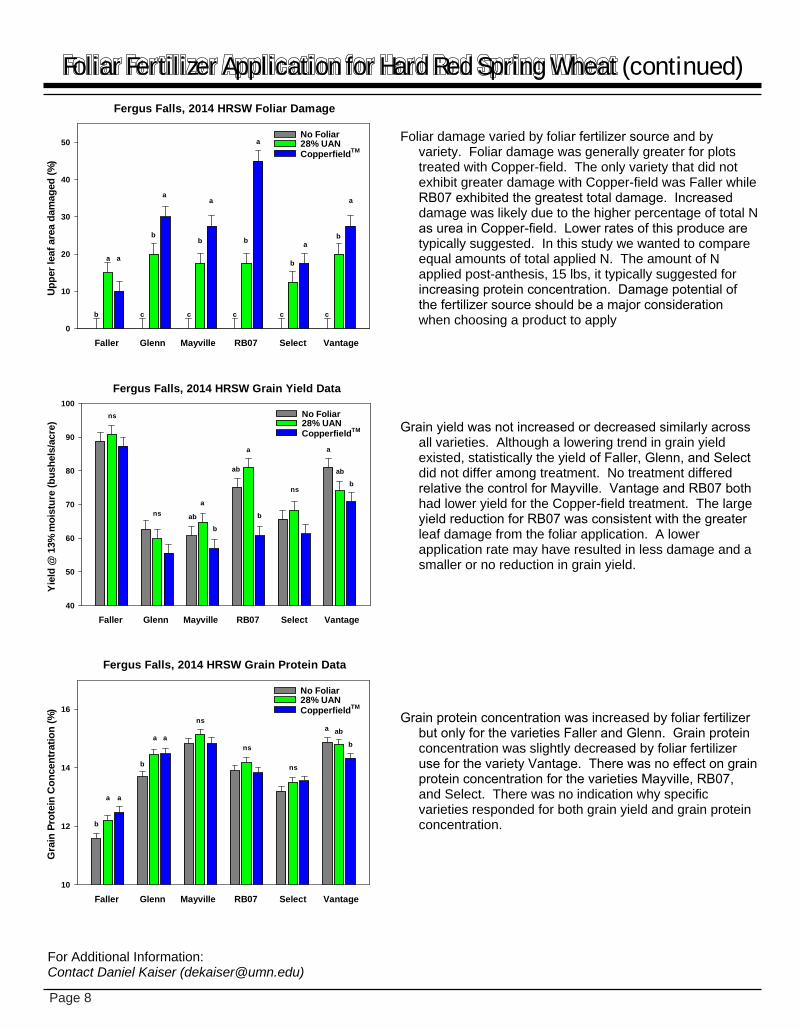
PreliminaryNorth zone, early maturing (<81) corn hybrid trial results for a single location, Polk County, MN, 2014.Brand Variety RM Moisture Yield
(%) (bu/a)NuTech/G2 Genetics 5H‐7802 78 19.4 192.4NuTech/G2 Genetics 3F‐775™ 75 18.0 186.2Partners Brand PB 5030GT 80 18.0 183.8Mycogen 2D095 80 19.8 183.6Legend Seeds LS 9279 VT2PRIB 79 19.1 181.0Peterson Farms Seed 71N78 78 18.3 179.7NK N07H‐3110 77 16.7 178.6REA Hybrids 1B102 76 20.0 177.8Proseed 1280 80 18.1 176.6NuTech/G2 Genetics 5Z‐379™ 79 20.2 176.1NorthStar Genetics ‐ Viking VS 80‐580 80 19.1 175.7Thunder 6180 VT2P RIB 80 20.0 175.6Thunder 4377 RR 77 22.0 175.5REA Hybrids 1B801 80 18.6 175.4NK N09V‐3110 79 18.6 175.4Nuseed 2771 GT 77 20.5 175.2REA Hybrids 1B790 79 19.1 173.7Mustang 1278VT2P 78 18.6 173.0Legacy Seeds L‐1814 VT2PRO 79 17.3 171.1Proseed 1377 77 16.9 169.2Thunder 4578 RR 78 17.5 169.1Peterson Farms Seed 71C80 80 18.2 167.7Nuseed 8001 VT2P 80 19.0 167.6Dahlman R39‐11 78 18.5 165.2Mustang 1279VT2P 79 18.0 160.3Wensman Seed W 8076VT2RIB 79 17.9 160.1Partners Brand PB 4833RR 78 19.8 158.7Wensman Seed W 80809VT2PRO 80 19.1 156.0Mean 18.8 173.6CV (%) 5.7 5.9LSD (0.1) 2.3 20.2

Page 18
PreliminaryNorth zone, late maturing (>81) corn hybrid trial results for a single location, Polk County, MN, 2014.Brand Variety RM Moisture Yield
(%) (bu/a)Nuseed 8504 VT2P 85 19.9 206.0Proseed 1185 85 20.9 201.6Hyland Seeds 8166RA 83 20.1 197.3Hyland Seeds Check 8201RA 18.8 195.7Partners Brand Check PB 5203 18.3 194.4Mycogen 2Y189 85 21.1 193.4NuTech 5N‐183 83 19.8 193.2Hyland Seeds Check 8180 20.8 192.7NorthStar Genetics ‐ Viking VS 85‐572 85 19.7 191.2REA Hybrids 2B850 85 17.7 191.1REA Hybrids 2V550 85 19.0 190.6Hyland Seeds 4164 83 18.1 189.3NorthStar Genetics ‐ Viking VS 81‐481 81 17.4 188.7Thunder 4585 RR 85 19.6 187.5Partners Brand PB 5203GT 82 19.9 186.5Nuseed 8202 VP3220 82 19.5 186.2NuTech/G2 Genetics 3F‐781™ 81 19.1 185.9Proseed 1382 82 19.3 185.1Proseed 1283 83 19.5 185.0Legend Seeds LS 9482 VT2PRIB 82 19.1 184.2Hyland Seeds 3175 84 21.4 182.8Hyland Seeds 8180RA 84 20.5 182.8Hyland Seeds 8201RA 84 21.3 182.5Thunder 6382 VT2P RIB 82 22.1 180.8Legacy Seeds L‐2213 VT2PRO 82 17.7 180.6Producers Hybrids 4363 VT2RIB 83 18.4 180.0Peterson Farms Seed 98E84 84 19.3 178.4Legacy Seeds L‐1943 VT2PRO 81 18.0 176.5Mycogen 2R158 83 18.3 176.2Thunder 6385 VT2P RIB 85 17.2 174.7Peterson Farms Seed 71D83 83 18.2 173.4Partners Brand Check PB 4833RR 19.5 173.3Legacy Seeds L‐2314 VT2PRO 83 20.5 172.9Wensman Seed W 80841VT2RIB 84 19.4 172.2Thunder 4383 VT2P RIB 83 19.2 169.2Thunder 5181 RR 81 18.5 166.0Dahlman R41‐28VT2PRIB 81 19.6 166.0REA Hybrids 1B820 82 18.4 160.5Mean 19.4 183.5CV (%) 5.7 5.9LSD (0.1) 2.3 20.2

Page 19
PreliminaryNorth zone combined (Ramsey, Grand Forks, Marshall and Polk Cos.) early maturing (<81) corn hybrid trial results, 2014.Brand Variety RM Moisture Yield
(%) (bu/a)NuTech/G2 Genetics 5H‐7802 78 19.1 161.3Mustang 1278VT2P 78 18.8 151.8Peterson Farms Seed 71N78 78 18.4 151.2NuTech/G2 Genetics 3F‐775™ 75 18.1 150.3Legend Seeds LS 9279 VT2PRIB 79 19.4 147.1NK N07H‐3110 77 16.4 146.5Legacy Seeds L‐1814 VT2PRO 79 19.0 145.8Mycogen 2D095 80 21.6 144.7Wensman Seed W 8076VT2RIB 79 18.1 144.7Partners Brand PB 5030GT 80 19.9 144.6NuTech/G2 Genetics 5Z‐379™ 79 19.5 144.3NK N09V‐3110 79 19.8 143.9Thunder 4578 RR 78 18.0 143.8Proseed 1280 80 18.9 143.0Nuseed 2771 GT 77 20.0 142.9Proseed 1377 77 18.4 142.9REA Hybrids 1B102 76 19.1 142.7Peterson Farms Seed 71C80 80 19.0 142.0NorthStar Genetics ‐ Viking VS 80‐580 80 19.5 141.3Thunder 6180 VT2P RIB 80 19.8 141.1REA Hybrids 1B801 80 18.3 140.7Thunder 4377 RR 77 21.4 140.0REA Hybrids 1B790 79 19.0 139.5Mustang 1279VT2P 79 18.7 136.9Wensman Seed W 80809VT2PRO 80 19.3 136.7Nuseed 8001 VT2P 80 19.7 135.7Dahlman R39‐11 78 19.9 133.9Partners Brand PB 4833RR 78 21.2 126.4Mean 19.2 143.1CV (%) 12.2 10.1LSD (0.1) 2.2 11.5
Page 20
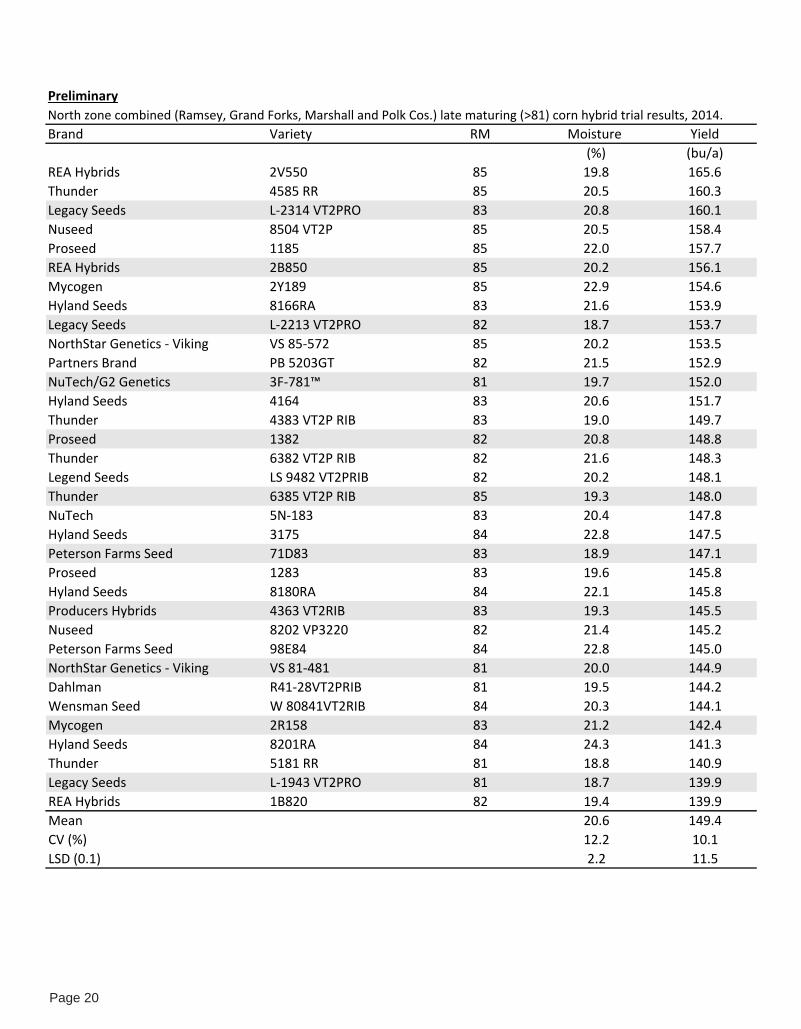
PreliminaryNorth zone combined (Ramsey, Grand Forks, Marshall and Polk Cos.) late maturing (>81) corn hybrid trial results, 2014.Brand Variety RM Moisture Yield
(%) (bu/a)REA Hybrids 2V550 85 19.8 165.6Thunder 4585 RR 85 20.5 160.3Legacy Seeds L‐2314 VT2PRO 83 20.8 160.1Nuseed 8504 VT2P 85 20.5 158.4Proseed 1185 85 22.0 157.7REA Hybrids 2B850 85 20.2 156.1Mycogen 2Y189 85 22.9 154.6Hyland Seeds 8166RA 83 21.6 153.9Legacy Seeds L‐2213 VT2PRO 82 18.7 153.7NorthStar Genetics ‐ Viking VS 85‐572 85 20.2 153.5Partners Brand PB 5203GT 82 21.5 152.9NuTech/G2 Genetics 3F‐781™ 81 19.7 152.0Hyland Seeds 4164 83 20.6 151.7Thunder 4383 VT2P RIB 83 19.0 149.7Proseed 1382 82 20.8 148.8Thunder 6382 VT2P RIB 82 21.6 148.3Legend Seeds LS 9482 VT2PRIB 82 20.2 148.1Thunder 6385 VT2P RIB 85 19.3 148.0NuTech 5N‐183 83 20.4 147.8Hyland Seeds 3175 84 22.8 147.5Peterson Farms Seed 71D83 83 18.9 147.1Proseed 1283 83 19.6 145.8Hyland Seeds 8180RA 84 22.1 145.8Producers Hybrids 4363 VT2RIB 83 19.3 145.5Nuseed 8202 VP3220 82 21.4 145.2Peterson Farms Seed 98E84 84 22.8 145.0NorthStar Genetics ‐ Viking VS 81‐481 81 20.0 144.9Dahlman R41‐28VT2PRIB 81 19.5 144.2Wensman Seed W 80841VT2RIB 84 20.3 144.1Mycogen 2R158 83 21.2 142.4Hyland Seeds 8201RA 84 24.3 141.3Thunder 5181 RR 81 18.8 140.9Legacy Seeds L‐1943 VT2PRO 81 18.7 139.9REA Hybrids 1B820 82 19.4 139.9Mean 20.6 149.4CV (%) 12.2 10.1LSD (0.1) 2.2 11.5
Page 21
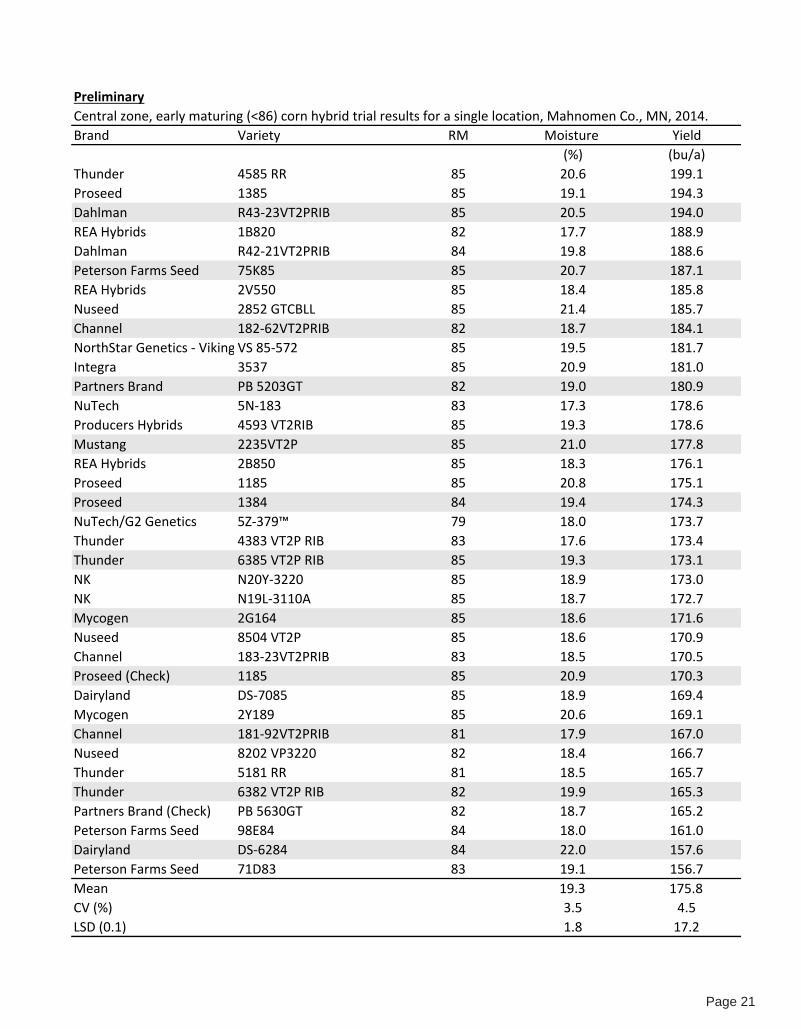
PreliminaryCentral zone, early maturing (<86) corn hybrid trial results for a single location, Mahnomen Co., MN, 2014.Brand Variety RM Moisture Yield
(%) (bu/a)Thunder 4585 RR 85 20.6 199.1Proseed 1385 85 19.1 194.3Dahlman R43‐23VT2PRIB 85 20.5 194.0REA Hybrids 1B820 82 17.7 188.9Dahlman R42‐21VT2PRIB 84 19.8 188.6Peterson Farms Seed 75K85 85 20.7 187.1REA Hybrids 2V550 85 18.4 185.8Nuseed 2852 GTCBLL 85 21.4 185.7Channel 182‐62VT2PRIB 82 18.7 184.1NorthStar Genetics ‐ Viking VS 85‐572 85 19.5 181.7Integra 3537 85 20.9 181.0Partners Brand PB 5203GT 82 19.0 180.9NuTech 5N‐183 83 17.3 178.6Producers Hybrids 4593 VT2RIB 85 19.3 178.6Mustang 2235VT2P 85 21.0 177.8REA Hybrids 2B850 85 18.3 176.1Proseed 1185 85 20.8 175.1Proseed 1384 84 19.4 174.3NuTech/G2 Genetics 5Z‐379™ 79 18.0 173.7Thunder 4383 VT2P RIB 83 17.6 173.4Thunder 6385 VT2P RIB 85 19.3 173.1NK N20Y‐3220 85 18.9 173.0NK N19L‐3110A 85 18.7 172.7Mycogen 2G164 85 18.6 171.6Nuseed 8504 VT2P 85 18.6 170.9Channel 183‐23VT2PRIB 83 18.5 170.5Proseed (Check) 1185 85 20.9 170.3Dairyland DS‐7085 85 18.9 169.4Mycogen 2Y189 85 20.6 169.1Channel 181‐92VT2PRIB 81 17.9 167.0Nuseed 8202 VP3220 82 18.4 166.7Thunder 5181 RR 81 18.5 165.7Thunder 6382 VT2P RIB 82 19.9 165.3Partners Brand (Check) PB 5630GT 82 18.7 165.2Peterson Farms Seed 98E84 84 18.0 161.0Dairyland DS‐6284 84 22.0 157.6Peterson Farms Seed 71D83 83 19.1 156.7Mean 19.3 175.8CV (%) 3.5 4.5LSD (0.1) 1.8 17.2
Page 22
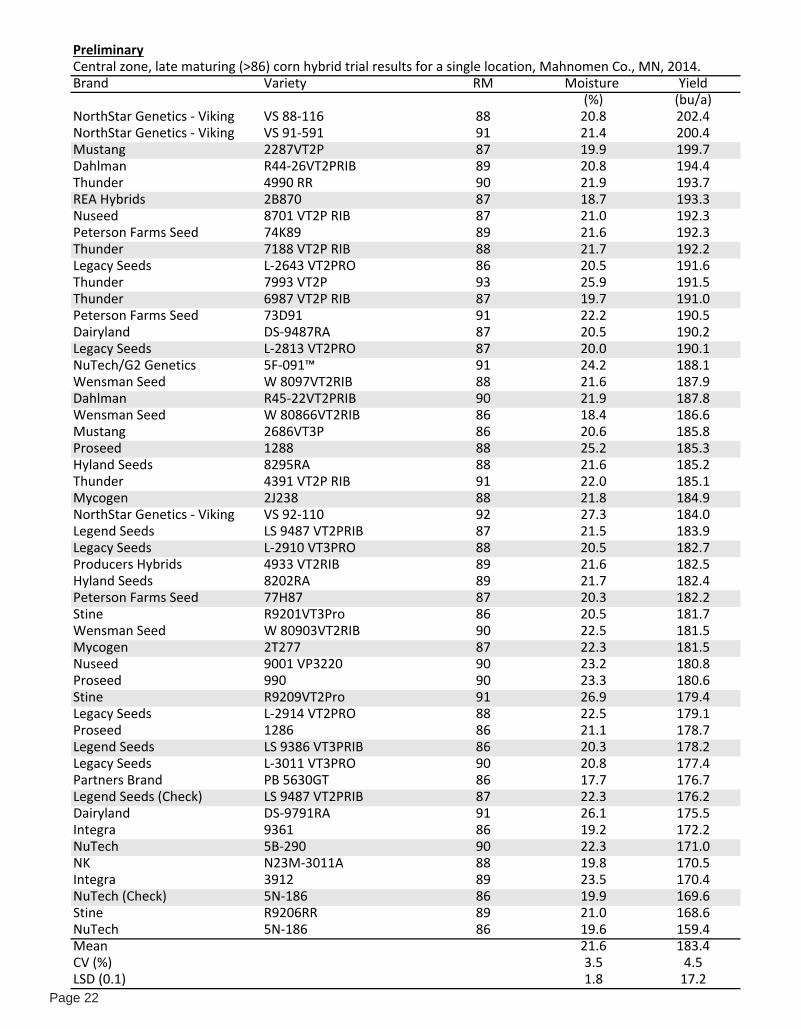
PreliminaryCentral zone, late maturing (>86) corn hybrid trial results for a single location, Mahnomen Co., MN, 2014.Brand Variety RM Moisture Yield
(%) (bu/a)NorthStar Genetics ‐ Viking VS 88‐116 88 20.8 202.4NorthStar Genetics ‐ Viking VS 91‐591 91 21.4 200.4Mustang 2287VT2P 87 19.9 199.7Dahlman R44‐26VT2PRIB 89 20.8 194.4Thunder 4990 RR 90 21.9 193.7REA Hybrids 2B870 87 18.7 193.3Nuseed 8701 VT2P RIB 87 21.0 192.3Peterson Farms Seed 74K89 89 21.6 192.3Thunder 7188 VT2P RIB 88 21.7 192.2Legacy Seeds L‐2643 VT2PRO 86 20.5 191.6Thunder 7993 VT2P 93 25.9 191.5Thunder 6987 VT2P RIB 87 19.7 191.0Peterson Farms Seed 73D91 91 22.2 190.5Dairyland DS‐9487RA 87 20.5 190.2Legacy Seeds L‐2813 VT2PRO 87 20.0 190.1NuTech/G2 Genetics 5F‐091™ 91 24.2 188.1Wensman Seed W 8097VT2RIB 88 21.6 187.9Dahlman R45‐22VT2PRIB 90 21.9 187.8Wensman Seed W 80866VT2RIB 86 18.4 186.6Mustang 2686VT3P 86 20.6 185.8Proseed 1288 88 25.2 185.3Hyland Seeds 8295RA 88 21.6 185.2Thunder 4391 VT2P RIB 91 22.0 185.1Mycogen 2J238 88 21.8 184.9NorthStar Genetics ‐ Viking VS 92‐110 92 27.3 184.0Legend Seeds LS 9487 VT2PRIB 87 21.5 183.9Legacy Seeds L‐2910 VT3PRO 88 20.5 182.7Producers Hybrids 4933 VT2RIB 89 21.6 182.5Hyland Seeds 8202RA 89 21.7 182.4Peterson Farms Seed 77H87 87 20.3 182.2Stine R9201VT3Pro 86 20.5 181.7Wensman Seed W 80903VT2RIB 90 22.5 181.5Mycogen 2T277 87 22.3 181.5Nuseed 9001 VP3220 90 23.2 180.8Proseed 990 90 23.3 180.6Stine R9209VT2Pro 91 26.9 179.4Legacy Seeds L‐2914 VT2PRO 88 22.5 179.1Proseed 1286 86 21.1 178.7Legend Seeds LS 9386 VT3PRIB 86 20.3 178.2Legacy Seeds L‐3011 VT3PRO 90 20.8 177.4Partners Brand PB 5630GT 86 17.7 176.7Legend Seeds (Check) LS 9487 VT2PRIB 87 22.3 176.2Dairyland DS‐9791RA 91 26.1 175.5Integra 9361 86 19.2 172.2NuTech 5B‐290 90 22.3 171.0NK N23M‐3011A 88 19.8 170.5Integra 3912 89 23.5 170.4NuTech (Check) 5N‐186 86 19.9 169.6Stine R9206RR 89 21.0 168.6NuTech 5N‐186 86 19.6 159.4Mean 21.6 183.4CV (%) 3.5 4.5LSD (0.1) 1.8 17.2

Page 23
PreliminaryCentral zone combined (Cass, Steele, Griggs and Mahnomen Cos.) early maturing (<86) corn hybrid trial results, 2014.Brand Variety RM Moisture Yield
(%) (bu/a)Thunder 4585 RR 85 20.5 198.4Nuseed 2852 GTCBLL 85 20.7 193.4REA Hybrids 2V550 85 19.0 191.6Dahlman R43‐23VT2PRIB 85 20.5 191.6Dahlman R42‐21VT2PRIB 84 19.9 191.5Proseed 1385 85 19.5 191.2REA Hybrids 1B820 82 17.5 189.9Peterson Farms Seed 75K85 85 20.2 189.8Thunder 4383 VT2P RIB 83 17.5 189.6Partners Brand PB 5203GT 82 19.6 187.9Proseed 1185 85 19.8 187.7Mycogen 2G164 85 18.3 186.6NuTech/G2 Genetics 5Z‐379™ 79 17.3 184.8Producers Hybrids 4593 VT2RIB 85 17.3 184.7NorthStar Genetics ‐ Viking VS 85‐572 85 19.6 182.4Mustang 2235VT2P 85 20.7 181.9Channel 183‐23VT2PRIB 83 18.7 181.8Dairyland DS‐7085 85 18.4 181.3Integra 3537 85 20.5 181.3Mycogen 2Y189 85 19.6 180.3Channel 182‐62VT2PRIB 82 18.1 180.1Thunder 6385 VT2P RIB 85 19.4 180.0NK N19L‐3110A 85 18.3 179.8Proseed 1384 84 19.3 179.4NuTech 5N‐183 83 17.6 179.0Peterson Farms Seed 71D83 83 18.3 178.0Channel 181‐92VT2PRIB 81 17.0 177.9NK N20Y‐3220 85 20.2 177.5Nuseed 8504 VT2P 85 17.1 177.3Thunder 5181 RR 81 17.8 176.8Nuseed 8202 VP3220 82 20.3 175.1Peterson Farms Seed 98E84 84 17.4 175.1Dairyland DS‐6284 84 21.5 173.8Thunder 6382 VT2P RIB 82 19.8 172.8REA Hybrids 2B850 85 17.7 171.1Mean 19.0 182.9CV (%) 5.9 4.4LSD (0.1) 1.3 10.1

Page 24
PreliminaryCentral zone combined (Cass, Steele, Griggs and Mahnomen Cos.) late maturing (>86) corn hybrid trial results, 2014.Brand Variety RM Moisture Yield
(%) (bu/a)Thunder 4990 RR 90 21.0 208.5NorthStar Genetics ‐ Viking VS 88‐116 88 21.4 204.3Wensman Seed W 8097VT2RIB 88 21.4 202.6Thunder 7993 VT2P 93 25.4 200.7Dahlman R44‐26VT2PRIB 89 21.5 199.6NorthStar Genetics ‐ Viking VS 91‐591 91 21.4 198.4Peterson Farms Seed 73D91 91 22.4 197.8NuTech/G2 Genetics 5F‐091™ 91 22.2 197.6NuTech 5B‐290 90 22.1 197.6Peterson Farms Seed 74K89 89 21.8 196.4Dahlman R45‐22VT2PRIB 90 21.5 196.4Mustang 2287VT2P 87 19.5 196.3Thunder 7188 VT2P RIB 88 22.0 195.7Proseed 990 90 22.6 195.3NorthStar Genetics ‐ Viking VS 92‐110 92 26.5 195.2Hyland Seeds 8295RA 88 21.5 194.8REA Hybrids 2B870 87 19.9 194.8Proseed 1286 86 19.8 194.7Legacy Seeds L‐2813 VT2PRO 87 19.8 194.4Nuseed 9001 VP3220 90 21.9 193.0Legacy Seeds L‐3011 VT3PRO 90 20.8 192.4Wensman Seed W 80866VT2RIB 86 18.8 192.3Thunder 6987 VT2P RIB 87 19.2 191.8Peterson Farms Seed 77H87 87 19.8 191.7Legacy Seeds L‐2643 VT2PRO 86 20.8 191.5Dairyland DS‐9487RA 87 21.2 190.4Wensman Seed W 80903VT2RIB 90 22.4 190.3Producers Hybrids 4933 VT2RIB 89 22.1 189.5Nuseed 8701 VT2P RIB 87 20.2 189.4Hyland Seeds 8202RA 89 21.4 188.7Proseed 1288 88 23.5 188.1Legend Seeds LS 9487 VT2PRIB 87 21.0 188.1Mycogen 2J238 88 21.1 188.0Legacy Seeds L‐2910 VT3PRO 88 19.9 187.1Stine R9209VT2Pro 91 26.3 186.7Thunder 4391 VT2P RIB 91 22.2 185.7Legend Seeds LS 9386 VT3PRIB 86 20.1 184.6Stine R9201VT3Pro 86 19.8 184.5Integra 3912 89 23.4 184.5Legacy Seeds L‐2914 VT2PRO 88 21.8 183.5Mycogen 2T277 87 20.8 183.2Mustang 2686VT3P 86 19.8 182.7Stine R9206RR 89 19.8 181.8Dairyland DS‐9791RA 91 26.6 179.8NuTech 5N‐186 86 18.5 179.5Partners Brand PB 5630GT 86 19.4 179.1NK N23M‐3011A 88 20.0 176.8Integra 9361 86 19.1 174.0Mean 21.4 190.8CV (%) 5.9 4.4LSD (0.1) 1.3 10.1
Page 25
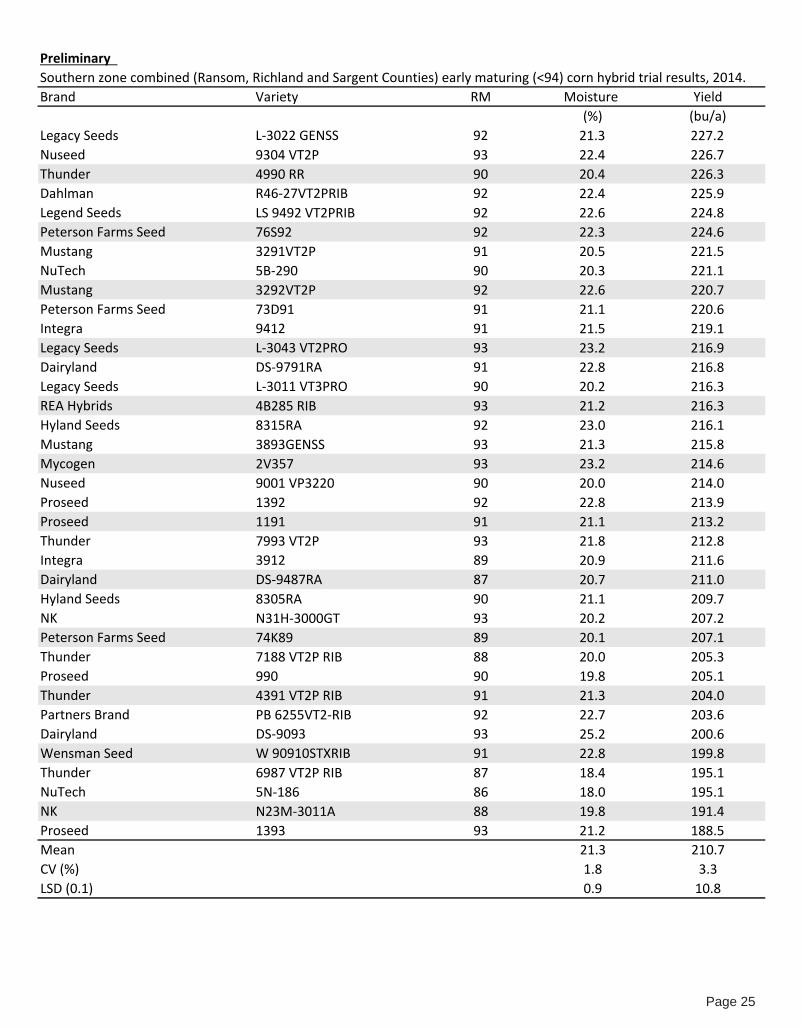
Preliminary Southern zone combined (Ransom, Richland and Sargent Counties) early maturing (<94) corn hybrid trial results, 2014. Brand Variety RM Moisture Yield
(%) (bu/a)Legacy Seeds L‐3022 GENSS 92 21.3 227.2Nuseed 9304 VT2P 93 22.4 226.7Thunder 4990 RR 90 20.4 226.3Dahlman R46‐27VT2PRIB 92 22.4 225.9Legend Seeds LS 9492 VT2PRIB 92 22.6 224.8Peterson Farms Seed 76S92 92 22.3 224.6Mustang 3291VT2P 91 20.5 221.5NuTech 5B‐290 90 20.3 221.1Mustang 3292VT2P 92 22.6 220.7Peterson Farms Seed 73D91 91 21.1 220.6Integra 9412 91 21.5 219.1Legacy Seeds L‐3043 VT2PRO 93 23.2 216.9Dairyland DS‐9791RA 91 22.8 216.8Legacy Seeds L‐3011 VT3PRO 90 20.2 216.3REA Hybrids 4B285 RIB 93 21.2 216.3Hyland Seeds 8315RA 92 23.0 216.1Mustang 3893GENSS 93 21.3 215.8Mycogen 2V357 93 23.2 214.6Nuseed 9001 VP3220 90 20.0 214.0Proseed 1392 92 22.8 213.9Proseed 1191 91 21.1 213.2Thunder 7993 VT2P 93 21.8 212.8Integra 3912 89 20.9 211.6Dairyland DS‐9487RA 87 20.7 211.0Hyland Seeds 8305RA 90 21.1 209.7NK N31H‐3000GT 93 20.2 207.2Peterson Farms Seed 74K89 89 20.1 207.1Thunder 7188 VT2P RIB 88 20.0 205.3Proseed 990 90 19.8 205.1Thunder 4391 VT2P RIB 91 21.3 204.0Partners Brand PB 6255VT2‐RIB 92 22.7 203.6Dairyland DS‐9093 93 25.2 200.6Wensman Seed W 90910STXRIB 91 22.8 199.8Thunder 6987 VT2P RIB 87 18.4 195.1NuTech 5N‐186 86 18.0 195.1NK N23M‐3011A 88 19.8 191.4Proseed 1393 93 21.2 188.5Mean 21.3 210.7CV (%) 1.8 3.3LSD (0.1) 0.9 10.8

Page 26
Preliminary Southern zone combined (Ransom, Richland and Sargent counties) late maturing (>94) corn hybrid trial results, 2014. Brand Variety RM Moisture Yield
(%) (bu/a)REA Hybrids 4B953 RIB 95 21.7 236.5Dahlman R47‐35VT3PRIB 94 22.9 228.3Integra 9455 95 19.9 227.1Peterson Farms Seed 81W95 95 23.1 226.4REA Hybrids 4B941 RIB 97 22.6 225.6Wensman Seed W 90941STX 94 21.4 223.9Thunder 9595 VT3P RIB 95 23.1 223.8Nuseed 9505 VT2P RIB 95 23.1 223.8NorthStar Genetics ‐ Viking VS 94‐571 94 21.6 222.6NuTech/G2 Genetics 5F‐399™ 99 24.6 222.5NuTech/G2 Genetics 5F‐295™ 95 21.9 222.5Stine R9422VT3Pro 96 22.5 222.4Proseed 1396 96 22.1 221.9NuTech/G2 Genetics 5F‐198™ 98 22.3 220.7Wensman Seed W 90967STXRIB 96 23.8 220.3Thunder 7396 VT2P RIB 96 21.8 220.2Legacy Seeds L‐3844 GENSS 98 22.0 219.6Legacy Seeds L‐3712 VT3PRO 96 23.0 219.4Thunder 101‐97 SS RIB 97 22.1 219.0Peterson Farms Seed 82H99 99 23.5 216.7Legacy Seeds L‐3423 GENSS 94 23.5 216.3Nuseed 9504 VT3P RIB 95 22.7 216.0Legacy Seeds L‐3612 VT3PRO 95 22.0 216.0Peterson Farms Seed 55S96 96 23.4 215.6Peterson Farms Seed 88A97 97 23.5 215.2NuTech 5V‐195 95 22.2 212.4Thunder 101‐95 SS RIB 95 23.5 212.1Stine R9311VT3Pro 94 21.7 211.7Legend Seeds LS 9495 VT3PRIB 95 23.5 211.4NuTech/G2 Genetics 5X‐894™ 94 20.4 210.5NuTech/G2 Genetics 5X‐698™ 98 22.4 208.4NuTech/G2 Genetics 5Y‐196™ 96 20.6 206.7NK N41Y‐3111 98 25.3 205.2Proseed 1295 95 23.8 198.4Mean 22.6 218.2CV (%) 1.8 3.3LSD (0.1) 0.9 10.8

Page 27
For Additional Information: Daniel Kaiser ([email protected]) 612-624-3482
Project Funding Provided by: Minnesota Soybean Research and Promotion Council
Soybean Response to Micronutrients in NW Minnesota
Location: Ada and Gully, MN Fertilizer: Treatments 1) 10 lbs Zinc (Zn) per acre 2) 10 lbs Manganese (Mn) per acre 3) 2 lbs Boron (B) per acre 4) 20 lbs Chloride (Cl) per acre Treatments were compared to a control (no fertilizer) and consisted of all possible combinations of the four micronutrients studied. Phosphorus and Potassium kept at non-limiting levels. Fertilizer was broadcast and incorporated before planting Weed Management: Glyphosate Experimental Design: Randomized complete block design with 4 replications. Yields are reported at 13% grain moisture.
Objective: The purpose of this study was to determine if there is a potential yield response in soybean to selected micro-nutrients applied broadcast before planting.
Experimental Methods: The studies at Ada was laid out using a factorial design. There were sixteen total treatments consisting of one, two, three, or four of the micronutrients applied together. All treatments were hand applied prior to planting and incorporated prior to planting. Trials were established at twelve field locations across Minnesota with six established in 2013 and six in 2014.
Initial soil test results are given in Table 1. Soil phosphorus levels were High to Very High at all sites . Soil potassium ranged from Medium to Very High, and zinc (Zn) ranged from low to high using current interpretations for corn. Soil tests were also run for manganese (Mn), boron (B), and chloride (Cl). There currently are no critical levels for these elements for soybean in Minnesota. Soybeans are responsive to Mn, however, yield responses are typically seen in areas of the country with soils that have been historically deficient in Mn.
Research in Michigan has shown soybean yield increases due to Mn and recommendations exist in that state when soil test levels are less than 24 ppm. Sandy soils with high soil pH have been traditionally responsive to manganese in Michigan. Three locations tested lower than this level. Since there is no clear evidence of past yield responses to Mn in Minnesota, we cannot say that Mn was low. However, the high soil pH and relatively low Mn concentration may
O n - F a r m C r o p p I n g T r I a l s
Year Location County P K Zn Mn B Cl OM pH‐‐%‐‐
2013 Ada Norman 14* 177 0.4 11.0 0.57 10.7 3.7 8.1Lamberton Redwood 13 150 0.9 47.2 0.65 6.3 4.5 5.8Rochester Olmsted 47 143 2.1 34.8 0.27 6.3 2.1 5.8St. Charles Winona 14 105 0.8 48.8 0.27 6.8 3.0 6.7Stewart 1 McLeod 13* 173 1.5 26.5 0.79 6.0 7.3 7.4Stewart 2 McLeod 26 134 1.6 46.6 0.80 6.0 5.2 6.8
2014 Ada Norman 17 368 1.5 7.3 0.99 14.4 6.1 7.4Lamberton Redwood 34 145 1.9 57.0 0.88 3.4 4.4 5.4Rochester 1 Olmsted 25 256 2.8 28.7 0.80 124.5 4.6 6.5Rochester 2 Olmsted 17 161 2.5 33.2 0.43 13.2 2.2 5.9Stewart 1 McLeod 25 179 1.5 14.1 1.09 3.2 6.5 7.7Stewart 2 McLeod 37 172 1.9 31.5 0.91 4.1 4.8 7.0
*Olsen‐P test was used instead of the Bray‐P1
Soil Test
‐‐‐‐‐‐‐‐‐‐‐‐‐‐‐‐‐‐‐‐‐‐‐‐‐‐ppm‐‐‐‐‐‐‐‐‐‐‐‐‐‐‐‐‐‐‐‐‐‐‐‐
Table 1. Initial soil test data for 0‐6" samples collected before treatment application for 2013‐2014 soybean micronutrient studies.
P, Bray‐P1 phosphorus; K, ammonium acetate potassium; Zn, DTPA zinc; Mn, DTPA manganese; B, hot water extracted boron; Mg, amonium acetate extractable magnesium; OM, organic matter loss on ignition; pH, 1:1 soil:water ;na, data not available.not available.

Page 28
Soybean Response to Micronutrients Across Minnesota (continued)
Table 2 summarizes yield data collected from the factorial study. There was no clear evidence of a response to micronutrients at any location. In general, the trend was for slightly lower yields with Zn, B, and Cl at Ada 2013 and most other locations that year.
The only location were there was a significant difference in grain yield was at the site near Rochester in 2013 and Stewart in 2014 where the yield with B was around 2 bu/ac less with the 2 lb application rate compared to the control. The Rochester location was on a sandy soil which likely magnified negative impacts of B application. Stewart was a clay loam soil. Boron toxicity symptoms were noted within the same field for a 5 lb/ac B rate in 2011. It appears that the 2 lb rate may still be too much even in a year where soils were cool and excessively wet early in the growing season.
Soil test values were examined but were not helpful in determining where responses would occur. In-fact, the large variation in soil test values and no evidence of a yield response calls into question the value of micronutrient soil tests for use in soybean.
Tissue analysis was also conducted but the data has not yet been returned from the lab for 2014. Plant tissue data from 2013 is not shown but application of boron, zinc, and chloride increase concentration of the respective elements in both trifoliate leaf tissue collected at R2 and in grain nutrient concentration. Tissue nutrient concentration indicates that the micros are being taken up by soybean but are not needed for increasing soybean grain yield.
2-Year Summary
There was no yield advantage for applying Zn, Mn, B, or Cl to soybean.
The lack of response was consistent among locations and for the yield average across locations and years.
The potential effect of the climatic conditions at individual locations may have limited potential for determining treatment differences.
Soil tests did not aid in the determination of where micronutrient deficiencies may occur.
0 10 0 10 0 2 0 20
Ada 2013 25.1a 24.4a 26.8a 26.8a 27.1a 26.5a 28.1a 25.4a
Ada 2014 37.5a 38.7a 37.1a 39.0a 37.5a 38.7a 38.1a 38.1a
Twelve Site Average
42.9a 42.7a 42.8a 42.8a 42.9a 42.8a 43.0a 42.7a
‐‐‐‐‐‐‐‐‐‐‐‐‐‐‐‐‐‐‐‐‐‐‐‐‐‐‐‐‐‐‐‐‐‐‐‐‐‐‐‐‐‐bu/ac‐‐‐‐‐‐‐‐‐‐‐‐‐‐‐‐‐‐‐‐‐‐‐‐‐‐‐‐‐‐‐‐‐‐‐‐‐‐‐‐‐‐
*numbers followed by the same letter are not significantly different at P<0.10
Table 2. Soybean Gain yield Summary of a micronutrient study conducted near Ada, MN and the average yield across twelve locations studied across MN from 2013‐2014.
Zn Rate (lbs/ac) Mn Rate (lbs/ac) B Rate (lbs/ac) Cl Rate (lbs/ac)

Page 29
For Additional Information: Randy Nelson
Project Funding Provided by: Thanks to Jim Cameron, Northwest Research and
Outreach Center, Crookson, MN, for assistance with threshing and quality analysis.
Yield and Quality of Organically Grown Soybean Treated With a Plant Stimulant— Clay County
O n - F a r m C r o p p I n g T r I a l s
Cooperator: Lynn Brakke Organic Farms Nearest Town: Comstock, MN
Soil Type: Fargo Silty Clay Spring Tillage: One pass with a field cultivatorPrevious Crop: Corn Planting Date: 5/29/2014
Variety: Sheyenne Row Width: 22 inches
Planting Population: 200,000 Harvest Date: 10/1/14
Experimental Design: Randomized Complete block with four replicates
Purpose of Study: Evaluate Dakota REV™ CPF 6000 on soybean yield and quality in an organic production system.
Materials and Methods: Dakota REV™ CPF 6000 was applied in-furrow to soybean using a John Deere 7300 Vacuum Planter. All plots except untreated check received product at one or two quarts per acre. Field plots were 18 rows wide and 30 feet long. Stand counts were taken on middle two rows (rows 9 and 10) on 11 June and 1 October. Five plants per plot were harvested on 1 October, from row 8 or 11, to determine pod count and 100 seed weight. At harvest, ten feet of row was collected from the middle two rows of each plot and used to determine yield and quality. Soybean yield was adjusted to 13% moisture.
Results:There was no significant difference between treatments for stand counts taken on 11 June and 1 October (data not shown). There was no significant difference between treatments for yield, protein, oil, pod count, or hundred seed weight (table 1).
Table 1. Yield, quality, pod count, and seed weight from organically grown soybean treated with Dakota REV™ CPF 6000. Comstock, MN, 2014.
Treatment Yield(bu/ac)
Protein(%)
Oil(%)
Untreated check 31.7 33.4 18.2
Dakota REV™ CPF 6000 1 qt/a 32.9 33.2 18.2
Dakota REV™ CPF 6000 2 qt/a 33.7 33.3 18.2
Pod count (number/plant)
27.0
22.9
22.9
100 seed weight (g)
13.0
13.4
12.7
LSD 0.05 = NS NS NS NS NS

Page 30
For Additional Information: Dr. Jim Orf, Art Killam, and Phillip Glogoza
Project Funding Provided by: MN Soybean Research and Promotion Council
Soybean Variety Evaluations by UMN Soybean Breeding Project—NW MN
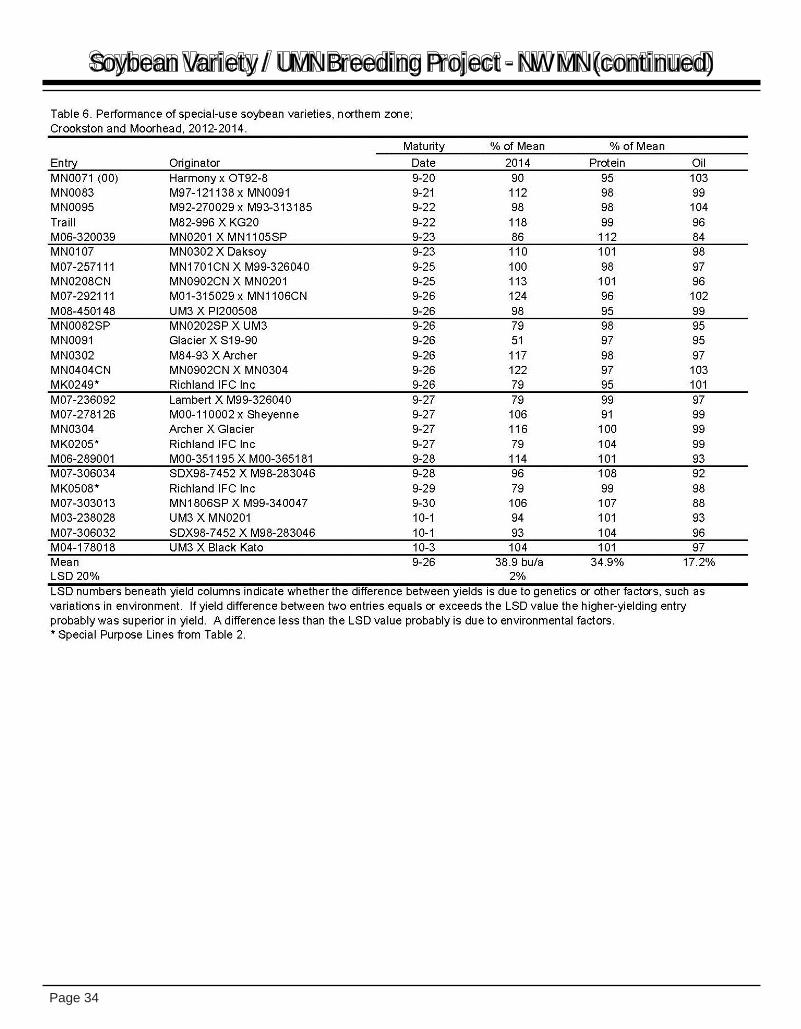
Purpose of Study: Each year Minnesota Agricultural Experiment Station scientists conduct performance tests of appropriately adapted public and private soybean entries. Companies are charged a fee for each entry they enter to partially cover the costs of conducting these tests. A stipulation of the testing program is that the company is marketing or intends to begin marketing the entry in the next growing season. This information is also available electronically at the websites:
http://www.maes.umn.edu/Research/Crop_Variety_Trials/Soybean/index.htm
www.mnsoybean.org
Presented in this brief report are the results from northwest Minnesota and do not reflect the entire results of the statewide varietal trials. The results provided are from the locations of Roseau, Crookston, Thief River Falls, Shelly, and Moorhead for standard evaluation. There are results for Soybean cyst nematode varietal evaluations from Gary and Mahnomen. A third site was lost due to herbicide spray drift prematurely terminating the growing plants.
There will be additional information included in the final and full report published by the Minnesota Agricultural Experiment Station which can be accessed at the link provided above.
Results:
YieldBecause maturity is a very important attribute, entries are arranged in the tables in order of their actual or estimated 2014 calendar date of maturity and not yield performance. Later-maturing entries usually can be expected to have higher yields than earlier maturing types. If you wish to correctly compare yields, do so only between entries with similar calendar dates of maturity, usually within 3 to 5 days. More reliable comparisons can be made using yields from several consecutive years. All yield determinations were made from replicated tests harvested with a plot combine.
The yield information is presented as a percent of the mean of the test. The actual mean value is given at the bottom of each table. Values over 100 indicate the entry had a yield greater than the mean while those less than 100 have a yield less than the mean. LSD values associated with data in these tables are measures of variability within the trials. The LSD numbers beneath the yield columns indicate whether the difference between yields is due to genetics or other factors, such as variations in the environment. If yield differences between two entries equals or exceeds the LSD value, the higher yielding entry probably was superior in yield. A difference less than the LSD value is probably due to environmental factors. The LSD values are given on the percent of mean data, not the actual yields. A 20% level of significance is used in all these tables. This means that yield differences exceeding the stated LSD value are real 80% of the time.
O n - F a r m C r o p p I n g T r I a l s

Page 31
For Additional Information: Insert names here
Soybean Variety / UMN Breeding Project - NW MN (continued)

Page 32
For Additional Information: Insert names here
Soybean Variety / UMN Breeding Project - NW MN (continued)

Page 33
For Additional Information: Insert names here
Soybean Variety / UMN Breeding Project - NW MN (continued)
Page 34
For Additional Information: Insert names here
Soybean Variety / UMN Breeding Project - NW MN (continued)

Page 35
For Additional Information: Insert names here
Soybean Variety / UMN Breeding Project - NW MN (continued)

Page 36
For Additional Information: Jerry Buckley, Howard Person, and Nathan Jonhnson, Univ. of MN Extension
Funding provided by Minnesota Soybean Growers Association. Seed was provided by Asgrow-Dekalb. Thanks to Grant Mehring at NDSU for assistance with Statistical analysis.
Soybean Seeding Rate x Planting Date x Seed Treat
Locations: East Grand Forks, MN (Polk Co.), Hendrum, MN (Norman Co.), Barnesville, MN (Clay Co.) and Newfolden, MN (Marshall Co.) Plot Layout: Soybeans were planted at 2 different planting dates using a split plot design
Objectives: Evaluate soybean response to different populations at different planting dates with and without a seed treatment. Seeding rates were between 75000 and 200000 Live Seeds Per Acre at intervals of 25000. All populations were planted with and without a seed treat. Planting dates for the “Early” Planting Date were between May 21 and May 28. The planting Date for the “Late” Treatment was June 25.
Results: Planting date had a significant affect on yield.
Seeding Rate had a significant effect
on yield There was also a significant interaction
between planting date and population. Seed Treatment produced no
significant effect on yield at any location or across 4 locations.
O n - F a r m C r o p p I n g T r I a l s
Seeding Rate x Planting Date Seeding Rate Early Late
75,000 40.294 30.3947 100,000 36.1565 30.9491 125,000 36.6074 33.1783 150,000 39.0544 33.9605 175,000 41.0598 33.518 200,000 37.9133 35.5689
Mean 35.72124167 CV 5.321763498 LSD 4.304307
Seeding Rate Across Planting Dates Seeding Rate Yield (Bu/Acre)
75000 35.3443 100000 33.5528 125000 34.8929 150000 36.5074 175000 37.2889 200000 36.7411
Mean 35.79662 CV 3.786670362 LSD 2.2495375
25
27
29
31
33
35
37
39
41
43
0 50,000 100,000 150,000 200,000 250,000
Early
Late
Mean
Yiel
d (Bu
/Acr
e)
Seeding Rate (Live Seeds/Acre)
Planting Date X Seeding Rate

Page 37
For Additional Information: Howard Person and Jerry Buckley, UMN Extension Brian Zimprich and Alicia Harstad, NDSU Extension Service
Project Funding Provided by: Minnesota Soybean Research and Promotion Council
North Dakota Soybean Council
Coordinated County Variety and Research Trials — NW Region
Purpose of Study: The data presented here is part of a coordinated effort by MN County Soybean Grower to evaluate regional varieties in multiple locations by maturity group.
Associations, ND County Crop Improvement Associations, U of MN Extension and NDSU and to expand the amount of research information that soybean growers have access to in NW Minnesota and SE North Dakota. These trials are funded by Minnesota & North Dakota Soybean Check-off and entry fees are paid by seed companies.
There were a total of 12 locations across MN and ND that participated in this coordinated effort: Nine were MN soybean county associations and three were ND county crop improvement associations. In Minnesota, each trial location had additional research trials on either plant populations and micro nutrients or fungicides.
About This Variety Plot Trial: The County Soybean Variety Plots are randomized small plot trials. They utilized three replicated blocks in each location. The soybean plots were planted with a Haldrup small plot cone planter and harvested with a small plot Zurn combine. For weed control, the plots were sprayed with glyphosate by the farmer-cooperator using commercial size equipment, utilizing driving lanes through the plots.
Data Interpretation: Statistics are a mathematical tool used to summarize and interpret groups of numbers. In these tables we used a LSD (least significant difference) test to determine if differences in yield are due to genetic differences between varieties or due to other causes such as variability in soil type or fertility, or other environmental factors.
If the difference between two varieties exceeds the LSD value, it means that with 80 percent probability, the higher yielding variety is significantly different in yield. If the difference between two varieties is less than the LSD value, then the variety yields are considered the same. The LSD number is also a measure of variability within a trial and a large number indicates there is more variability in a location compared to a location with a small LSD number.
Coefficient of Variation (CV) is an indicator of how much variability there was within the soybean trial location (uneven seeding rate, emergence, insect damage, disease, soil type etc.) that was not due to any effect of the varieties. A CV of less than 15 indicates a very uniform trial site. Therefore, differences in soybean yields are the result of varieties rather than other external factors.
County Collaborators: Howard Person, U of MN Extension Educator, Marshall & Pennington Counties; Jerry Buckley, U of MN Extension Educator, Norman & Mahnomen Counties; Brian Zimprich, NDSU Extension Agent, Ransom County; NDSU Extension Agent, Steele County and Alicia Harstad, NDSU Extension Agent, Steele County.
(In this publication, all yields are adjusted to 13% moisture.)
O n - F a r m C r o p p I n g T r I a l s

Page 38
MinnesotaBecker/Mahnomen Counties:Bill Zurn, Chair, Callaway, MN [email protected] Klabunde, Vice Chair, Waubun, MN [email protected] Jirava, Secretary, Ogema, MN [email protected] Zurn, Treasurer/MSGA State Delegate, Callaway, MN [email protected] Hoekstra, Crop Research Coordinator, Mahnomen, MN [email protected] Cooperator/Location: Duane Pazdernik, Waubun, MNPlanting Date: May 23, 2014 Harvest Date: October 7, 2014
Clay/Wilkin Counties:Preston Dagen, Chairman/Plot Coordinator, Lake Park, MN [email protected] Swanson, Vice Chair, Moorhead, MN [email protected] Janssen, Secretary/Treasurer, Barnesville, MN [email protected] Arneson, Director, Hawley, MN [email protected] Gilbertson, Director, Moorhead, MN [email protected] Krueger, Director/ MSGA State Delegate, Rothsay, MN [email protected] Petermann, Director, Hawley, MN [email protected]/Location: Nate Thompson, Barnesville, MNPlanting Date: May 24, 2014 Harvest Date: October 9, 2014 Kittson County:Charles Dziengel, Chairman, Kennedy, MN, [email protected] Wiese, Vice Chairman, Humboldt, MN, [email protected] Theresia Gillie, Secretary-Treasurer/MSGA State Delegate, Hallock, MN [email protected] Mortenson, Director, Kennedy, MN, [email protected] Dziengel, Plot Coordinator, Kennedy, MN, [email protected]/Location: Gillie Farms, Hallock, MNPlanting Date: May 29, 2014 Harvest Date: October 8, 2014
Marshall County:Cecil Deschene, Chairman/MSGA State Delegate, Argyle, MN [email protected] Gornowicz, Vice Chairman, Warren, MNDenise Olson, Secretary/Treasurer, Warren, MN [email protected] Liedberg, Director & Alternate State Delegate, Newfolden, MN [email protected] Olson, Plot Coordinator, Warren, MN, [email protected]/Location: Rodney Liedberg, Newfolden, MNPlanting Date: May 27, 2014 Harvest Date: October 11, 2014
Norman County:Corey Hanson, Chairman/MSGA State Delegate, Gary, MN [email protected] Gilbertson, Vice Chairman, Shelly, MN [email protected] Swenson, Secretary, Shelly, MN [email protected] Brandt, Treasurer, Ada, MN [email protected] Hest, Director, Perley, MN [email protected]/Location: Bryan Hest, Perley, MNPlanting Date: May 25, 2014 Harvest Date: October 15, 2014
Otter Tail/Grant Counties:Brian Kjesbo, Chair, Ashby, MN [email protected] Rogness, Treasurer, Fergus Falls, MN [email protected] Blume, Secretary/MSGA Director, Elbow Lake, MN [email protected] Rosholl, Vice Chair, Erhard, MN Tony Endreson, Promotion/Membership/Scholarship, Wendell, MN [email protected] Holen, Fergus Falls, MN [email protected] Shores, Industry Rep/Promotion/Membership, Ashby, MN [email protected]/Location: Mike Flint, Elbow Lake, MNPlanting Date: May 24, 2014 Harvest Date: October 9, 2014
Pennington/Red Lake Counties:Kyle Mehrkens, President, Thief River Falls, MN [email protected] Tom Scholin, Vice President, Thief River Falls, MN [email protected]
Pennington/Red Lake Counties cont’d: Darin Asp, Secretary, Thief River Falls, MN [email protected] Novak, Treasurer, St. Hilaire, MN [email protected] Amiot, Director/MSGA State Delegate, Red Lake Falls, MN [email protected] Knutson, Plot Coordinator, Red Lake Falls, MN [email protected]/Location: Kyle Mehrkens, Thief River Falls, MNPlanting Date: May 28, 2014 Harvest Date: October 11, 2014
Polk County:Greg LeBlanc, Chairman, Crookston, MN [email protected] Olson, Vice Chairman, Fosston, MN [email protected] Solheim, Secretary/Treasurer, Crookston, MN [email protected] Skaug, MSGA State Delegate, Beltrami, MN [email protected] Person, Plot Coordinator, Thief River Falls, MN [email protected] Krueger, Membership, East Grand Forks, MN [email protected] Cooperator/Location: Matthew Krueger, East Grand Forks, MNPlanting Date: May 23, 2014 Harvest Date: October 2, 2014
Roseau/Lake of the Woods Counties:Jason Smith, President, Badger, MN [email protected] Stuart Eeg, Director, Greenbush, MN [email protected] Parsley, Director/MSRPC District 1 Rep, Warroad, MN [email protected] Brateng, Secretary/Treasurer, Roseau, MN [email protected] Kukowski, Vice President/MSGA State Delegate, Strathcona, MN [email protected] Cooperator/Location: Bill Bendickson, Warroad, MNPlanting Date: May 28, 2014 Harvest Date: October 10, 2014
North DakotaSteele CountySteele County Crop and Livestock Improvement AssociationAlicia Harstad, Steele County ExtensionCooperator/Location: Brandon Roller, Hope, NDPlanting Date: May 22, 2014 Harvest Date: October 9, 2014
Ransom CountyRansom County Crop Improvement and Livestock AssociationBrian Zimprich, Ransom County ExtensionCooperator/Location: Tim Huether, Lisbon, NDPlanting Date: May 22, 2014 Harvest Date: October 10, 2014
Cass CountyCooperator/Location: NDSU Prosper Research Farm, Prosper, NDPlanting Date: May 29, 2014 Harvest Date: October 8, 2014
Coordinated NW MN County Soybean Board of Directors, ND Crop Improvement Officers/Directors & Plot Information
Tractor provided by Valley Plains Equipment.We thank you!

Page 39
PHYTOPHTHORA ROOT ROT is a destructive soil borne disease that can cause soybean stand loss and reduced plant productivity. The primary means of managing this disease is to plant varieties that are resistant to the pathogen. This is a bit of a ‘cat and mouse’ game since there are over 55 races of this disease and approximately eight single resistance genes, designated as Rps genes that are used in soybean that offer different spectrums of control. Each Rps gene offers control of several races of phytophthora but no gene offers control of all races. The key to managing this disease is to know which Rps gene is used in each soybean field you plant and make an annual evaluation of how well it is performing. For example, if the soybean variety you have chosen has a Rps 1k gene and you plant it in two fields and you notice phytophthora is very low in field A but is pretty noticeable in spots in field B, you want to make field notes to avoid using the Rps 1K gene in field B in future soybean variety selections.
SOYBEAN CYST NEMATODE (SCN) is a highly damaging pest of soybean. Surveys indicate this pest is expanding its range in NW Minnesota and you should be testing your soil to determine if it is present. Crop rotation and planting SCN resistant varieties are the primary means for managing this microscopic roundworm.
SEED TREATMENTS: 1-16: Fungicides / 17-19: Insecticides / 20: Inoculants / 21: Other
Ref #: Treatment Ref #: Treatment Ref #: Treatment
1 Azoxystrobin 8 Mefenoxam 15 Trichoderma harzianum Rifai
2 Bacillus pumilus 9 Metalaxyl 16 Trifloxystrobin
3 Bacillus subtilis 10 Pyraclostrobin 17 Clothianidin
4 Captan 11 Streptomyces griseoviridis 18 Imidacloprid
5 Fludioxonil 12 Streptomyces lydicus 19 Thiamethoxan
6 Ipconazole 13 Thiabendazole 20 Bradyrhizobium japonicum
7 Mancozeb 14 Thiram 21 Other
In the Seed Treatment column on the form: List each of the seed treatments present on the variety. (I.e. If the vari-ety is treated with CruiserMaxx Plus (mefenoxam, fludioxonil, thiamethoxam) you would put 8,5,19 in the box. If the seed treatment list does not include one of the compounds use the number 21.)
Characteristics of Soybean Varieties and Variety Placement Across Zones
Phytophthora
Ref #: Gene:
1 Rps 1a
2 Rps 1b
3 Rps 1c
4 Rps 1k
5 Rps 3
6 Rps 4
7 Rps 6
SCN Trait:
Ref #: Trait
1 PI88788
2 Peking
3 Other
Company VarietyRelative Maturity
Phytophthora Gene
Seed Treatment(see chart above for reference) SCN Trait
ZONE 1 ZONE 2 ZONE 3 ZONE 4
Hallock Newfolden
Warroad
East Grand Forks
Thief River FallsHope
WaubunAda
Prosper
Elbow Lake
BarnesvilleLisbon
Channel 0507R2 0.5 3 9, 10, 21 1 X
Channel 0508R2 0.5 4 9, 10, 21 X
Channel 0707R2 0.7 4 9, 10, 21 1 X
Channel 0807R2 0.8 3 9, 10, 21 1 X X
Channel 0205R2 0.2 3 9, 10, 21 X
Dahlman Seed Dahlman 52009RR2Y 00.9 3 X
Dahlman Seed Dahlman 5203RR2Y 0.3 5 X X
Dahlman Seed Dahlman 5309NRR2Y 0.9 3 1 X
Dahlman Seed Dahlman 5405NRR2Y 0.5 5 1 X X
Dairyland Seed DSR-0514/R2Y 0.5 4 5, 8, 19 1 X X
Dairyland Seed DSR-0711/R2Y 0.7 4 5, 8, 19 1 X X X
Dairyland Seed DSR-1340/R2Y 1.3 3 5, 8, 19 X
Dairyland Seed DSR-C198/R2Y 00.9 4 5, 8, 19 X
Dairyland Seed DST02-001/R2Y 0.2 4 5, 8, 19 X
Dyna-Gro Seed S04RY55 0.4 3 5, 8, 19, 21 X
Dyna-Gro Seed S06RY24 0.6 4 5, 8, 19, 21 X X
Dyna-Gro Seed S07RY45 0.7 3 5, 8, 19, 21 X X
Dyna-Gro Seed S08RY23 0.8 5 5, 8, 19, 21 X
Dyna-Gro Seed S09RY64 0.9 5, 8, 19, 21 X
Dyna-Gro Seed 34RY03 0.3 3 5, 8, 19, 21 X X
Dyna-Gro Seed S006RY75 00.6 X
Dyna-Gro Seed S007RY44 00.7 3 5, 8, 19, 21 X
Dyna-Gro Seed S008RY43 00.8 3 5, 8, 19, 21 X
Hefty Seed Co H 06Y12 0.6 6, 9, 17 X
Hefty Seed Co H 007R4 00.7 3 6, 9, 17 3, 3 X X
Hefty Seed Co H 008R3 0.8 3 6, 9, 17 3, 3 X X
Hefty Seed Co H 01R4 0.1 3, 5 6, 9, 17 X X
Hefty Seed Co H 02R3 0.2 5 6, 9, 17 X X X
Hyland Seeds HS 01RY02 0.1 4 8, 5, 19 X X
Hyland Seeds 05RYS25 0.5 8, 5, 19 1 X X

Page 40
Company VarietyRelative Maturity
Phytophthora Gene
Seed Treatment(see chart for
reference) SCN Trait
ZONE 1 ZONE 2 ZONE 3 ZONE 4
Hallock Newfolden
Warroad
East Grand Forks
Thief River FallsHope
WaubunAda
Prosper
Elbow LakeBarnesville
Lisbon
Hyland Seeds HS 06RY26 0.6 5, 8, 19 X X X
Hyland Seeds HS 09RYS12 0.9 3, 4 5, 8, 19 1 X X
Hyland Seeds HS 11RY07 1.4 3 5, 8, 19 X
Hyland Seeds HS 15RYS45 1.5 5 5, 8, 19 X
Hyland Seeds HS 006RYS24 00.6 4 5, 8, 19 1 X X
Hyland Seeds HS 007RY32 00.7 3, 4 5, 8, 19 X
Integra Integra 20815N 0.8 3 1,3 X
Integra Integra 20915N 0.9 1, 3 X
Integra Integra 21115N 1.1 4 1,3 X
Legacy Seeds, Inc. LS 0634 RR2 0.6 4 20, 21 1 X X X
Legacy Seeds, Inc. LS 0833 NRR2 0.8 3 20, 21 1 X X
Legacy Seeds, Inc. LS 1134 NRR2 1.1 3 20, 21 1 X
Legacy Seeds, Inc. LS 1314 NRR2 1.3 4 20, 21 1 X
Legacy Seeds, Inc. LS 00834 RR2 00.8 3 20, 21 X
Legacy Seeds, Inc. LS 0134 RR2 0.1 5 20, 21 X X
Legacy Seeds, Inc. LS 0214 RR2 0.2 5 20, 21 X X X
Legacy Seeds, Inc. LS 0334 RR2 0.3 4 20, 21 X X X
Legend Seeds LS 03R22 0.3 5 X X
Legend Seeds LS 06R24N 0.6 4 3 X X
Legend Seeds LS 10R551N 1 3 3 X
Legend Seeds LS 12R24N 1.2 4 3 X
Legend Seeds 02R21 0.2 3 X
Legend Seeds LS 003R21 0.03 3 X
Mycogen 5B033R2 0.3 4 5, 8, 19, 21 X
Mycogen 5B040R2 0.4 5 5, 8, 19, 21 X
Mycogen 5B066R2 0.6 5, 8, 19, 21 X
Mycogen 5B081R2 0.8 4 5, 8, 19, 21 X
Mycogen 5N091R2 0.9 5 5, 8, 19, 21 1 X X
Mycogen 5N122R2 1.2 4 5, 8, 19, 21 1 X
Mycogen X54070NR2 0.7 X
Mycogen 5B012R2 0.1 5, 8, 19, 21 X
Mycogen 5G009R2 00.9 3 5, 8, 19, 21 X
Mycogen X54J009R2 00.9 4 5, 8, 19, 21 X
NorthStar Genetics NS 0096R2 00.9 3 X
NorthStar Genetics NS 0318R2 0.3 5 5, 8, 19 X X
NorthStar Genetics NS 0480NR2 0.2 5 5, 8, 19 1 X X
NorthStar Genetics NS 0537NR2 0.5 5, 8, 19 X
NorthStar Genetics NS 0839NR2 0.8 3 5, 8, 19 1 X X
NorthStar Genetics NS 1040NR2 1.0 3 5, 8, 19 1 X
NorthStar Genetics NS 629NR2 0.6 4 5, 8, 19 1 X
NorthStar Genetics NS 949R2 0.9 5 5, 8, 19 X
NorthStar Genetics NS 0060NR2 00.6 3 5, 8, 19 1 X
NorthStar Genetics NS 0080R2 00.6 3 5, 8, 19 X X
NorthStar Genetics NS 0088R2 00.8 3 5, 8, 19 1 X
NorthStar Genetics NS 0200NR2 0.2 3 5, 8, 19 1 X
NuTech G2 6036 0.3 4 20, 21 X
NuTech G2 6083 0.8 20, 21 X

Page 41
NuTech G2 7104 R2 1.0 4, 7 20, 21 1 X
NuTech G2 6000 0.0 4 20, 21 X X
NuTech G2 6007 00.7 4 X
NuTech G2 6021 0.2 20, 21 X X
Partners Brand Seed Co. PB0351R2 0.3 3 5, 8, 19 1 X
Partners Brand Seed Co. PB00651R2 0.6 3 5, 8, 19 1 X
Partners Brand Seed Co. PB00741R2 0.7 3 5, 8, 19 1 X
Partners Brand Seed Co. PB00941R2 0.9 3 5, 8, 19 1 X X
Partners Brand Seed Co. PB0251R2 0.2 5 5, 8, 19 X X
Peterson Farms Seed 14R06N 0.6 4 9, 10, 21 1 X X
Peterson Farms Seed 14R09N 0.9 9, 10, 21 1 X X
Peterson Farms Seed 14R11N 1.1 4 9, 10, 21 1 X
Peterson Farms Seed 14R13 1.3 5 9, 10, 21 X
Peterson Farms Seed 15R04 0.4 5 9, 10, 21 X
Peterson Farms Seed 15R05N 0.5 5 9, 10, 21 1 X X
Peterson Farms Seed 15R07N 0.7 3 9, 10, 21 1 X
Peterson Farms Seed 15R14N 1.4 3 9, 10, 21 1 X
Peterson Farms Seed 13R03 0.3 5 9, 10, 21 X X
Peterson Farms Seed 14R008 00.8 3 9, 10, 21 X
Peterson Farms Seed 14R02 0.2 3, 5 9, 10, 21 X
Peterson Farms Seed 15R006N 0.7 3 9, 10, 21 1 X
Prairie Brand Seeds PB0240R2 0.2 3 5, 8, 19, 21 X
Prairie Brand Seeds PB-0291R2 0.2 5 5, 8, 19, 21 X
Prairie Brand Seeds PB-0441R2 0.4 5 5, 8, 19, 21 X
Prairie Brand Seeds PB-0598R2 0.5 5 5, 8, 19, 21 1 X
Prairie Brand Seeds PB-00760R2 00.7 X
Prairie Brand Seeds PB-00844R2 00.8 3 5, 8, 19, 21 1 X
Prairie Brand Seeds PB-00950R2 00.9 3 5, 8, 19, 21 X
Prairie Brand Seeds PB-0131R2 0.2 3 5, 8, 19, 21 X
Producers Hybrids 0301R2 0.3 5 5, 8, 19 1 X X
Producers Hybrids 0602NR2 0.6 4 5, 8, 19 1 X X
Proseed 30-60 0.6 3 X
Proseed 30-80 0.8 3 X
Proseed P2 20-30 0.3 5 X
Proseed P2 20-70 0.7 4 X
Proseed P2 20-90 0.9 5 X
Proseed 30-20 0.2 5 X
Proseed 30-70 00.7 3 X
Proseed 30-90 00.9 5 X
Proseed P2 20-80 00.8 3 X
REA Hybrids 64G94 0.4 9, 10, 18 1 X X
REA Hybrids 65G22 0.5 9, 10, 18 X
REA Hybrids 66G14 0.6 4 9, 10, 18 1 X
NuTech G2 6084 R2 0.8 4 20, 21 X X
NuTech G2 6093 0.9 4 20, 21 X X
NuTech G2 6134 1.4 3 20, 21 X
NuTech G2 7063 0.6 4 20, 21 2 X X
Company VarietyRelative Maturity
Phytophthora Gene
Seed Treatment(see chart for
reference) SCN Trait
ZONE 1 ZONE 2 ZONE 3 ZONE 4
Hallock Newfolden
Warroad
East Grand Forks
Thief River FallsHope
WaubunAda
Prosper
Elbow LakeBarnesville
Lisbon
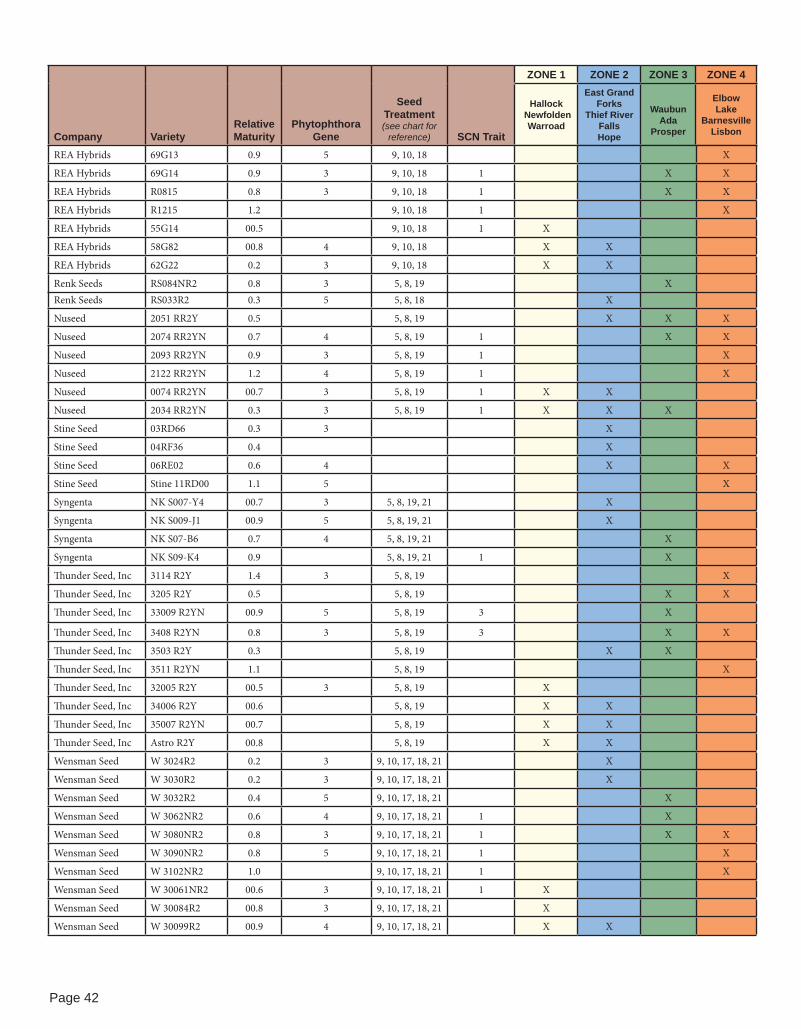
Page 42
Company VarietyRelative Maturity
Phytophthora Gene
Seed Treatment(see chart for
reference) SCN Trait
ZONE 1 ZONE 2 ZONE 3 ZONE 4
Hallock Newfolden
Warroad
East Grand Forks
Thief River FallsHope
Waubun
AdaProsper
Elbow Lake
BarnesvilleLisbon
Renk Seeds RS033R2 0.3 5 5, 8, 18 X
Nuseed 2051 RR2Y 0.5 5, 8, 19 X X X
Nuseed 2074 RR2YN 0.7 4 5, 8, 19 1 X X
Nuseed 2093 RR2YN 0.9 3 5, 8, 19 1 X
Nuseed 2122 RR2YN 1.2 4 5, 8, 19 1 X
Nuseed 0074 RR2YN 00.7 3 5, 8, 19 1 X X
Nuseed 2034 RR2YN 0.3 3 5, 8, 19 1 X X X
Stine Seed 03RD66 0.3 3 X
Stine Seed 04RF36 0.4 X
Stine Seed 06RE02 0.6 4 X X
Stine Seed Stine 11RD00 1.1 5 X
Syngenta NK S007-Y4 00.7 3 5, 8, 19, 21 X
Syngenta NK S009-J1 00.9 5 5, 8, 19, 21 X
Syngenta NK S07-B6 0.7 4 5, 8, 19, 21 X
Syngenta NK S09-K4 0.9 5, 8, 19, 21 1 X
Thunder Seed, Inc 3114 R2Y 1.4 3 5, 8, 19 X
Thunder Seed, Inc 3205 R2Y 0.5 5, 8, 19 X X
Thunder Seed, Inc 33009 R2YN 00.9 5 5, 8, 19 3 X
Thunder Seed, Inc 3408 R2YN 0.8 3 5, 8, 19 3 X X
Thunder Seed, Inc 3503 R2Y 0.3 5, 8, 19 X X
Thunder Seed, Inc 3511 R2YN 1.1 5, 8, 19 X
Thunder Seed, Inc 32005 R2Y 00.5 3 5, 8, 19 X
Thunder Seed, Inc 34006 R2Y 00.6 5, 8, 19 X X
Thunder Seed, Inc 35007 R2YN 00.7 5, 8, 19 X X
Thunder Seed, Inc Astro R2Y 00.8 5, 8, 19 X X
Wensman Seed W 3024R2 0.2 3 9, 10, 17, 18, 21 X
Wensman Seed W 3030R2 0.2 3 9, 10, 17, 18, 21 X
Wensman Seed W 3032R2 0.4 5 9, 10, 17, 18, 21 X
Wensman Seed W 3062NR2 0.6 4 9, 10, 17, 18, 21 1 X
Wensman Seed W 3080NR2 0.8 3 9, 10, 17, 18, 21 1 X X
Wensman Seed W 3090NR2 0.8 5 9, 10, 17, 18, 21 1 X
Wensman Seed W 3102NR2 1.0 9, 10, 17, 18, 21 1 X
Wensman Seed W 30061NR2 00.6 3 9, 10, 17, 18, 21 1 X
Wensman Seed W 30084R2 00.8 3 9, 10, 17, 18, 21 X
Wensman Seed W 30099R2 00.9 4 9, 10, 17, 18, 21 X X
REA Hybrids 69G13 0.9 5 9, 10, 18 X
REA Hybrids 69G14 0.9 3 9, 10, 18 1 X X
REA Hybrids R0815 0.8 3 9, 10, 18 1 X X
REA Hybrids R1215 1.2 9, 10, 18 1 X
REA Hybrids 55G14 00.5 9, 10, 18 1 X
REA Hybrids 58G82 00.8 4 9, 10, 18 X X
REA Hybrids 62G22 0.2 3 9, 10, 18 X X
Renk Seeds RS084NR2 0.8 3 5, 8, 19 X

Page 43
Top 1/3 of Yield Range by location
Mid 1/3 of Yield Range by location
Bottom 1/3 of Yield Range by location
Top 1/3 of Yield Range by location
Mid 1/3 of Yield Range by location
Bottom 1/3 of Yield Range by location
Zone 1 - Hallock, Newfolden, Warroad - EARLY Maturity
Company VarietyRelative Maturity
Hallock Yield (bu/A)
Newfolden Yield (bu/A)
Warroad Yield (bu/A)
Average Across Locations
(bu/A)
Zone 1 - Hallock, Newfolden, Warroad - LATE Maturity
Company VarietyRelative Maturity
Hallock Yield (bu/A)
Newfolden Yield (bu/A)
Warroad Yield (bu/A)
Average Across Locations
(bu/A)
Legend Seeds, Inc LS 003R21 00.3 58.2 43.6 22.7 40.9
Legend Seeds, Inc LS 003R24N 00.3 52.6 44.1 35.5 44.1
Legend Seeds, Inc LS 005R24 00.5 57.6 45.1 40.7 47.7REA Hybrids 53G32 00.3 48.1 44.0 32.0 41.4REA Hybrids 55G14 00.5 56.9 45.8 35.5 46.1Thunder Seed, Inc 32005 R2Y 00.5 47.9 43.9 22.3 38.0 Mean 53.6 44.4 31.5 43.0 CV 3.1 4.7 12.5 15.7 LSD 0.2 2.9 4.0 (NS) 7.6 5.0
Top 1/3 58.2 - 54.8 45.8 - 45.1 40.7 - 34.6 47.7 - 44.5 Mid 1/3 54.7 - 51.4 45.0 - 44.4 34.5 - 28.5 44.4 - 41.3
Bottom 1/3 51.3 - 47.9 44.3 - 43.6 28.4 - 22.3 41.2 - 38.0
Channel 0205R2 0.2 55.8 47.4 33.7 45.6Dairyland Seed DSR-C918/R2Y 00.9 57.8 34.2 39.7 43.9Dairyland Seed DST02-001/R2Y 0.2 54.6 33.6 36.7 41.5Dyna-Gro Seed 34RY03 0.3 59.4 52.4 46.3 52.7Hefty Seed Co H 01R4 0.1 60.0 43.3 36.6 46.6Hefty Seed Co H 02R3 0.2 57.4 33.0 40.0 43.2Legacy Seeds, Inc. LS 0134 RR2 0.1 59.3 40.3 40.8 46.8Legacy Seeds, Inc. LS 0214 RR2 0.2 62.1 41.4 38.0 47.2Legacy Seeds, Inc. LS 0334 RR2 0.3 59.3 39.6 40.0 46.2Legend Seeds, Inc LS 02R21 0.2 57.6 47.7 40.5 48.6Mycogen 5B012R2 0.1 53.1 42.2 41.3 45.5Mycogen 5G009R2 00.9 56.7 48.8 39.6 48.4Mycogen X54J009R2 00.9 57.4 40.4 37.1 45.0Northstar Genetics NS 0200NR2 0.2 52.4 40.3 34.3 42.3Nuseed 2034 RR2YN 0.3 59.1 47.3 35.1 47.2NuTech G2 6000 0.0 49.8 36.2 30.9 38.9NuTech G2 6021 0.2 55.4 37.0 35.6 42.6Partners Brand Seed Co PB00941R2 00.9 52.0 37.5 34.0 41.2Partners Brand Seed Co PB0251R2 0.2 58.0 42.9 45.5 48.8Peterson Farms Seed 13R03 0.3 58.0 43.9 44.5 48.8Peterson Farms Seed 14R02 0.2 55.7 41.0 38.6 45.1Prairie Brand Seeds PB-00950R2 00.9 55.7 39.1 44.5 46.4Prairie Brand Seeds PB0240R2 0.2 58.0 46.0 37.6 47.2Wensman Seed W 30099R2 00.9 57.2 46.1 41.6 48.3 Mean 56.7 41.7 38.9 45.8 CV 4.0 8.7 9.0 12.8
LSD 0.2 3.1 4.4 5.4 3.6
Top 1/3 62.1 - 58.0 52.4 - 45.9 46.3 - 42.1 52.7 - 48.1
Mid 1/3 57.9 - 53.9 45.8 - 39.4 42.0 - 37.9 48.0 - 43.5
Bottom 1/3 53.8 - 49.8 39.3 - 33.0 37.8 - 33.7 43.4 - 38.9

Page 44
Project Funding provided in part by:
Zone 1 - Hallock, Newfolden, Warroad - MID Maturity
Company VarietyRelative Maturity
Hallock Yield (bu/A)
Newfolden Yield
(bu/A)Warroad Yield
(bu/A)
Average Across Locations
(bu/A)
Top 1/3 of Yield Range by location
Mid 1/3 of Yield Range by location
Bottom 1/3 of Yield Range by location
Dyna-Gro Seed S006RY75 00.6 55.1 47.0 34.8 45.7Dyna-Gro Seed S007RY44 00.7 53.7 50.1 38.5 47.5Dyna-Gro Seed S008RY43 00.8 55.8 47.7 43.1 48.9Hefty Seed Co H 007R4 00.7 53.9 44.4 33.7 44.0Hefty Seed Co H 008R3 00.8 59.0 45.7 31.5 45.4Hyland Seeds HS 006RYS24 00.6 52.1 51.3 32.8 45.4Hyland Seeds HS 007RY32 00.7 52.2 48.5 31.5 44.1Integra 20031 00.7 59.9 44.7 39.3 48.0Integra 20076N 00.7 54.0 45.3 33.8 44.4Legacy Seeds, Inc. LS 00834 RR2 00.8 52.3 43.8 33.7 43.3Northstar Genetics NS 0060NR2 00.6 52.3 43.0 36.9 44.1Northstar Genetics NS 0080R2 00.6 57.7 44.7 34.6 45.7Northstar Genetics NS 0088R2 00.8 56.1 44.0 33.0 44.4Nuseed 0074 RR2YN 00.7 48.5 41.2 36.3 42.0NuTech G2 6007 00.7 54.7 50.8 35.0 46.8Partners Brand Seed Co. PB00651R2 00.6 49.8 48.3 39.7 45.9Partners Brand Seed Co. PB00741R2 00.7 56.2 43.9 31.7 43.9Peterson Farms Seed 14R008 00.8 51.1 50.4 38.4 46.6Peterson Farms Seed 15R006N 00.7 49.6 40.1 32.9 40.9Prairie Brand Seeds PB-00766R2 00.7 48.3 41.2 42.6 44.1Prairie Brand Seeds PB-00844R2 00.8 58.9 55.5 35.4 50.0Proseed 30-07 00.7 57.0 41.2 26.4 41.5Proseed P2 10-08 00.8 61.9 45.6 39.2 48.9Proseed P2 11-07 00.7 59.7 47.6 37.7 48.3Proseed P2 20-08 00.8 58.5 51.9 38.9 49.7REA Hybrids 58G82 00.8 53.9 47.9 36.8 46.2Thunder Seed, Inc 34006 R2Y 00.6 56.3 45.5 37.8 46.5Thunder Seed, Inc 35007 R2YN 00.7 50.9 41.6 34.7 42.4Thunder Seed, Inc Astro R2Y 00.8 62.1 56.3 43.2 53.9Wensman Seed W 30061NR2 00.6 54.1 48.9 34.7 45.9Wensman Seed W 30084R2 00.8 51.7 55.8 42.3 49.9
Mean 54.8 46.9 36.2 45.9
CV 4.4 7.5 8.0 12.5
LSD 0.2 4.0 5.0 4.9 3.6
Top 1/3 62.1 - 57.5 56.3 - 50.9 43.2 - 37.4 53.9 - 49.6
Mid 1/3 57.4 - 52.9 50.8 - 45.5 37.3 - 31.8 49.5 - 45.3
Bottom 1/3 52.8 - 48.3 45.4 - 40.1 31.7 - 26.4 45.2 - 40.9

Page 45
County Soybean Variety Trial Locations
Zone 2 - Thief River Falls, East Grand Forks, Hope - EARLY Maturity
Company VarietyRelative Maturity
East Grand Forks Yield
(bu/A)
Thief River Yield
(bu/A)Hope Yield
(bu/A)
Average Across Locations
(bu/A)Hefty Seed Co H 007R4 00.7 52.9 44.1 28.3 41.8
Hefty Seed Co H 008R3 00.8 49.8 45.0 30.0 41.6Hyland Seeds HS 006RYS24 00.6 44.8 46.6 31.3 40.9Northstar Genetics NS 0080R2 00.6 49.6 44.2 31.0 41.6Nuseed 0074 RR2YN 00.7 47.0 42.0 27.2 38.0Proseed 30-07 00.7 49.9 47.4 26.0 39.7REA Hybrids 58G82 00.8 57.5 40.2 26.8 43.6Syngenta NK S007-Y4 00.7 43.1 39.8 30.0 37.6Thunder Seed, Inc 34006 R2Y 00.6 52.3 42.4 29.5 41.4Thunder Seed, Inc 35007 R2YN 00.7 46.8 47.3 27.4 40.5Thunder Seed, Inc Astro R2Y 00.8 53.4 53.9 37.4 48.3
Mean 49.7 44.8 29.5 41.4
CV 5.4 9.3 10.8 15.3
LSD 0.2 5.0 6.7 (NS) 6.0 (NS) 3.5
Top 1/3 57.5 - 52.7 53.9 - 49.2 37.4 - 33.6 48.3 - 44.7
Mid 1/3 52.6 - 47.9 49.1 - 44.5 33.5 - 29.8 44.6 - 41.1
Bottom 1/3 47.8 - 43.1 44.4 - 39.8 29.7 - 26.0 41.0 - 37.6
Top 1/3 of Yield Range by location
Mid 1/3 of Yield Range by location
Bottom 1/3 of Yield Range by location
Zone 1
Zone 2
Zone 3
Zone 4

Page 46
Project Funding provided in part by:
Zone 2 - Thief River Falls, East Grand Forks, Hope - LATE Maturity
Company VarietyRelative Maturity
East Grand Forks Yield
(bu/A)
Thief River Yield
(bu/A)Hope Yield
(bu/A)
Average Across Locations
(bu/A)
Top 1/3 of Yield Range by location
Mid 1/3 of Yield Range by location
Bottom 1/3 of Yield Range by location
Channel 0507R2 0.5 39.4 58.0 36.6 44.6
Channel 0508R2 0.5 47.3 51.7 37.0 45.3Dairyland Seed DSR-0514/R2Y 0.5 63.1 52.3 36.1 50.5Dairlyland Seed DSR-0711/R2Y 0.7 51.6 56.7 39.5 49.3
Dyna-Gro Seed S04RY55 0.4 47.7 60.8 39.9 49.5
Dyna-Gro Seed S06RY24 0.6 57.3 54.4 40.4 50.7
Dyna-Gro Seed S07RY45 0.7 62.3 55.3 41.9 53.2
Hyland Seeds HS 05RYS25 0.5 54.1 59.5 39.1 50.9
Hyland Seeds HS 06RY26 0.6 57.4 49.4 46.6 51.1
Integra 20456 0.4 53.6 52.8 38.1 48.2
Legacy Seeds, Inc. LS 0634 NRR2 0.6 55.1 49.7 41.0 48.6
Mycogen 5B040R2 0.4 58.8 52.1 44.7 51.9
Mycogen X54070NR2 0.7 54.5 60.8 43.1 52.8
Nuseed 2051 RR2Y 0.5 57.0 54.5 47.5 53.3
NuTech G2 7063 0.6 55.8 50.1 31.9 45.9
Peterson Farms Seed 14R06N 0.6 53.9 52.5 40.5 49.0
Peterson Farms Seed 15R04 0.4 53.9 49.6 36.7 46.7
Peterson Farms Seed 15R05N 0.5 51.5 48.2 33.5 44.4
Peterson Farms Seed 15R07N 0.7 36.1 56.3 41.1 44.5
Prairie Brand Seeds PB-0291R2 0.4 48.2 57.8 36.5 47.5
Prairie Brand Seeds PB-0441R2 0.5 55.2 47.7 42.6 48.5
Prairie Brand Seeds PB-0598R2 0.5 55.8 48.1 42.5 48.8
Producers Hybrids 0602NR2 0.6 54.5 59.3 38.3 50.7
Proseed P2 11-50 0.5 61.1 52.2 46.8 53.4
REA Hybrids 64G94 0.4 50.4 58.1 46.6 51.7
REA Hybrids 65G22 0.5 51.1 54.1 39.3 48.4Stine Seed 04RF36 0.4 46.9 51.3 38.5 45.5Stine Seed 06RE02 0.6 50.8 52.0 33.7 45.5 Mean 53.0 53.8 40.0 48.9
CV 11.6 5.3 8 10.7 LSD 0.2 10.2 5.2 5.8 NS
Top 1/3 63.1 - 54.1 60.8 - 56.4 47.5 - 42.3 53.4 - 50.4Mid 1/3 54.0 - 45.1 56.3 - 52.0 42.2 - 37.1 50.3 - 47.4
Bottom 1/3 45.0 - 36.1 51.9 - 47.7 37.0 - 31.9 47.3 - 44.4
Project Funding provided in part by:

Page 47
Zone 2 - Thief River Falls, East Grand Forks, Hope - MID Maturity
Company VarietyRelative Maturity
East Grand Forks Yield
(bu/A)
Thief River Yield
(bu/A)Hope Yield
(bu/A)
Average Across Locations
(bu/A)
Top 1/3 of Yield Range by location
Mid 1/3 of Yield Range by location
Bottom 1/3 of Yield Range by location
Project Funding provided in part by:
Dahlman Seed Dahlman 52009RR2Y 00.9 46.7 30.1 30.5 35.8Dahlman Seed Dahlman 5203RR2Y 0.3 59.8 46.2 35.0 47.0Dyna-Gro Seed 34RY03 0.3 48.9 51.0 37.9 46.0Hefty Seed Co H 01R4 0.1 51.3 47.4 32.5 43.7Hefty Seed Co H 02R3 0.2 61.0 49.2 36.3 48.8Hyland Seeds HS 01RY02 0.1 57.9 43.9 31.7 44.5Integra 20126 0.1 56.9 40.9 30.9 42.9Integra 20215 0.2 56.8 46.4 29.9 44.3Legacy Seeds, Inc. LS 0134 RR2 0.1 57.3 50.9 40.4 49.5Legacy Seeds, Inc. LS 0214 RR2 0.2 54.6 48.0 36.1 46.2
Legacy Seeds, Inc. LS 0334 RR2 0.3 66.3 51.9 44.9 54.4
Mycogen 5B033R2 0.3 55.0 51.9 35.1 47.3Northstar Genetics NS 0096R2 00.9 50.4 41.9 33.3 41.8Northstar Genetics NS 0318R2 0.3 58.6 41.1 35.1 44.9Northstar Genetics NS 0480NR2 0.2 57.2 51.7 37.9 48.9Nuseed 2034 RR2YN 0.3 56.9 45.8 38.4 47.0NuTech G2 6000 0.0 54.4 46.2 33.6 44.7NuTech G2 6021 0.2 53.8 49.5 33.0 45.4NuTech G2 6036 0.3 58.2 46.3 33.9 46.3Partners Brand Seed Co PB00941R2 00.9 52.6 40.8 27.4 40.3Partners Brand Seed Co PB0251R2 0.2 58.9 49.1 32.7 46.9Partners Brand Seed Co PB0351R2 0.3 63.6 43.6 33.1 46.8Prairie Brand Seeds PB-0131R2 0.2 60.0 52.7 31.0 47.9
Producers Hybrids 0301R2 0.3 58.5 50.6 42.9 50.4
Proseed 30-20 0.2 57.1 48.8 36.3 47.4
Proseed P2 20-30 0.3 62.4 50.3 36.2 49.6
Renk Seeds RS033R2 0.3 59.5 48.7 36.2 48.1
Stine Seed 03RD66 0.3 59.6 42.1 36.6 46.1
Syngenta NK S009-J1 00.9 51.2 50.3 36.0 45.8
Thunder Seed, Inc 3503 R2Y 0.3 61.0 57.5 37.8 52.1
Wensman Seed W 30099R2 00.9 58.7 44.0 34.6 45.8Wensman Seed W 3024R2 0.2 58.1 49.4 31.6 46.4Wensman Seed W 3030R2 0.2 48.9 38.4 33.6 40.3 Mean 56.7 46.9 34.9 46.2
CV 4.7 4.9 8.7 14.3LSD 0.2 4.6 3.7 4.6 3.5
Top 1/3 66.3 - 59.8 57.5 - 48.4 44.9 - 39.1 54.4 - 48.2Mid 1/3 59.7 - 53.3 48.3 - 39.3 39.0 - 33.3 48.1 - 42.0
Bottom 1/3 53.2 - 46.7 39.2 - 30.1 33.2 - 27.4 41.9 - 35.8

Page 48
Zone 3 - Waubun, Ada, Prosper - EARLY Maturity
Company VarietyRelative Maturity
Waubun Yield (bu/A)
Ada Yield (bu/A)
Prosper Yield (bu/A)
Average Across Locations
(bu/A)
Top 1/3 of Yield Range by location
Mid 1/3 of Yield Range by location
Bottom 1/3 of Yield Range by location
Dahlman Seed 5203RR2Y 0.3 55.1 50.8 57.4 54.5Hefty Seed Co 02R3 0.2 49.8 49.6 60.6 53.3Hyland Seeds HS 01RY02 0.1 40.5 41.4 59.4 46.9Integra 20300 0.3 29.5 48.1 62.6 46.7Legacy Seeds, Inc. 0214 RR2 0.2 26.7 45.9 66.0 46.2Legacy Seeds, Inc. 0334 RR2 0.3 50.1 54.6 65.0 56.7Northstar Genetics 0318R2 0.3 36.3 51.2 56.2 48.1Northstar Genetics 0480NR2 0.2 39.3 54.2 63.0 52.0Nuseed 2034 RR2YN 0.3 43.1 49.3 58.3 50.5Peterson Farms Seed 13R03 0.3 45.4 55.9 55.7 50.1Producers Hybrids 0301R2 0.3 40.4 50.2 61.1 51.6Thunder Seed, Inc 33009 R2YN 00.9 25.3 34.3 53.9 38.1Thunder Seed, Inc 3503 R2Y 0.3 37.6 52.8 58.7 49.7 Mean 39.9 49.1 59.8 49.6
CV 17.1 8.0 5.1 9.7 LSD 0.2 12.4 5.8 5.5 6.2
Top 1/3 55.1 - 45.2 55.9 - 48.7 66.0 - 62.0 56.7 - 50.5Mid 1/3 45.1 - 35.3 48.6 - 41.5 61.9 - 58.0 50.4 - 44.3
Bottom 1/3 35.2 - 25.3 41.4 - 34.3 57.9 - 53.9 44.3 - 38.1

Page 49
Zone 3 - Waubun, Ada, Prosper - LATE Maturity
Company VarietyRelative Maturity
Waubun Yield (bu/A)
Ada Yield (bu/A)
Prosper Yield (bu/A)
Average Across Locations
(bu/A)
Top 1/3 of Yield Range by location
Mid 1/3 of Yield Range by location
Bottom 1/3 of Yield Range by location
Channel 0807R2 0.8 34.2 51.4 62.0 49.2Dyna-Gro Seed S08RY23 0.8 47.8 51.3 58.4 52.5Dyna-Gro Seed S09RY64 0.9 49.3 56.4 65.9 57.2Hyland Seeds HS 09RYS12 0.9 47.7 49.1 64.4 53.7Legacy Seeds, Inc. LS 0833 NRR2 0.8 45.1 50.2 60.6 52.0Legend Seeds, Inc LS 09R23N 0.9 40.7 50.4 62.7 51.3Legend Seeds, Inc LS 10R551N 1.0 41.8 55.3 61.6 52.9Mycogen 5B081R2 0.8 49.1 47.8 50.0 49.0Mycogen 5N091R2 0.9 50.7 53.2 56.7 53.6Northstar Genetics NS 0839NR2 0.8 41.3 40.9 56.3 46.2NuTech G2 6083 0.8 45.6 46.8 56.9 49.8NuTech G2 6084 R2 0.8 36.2 47.4 51.0 44.8NuTech G2 6093 0.9 45.1 48.9 51.1 48.3Peterson Farms Seed 14R09N 0.9 53.8 52.3 60.2 55.4Prairie Brand Seeds PB-0863R2 0.8 45.1 52.5 56.6 51.4Proseed 30-80 0.8 45.1 52.5 70.8 56.1REA Hybrids 69G14 0.9 43.8 54.4 56.2 51.1REA Hybrids R0815 0.8 51.6 54.9 55.0 53.8Renk Seeds RS084R2 0.8 38.8 52.6 58.5 50.0Syngenta NK S09-K4 0.9 46.2 45.4 54.9 48.8Thunder Seed, Inc 3408 R2YN 0.8 48.6 52.2 63.5 54.8Wensman Seed W 3080NR2 0.8 40.8 53.1 58.6 50.8 Mean 44.9 50.9 58.7 51.5
CV 7.4 5.3 6.7 9.0 LSD 0.2 6.1 4.5 6.7 4.4
Top 1/3 53.8 - 47.3 56.4 - 51.2 70.8 - 64.2 57.2 - 53.1 Mid 1/3 47.2 - 40.8 51.1 - 46.0 64.1 - 57.6 53.0 - 49.0
Bottom 1/3 40.7 - 34.2 45.9 - 40.9 57.5 - 51.0 48.9 - 44.8
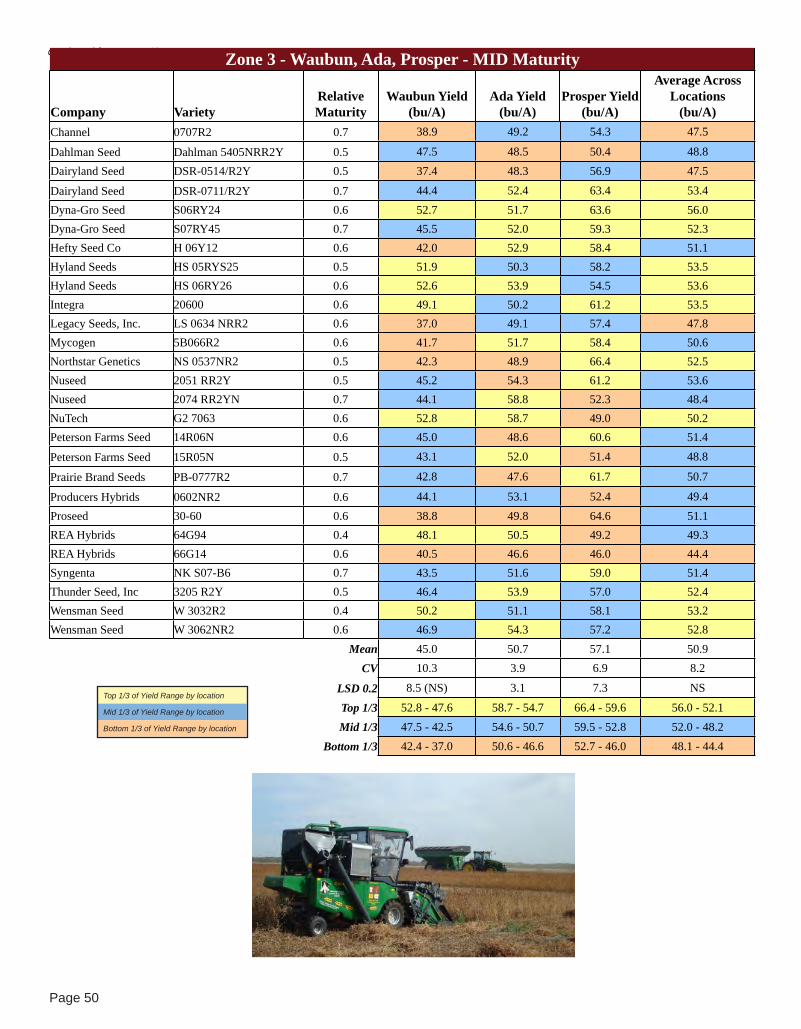
Page 50
continued from page 43 Zone 3 - Waubun, Ada, Prosper - MID Maturity
Company VarietyRelative Maturity
Waubun Yield (bu/A)
Ada Yield (bu/A)
Prosper Yield (bu/A)
Average Across Locations
(bu/A)
Top 1/3 of Yield Range by location
Mid 1/3 of Yield Range by location
Bottom 1/3 of Yield Range by location
Channel 0707R2 0.7 38.9 49.2 54.3 47.5
Dahlman Seed Dahlman 5405NRR2Y 0.5 47.5 48.5 50.4 48.8Dairyland Seed DSR-0514/R2Y 0.5 37.4 48.3 56.9 47.5
Dairyland Seed DSR-0711/R2Y 0.7 44.4 52.4 63.4 53.4Dyna-Gro Seed S06RY24 0.6 52.7 51.7 63.6 56.0Dyna-Gro Seed S07RY45 0.7 45.5 52.0 59.3 52.3Hefty Seed Co H 06Y12 0.6 42.0 52.9 58.4 51.1Hyland Seeds HS 05RYS25 0.5 51.9 50.3 58.2 53.5Hyland Seeds HS 06RY26 0.6 52.6 53.9 54.5 53.6Integra 20600 0.6 49.1 50.2 61.2 53.5Legacy Seeds, Inc. LS 0634 NRR2 0.6 37.0 49.1 57.4 47.8Mycogen 5B066R2 0.6 41.7 51.7 58.4 50.6Northstar Genetics NS 0537NR2 0.5 42.3 48.9 66.4 52.5Nuseed 2051 RR2Y 0.5 45.2 54.3 61.2 53.6Nuseed 2074 RR2YN 0.7 44.1 58.8 52.3 48.4NuTech G2 7063 0.6 52.8 58.7 49.0 50.2Peterson Farms Seed 14R06N 0.6 45.0 48.6 60.6 51.4
Peterson Farms Seed 15R05N 0.5 43.1 52.0 51.4 48.8
Prairie Brand Seeds PB-0777R2 0.7 42.8 47.6 61.7 50.7
Producers Hybrids 0602NR2 0.6 44.1 53.1 52.4 49.4Proseed 30-60 0.6 38.8 49.8 64.6 51.1REA Hybrids 64G94 0.4 48.1 50.5 49.2 49.3REA Hybrids 66G14 0.6 40.5 46.6 46.0 44.4Syngenta NK S07-B6 0.7 43.5 51.6 59.0 51.4Thunder Seed, Inc 3205 R2Y 0.5 46.4 53.9 57.0 52.4Wensman Seed W 3032R2 0.4 50.2 51.1 58.1 53.2Wensman Seed W 3062NR2 0.6 46.9 54.3 57.2 52.8 Mean 45.0 50.7 57.1 50.9
CV 10.3 3.9 6.9 8.2
LSD 0.2 8.5 (NS) 3.1 7.3 NS
Top 1/3 52.8 - 47.6 58.7 - 54.7 66.4 - 59.6 56.0 - 52.1Mid 1/3 47.5 - 42.5 54.6 - 50.7 59.5 - 52.8 52.0 - 48.2
Bottom 1/3 42.4 - 37.0 50.6 - 46.6 52.7 - 46.0 48.1 - 44.4
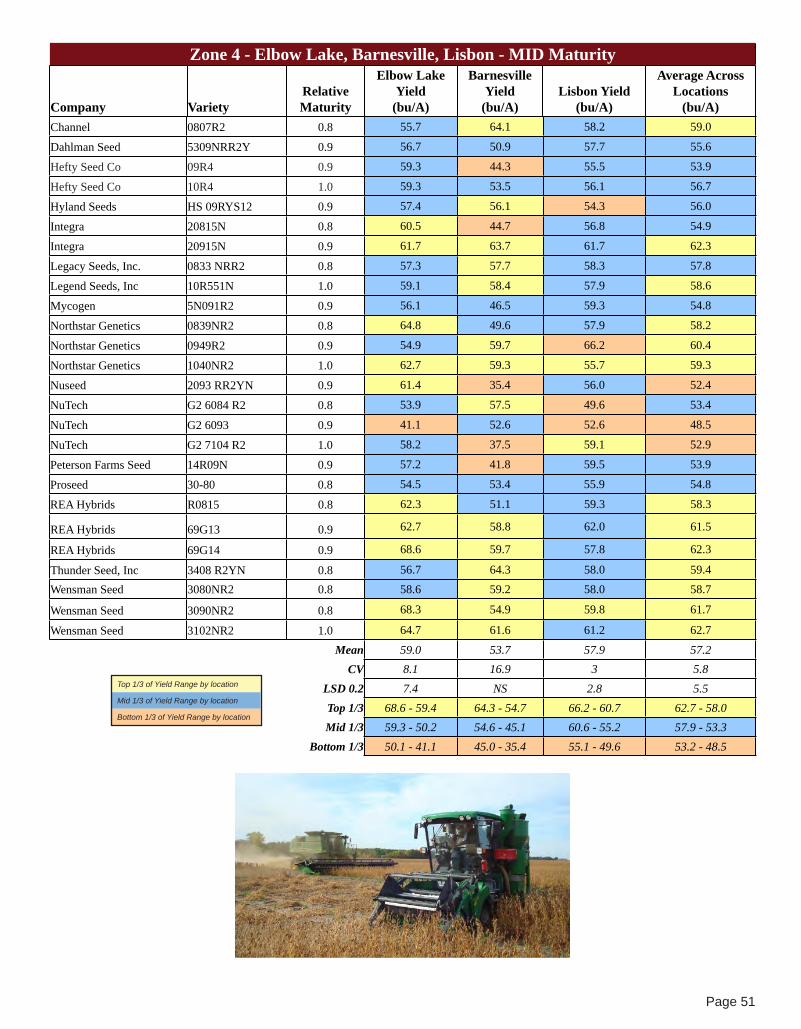
Page 51
Zone 4 - Elbow Lake, Barnesville, Lisbon - MID Maturity
Company VarietyRelative Maturity
Elbow Lake Yield
(bu/A)
Barnesville Yield
(bu/A)Lisbon Yield
(bu/A)
Average Across Locations
(bu/A)
Top 1/3 of Yield Range by location
Mid 1/3 of Yield Range by location
Bottom 1/3 of Yield Range by location
Channel 0807R2 0.8 55.7 64.1 58.2 59.0
Dahlman Seed 5309NRR2Y 0.9 56.7 50.9 57.7 55.6
Hefty Seed Co 09R4 0.9 59.3 44.3 55.5 53.9
Hefty Seed Co 10R4 1.0 59.3 53.5 56.1 56.7
Hyland Seeds HS 09RYS12 0.9 57.4 56.1 54.3 56.0
Integra 20815N 0.8 60.5 44.7 56.8 54.9
Integra 20915N 0.9 61.7 63.7 61.7 62.3
Legacy Seeds, Inc. 0833 NRR2 0.8 57.3 57.7 58.3 57.8
Legend Seeds, Inc 10R551N 1.0 59.1 58.4 57.9 58.6
Mycogen 5N091R2 0.9 56.1 46.5 59.3 54.8
Northstar Genetics 0839NR2 0.8 64.8 49.6 57.9 58.2
Northstar Genetics 0949R2 0.9 54.9 59.7 66.2 60.4
Northstar Genetics 1040NR2 1.0 62.7 59.3 55.7 59.3
Nuseed 2093 RR2YN 0.9 61.4 35.4 56.0 52.4
NuTech G2 6084 R2 0.8 53.9 57.5 49.6 53.4
NuTech G2 6093 0.9 41.1 52.6 52.6 48.5
NuTech G2 7104 R2 1.0 58.2 37.5 59.1 52.9
Peterson Farms Seed 14R09N 0.9 57.2 41.8 59.5 53.9
Proseed 30-80 0.8 54.5 53.4 55.9 54.8
REA Hybrids R0815 0.8 62.3 51.1 59.3 58.3
REA Hybrids 69G13 0.9 62.7 58.8 62.0 61.5
REA Hybrids 69G14 0.9 68.6 59.7 57.8 62.3
Thunder Seed, Inc 3408 R2YN 0.8 56.7 64.3 58.0 59.4
Wensman Seed 3080NR2 0.8 58.6 59.2 58.0 58.7
Wensman Seed 3090NR2 0.8 68.3 54.9 59.8 61.7
Wensman Seed 3102NR2 1.0 64.7 61.6 61.2 62.7
Mean 59.0 53.7 57.9 57.2CV 8.1 16.9 3 5.8
LSD 0.2 7.4 NS 2.8 5.5Top 1/3 68.6 - 59.4 64.3 - 54.7 66.2 - 60.7 62.7 - 58.0Mid 1/3 59.3 - 50.2 54.6 - 45.1 60.6 - 55.2 57.9 - 53.3
Bottom 1/3 50.1 - 41.1 45.0 - 35.4 55.1 - 49.6 53.2 - 48.5

Page 52
Zone 4 - Elbow Lake, Barnesville, Lisbon - EARLY Maturity
Company VarietyRelative Ma-
turityElbow Lake Yield
(bu/A)Barnesville Yield
(bu/A) Lisbon Yield (bu/A)
Average Across Loca-tions
(bu/A)
Zone 4 - Elbow Lake, Barnesville, Lisbon - LATE Maturity
Company VarietyRelative Maturity
Elbow Lake Yield (bu/A)
Barnesville Yield (bu/A) Lisbon Yield (bu/A)
Average Across Locations
(bu/A)
Top 1/3 of Yield Range by location
Mid 1/3 of Yield Range by location
Bottom 1/3 of Yield Range by location
Top 1/3 of Yield Range by location
Mid 1/3 of Yield Range by location
Bottom 1/3 of Yield Range by location
Dahlman Seed 5405 NRR2Y 0.5 68.9 49.7 52.8 57.9Dairyland Seed 0711/R2Y 0.7 67.2 59.8 54.9 60.6Hyland Seeds HS 06RY26 0.6 68.8 61.9 59.4 63.4Legacy Seeds, Inc. 0634 NRR2 0.6 63.3 55.0 53.8 57.4Northstar Genetics 629NR2 0.6 63.6 55.3 54.4 58.1Nuseed 2051 RR2Y 0.5 68.1 62.9 61.6 64.2Nuseed 2074 RR2YN 0.7 66.9 57.2 55.4 59.8Stine Seed 06RE02 0.6 59.4 58.2 48.9 55.5Thunder Seed, Inc 3205 R2Y 0.5 68.0 60.5 60.8 63.1
Mean 66.0 57.8 55.8 60.0
CV 6.2 7 3.8 5.9
LSD 0.2 7.1 6 4.1 3.4
Top 1/3 68.9 - 65.7 62.9 - 58.5 61.6 - 57.4 64.2 - 61.3
Mid 1/3 65.6 - 62.5 58.4 - 54.1 57.3 - 53.2 61.2 - 58.4
Bottom 1/3 62.4 - 59.4 54.0 - 49.7 53.1 - 48.9 58.3 - 55.5
Dairyland Seed 1340/R2Y 1.3 50.9 41.9 61.8 52.4
Hefty Seed Co 14R3 1.4 57.1 42.8 65.1 57.3
Hyland Seeds HS 11RY07 1.4 50.4 41.9 63.2 53.4
Hyland Seeds HS 15RYS45 1.5 51.5 45.4 63.5 54.2
Integra 21115N 1.1 62.4 45.6 62.1 56.0
Legacy Seeds, Inc. 1134 NRR2 1.1 57.0 32.6 60.7 52.1
Legacy Seeds, Inc. 1314 NRR2 1.3 53.6 39.7 61.0 52.1
Legend Seeds, Inc 12R24N 1.2 57.9 47.1 61.2 58.5
Legend Seeds, Inc 13R556N 1.3 56.2 52.4 62.0 57.9
Mycogen 5N122R2 1.2 52.6 34.2 54.2 48.4
Nuseed 2122 RR2YN 1.2 54.9 43.5 58.3 54.7
NuTech G2 6143 1.4 50.9 39.1 54.5 50.0
Peterson Farms Seed 14R11N 1.1 55.5 49.6 63.2 58.2
Peterson Farms Seed 14R13 1.3 52.4 41.0 64.0 53.4
Peterson Farms Seed 15R14N 1.4 50.2 47.1 64.4 55.2
Proseed P2 30-12 1.2 49.7 46.7 61.8 55.4
REA Hybrids R1215 1.2 63.9 45.0 62.5 58.8
Stine Seed 11RD00 1.1 53.7 39.8 56.3 51.2
Thunder Seed, Inc 3511 R2YN 1.1 58.8 36.7 58.8 53.0
Thunder Seed, Inc 3114 R2Y 1.4 55.2 49.3 60.6 57.6
Mean 54.7 43.1 61.0 54.5
CV 8.1 16.4 2.8 8.5
LSD 0.2 5.8 NS 3.1 5.2
Top 1/3 63.9 - 59.2 52.4 - 45.8 65.1 - 61.5 58.8 - 55.3
Mid 1/3 59.1 - 54.5 45.7 - 39.2 61.4 - 57.9 55.2 - 51.8
Bottom 1/3 54.4 - 49.7 39.1 - 32.6 57.8 - 54.2 51.7 - 48.4

Page 53
(Yie
ld R
ange
= h
ighe
st y
ield
- lo
wes
t yie
ld)
Sort
ed b
y 7
Loca
tion
Aver
age
- Com
bine
d Zo
nes
1-2-
3B
elow
is a
list
of v
arie
ties
that
wer
e pl
ante
d in
7 lo
catio
ns w
ithin
Zon
es 1
, 2 &
3
The
colo
rs re
pres
ent t
he ra
nkin
g of
eac
h va
riety
bas
ed o
n ho
w it
yie
lded
in it
s m
atur
ity g
roup
at e
ach
loca
tion.
Zone
1Zo
ne 2
Zone
3
Com
pany
Varie
tyR
elat
ive
Mat
urity
Hal
lock
Yie
ld
(bu/
A)
New
fold
en
Yiel
d (b
u/A
)W
arro
ad Y
ield
(b
u/A
)
East
Gra
nd
Fork
s Yi
eld
(bu/
A)
Thie
f Riv
er F
alls
Yi
eld
(bu/
A)
Wau
bun
Yiel
d (b
u/A
)A
da Y
ield
(b
u/A
)
7 lo
catio
n av
erag
e (b
u/A
)Le
gacy
See
ds, I
nc.
LS 0
334
RR
20.
359
.339
.640
.066
.351
.950
.154
.651
.7
Nus
eed
2034
RR
2YN
0.3
59.1
47.3
30.9
56.9
46.2
43.1
49.3
47.5
Lega
cy S
eeds
, Inc
.LS
021
4 R
R2
0.2
62.1
41.4
38.0
54.6
48.0
26.7
45.9
45.3
Ave
rage
Acr
oss
Loca
tions
(bu/
a) E
AR
LY53
.644
.431
.549
.744
.839
.949
.1
Ave
rage
Acr
oss
Loca
tions
(bu/
a) M
ID54
.846
.936
.256
.746
.945
.050
.7
Ave
rage
Acr
oss
Loca
tions
(bu/
a) L
ATE
56.7
41.7
38.9
53.0
53.8
44.9
50.9
Top
1/3
of Y
ield
Ran
ge b
y lo
catio
n
Mid
1/3
of Y
ield
Ran
ge b
y lo
catio
n
Bot
tom
1/3
of Y
ield
Ran
ge b
y lo
catio
n

Page 54
Sort
ed b
y 5
Loca
tion
Aver
age
- Com
bine
d Zo
nes
1-2
Bel
ow is
a li
st o
f var
ietie
s th
at w
ere
plan
ted
in 4
of t
he 5
loca
tions
with
in Z
oned
1 &
2.
The
colo
rs re
pres
ent t
he ra
nkin
g of
eac
h va
riety
bas
ed o
n ho
w it
yie
lded
in it
s m
atur
ity g
roup
at e
ach
loca
tion.
Zone
1Zo
ne 2
Com
pany
Varie
tyR
elat
ive
Mat
urity
Hal
lock
Yie
ld
(bu/
A)
New
fold
en Y
ield
(b
u/A
)W
arro
ad Y
ield
(b
u/A
)
East
Gra
nd F
orks
Yi
eld
(bu/
A)
Thie
f Riv
er F
alls
Yi
eld
(bu/
A)
5 lo
catio
n av
erag
e (b
u/A
)Th
unde
r See
d, In
c.A
stro
R2Y
0.8
62.1
56.3
43.2
53.4
53.9
53.7
Lega
cy S
eeds
, Inc
.LS
033
4 R
R2
0.3
59.3
39.6
40.0
66.3
51.9
51.3
Par
tner
s B
rand
See
d C
o.P
B02
51R
20.
258
.042
.944
.558
.943
.651
.1
Wen
sman
See
dW
300
99R
20.
957
.246
.141
.658
.744
.050
.9
Lega
cy S
eeds
, Inc
.LS
013
4 R
R2
0.1
59.3
40.3
40.8
57.3
50.9
49.4
Lega
cy S
eeds
, Inc
.LS
021
4 R
R2
0.2
62.1
41.4
38.0
54.6
48.0
49.0
Nus
eed
2034
RR
2YN
0.3
59.1
47.3
30.9
56.9
46.2
48.5
Thun
der S
eed,
Inc.
3400
6 R
2Y0.
656
.345
.537
.852
.342
.448
.0
Par
tner
s B
rand
See
d C
o.P
B00
941R
20.
952
.037
.545
.552
.649
.146
.9
Hyl
and
See
dsH
S 0
06R
YS
240.
652
.151
.332
.844
.846
.645
.3
NuT
ech
See
dG
2 60
210.
255
.437
.034
.053
.846
.645
.0
NuT
ech
See
dG
2 60
000
49.8
36.2
35.6
54.4
49.5
44.0
Thun
der S
eed,
Inc.
3500
7 R
2YN
0.7
50.9
41.6
34.7
46.8
47.3
43.5
Nus
eed
0074
RR
2YN
0.7
48.5
41.2
35.0
47.0
42.0
42.9
Ave
rage
Acr
oss
Loca
tions
(bu/
a) E
AR
LY52
.744
.431
.549
.744
.8
Ave
rage
Acr
oss
Loca
tions
(bu/
a) M
ID54
.846
.936
.256
.746
.9
Ave
rage
Acr
oss
Loca
tions
(bu/
a) L
ATE
56.7
41.7
38.9
53.0
53.8
Top
1/3
of Y
ield
Ran
ge b
y lo
catio
n
Mid
1/3
of Y
ield
Ran
ge b
y lo
catio
n
Bot
tom
1/3
of Y
ield
Ran
ge b
y lo
caito
n
Proj
ect f
unde
d in
par
t by:
(Yie
ld R
ange
= h
ighe
st y
ield
- lo
wes
t yie
ld)
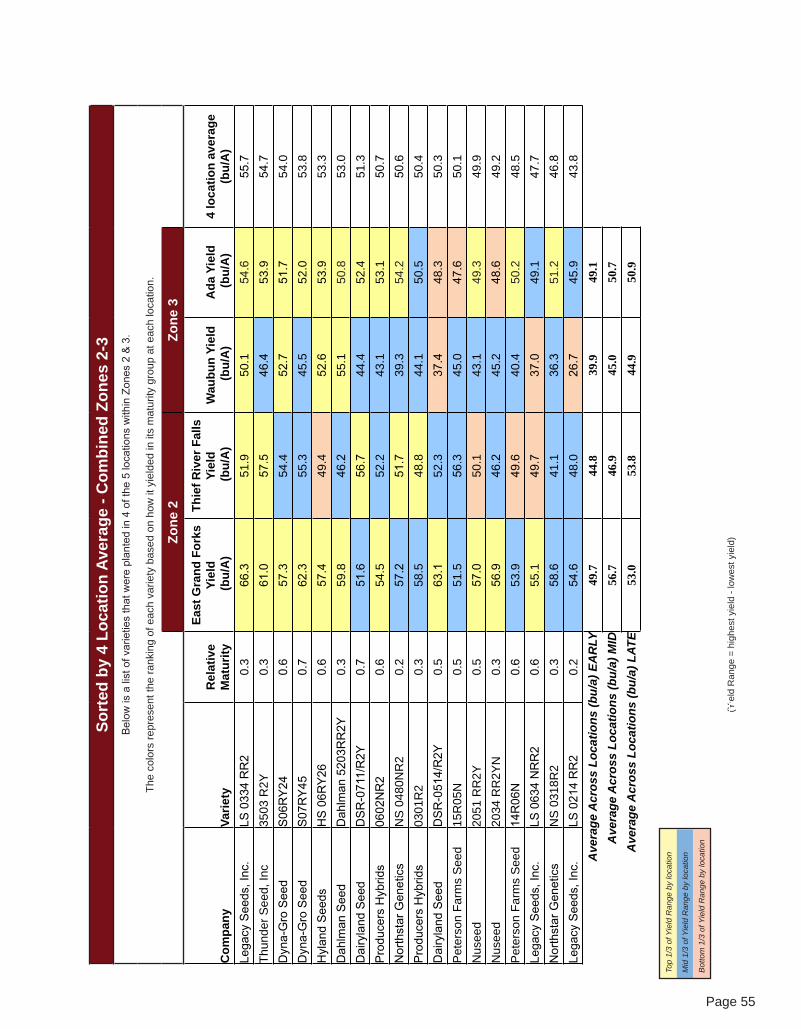
Page 55
Sort
ed b
y 5
Loca
tion
Aver
age
- Com
bine
d Zo
nes
1-2
Bel
ow is
a li
st o
f var
ietie
s th
at w
ere
plan
ted
in 4
of t
he 5
loca
tions
with
in Z
oned
1 &
2.
The
colo
rs re
pres
ent t
he ra
nkin
g of
eac
h va
riety
bas
ed o
n ho
w it
yie
lded
in it
s m
atur
ity g
roup
at e
ach
loca
tion.
Zone
1Zo
ne 2
Com
pany
Varie
tyR
elat
ive
Mat
urity
Hal
lock
Yie
ld
(bu/
A)
New
fold
en Y
ield
(b
u/A
)W
arro
ad Y
ield
(b
u/A
)
East
Gra
nd F
orks
Yi
eld
(bu/
A)
Thie
f Riv
er F
alls
Yi
eld
(bu/
A)
5 lo
catio
n av
erag
e (b
u/A
)Th
unde
r See
d, In
c.A
stro
R2Y
0.8
62.1
56.3
43.2
53.4
53.9
53.7
Lega
cy S
eeds
, Inc
.LS
033
4 R
R2
0.3
59.3
39.6
40.0
66.3
51.9
51.3
Par
tner
s B
rand
See
d C
o.P
B02
51R
20.
258
.042
.944
.558
.943
.651
.1
Wen
sman
See
dW
300
99R
20.
957
.246
.141
.658
.744
.050
.9
Lega
cy S
eeds
, Inc
.LS
013
4 R
R2
0.1
59.3
40.3
40.8
57.3
50.9
49.4
Lega
cy S
eeds
, Inc
.LS
021
4 R
R2
0.2
62.1
41.4
38.0
54.6
48.0
49.0
Nus
eed
2034
RR
2YN
0.3
59.1
47.3
30.9
56.9
46.2
48.5
Thun
der S
eed,
Inc.
3400
6 R
2Y0.
656
.345
.537
.852
.342
.448
.0
Par
tner
s B
rand
See
d C
o.P
B00
941R
20.
952
.037
.545
.552
.649
.146
.9
Hyl
and
See
dsH
S 0
06R
YS
240.
652
.151
.332
.844
.846
.645
.3
NuT
ech
See
dG
2 60
210.
255
.437
.034
.053
.846
.645
.0
NuT
ech
See
dG
2 60
000
49.8
36.2
35.6
54.4
49.5
44.0
Thun
der S
eed,
Inc.
3500
7 R
2YN
0.7
50.9
41.6
34.7
46.8
47.3
43.5
Nus
eed
0074
RR
2YN
0.7
48.5
41.2
35.0
47.0
42.0
42.9
Ave
rage
Acr
oss
Loca
tions
(bu/
a) E
AR
LY52
.744
.431
.549
.744
.8
Ave
rage
Acr
oss
Loca
tions
(bu/
a) M
ID54
.846
.936
.256
.746
.9
Ave
rage
Acr
oss
Loca
tions
(bu/
a) L
ATE
56.7
41.7
38.9
53.0
53.8
Top
1/3
of Y
ield
Ran
ge b
y lo
catio
n
Mid
1/3
of Y
ield
Ran
ge b
y lo
catio
n
Bot
tom
1/3
of Y
ield
Ran
ge b
y lo
caito
n
Proj
ect f
unde
d in
par
t by:
(Yie
ld R
ange
= h
ighe
st y
ield
- lo
wes
t yie
ld)
Sort
ed b
y 4
Loca
tion
Aver
age
- Com
bine
d Zo
nes
2-3
Bel
ow is
a li
st o
f var
ietie
s th
at w
ere
plan
ted
in 4
of t
he 5
loca
tions
with
in Z
ones
2 &
3.
The
colo
rs re
pres
ent t
he ra
nkin
g of
eac
h va
riety
bas
ed o
n ho
w it
yie
lded
in it
s m
atur
ity g
roup
at e
ach
loca
tion.
Zone
2Zo
ne 3
Com
pany
Varie
tyR
elat
ive
Mat
urity
East
Gra
nd F
orks
Yi
eld
(bu/
A)
Thie
f Riv
er F
alls
Yiel
d (b
u/A
)W
aubu
n Yi
eld
(bu/
A)
Ada
Yie
ld (b
u/A
)4
loca
tion
aver
age
(bu/
A)
Lega
cy S
eeds
, Inc
.LS
033
4 R
R2
0.3
66.3
51.9
50.1
54.6
55.7
Thun
der S
eed,
Inc
3503
R2Y
0.3
61.0
57.5
46.4
53.9
54.7
Dyn
a-G
ro S
eed
S06
RY
240.
657
.354
.452
.751
.754
.0D
yna-
Gro
See
dS
07R
Y45
0.7
62.3
55.3
45.5
52.0
53.8
Hyl
and
See
dsH
S 0
6RY
260.
657
.449
.452
.653
.953
.3D
ahlm
an S
eed
Dah
lman
520
3RR
2Y0.
359
.846
.255
.150
.853
.0D
airy
land
See
dD
SR
-071
1/R
2Y0.
751
.656
.744
.452
.451
.3P
rodu
cers
Hyb
rids
0602
NR
20.
654
.552
.243
.153
.150
.7N
orth
star
Gen
etic
sN
S 0
480N
R2
0.2
57.2
51.7
39.3
54.2
50.6
Pro
duce
rs H
ybrid
s03
01R
20.
358
.548
.844
.150
.550
.4D
airy
land
See
dD
SR
-051
4/R
2Y0.
563
.152
.337
.448
.350
.3P
eter
son
Farm
s S
eed
15R
05N
0.5
51.5
56.3
45.0
47.6
50.1
Nus
eed
2051
RR
2Y0.
557
.050
.143
.149
.349
.9N
usee
d20
34 R
R2Y
N0.
356
.946
.245
.248
.649
.2P
eter
son
Farm
s S
eed
14R
06N
0.6
53.9
49.6
40.4
50.2
48.5
Lega
cy S
eeds
, Inc
.LS
063
4 N
RR
20.
655
.149
.737
.049
.147
.7N
orth
star
Gen
etic
sN
S 0
318R
20.
358
.641
.136
.351
.246
.8Le
gacy
See
ds, I
nc.
LS 0
214
RR
20.
254
.648
.026
.745
.943
.8A
vera
ge A
cros
s Lo
catio
ns (b
u/a)
EA
RLY
49.7
44.8
39.9
49.1
Ave
rage
Acr
oss
Loca
tions
(bu/
a) M
ID56
.746
.945
.050
.7A
vera
ge A
cros
s Lo
catio
ns (b
u/a)
LAT
E53
.053
.844
.950
.9
Top
1/3
of Y
ield
Ran
ge b
y lo
catio
n
Mid
1/3
of Y
ield
Ran
ge b
y lo
catio
n
Bot
tom
1/3
of Y
ield
Ran
ge b
y lo
catio
n

Page 56
(Yie
ld R
ange
= h
ighe
st y
ield
- lo
wes
t yie
ld)
Sort
ed b
y 5
Loca
tion
Aver
age
- Com
bine
d Zo
nes
3-4
Dat
a (fr
om h
arve
st re
sults
)B
elow
is a
list
of v
arie
ties
that
wer
e pl
ante
d 5
loca
tions
with
in Z
oned
3 &
4.
The
colo
rs re
pres
ent t
he ra
nkin
g of
eac
h va
riety
bas
ed o
n ho
w it
yie
lded
in it
s m
atur
ity g
roup
at e
ach
loca
tion.
Zone
3Zo
ne 4
Com
pany
Varie
tyR
elat
ive
Mat
urity
Wau
bun
Yiel
d (b
u/A
)A
da Y
ield
(b
u/A
)
Bar
nesv
ille
Yiel
d (b
u/A
)Fe
rgus
Fal
ls
Yiel
d (b
u/A
)Li
sbon
Yie
ld
(bu/
A)
5 lo
catio
n av
erag
e (b
u/A
)H
ylan
d S
eeds
HS
06R
Y26
0.6
52.6
53.9
68.8
61.9
60.8
59.6
Dai
ryla
nd S
eed
DS
R-0
711/
R2Y
0.7
44.4
52.4
67.2
59.8
61.6
57.1
Thun
der S
eed,
Inc
3205
R2Y
0.5
46.4
53.9
68.0
60.5
55.4
56.9
Nus
eed
2051
RR
2Y0.
545
.248
.668
.162
.955
.456
.0Th
unde
r See
d, In
c34
08 R
2YN
0.8
48.6
52.2
56.7
64.3
55.7
55.5
Wen
sman
See
dW
308
0NR
20.
840
.853
.158
.659
.259
.154
.2N
usee
d20
74 R
R2Y
N0.
744
.152
.066
.957
.248
.953
.8Le
gacy
See
ds, I
nc.
LS 0
833
NR
R2
0.8
45.1
50.2
57.3
57.7
58.0
53.6
Dah
lman
See
dD
ahlm
an 5
405N
RR
2Y0.
547
.548
.568
.949
.752
.853
.5M
ycog
en5N
091R
20.
950
.753
.256
.146
.559
.853
.3C
hann
el08
07R
20.
834
.251
.455
.764
.158
.252
.7P
eter
son
Farm
s S
eed
14R
09N
0.9
53.8
52.3
57.2
41.8
57.8
52.6
Hyl
and
See
dsH
S 0
9RY
S12
0.9
47.7
49.1
56.1
46.5
59.8
51.9
Lega
cy S
eeds
, Inc
.LS
063
4 N
RR
20.
637
.049
.157
.357
.758
.051
.8N
orth
star
Gen
etic
sN
S 0
839N
R2
0.8
41.3
40.9
64.8
49.6
57.7
50.9
Ave
rage
Acr
oss
Loca
tions
(bu/
a) E
AR
LY39
.949
.149
.166
.055
.9
Ave
rage
Acr
oss
Loca
tions
(bu/
a) M
ID45
.050
.750
.759
.057
.9A
vera
ge A
cros
s Lo
catio
ns (b
u/a)
LAT
E44
.950
.950
.954
.761
.0
Top
1/3
of Y
ield
Ran
ge b
y lo
catio
n
Mid
1/3
of Y
ield
Ran
ge b
y lo
catio
n
Bot
tom
1/3
of Y
ield
Ran
ge b
y lo
catio
n

Page 57
County Variety Plot Trial Participants includes: Becker/Mahnomen County Soybean-Corn Growers Association
Clay/Wilkin County Soybean-Corn Growers AssociationSteele County Crop and Livestock Improvement Association
Kittson County Soybean Growers AssociationMarshall County Soybean Growers Association
Norman County Soybean-Corn Growers AssociationOtter Tail/Grant County Soybean-Corn Growers Association
Pennington/Red Lake County Soybean-Corn Growers AssociationPolk County Soybean-Corn Growers Association
Ransom County Crop and Livestock Improvement AssociationRoseau/Lake of the Woods County Soybean Growers Association
Channel - www.channel.comDahlman Seed Company - www.dahlmanseed.com
Dairyland Seed Company - www.dairylandseed.comDyna-Gro Seed - www.dynagroseed.com
Hefty Seed Company - www.heftyseed.comHyland Seeds - www.hylandseeds.comIntegra Seed - www.integraseed.comLegacy Seeds - www.legacyseeds.comLegend Seeds - www.legendseeds.netMycogen Seeds - www.mycogen.com
NorthStar Genetics - www.northstargenetics.comNuseed/Seeds 2000 - www.seeds2000.net
NuTech Seed - www.nutechseed.comPartners Brand Seed - www.partnersbrandseed.comPeterson Farms Seed - www.petersonfarmsseed.com
Prairie Brand - www.prairiebrand.comProducers Hybrids - www.producershybrids.com
Proseed Inc. - www.proseed.netREA Hybrids - www.rea-hybrids.com
Renk Seeds - www.renkseed.com Stine Seeds - www.stineseed.comSyngenta - www.syngenta.com
Thunder Seed Inc. - www.thunderseeds.comWensman Seed Company - www.wensmanseed.com
Thank you to the following seed companies for participating in the
2014 Soybean Variety Trials:

Page 58
Research Questions
The soils of northern Minnesota are variable, in large part due to the activity of glaciers during the last ice age. These soils, which were influenced by the activity of glacial Lake Agassiz, have pH levels that range from 7.8 to 8.4. As soil pH levels increase from 7 to the mid-8’s, the availability of certain essential elements necessary for plant growth and development is restricted and nutri-ent uptake by plant roots is hindered. As an example, research trials with phosphorus suggests plant roots have a limited time, in the cold soils of early spring, to utilize ap-plied phosphorus as these soil factors reduce phosphorus availability for uptake by plant roots in high pH soils.
Recent research at the U of MN Magnusson Research Farm has suggested an improvement in wheat develop-ment, growth, and yield from phosphorus applied a 2X rate compared to the standard rate of phosphorus applied in-furrow. It is also theorized that broadcast applications of additional phosphorus on these high ph soils may have added benefit to not only the present wheat crop but the subsequent crop of soybeans. An increase in uptake of early season phosphate by wheat roots is theorized to improve plant growth and development which may lead to increased wheat yields, improved quality, and ultimately profitability.
A new formulation of nitrogen called ESN (environmen-tally sensitive nitrogen) is a time released coated urea product with improved seed safety compared to other forms nitrogen. This coated urea can be applied in-furrow at nitrogen rates up to three times the current safe rate of urea. The polymer coated, time released formulation supplies nitrogen to the crop throughout the entire growing season and reduces nitrogen loss through volatilization, denitrification, and leaching.
Phosphorus and ESN applied in-furrow at planting time have the potential to increase wheat growth, develop-ment and yields. Small plot and large on-farm research trials will be designed to provide scientific data to provide answers to these research questions in the spring wheat production systems in northern Minnesota’s environmental conditions.
Results
See tables on page 60 and 61
Application/Use
The rationale for this research is to compare the stan-dard phosphate starter with and without ESN and a 2X rate of phosphorus fertilizer starter program in spring wheat. The elevated phosphorus levels may improve early season wheat growth and development in the high pH soils of northern MN. A coated urea product may offer the potential to improve wheat yield and quality (protein), especially if the product is not released into the soil solu-tion until later in the plant developmental stages of the spring wheat.
Material and Methods
Treatment applications, data collection, data analysis and summaries will be conducted by the University of Minnesota to insure unbiased, scientifically valid research results. This fertility research integrates small plot rep-licated trials with large, replicated on-farm trials. The Magnusson Research Farm (located 6 miles northwest of Roseau, MN) will be the site for the small plot replicated research trials. The Magnusson Research Farm is a 40 acre site that was gifted to the University of Minnesota to conduct agricultural research that will have a positive impact on crops produced in the area. The Farm is the northern most research site in Minnesota with unique environmental conditions that make this an attractive loca-tion for crop research. Results of this field research will be summarized for potential publication in regional publica-tions (e.g. Prairie Grains Magazine) and scientific journals. Research findings from the large on-farm trials and the small plot trials will be presented at regional and local wheat growers meetings.
The experimental design for the small plot research was a randomized complete block with 4 replications. Spring wheat was seeded with and without a starter fertilizer. The starter fertilizer was applied down the tube with the seed. These small plots were managed similar to area wheat production fields. Flag leaves were collected for tissue analysis. Plots were harvested for yield with a small plot combine with sub-samples from each plot for wheat seed quality assessments.
The small plot fertility trial had 13 fertility treatments plus a control (no starter fertilizer) treatment for a total of 14 treatments replicated four times for a total of 56 individual plots. Total nitrogen application equaled 140# nitrogen for all plots.
Wheat Yield and Protein as Influenced by In-Furrow (down the tube) Phosphorus, Potassium and Coated Urea (ESN)
Nancy Jo Ehlke, Dept. of Agronomy and Plant Genetics, St. Paul
2014 RESEARCH REPORT

Page 59
Data collected: Background soil fertility, plant vigor rat-ings, crop color rating, chlorophyll meter ratings (taken at jointing and flag leaf stages of wheat development), flag leaf tissue test, crop yield, and crop quality parameters (test weight, protein).
The on-farm trials were conducted at 2 Roseau area locations . Location 1 is located northwest of Roseau on Rice Farms. Location 2 is located west of Roseau on Magnusson Farms. Field trial design will be a random-ized complete block design with three replications at each site. The on-farm cooperators selected to participate in this research utilize new technologies and advanced management practices to maximize wheat yields such as seed treatments, aggressive fertility rates, and fungicide treatments. Each site will have two treatments replicated three times (six strips). Each site had a standard in-furrow application of 6-30-30. An added treatment of 12-60-0 was applied by University of Minnesota personel prior to final seedbed preparation
Total applied nitrogen will be the same for each treat-ment based on the producer’s specific yield goal for wheat. Plot size will be one pass of the air seeder feet wide by 500 feet long to accommodate the production practices and the farmer cooperators equipment.
Economic Benefit to a Typical 500 Acre Wheat Enterprise
At location 2 where P2O5 levels were low, a significant wheat yield advantage was realized. A significantly higher soil P2O5 level was measured in soil post-harvest indicat-ing an accumulation of phosphorous in the soil is possible for future crop use.
Related Research
Minnesota Turf Seed Council has on-going fertility research program in perennial ryegrass. Minnesota Agri-cultural Fertilizer Research and Education Council funded fertility research in wheat in 2012. Minnesota Soybean Research and Promotion Council funded fertility research in soybean in 2014.
Treatment list: No added P or K MES 10 + K (9-30-30-7) - In-furrowStandard P & K (9-30-30) - Broadcast MES 10 (2x) + K (18-60-30-14) - In-furrowStandard P & K (9-30-30) - In-furrow Standard P & K + AMS (9-30-30-7) - In-furrowElevated P & K (18-60-60 - Broadcast MES 10 + K + ESN (39-30-30-7) - In-furrowElevated P & K (18-60-60) - In-furrow Standard P & K + ESN (39-30-30) - In-furrowElevated P normal K (18-60-30) - In-furrow Standard P & K + ESN (69-30-30) - In-furrowElevated P normal K (13-45-30) - In-furrow Elevated P normal K + ESN (39-60-30) - In-furrow
Recommended Future Research
Research should be repeated during the second year of the grant to validate first year results

Page 60
2014 Phosphorous Application to Spring Wheat Location 1=Rice Farm-3 mi. North and 5 mi. west of Roseau Variety - Linkert Location 2=Magnusson Farms-1mi.west and 1 mile north of Roseau Variety-Samson
Test wt. Soil test ppm - P2O5 Tissue tests at anthesisYield-Bu./acre * % Protein #/bushel Spring post harvest RCI phosphorus potassium
Treatment Loc.1 Loc.2 Loc.1 Loc.2 Loc.1 Loc.2 Loc.1 Loc.2 loc.1 loc.2 Loc.1 Loc.2 Loc.1 Loc.2 loc.1 loc.2Standard In Furrow (7-30-30) 66.7 74.1 13.8 14.7 62 63.5 9.5 4 7 2.7 306 791 0.27 0.27 2.2 1.6Standard In Furrow (7-30-30)+13-60-0 66.7 82.5 14.1 14.5 62 63.5 9.5 4 9.7 4 319 801 0.28 0.28 2.5 1.5broadcast prior to spring tillage
LSD @5% level NS 4.6 NS NS NS 1 NS NS NS NS NS NSCV 4 5 3 4 32 31 2 1 10 1 9 1
Experimental Design: RCB w/3reps Plots size=70’ x 600’ Broadcast application of MAP(7-30-0) prior to final seed bed tillage to both locations with 12’ Gandy drop spreader.*Assume 63#/bu @12.5% moisture Objectives: Wheat yields in 2014 and soybean in 2015 Compare 2015 soybean yield where additional fertilizer was applied to determine if ‘stockpiling ‘ of phosphorus is feasible in high PH soils
2014 Wheat Fertility Trial Magnusson Research Farm--Samson Wheat Broadcast urea added to all treatment application to equal 140#/ac. total added nitrogen
App*Yield **Bu./acre
Yield% of mean % Protein
RCI 3 Vigor 4 Heading Tissue sampling data - 7/22 (anthesis)TRT# Trts 3-Jul 8-Jul 3-Jul 8-Jul Date B Ca Fe Mg Mn N P K S Zn1 0-0-0 NONE 96 86 14.1 256 336 7 6 21 3.8 0.6 83 0.32 25 4.1 0.29 1.68 0.38 172 9-30-30 B 111 101 13.3 374 451 8 7.8 21 4 0.7 99 0.42 28 4.1 0.29 1.83 0.35 163 9-30-30 I 108 97 13 370 456 8.3 8.3 21 4.5 0.6 90 0.34 28 3.9 0.3 1.73 0.33 154 18-60-60 B 109 98 12.9 404 448 8.3 8.3 21 4 0.6 102 0.34 29 3.9 0.3 1.73 0.33 155 18-60-60 I 115 104 12.9 375 473 8.5 9 22 4.3 0.6 99 0.37 34 4 0.3 1.91 0.3 156 18-60-30 B 112 101 12.9 390 454 8.8 8.3 21 3.5 0.7 97 0.34 29 4 0.3 1.8 0.33 167 18-60-30 I 112 101 12.8 385 456 8.3 9 22 3.8 0.7 106 0.4 39 4 0.3 1.72 0.34 158 13-45-30 I 108 97 13.1 389 461 8.3 8.5 21 4.3 0.6 95 0.38 34 4 0.3 1.74 0.33 159 9-30-30-7s B 104 94 12.6 387 466 8.5 8.3 21 4 0.6 97 0.36 29 4 0.29 1.76 0.31 1510 18-60-30-14s I 120 108 12.8 427 488 8.5 9 23 4.8 0.8 116 0.46 41 4.1 0.32 2.1 0.35 1611 9-30-30-7s I 113 102 13 412 472 8 8.5 22 3.8 0.6 101 0.34 32 3.9 0.3 1.9 0.31 1512 39-30-301 I 108 98 13.8 341 401 7.5 7.5 21 4 0.7 95 0.34 28 4 0.31 1.72 0.35 1613 69-30-302 I 115 103 14.4 369 426 8 7.8 21 4.5 0.7 100 0.37 32 4.1 0.31 1.71 0.36 1614 39-60-301 I 119 107 13.4 422 467 8.8 8.8 21 4.5 0.7 100 0.43 38 4.1 0.32 1.89 0.31 16
LSD @5% level 9 7 0.8 61 44 1 1 1 1 0.1 15 0.07 8 0.2 0.02 0.35 0.05 1.7CV 6 6 4 11 7 9 8 2 17 10 11 13 18 4 6 14 11 8
App*= Application method: I - In furrow and B - broadcast. Yield**-corrected to 12% moisture. 1 ESN applied in furrow 30#N/acre 2 ESN applied in furrow 60#N/acre 3 RCI=Relative chlorophyll index- higher number -more chlorophyll. 4 Vigor=9-best plant vigor Test wts./Bushel =62.5#(all treatments within .3#/bu.) Mean Yields = 111 Bu./acre planted 6/4/2014 Soil test results- Spring 2014 P2O5= 4ppm SO4=5ppm NO3=34#/acre Soil test results- Post harvest-2014 P2O5= treatments 1 & 3= 6ppm; treatment 5= 6.5ppm
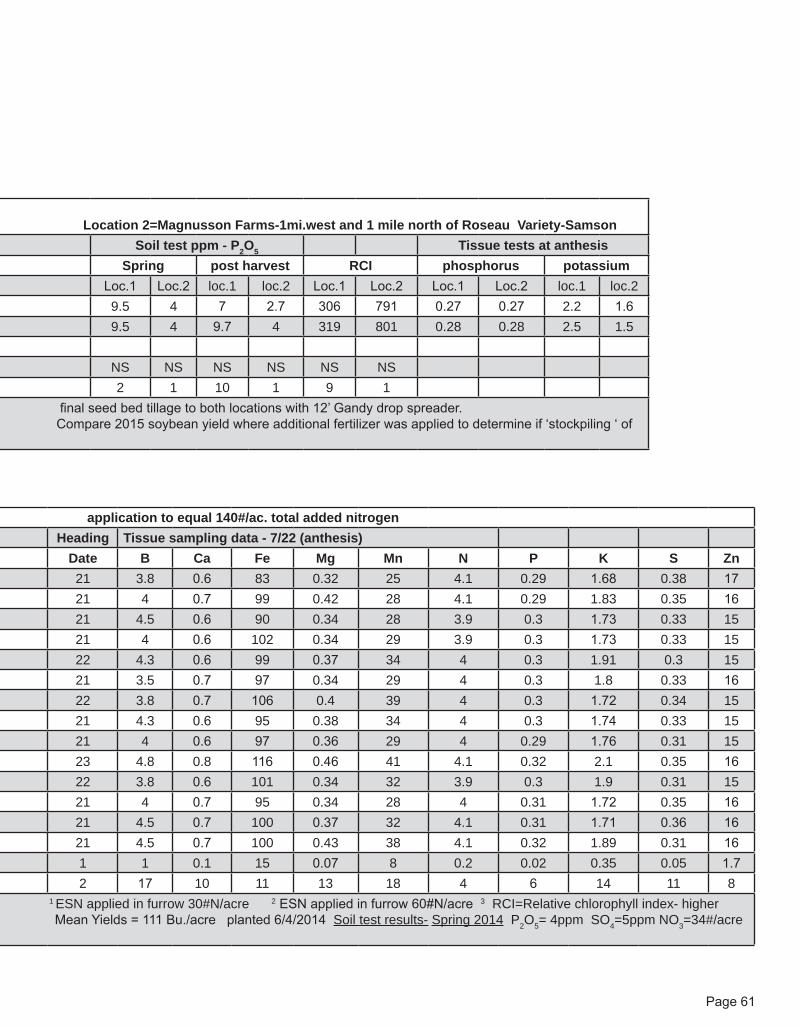
Page 61
2014 Phosphorous Application to Spring Wheat Location 1=Rice Farm-3 mi. North and 5 mi. west of Roseau Variety - Linkert Location 2=Magnusson Farms-1mi.west and 1 mile north of Roseau Variety-Samson
Test wt. Soil test ppm - P2O5 Tissue tests at anthesisYield-Bu./acre * % Protein #/bushel Spring post harvest RCI phosphorus potassium
Treatment Loc.1 Loc.2 Loc.1 Loc.2 Loc.1 Loc.2 Loc.1 Loc.2 loc.1 loc.2 Loc.1 Loc.2 Loc.1 Loc.2 loc.1 loc.2Standard In Furrow (7-30-30) 66.7 74.1 13.8 14.7 62 63.5 9.5 4 7 2.7 306 791 0.27 0.27 2.2 1.6Standard In Furrow (7-30-30)+13-60-0 66.7 82.5 14.1 14.5 62 63.5 9.5 4 9.7 4 319 801 0.28 0.28 2.5 1.5broadcast prior to spring tillage
LSD @5% level NS 4.6 NS NS NS 1 NS NS NS NS NS NSCV 4 5 3 4 32 31 2 1 10 1 9 1
Experimental Design: RCB w/3reps Plots size=70’ x 600’ Broadcast application of MAP(7-30-0) prior to final seed bed tillage to both locations with 12’ Gandy drop spreader.*Assume 63#/bu @12.5% moisture Objectives: Wheat yields in 2014 and soybean in 2015 Compare 2015 soybean yield where additional fertilizer was applied to determine if ‘stockpiling ‘ of phosphorus is feasible in high PH soils
2014 Wheat Fertility Trial Magnusson Research Farm--Samson Wheat Broadcast urea added to all treatment application to equal 140#/ac. total added nitrogen
App*Yield **Bu./acre
Yield% of mean % Protein
RCI 3 Vigor 4 Heading Tissue sampling data - 7/22 (anthesis)TRT# Trts 3-Jul 8-Jul 3-Jul 8-Jul Date B Ca Fe Mg Mn N P K S Zn1 0-0-0 NONE 96 86 14.1 256 336 7 6 21 3.8 0.6 83 0.32 25 4.1 0.29 1.68 0.38 172 9-30-30 B 111 101 13.3 374 451 8 7.8 21 4 0.7 99 0.42 28 4.1 0.29 1.83 0.35 163 9-30-30 I 108 97 13 370 456 8.3 8.3 21 4.5 0.6 90 0.34 28 3.9 0.3 1.73 0.33 154 18-60-60 B 109 98 12.9 404 448 8.3 8.3 21 4 0.6 102 0.34 29 3.9 0.3 1.73 0.33 155 18-60-60 I 115 104 12.9 375 473 8.5 9 22 4.3 0.6 99 0.37 34 4 0.3 1.91 0.3 156 18-60-30 B 112 101 12.9 390 454 8.8 8.3 21 3.5 0.7 97 0.34 29 4 0.3 1.8 0.33 167 18-60-30 I 112 101 12.8 385 456 8.3 9 22 3.8 0.7 106 0.4 39 4 0.3 1.72 0.34 158 13-45-30 I 108 97 13.1 389 461 8.3 8.5 21 4.3 0.6 95 0.38 34 4 0.3 1.74 0.33 159 9-30-30-7s B 104 94 12.6 387 466 8.5 8.3 21 4 0.6 97 0.36 29 4 0.29 1.76 0.31 1510 18-60-30-14s I 120 108 12.8 427 488 8.5 9 23 4.8 0.8 116 0.46 41 4.1 0.32 2.1 0.35 1611 9-30-30-7s I 113 102 13 412 472 8 8.5 22 3.8 0.6 101 0.34 32 3.9 0.3 1.9 0.31 1512 39-30-301 I 108 98 13.8 341 401 7.5 7.5 21 4 0.7 95 0.34 28 4 0.31 1.72 0.35 1613 69-30-302 I 115 103 14.4 369 426 8 7.8 21 4.5 0.7 100 0.37 32 4.1 0.31 1.71 0.36 1614 39-60-301 I 119 107 13.4 422 467 8.8 8.8 21 4.5 0.7 100 0.43 38 4.1 0.32 1.89 0.31 16
LSD @5% level 9 7 0.8 61 44 1 1 1 1 0.1 15 0.07 8 0.2 0.02 0.35 0.05 1.7CV 6 6 4 11 7 9 8 2 17 10 11 13 18 4 6 14 11 8
App*= Application method: I - In furrow and B - broadcast. Yield**-corrected to 12% moisture. 1 ESN applied in furrow 30#N/acre 2 ESN applied in furrow 60#N/acre 3 RCI=Relative chlorophyll index- higher number -more chlorophyll. 4 Vigor=9-best plant vigor Test wts./Bushel =62.5#(all treatments within .3#/bu.) Mean Yields = 111 Bu./acre planted 6/4/2014 Soil test results- Spring 2014 P2O5= 4ppm SO4=5ppm NO3=34#/acre Soil test results- Post harvest-2014 P2O5= treatments 1 & 3= 6ppm; treatment 5= 6.5ppm

Page 62
Research Questions
A recurrent mass selection pre-breeding program that is based on the dominant male-sterility gene, Ms2, is being implemented to facilitate the continuous develop-ment of improved hard red winter wheat breeding parents with high levels of winter-hardiness coupled with effective resistance against major diseases such as Fusarium head blight (FHB), leaf and stem rust, tan spot, bacterial leaf streak (BLS) and Stagonospora nodorum blotch (SNB). This long term pre-breeding program will operate in paral-lel with the conventional winter wheat breeding program and will serve to systematically assemble (pyramid) new useful genes in adapted genotypes that can be used more effectively in crosses with the elite germplasm.
In the first three years (this funding application), selec-tion will focus on:
a. Increasing the level of cold-hardiness in the population.
b. Raising the frequency of genes for insensitivity to SNB and tan spot.
c. Establishing the durable rust resistance genes, Lr34/ Yr18, Sr2 as well as the FHB resistance genes, Fhb1 and Fhb5A.
d. Introducing additional major and minor gene resistance to the cereal rusts.
e. Introducing BLS resistance.f. establishing a regular recurrent mass selection
program with inbreeding and field testing of the male parents
Materials and Methods
Recurrent selection is based on consecutive cycles of intense selection followed by random intercrossing of the selected plants. The hybrid progeny from each cross cycle then constitutes the next population with which the procedure will be repeated. Successful application of this selection strategy requires an ability to readily and randomly intercross large numbers of plants. This can be done in wheat by employing a dominant gene for male sterility such as Ms2.
A diverse base population for recurrent mass selection is being developed. The Ms2 gene has been incorporated within the hybrid population such that the F1 always segre-gates 1:1 for male sterility: male fertility. The base popu-lation will be systematically improved through selection. Both male and female plants will be selected, however, only male plants will be evaluated in the field. Female plants will be derived from the F1 produced in each
season whereas the male plants used in a particular season will be selected among advanced generation seg-regates derived from crosses made in preceding years. Following their use in a crossing block, the male parents will also be evaluated for possible commercial use.
All plants will be grown in containers. In each season the spikes of selected, male-sterile females will be cut open to facilitate pollination. During pollination, selected female plants will be positioned lower and surrounded by selected male plants. Mild wind agitation (fan) will be used to en-hance cross-pollination. The containers will be arranged in a manner that will promote randomness of pollination.
Characterization and selection of parent plants will be based on markers (where available), seedling screening (rust, tan spot and SNB resistance) and field screening (winter survival, disease resistance, yield and quality).
At the onset of selection (first three years), field tested male parents will not yet be available. While field testing and inbreeding of the male component is being imple-mented, interim male parents will be derived from back-cross breeding attempts and a routine pedigree breeding program.
Results
In total three cycles of crosses will be made during the project funding period. The first cross was completed in February/March, 2013.
The second cross: A second crossing cycle was com-pleted in February/March, 2014, when the following was done: (a) The Ms2 male sterility gene was found to give more complete and regular penetrance of male sterility than Ms3 and therefore introduced. In coming cycles it will completely replace Ms3. (b) Additional disease re-sistance genes that have been backcrossed into winter-hardy HRWW backgrounds (2011-2013) were introduced through new male parents. These included: Lr34, Lr53 and Lr62 (leaf rust); Sr22, Sr26, Sr39 and Sr50 (stem rust); and Fhb1 (FHB). (c) A facility to do marker-assisted screening was developed and used to select for the stem rust resistance genes. In the third cross cycle (January/February, 2015) the number of markers and numbers of plants screened with markers will be increased further.
Development of Norstar near-isogenic parents with pyramided resistance: Since Norstar is believed to be the most winter-hardy genotype available, backcrosses aimed at pyramiding combinations of resistance genes in its
Use of Recurrent Mass Selection to Pre-breed Hard Red Winter Wheat for Resistance to Major Biotrophic and Nectrotrophic Diseases
Francois Marais, Dept. of Plant Sciences, NDSU

Page 63
genetic background were initiated in 2013. The purpose is to include the pyramided genotypes among the male parents in future recurrent selection crossing blocks. Five B3F2 populations, each segregating for Fhb1 and RhtB1b (semi-dwarfing gene) plus Sr39 & Lr34; Lr53; Sr2; Sr26, and Sr50, were obtained and are currently being screened for the selection of homozygotes to be used as parents.
Selection of future male parents with resistance/insen-sitivity to tan spot and SNB: In 2014, inbreeding coupled with seedling selection was initiated with random male-fertile F2 plants from an earlier RMS base population that involved 110 winter and spring habit varieties and lines. The F2 generation was screened for tan spot resistance using inoculum from a mix of races. Plants were inocu-lated at the two-to-three leaf stage, approximately seven days after their 56 day vernalization period and later moved to a growth chamber. Evaluations were done seven days after inoculation, where only the resistant and inter-mediate individuals were selected, and the 803 selected F3 subsequently advanced through unselected single seed descent (SSD). In parallel, seeds of each lineage were planted in a greenhouse without vernalization so as to be able to identify and remove those families that had the spring growth habit. In the next phase approximately 600 F4 will be divided into two equal populations that will be screened respectively for SNB (one isolate) and tan spot (mixed inoculum of five races). The most resistant/insensitive plants will be kept and allowed to self in order to obtain F4:5 inbred lines. Selected F4:5 lines from the two disease groups plus controls will be evaluated as a single group (replicated trial) with individual isolates/races and toxins to identify the best lines which will then be used as parents. The same material will also be field planted and evaluated for winter-survival.
Attempt to identify additional, potentially diverse and useful variation for resistance/susceptibility to tan spot and SNB that can be utilized for parent selection and pre-breeding: A collection of 50 genotypes are being evaluated as additional sources of resistance to tan spot and SNB. Lines developed from these will be used as male parents in future crossing blocks. The 50 lines include the follow-ing: Twenty three lines that are either F4:6 SSD derived inbred lines or DH lines that derive from two crosses, i.e. cross 11M225 = RWG10/Jerry (21 lines) and cross 11M237 = RWG28/Norstar. Lines RWG10 and RWG28 are spring wheats with pyramided resistance to FHB, tan spot and SNB developed by Dr. Steven Xu (USDA–ARS, Northern Crop Science Laboratory, Fargo). The genes present in RWG10 (pedigree = BG282/3*Alsen) include tsn1, snn2, QTs.fcu-1BS, and Fhb1. BG290 (pedigree = BG290/3*Alsen) has the same genes as RWG10, plus an additional tan spot insensitivity QTL, i.e. QTs.fcu-3BL. The selections showed good winter survival in 2014 and each has Fhb1, yet they were not tested for the presence of tan spot or SNB insensitivity. Another ten lines were obtained from Dr Art Klatt (Plant and Soil Sciences, Oklahoma State
University). These are derivatives from crosses between hard red spring and synthetic wheat. The synthetics have an accession of Aegilops tauschii in their pedigrees and were selected based on their resistance to tan spot (field). Five winter wheat lines of international origin (Chile, France, Belgium, Sweden and Bosnia-Herzegovina) that were reported to be resistant to tan spot are also included. The remaining lines constitute selections from the NDSU HRWW breeding program that have good winter survival as well as FHB and BLS resistance.
Preparation for making the third cross (January/Feb-ruary, 2015): Male and female populations have been planted and vernalized since October 2014 in preparation for a third set of crosses. (a) The F1 female component derive from the 2014 RMS crossing block and will be se-lected following seedling inoculation and marker screening for the presence of three leaf rust resistance genes, four stem rust resistance genes plus Fhb1. (b) The new male parents will include winter-hardy cross and backcross de-rivatives with the following genes: Lr19, Lr34, Lr46, Lr50, Lr51, Lr53, Lr56, Lr62 and Lr68 (leaf rust); Sr2, Sr22, Sr26, Sr35, Sr39, and Sr50 (stem rust); Fhb1, Fhb5A (FHB); unknown, but strong resistance to BLS (field-selected, 2 sources); tan spot and SNB resistance/insen-sitivity (3 sources). Marker-aided screening of this material will begin in December 2014 and will be extended to also include additional leaf and stem rust resistance genes.
Application and Use
The (pre-breeding) population will be continuously en-riched with respect to useful disease resistance and adap-tation genes. Following each (annual) selection cycle the best male-fertile F2 plants will be harvested separately and the F3 field planted for continued inbreeding and selection. In this manner new and diverse segregating families will be established each year. Superior inbred lines selected in the F5 to F7 will be utilized in the crossing block of the main breeding program and will also be evaluated further for possible commercialization.
Economic Benefit to a Typical 500 Acre Wheat Enterprise:
The disease-causing pathogens targeted in the project annually cause significant wheat yield losses in the North-ern Great Plains and even modest changes in the average level of resistance in new cultivars will be of considerable benefit to producers. The targeted diseases include some that are notoriously difficult to breed resistance for (for ex-ample tan spot, bacterial leaf streak, SNB and FHB) since resistance/insensitivity is based on numerous quantitative trait loci each making only a small contribution to the total resistance phenotype.
continued on page 64

Page 64
The project aims to assemble a wide spectrum of useful known and new resistance and adaptation genes through pre-breeding in winter-hardy genetic backgrounds. The majority of the target genes are not currently available in the HRWW primary breeding pool. Pre-breeding through recurrent selection is being applied to gradually improve the general genetic background in which the newly intro-duced genes occur and to concentrate/assemble them into more complex combinations that will be more useful in pedigree breeding. This will make it possible to also develop new varieties with better resistance gene combi-nations and yield stability.
Related Research (effort)
A hard red winter wheat pedigree breeding program was initiated at NDSU during 2011. Annually, 500-700 new crosses are being made among winter wheat parents. A primary aim is to broaden the spectrum of disease re-sistance genes available for varietal development. Many of the known genes for resistance to the rusts, FHB, tan spot, SNB and BLS are not available in winter-hardy genetic backgrounds that are adapted to North Dakota. Furthermore the resistance genes often occur singly in very diverse and poorly adapted backgrounds making it even more difficult to combine multiple genes in a single line. This pre-breeding program is meant to supplement and facilitate the pedigree breeding effort.
Recommended Future Research:
a. Continue to enrich the population with new resistance genes and increase the frequencies of those genes through recurrent selection. b. Develop and field test inbred lines derived from the male F1 of each crossing cycle.c. Evaluate the possibility to implement genomic selection for the numerous disease resistance genes, in particular, the many QTL associated with resistance to the necrotrophic pathogens.
continued from page 63
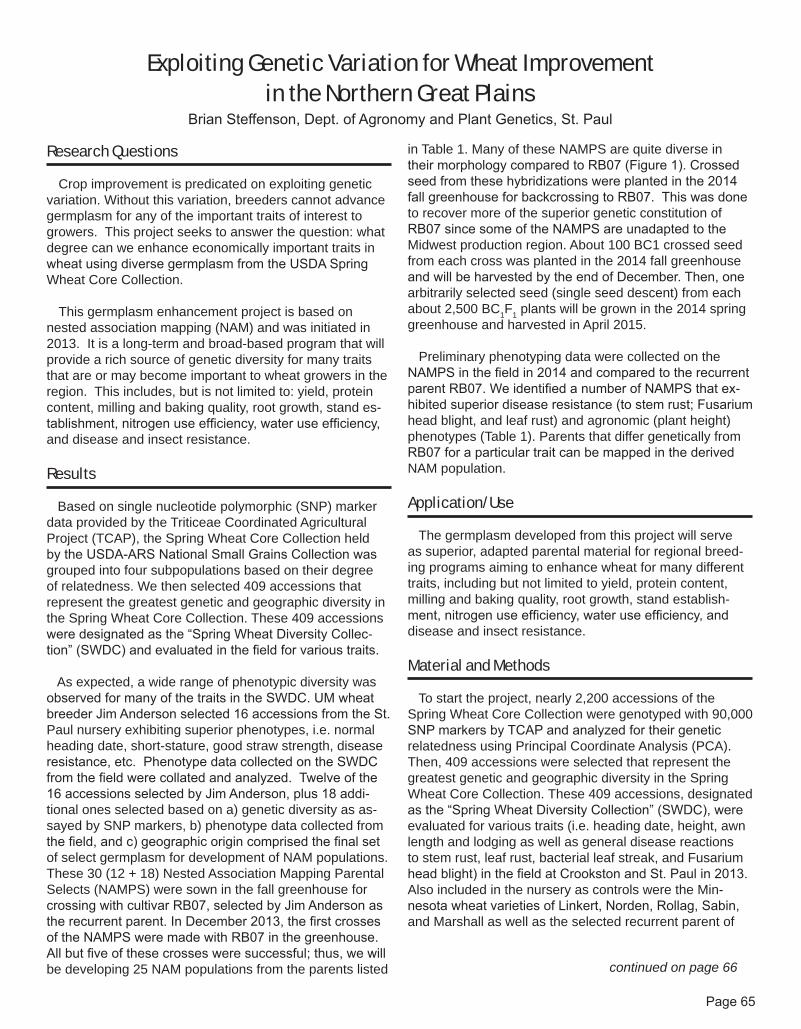
Page 65
Research Questions
Crop improvement is predicated on exploiting genetic variation. Without this variation, breeders cannot advance germplasm for any of the important traits of interest to growers. This project seeks to answer the question: what degree can we enhance economically important traits in wheat using diverse germplasm from the USDA Spring Wheat Core Collection.
This germplasm enhancement project is based on nested association mapping (NAM) and was initiated in 2013. It is a long-term and broad-based program that will provide a rich source of genetic diversity for many traits that are or may become important to wheat growers in the region. This includes, but is not limited to: yield, protein content, milling and baking quality, root growth, stand es-tablishment, nitrogen use efficiency, water use efficiency, and disease and insect resistance.
Results
Based on single nucleotide polymorphic (SNP) marker data provided by the Triticeae Coordinated Agricultural Project (TCAP), the Spring Wheat Core Collection held by the USDA-ARS National Small Grains Collection was grouped into four subpopulations based on their degree of relatedness. We then selected 409 accessions that represent the greatest genetic and geographic diversity in the Spring Wheat Core Collection. These 409 accessions were designated as the “Spring Wheat Diversity Collec-tion” (SWDC) and evaluated in the field for various traits.
As expected, a wide range of phenotypic diversity was observed for many of the traits in the SWDC. UM wheat breeder Jim Anderson selected 16 accessions from the St. Paul nursery exhibiting superior phenotypes, i.e. normal heading date, short-stature, good straw strength, disease resistance, etc. Phenotype data collected on the SWDC from the field were collated and analyzed. Twelve of the 16 accessions selected by Jim Anderson, plus 18 addi-tional ones selected based on a) genetic diversity as as-sayed by SNP markers, b) phenotype data collected from the field, and c) geographic origin comprised the final set of select germplasm for development of NAM populations. These 30 (12 + 18) Nested Association Mapping Parental Selects (NAMPS) were sown in the fall greenhouse for crossing with cultivar RB07, selected by Jim Anderson as the recurrent parent. In December 2013, the first crosses of the NAMPS were made with RB07 in the greenhouse. All but five of these crosses were successful; thus, we will be developing 25 NAM populations from the parents listed
in Table 1. Many of these NAMPS are quite diverse in their morphology compared to RB07 (Figure 1). Crossed seed from these hybridizations were planted in the 2014 fall greenhouse for backcrossing to RB07. This was done to recover more of the superior genetic constitution of RB07 since some of the NAMPS are unadapted to the Midwest production region. About 100 BC1 crossed seed from each cross was planted in the 2014 fall greenhouse and will be harvested by the end of December. Then, one arbitrarily selected seed (single seed descent) from each about 2,500 BC1F1 plants will be grown in the 2014 spring greenhouse and harvested in April 2015.
Preliminary phenotyping data were collected on the NAMPS in the field in 2014 and compared to the recurrent parent RB07. We identified a number of NAMPS that ex-hibited superior disease resistance (to stem rust; Fusarium head blight, and leaf rust) and agronomic (plant height) phenotypes (Table 1). Parents that differ genetically from RB07 for a particular trait can be mapped in the derived NAM population.
Application/Use
The germplasm developed from this project will serve as superior, adapted parental material for regional breed-ing programs aiming to enhance wheat for many different traits, including but not limited to yield, protein content, milling and baking quality, root growth, stand establish-ment, nitrogen use efficiency, water use efficiency, and disease and insect resistance.
Material and Methods
To start the project, nearly 2,200 accessions of the Spring Wheat Core Collection were genotyped with 90,000 SNP markers by TCAP and analyzed for their genetic relatedness using Principal Coordinate Analysis (PCA). Then, 409 accessions were selected that represent the greatest genetic and geographic diversity in the Spring Wheat Core Collection. These 409 accessions, designated as the “Spring Wheat Diversity Collection” (SWDC), were evaluated for various traits (i.e. heading date, height, awn length and lodging as well as general disease reactions to stem rust, leaf rust, bacterial leaf streak, and Fusarium head blight) in the field at Crookston and St. Paul in 2013. Also included in the nursery as controls were the Min-nesota wheat varieties of Linkert, Norden, Rollag, Sabin, and Marshall as well as the selected recurrent parent of
Exploiting Genetic Variation for Wheat Improvement in the Northern Great Plains
Brian Steffenson, Dept. of Agronomy and Plant Genetics, St. Paul
continued on page 66
Page 66
RB07. In the end, 30 accessions were selected for NAM population development based on: a) genetic diversity as assayed by SNP markers, b) phenotype data collected from the field, and c) geographic origin. NAM population development was started with the first cross of these 30 select lines to the recurrent parent RB07. All but five of these crosses were successful. Thus, the final project will include 25 NAM populations. F1’s from the first crosses were backcrossed to RB07 to recover more of the superior genetic constitution of recurrent parent since some of the NAMPS are unadapted to the Midwest production region. About 100 BC1 crossed seeds from each cross were planted in the 2014 fall greenhouse and will be harvested by the end of December. We will continue to advance these populations over several additional generations to achieve greater homozygosity, which is required for future genotyping and phenotyping.
Economic Benefit to a Typical 500 Acre Wheat Enterprise
Cultivars bred with one or more of the enhanced traits derived from the NAM populations will increase profitability for wheat producers in the region. It is important to note that this pre-breeding project has a longer-term horizon for results. In this respect, it is similar to breeding programs since it will take several years before direct economic benefits will be realized by growers.
Related Research (effort)
As the NAM populations are developed, we will evalu-ate them for many different traits of importance to regional wheat producers, including agronomic traits (heading date, height, yield, lodging, etc.), milling and baking quality (flour yield, protein, absorption, mixing time, loaf volume, etc.), and disease resistance (rusts, root rots, bacterial leaf streak, etc.). Other colleagues in the region also have expressed a strong interest in evaluating the NAM popula-tions for specific traits of importance to their programs. Ad-ditionally, to effectively map and transfer genes controlling traits in the NAM populations, genotyping must be done. Currently, genotyping by sequencing (GBS) is the best method for achieving a sufficiently large number of mark-ers for a reasonable cost. I will be seeking other sources of funding to conduct GBS on the NAM populations.
Recommended Future Research
In order to fully realize the great potential of NAM popu-lations for enhancing wheat germplasm in the northern Great Plains region, the full course of population develop-ment must be followed. The following scheme would be used to develop the NAM populations before advanced homozygous seed stocks are available for multiple trait evaluation.
Revised Timetable for Nested Association Mapping Population Development of Wheat
2013 Fall GH: -- Plant accessions in August-September, make crosses
to RB07 in November and harvest crossed (F1) seed in December. (Status: Completed)
2014 Winter GH: -- Plant crossed (F1) seed in late December-early Janu-
ary, make backcrosses to RB07 in March, and harvest BC1 crossed seed in April. (Status: Completed)
-- Establish a genetically pure seed increase of the original 25 NAM parents. (Status: Completed)
2014 Summer field: -- Plant BC1 crossed seed from each cross combination
in the field at St. Paul in April (Status: Postponed until fall greenhouse season to ensure no populations are lost due to weather-related calamities).
-- Disease assessments of original 25 NAM parents. (Status: Completed)
2014 Fall GH: -- Plant BC1 crossed seed from each cross combination
in the greenhouse and harvest in December. (Status: In progress)
-- Collate and analyze data taken from the field on the NAM parents. (Status: Completed)
2015 Winter GH: -- Plant one arbitrarily selected single seed (for single
seed descent) from each about 2,500 BC1F1 plants and harvest in April (represents 1st selfed generation).
-- Test NAM parents for stem rust reaction at the seedling stage.
-- Seed of NAM parents and RB07 will be distributed to cooperators around the region so they can test them for their traits of interest. Parents that differ from RB07 for a particular trait can be mapped in the derived NAM population.
2015 Summer field: -- Plant BC1F2 seed in St. Paul in April, record agronomic
trait notes from May to July, and harvest in August (2nd selfed generation).
-- Collate all data collected on the NAM parents and RB07 by our cooperators and by us.
2015 Fall GH: -- Plant BC1F3 seed in greenhouse in August-September
and harvest in December (3rd selfed generation).-- Test parents for leaf rust reaction at the seedling
stage. 2016 Winter GH: -- Plant BC1F4 seed in greenhouse in January and
harvest in March (4th selfed generation).
continued from page 65

Page 67
-- Distribute seed of populations of interest to cooperators for their field tests.
2016 Summer field: -- Plant NAM populations (and parents) segregating for
various traits and obtain year 1 phenotype data from the field.
-- Collate all data collected on the NAM populations and parents by our cooperators and by us.
2016 Fall GH: -- Plant BC1F5 seed (5th selfed generation), extract DNA
from seedlings, and perform genotype by sequencing (GBS) if funding can be procured.
-- Plant NAM populations (and parents) segregating for various traits and obtain first experiment phenotype data from the greenhouse.
2016 Winter GH:-- Analyze GBS data for the NAM populations.-- Plant NAM populations (and parents) segregating for
various traits and obtain second experiment phenotype data from the greenhouse.
2017 Summer field: -- Plant NAM populations (and parents) segregating for
various traits and obtain year 2 phenotype data from the field.
-- Collate all data collected on the NAM populations (and parents) by our cooperators and by us.
2017 Fall: -- Analyze data.-- Identify and distribute advanced lines with enhanced
traits to regional breeders for crossing in their programs.
-- Write up manuscripts for publication.-- Continue evaluations of derived materials until variety
candidates are identified.
Figure 1. Diversity of spike types in wheat accessions PI 384403 (top left) and PI 189771 (top right) in comparison with Minnesota wheat cultivar RB07.
Appendix
Appendix continued on page 68

Page 68
continued from page 67
Appendix (continued)
Table 1. Spring wheat core collection accessions selected as parents for development of nested association mapping populations and selected phenotypic data from 2014 at St. Paul and Crookston.
STP SR* STP SR STP FHB CRK, STP
LID ID1 ID2 Origin Race MCC Race QCC LRAve
DiseasePlant
Height003 CItr 14819 Eritrea R R R 3.0 93004 CItr 15006 Nepal S S R 3.5 97005 PI 62364 Venezuela R MR R 3.5 91006 PI 153785 Brazil S MS S 3.0 107008 PI 181458 Finland S MS S 2.0 99009 PI 189771 Tunisia S S S 4.0 94010 PI 193938 Brazil R R S 2.5 119011 PI 199806 Peru S S R 5.0 80012 PI 205714 Peru R R S 1.0 112013 PI 213602 Argentina R R S 3.0 110014 PI 220455 Egypt R R S 2.5 104015 PI 278392 Palestine S S R 3.0 97016 PI 282922 Argentina MR MR R 1.5 109017 PI 344018 Angola R R R 3.0 88018 PI 345693 Belarus S S S 2.5 115020 PI 374254 Mali S S S 4.0 81021 PI 384403 Nigeria S S R 5.0 67022 PI 430750 Yemen MR R R 5.0 80023 PI 449298 Spain R R S 4.0 74024 PI 519465 Zimbabwe R R S 5.0 58025 PI 519580 Chile R R S 4.0 85026 PI 520033 Kenya R R R 3.5 91027 PI 520371 Syria R MR S 4.0 89029 PI 565238 Bolivia R R S 4.5 82030 PI 623147 Iran S S S 4.0 110P1 RB07 RB07 USA R R R 2.5 86LID=Lab identification number; ID1-ID2=Cereal Investigation number for Triticum or Plant Introduction number; Origin=Country of origin; STP SR=Stem rust reaction at St. Paul to races MCCF or QCCJ; LR=Leaf rust reaction at St. Paul; FHB CRK=Fusarium head blight reaction at Crookston; Plant heights at St. Paul are in centimeters.
R=Resistant; MR=Moderately Resistant; MS=Moderately Susceptible and S=Susceptible
FHB rating scale is 1=most resistant and 5=most susceptible
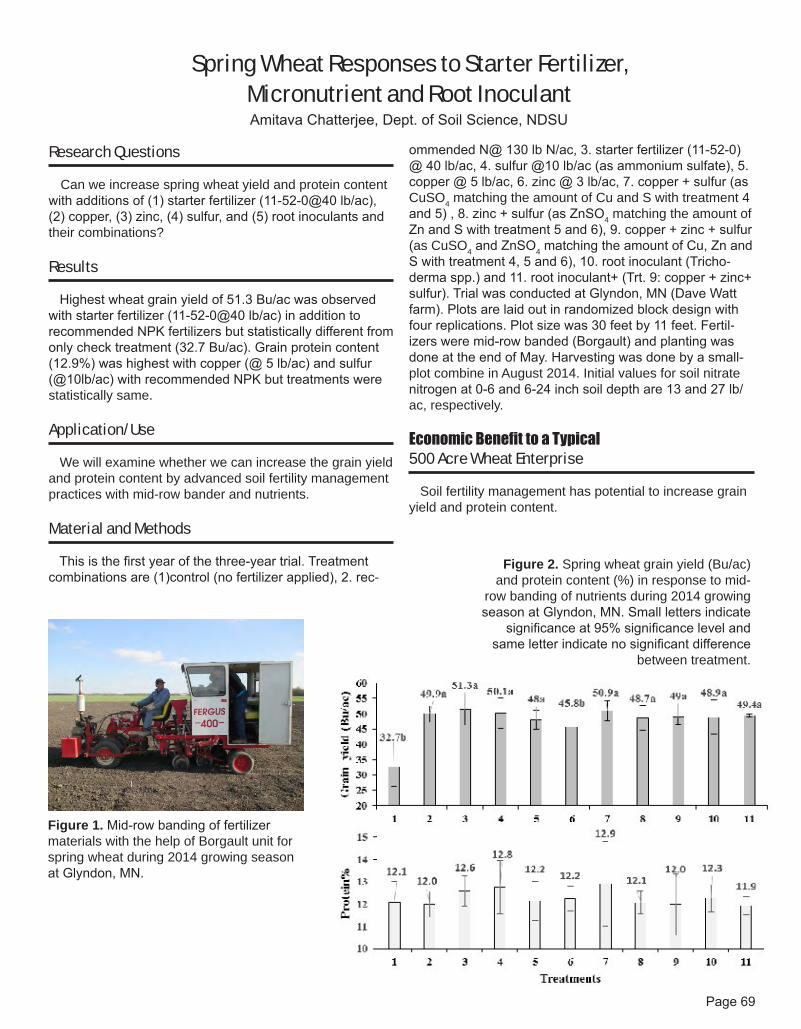
Page 69
Research Questions
Can we increase spring wheat yield and protein content with additions of (1) starter fertilizer (11-52-0@40 lb/ac), (2) copper, (3) zinc, (4) sulfur, and (5) root inoculants and their combinations?
Results
Highest wheat grain yield of 51.3 Bu/ac was observed with starter fertilizer (11-52-0@40 lb/ac) in addition to recommended NPK fertilizers but statistically different from only check treatment (32.7 Bu/ac). Grain protein content (12.9%) was highest with copper (@ 5 lb/ac) and sulfur (@10lb/ac) with recommended NPK but treatments were statistically same.
Application/Use
We will examine whether we can increase the grain yield and protein content by advanced soil fertility management practices with mid-row bander and nutrients.
Material and Methods
This is the first year of the three-year trial. Treatment combinations are (1)control (no fertilizer applied), 2. rec-
Spring Wheat Responses to Starter Fertilizer, Micronutrient and Root InoculantAmitava Chatterjee, Dept. of Soil Science, NDSU
Figure 1. Mid-row banding of fertilizer materials with the help of Borgault unit for spring wheat during 2014 growing season at Glyndon, MN.
ommended N@ 130 lb N/ac, 3. starter fertilizer (11-52-0) @ 40 lb/ac, 4. sulfur @10 lb/ac (as ammonium sulfate), 5. copper @ 5 lb/ac, 6. zinc @ 3 lb/ac, 7. copper + sulfur (as CuSO4 matching the amount of Cu and S with treatment 4 and 5) , 8. zinc + sulfur (as ZnSO4 matching the amount of Zn and S with treatment 5 and 6), 9. copper + zinc + sulfur (as CuSO4 and ZnSO4 matching the amount of Cu, Zn and S with treatment 4, 5 and 6), 10. root inoculant (Tricho-derma spp.) and 11. root inoculant+ (Trt. 9: copper + zinc+ sulfur). Trial was conducted at Glyndon, MN (Dave Watt farm). Plots are laid out in randomized block design with four replications. Plot size was 30 feet by 11 feet. Fertil-izers were mid-row banded (Borgault) and planting was done at the end of May. Harvesting was done by a small-plot combine in August 2014. Initial values for soil nitrate nitrogen at 0-6 and 6-24 inch soil depth are 13 and 27 lb/ac, respectively.
Economic Benefit to a Typical 500 Acre Wheat Enterprise
Soil fertility management has potential to increase grain yield and protein content.
Figure 2. Spring wheat grain yield (Bu/ac) and protein content (%) in response to mid-
row banding of nutrients during 2014 growing season at Glyndon, MN. Small letters indicate
significance at 95% significance level and same letter indicate no significant difference
between treatment.

Page 70
Research Questions
Complete resistance to Fusarium Head Blight (FHB) is un-known, yet genetic variability for resistance is well document-ed. Steady progress toward increasing resistance levels has been demonstrated by breeding programs through the imple-mentation of largely repeatable FHB screening procedures. Breeding programs must sustain efforts to simultaneously select resistant materials with desirable agronomic character-istics. The objective of this program is to use traditional plant breeding and selection techniques to develop hard spring wheat germplasm and cultivars that possess agronomic char-acteristics worthy of release in addition to acceptable levels of FHB resistance.
Results
Entries retained in the advanced yield trial (AYT) are thought to be at least moderately resistant to FHB. Those that do not perform adequately are generally discarded after the first year of AYT observation. 2014 AYT results are pre-sented in the appendix. Thirty-six experimental breeding lines were tested along with twelve check cultivars during the 2014 growing season. Of the thirty-six experimental lines, sev-enteen had FHB disease index (DIS) values that were less than the test average. Ten of these seventeen entries also had Fusarium damaged kernel (FDK) values that were below average. Among these ten, seven produced more grain than average and the test weight of six was also heavier than av-erage. One of these six (SD4362)) is presently under consid-eration for release as a new cultivar. Specifically, SD4362 will likely be released this fall and be made available to Certified seed producers in spring 2015.
Application/Use
With the progression of time, increases in FHB resistance levels should help to prevent devastating loses to growers caused by severe FHB outbreaks.
Material and Methods
Focused efforts to increase resistance began within this program after the 1993 FHB epidemic in the spring wheat production region. Both mist-irrigated greenhouse and field screening nurseries were established and disease evaluation methods were developed. Breeding materials are evaluated for FHB resistance using three generations per year: two in the greenhouse and one in the field. We have the capacity to screen 4,500 individual hills in the greenhouse. We also have 4 acres in the field under mist-irrigation. Both the field and greenhouse nurseries are inoculated with grain spawn (corn that is infested with the causal fungus) and spore
suspensions. Mist-irrigation is used to provide a favorable environment for infection. Approximately 25 percent of the experimental populations possess Fhb1 as a source of resistance. Most of what remains are crosses with various “field resistant” advanced breeding lines. Experimental materials are advanced through the program in the follow-ing fashion;Year 1 Field Space planted F2 populationsYear 1 Fall greenhouse F2:3 hillsYear 1 Spring greenhouse F3:4 hillsYear 2 Field F4:5 progeny rowsYear 2 Off-season Nursery F5:6 progeny rowsYear 3 Field F5:7 Yield Trials (1 replication, 2 locations)Year 4 Field F5:8 Yield Trials (2 replications, 5 locations)Year 5 Field Advanced Yield Trials (3 reps, 8 locations)
F2 populations are planted in the field and individual plants are selected. These are advanced to the fall greenhouse where seed from each plant is sown as individual F2:3 hills and evaluated for FHB resistance. Four plants from each of the top 25% of the hills are advanced to the spring greenhouse. They are sown as individual F3:4 hills and evaluated for FHB resistance. Those with FHB resistance nearly equal to or better than ‘Brick’ are advanced to the mist-irrigated field nursery as F4:5 progeny rows. They are evaluated again for resistance and general agronomic performance. Plants are selected within the superior rows and sent to New Zealand as F5:6 progeny rows for seed increase. A portion of seed from each selected plant is also grown in the fall greenhouse to confirm its resistance. If the FHB resistance of an F5:6 line is confirmed, then the respective progeny row is harvested in New Zealand. In the following South Dakota field season, the selected lines are tested in a two replication, multi-location yield trial. Those that have agronomic performance and yield similar to cur-rent cultivars are included in more advanced, multi-loca-tion, replicated yield trials the following year. In year 5, lines advanced through this portion of the program are included in the AYT along with entries from the traditional portion of the program. Performance data with respect to DIS and FDK, along with agronomic potential from the 2014 AYT are presented in Table 1 of the appendix.
Economic Benefit to a Typical 500 Acre Wheat Enterprise
The presence of FHB inoculum within fields and favor-able weather conditions are just two factors that heavily in-fluence whether this disease will become problematic. Im-mediate economic benefits are therefore difficult to assess. When conditions become favorable for disease presence, however, cultivars with elevated FHB resistance levels can help to reduce potentially serious losses for growers.
Accelerated Breeding for Resistance to Fusarium Head BlightKarl Glover, Plant Sciences, South Dakota State University
2014 RESEARCH REPORT

Page 71
ENTRY
FHBDIS
INDEX
TOMB-STONE
(%)
GRAINYIELD
(BU/AC)
TESTWEIGHT(LB/BU)
GRAINPROTEIN
(%)
HEADDATE
(D > 6/1)
PLANTHEIGHT
(INCHES)
SD4511 15.56 23.67 55.54 61.38 14.90 30.17 46.83
SD4383 15.59 37.50 59.10 58.62 14.75 24.83 38.98
FOREFRONT 15.92 33.33 59.01 60.30 14.73 26.00 42.92
BRICK 16.36 28.00 56.84 60.85 14.90 23.06 40.26
SD4472 16.51 42.50 56.00 59.16 14.89 26.28 38.37
SD4362 17.99 28.33 58.13 60.64 14.87 23.33 42.18
SD4321 18.17 27.83 52.91 59.08 16.27 25.56 41.35
SD4393 18.61 37.50 57.84 59.65 15.00 27.22 37.69
SD4450 18.69 36.67 55.71 60.10 14.95 25.22 40.11
SD4330 18.70 35.33 55.24 60.98 15.30 27.00 42.69
SD4299 19.09 34.17 57.67 59.47 15.07 31.72 38.98
SD4501 19.09 40.83 50.96 59.90 16.04 26.61 40.14
SD4514 19.13 29.50 56.31 60.65 15.12 29.56 44.10
SD4471 19.50 34.50 57.70 59.23 14.42 26.22 39.94
SD4493 20.12 39.17 53.43 59.33 14.94 26.89 37.26
SD4451 20.25 50.00 56.69 59.94 15.05 25.89 39.43
PREVAIL 21.32 35.00 61.21 59.55 14.09 28.83 39.43
SD4416 21.65 30.83 54.84 59.87 15.09 28.00 39.51
SD4470 22.07 22.83 52.76 58.67 14.66 25.78 39.66
STEELE-ND 22.63 42.50 51.14 58.97 15.00 28.11 40.06
SD4517 22.67 40.83 50.50 57.82 15.23 27.06 38.65
SD4400 22.82 33.33 53.99 59.37 14.83 29.61 43.62
FALLER 22.92 36.17 60.30 59.91 13.90 30.39 40.11
SD4543 23.08 30.00 54.59 60.21 14.94 28.00 43.57
SD4496 23.11 27.00 54.96 59.51 15.24 25.72 42.56
SD4539 23.13 39.17 54.52 59.40 14.80 29.61 42.69
SD4506 23.91 40.83 51.84 60.02 15.18 28.33 43.90
SD4469 23.96 25.33 54.10 58.65 14.78 26.78 41.22
SD4492 24.05 37.00 53.68 60.19 14.70 24.44 41.02
SD4537 24.17 37.50 58.13 60.70 14.80 29.44 40.24
SD4403 24.23 28.33 55.45 59.95 15.14 29.72 40.52
ADVANCE 24.35 32.50 55.41 59.62 14.28 29.78 38.62
SD4520 24.35 30.33 50.80 59.98 14.77 31.44 43.70
SD4515 24.58 40.33 54.33 59.21 15.48 27.06 39.13
BRIGGS 24.65 44.17 51.13 58.28 15.10 26.56 40.14
SD4546 24.99 45.00 56.65 61.17 15.10 23.94 40.16
SD4477 25.02 37.50 57.59 59.32 15.08 28.50 37.29
SELECT 25.33 45.33 55.36 60.08 14.67 24.61 40.74
SD4532 25.53 49.17 53.26 60.10 14.55 27.44 41.98
SD4529 26.63 37.50 54.03 59.76 15.30 27.94 42.23
GRANGER 26.93 50.00 52.62 59.30 14.78 28.28 44.10
OXEN 27.30 51.67 51.72 56.54 14.78 27.44 36.98
TRAVERSE 27.31 47.50 57.99 56.71 14.43 26.89 41.78
SD4465 27.87 38.33 57.63 59.64 14.66 27.22 39.61
SD4548 28.00 44.17 46.62 60.66 16.10 29.22 40.42
SD4524 29.63 40.83 57.87 59.43 14.00 27.50 39.51
SD4518 30.45 51.67 48.18 59.40 15.13 29.00 41.10
KNUDSON 30.61 44.17 51.96 58.78 14.20 30.83 37.21
MEAN 22.68 37.41 54.88 59.58 14.92 27.48 40.68
lsd (0.05) 6.24 11.54 1.47 0.30 0.19 0.80 0.91
cv (%) 17.40 20.02 5.59 1.62 3.12 7.48 5.24
Table 1. South Dakota State University advanced yield trial spring wheat entries ranked according to FHB disease index values (lowest to highest – collected at Brookings) presented along with agronomic data obtained from three replication tests conducted at eight test environments in 2014
Page 72
Research Questions
What is the value of nitrogen stabilizing technologies on nitrogen efficiency when applied in the fall?
What amount of ESN can safely be placed with spring wheat seed at the time of planting?
Results
Experiments were conducted in three locations. At the Prosper site, the fall application treatments were lost so we basically have two locations with the full set of treat-ments. The two locations in MN varied significantly in their overall yield and protein with Red Lake Falls averaging 54.8 bu/a and 13.9% protein and Argyle averaging 97.6 bu/a and 12.1% protein. Averaged over the two sites, when 100% fall applied ESN was compared to 100% fall applied urea, yields were only slightly greater but the protein content of the grain was a 1.5% higher. Of the treatments with 100% the N at Argyle (the highest yielding site), the highest yield was obtained with 100% ESN ap-plied with the seed in the spring. Proteins with spring ap-plied treatments were slightly higher than will fall applied treatments. Spring applied Instinct did not improved yield or protein compared to urea alone but with applications it appeared to improve protein. The data also suggests that it is relatively safe to place ESN with seed up to 90 lbs N. Urea can be damaging to plant stands at about 50 lbs N, though in some cases higher rates could be used safely. Additional research is needed to verify the potential value of these N stabilizers on spring wheat yield and protein.
Application/Use
These results are preliminary. Therefore, we are not comfortable in recommending any of the treatments in-cluding in the research. N extenders in the environments where this research was conducted probably did not im-prove yield and protein enough to cover their cost, at least not consistently. Therefore, additional focused research on key treatments in the future, should provide a way forward in developing an useful recommendation. Applying ESN in the fall looks promising and may be an option that would be attractive to growers. The research proposed for 2015 will focus on this and will broaden the soil types where the research is conducted. Perhaps one recommendation that could be made at this point is that if a grower wishes to apply some of his fertilizer with his seed at planting, using ESN would be a safe way to deliver this fertilizer.
Material and Methods
Experiments were established in three locations: Red Lake Falls, Argyle and Prosper. These experiments were replicated four times. The following treatments were in-cluded (90 lb was the 100% rate): 0-Check50% Optimal N Rate-100% ESN50% Optimal N Rate-75:25 ESN:urea50% Optimal N Rate-50:50 ESN:urea75% Optimal N Rate-100% ESN75% Optimal N Rate-75:25 ESN:urea75% Optimal N Rate-50:50 ESN:urea100% Optimal N Rate-100% ESN100% Optimal N Rate-75:25 ESN:urea100% Optimal N Rate-50:50 ESN:urea125% Optimal N Rate-100% ESN125% Optimal N Rate-75:25 ESN:urea125% Optimal N Rate-50:50 ESN:ureaFALL-100% Optimal N Rate Broadcast-100% ESNFALL-100% Optimal N Rate Broadcast-100% UreaSPRING- 50% ESN : 50% Urea Broadcast Late Pre or at seedingSPRING-100% Optimal N Rate Broadcast-100% UreaSPRING-50% Urea:50% UAN at 4 leaf stageSPRING-100% Optimal N Rate Broadcast-100% InstinctFALL-100% Optimal N Rate Broadcast-50:50 ESN:UreaFALL-100% Optimal N Rate Broadcast-75:25 ESN:UreaFALL-100% Optimal N Rate Broadcast-100% InstinctFALL-50% Optimal N Rate Broadcast-100% ESNFALL-50% Optimal N Rate Broadcast-100% Urea
Yield, test weight, and protein were measure at harvest.
Economic Benefit to a Typical 500 Acre Wheat Enterprise
Since these results are preliminary, we are not prepared to estimate an economic benefit.
Recommended Future Research
We propose to focus on fall applications of ESN in our future research. It would also be interesting to look at an increased rate of Instinct.
Strategies for Meeting N Requirements of Wheat with New Fertilizer and Fertilizer Additives
Joel Ransom, Dept. of Plant Sciences, NDSU
2014 RESEARCH REPORT

Page 73
Research Questions
The objective of this project was to identify optimum nitrogen (N) fertilizer management practices that can maximize hard red spring wheat (HRSW) grain yield and protein concentration; and subsequently net economical profits to producers.
Results
In this trial, we wanted to determine the effects of apply-ing 30 lbs. N ac-1 as a foliar application at either the tiller or immediately after the anthesis growth stages. This N would be in addition to the pre-plant N applied. Opti-mum N was determined as 150 lbs. N ac-1 (soil residual nitrate-N plus 127 lbs. fertilizer N). To test whether any effect of the foliar N was due to its application time or the additional 30 lbs. N, an additional treatment was estab-lished that supplied optimal N plus 30 lbs. N ac-1 applied pre-plant with no additional foliar N. There was no differ-ence in grain yield, grain protein, or test weight between the optimal pre-plant N and the optimal plus 30 lbs. N pre-plant N treatments. This confirmed our selection of the optimal N rate and allows us to focus our attention on the foliar application of N. Subsequent statistical analyses and discussion dropped the optimal plus 30 lbs. pre-plant N treatment.
Applying fertilizer N did increase grain yield and grain protein compared to the 0 N control (Table 1). However, there were no significant differences in these variables whether pre-plant fertilizer N was supplied as PCU or urea (Table 1). Grain yields were 44, 72, and 73 bu ac-1 in the control, PCU and urea treatments, respectively. Grain proteins were 12.2, 13.3 and 13.1% in the control, PCU, and urea treatments, respectively. Grain test weight was not affected by the source of fertilizer N, but the applica-tion of fertilizer N increased test weight relative to the 0 N control (Table 1). As originally designed, this trial was to include a normal spring time applied pre-plant fertilizer N application with normal planting and a later planting. An additional set of treatments included late season fertilizer application and planting. This was to replicate the potential of weather conditions delaying planting after the fertilizer was applied or perhaps delaying both fertilization and planting. Unfor-tunately in 2014, everything was delayed due to weather so the normal planting in this trial was actually May 21, which would typically have been close to our late planting
and fertilizing target. So, instead of waiting 4 weeks for the delayed, or late, planting and fertilizing, as originally specified, the late planting and fertilization happened on June 9.
Plant stand count was measured at the three leaf stage, but no significant differences were found among the treatments (Table 1). Whole plant tissue sampling was conducted at soft dough stage to determine if any of the treatments impacted the tissue biomass accumulation or tissue N concentration. Tissue biomass accumulation significantly deceased when planting was delayed whether fertilization was delayed or not compared to normal plant-ing and N fertilization (Fig. 1A). However, we found normal planting and N fertilization had significantly lower tissue N concentration compared to late planting and fertilization treatments (Fig. 1B).
Delayed planting, with or without delayed N fertilization, significantly reduced grain yield and grain test weight, but resulted in significantly greater grain protein (Fig 1C, 1D and 1E). Most of the effects were caused by delayed planting, but delayed fertilization did have some affect (comparisons of treatment 1 and 2 in Fig 1). It suggest that differences found in tissue biomass accumulation and N accumulation at soft dough stage due to delayed plant-ing and delayed N fertilization translated into differences in grain yield and grain protein concentration. Previous research found that cold, dry early season conditions resulted in lower grain yields and higher grain protein when PCU was used as the N source compared to urea (Farmaha and Sims, 2013a, 2013b). One of the questions from those previous trials was whether we would see a similar difference in N sources if the PCU was applied a few weeks prior to when the wheat was planted. In 2014, the wet early season conditions that delayed both fertilizer application and planting apparently neutralized any poten-tial differences between these two N sources.
Thirty pounds of N were applied via foliar applications at tiller or immediately after anthesis. There were no interactions between foliar N or pre-plant N source (Table 1). There was no significant effect of foliar application on stand count and tissue biomass accumulation but it did increase tissue N concentration measured at soft dough stage (Table 1). Timing of foliar application did not make a difference in tissue N concentration (Fig. 2A). Previous re-search found that 30 lbs. N Ac-1 at tillering increased grain yield and at anthesis increased grain protein (Woolfolk et al., 2002; Bly and Woodard, 2003). In this study, grain
Optimum Use of Nitrogen Fertilizers to Maximize Spring Wheat Grain Yield and Protein Concentration
Albert Sims, NWROC, Crookston
2014 RESEARCH REPORT
continued on page 74

Page 74
yield was not affected by an application of N at the tiller growth stage (Fig 2B). There was a slight, but significant decrease, in grain yield when N was applied at the anthe-sis growth stage (Fig 2B). It is suspected that part of this grain yield decline was caused by burning of the upper canopy leaves caused by the foliar N spray. Though the spray was applied during the cooler part of the day, those particular days were quite warm which can enhance leaf burning. Compared to only pre-plant N, foliar N applied at both tiller and anthesis increased grain protein, with the greatest increase occurring with the anthesis application (Fig 2C). Similar results with foliar application rate and timing on hard red spring wheat were observed in South Dakota by Bly and Woodard (2003). There was, however, a slight decline in grain test weight with foliar N application (Fig 2D).
Material and Methods
This experiment was conducted in 2014 at Northwest Research and Outreach Center (NWROC), Crookston, MN. Treatments included two N fertilizer sources- PCU (polymer coated urea) and urea; three pre-plant N ap-plication and planting combinations (normal fertilization and normal planting, normal fertilization and late planting, and late fertilization and late planting), and three foliar N applications (none, tillering, and anthesis). Pre-plant N was 127 lbs. N Ac-1 plus soil residual nitrate-N, which was considered an optimal N rate for this location. Foliar N treatments added an additional 30 lbs. N Ac-1 at either til-lering or anthesis. Two additional treatments were added, a 0 N control and an optimal N plus 30 lbs. N Ac-1 ap-plied pre-plant. In 2014, prolonged wet spring conditions delayed N fertilization and planting. Normal N fertilization and planting was done on 05/21/2014 and delayed N fertilization and planting was done on 06/09/2014. Albany, a high-yielding and low protein cultivar was seeded on 36 plots on 05/21/2014 and on 72 plots at 06/09/2014. Each plot contained 10 seeded rows spaced 6 inches apart and measured 5 ft. wide by 18 ft. in length. Fertilizers were hand broadcasted and incorporated in the soil to a 10 cm depth using a field cultivator. Whole plant samples were collected from each plot (four rows, 3ft. in length) at soft dough growth stage to measure dry biomass accumulation and N concentration. At physiological maturity, plots were harvested using a small plot combine to measure grain yield and protein concentration. Plots seeded earlier were harvested on 08/26/2014 and seeded later were harvested on 09/17/2014.
Economic Benefit to a Typical 500 Acre Wheat Enterprise
This study suggested no yield penalty was realized when PCU was used as the N source when the spring conditions were sufficiently moist that PCU-N was re-leased to the soil. Of course, most growers would not use PCU as the sole source of N because of the risk in yield lag if soil conditions are drier and the extra expense of PCU-N. But, this study did confirm that foliar applications of N can be beneficial to increasing grain protein concen-tration. Whether it is economically beneficial will be deter-mined by the potential low protein discounts and what the yield potential of the crop is. Wiersma and Sims (2014) have developed a decision making tool comparing N costs and protein discounts to help growers make that decision. Unfortunately there is yet a tool developed to diagnose the potential grain protein in time for a foliar N application to be beneficial.
Related Research
The current experiment addresses questions raised based on the findings from our previous experiments (Farmaha and Sims, 2012a and 2012b). We had two separate experiments in 2013 that showed that delayed planting due to the wet spring conditions can significantly reduce grain yield but the amount of loss depends upon how late the crop was planted. 2013 was an abnormal growing season so data from this year alone was not suf-ficient to comment whether the effect of treatments on grain yield and protein concentration was stand alone or was confounded with the environmental issues. Therefore, the current experiment was planned but with few modifica-tions in the treatments.
Recommended Future Research
This experiment should be conducted for one more year and may be under different environments.
continued from page 73
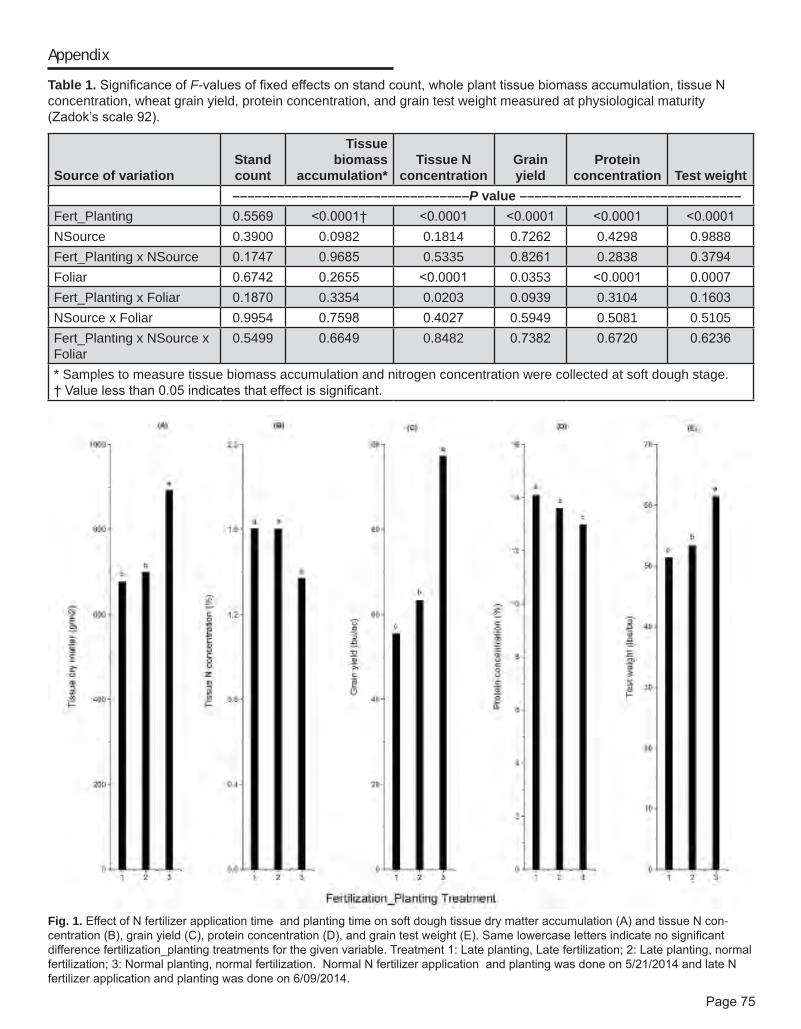
Page 75
Appendix
Source of variationStand count
Tissue biomass
accumulation*Tissue N
concentrationGrain yield
Protein concentration Test weight
––––––––––––––––––––––––––––––––P value ––––––––––––––––––––––––––––––Fert_Planting 0.5569 <0.0001† <0.0001 <0.0001 <0.0001 <0.0001NSource 0.3900 0.0982 0.1814 0.7262 0.4298 0.9888Fert_Planting x NSource 0.1747 0.9685 0.5335 0.8261 0.2838 0.3794Foliar 0.6742 0.2655 <0.0001 0.0353 <0.0001 0.0007Fert_Planting x Foliar 0.1870 0.3354 0.0203 0.0939 0.3104 0.1603NSource x Foliar 0.9954 0.7598 0.4027 0.5949 0.5081 0.5105Fert_Planting x NSource x Foliar
0.5499 0.6649 0.8482 0.7382 0.6720 0.6236
* Samples to measure tissue biomass accumulation and nitrogen concentration were collected at soft dough stage.† Value less than 0.05 indicates that effect is significant.
Table 1. Significance of F-values of fixed effects on stand count, whole plant tissue biomass accumulation, tissue N concentration, wheat grain yield, protein concentration, and grain test weight measured at physiological maturity (Zadok’s scale 92).
Fig. 1. Effect of N fertilizer application time and planting time on soft dough tissue dry matter accumulation (A) and tissue N con-centration (B), grain yield (C), protein concentration (D), and grain test weight (E). Same lowercase letters indicate no significant difference fertilization_planting treatments for the given variable. Treatment 1: Late planting, Late fertilization; 2: Late planting, normal fertilization; 3: Normal planting, normal fertilization. Normal N fertilizer application and planting was done on 5/21/2014 and late N fertilizer application and planting was done on 6/09/2014.
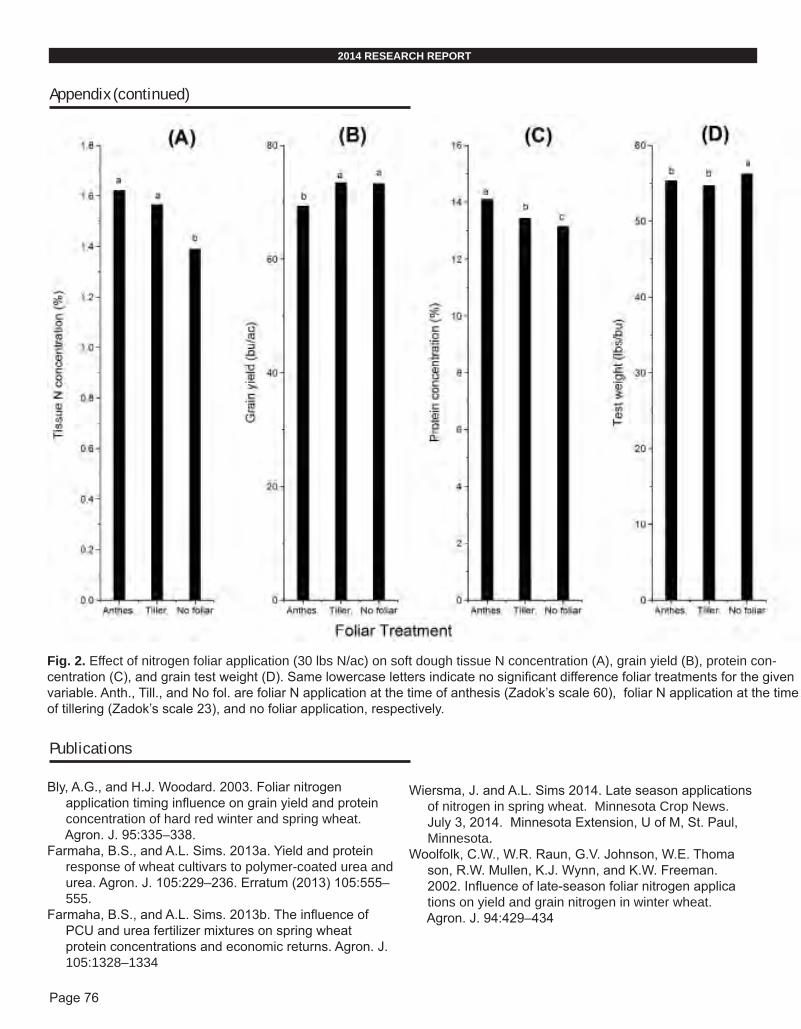
Page 76
2014 RESEARCH REPORT
Fig. 2. Effect of nitrogen foliar application (30 lbs N/ac) on soft dough tissue N concentration (A), grain yield (B), protein con-centration (C), and grain test weight (D). Same lowercase letters indicate no significant difference foliar treatments for the given variable. Anth., Till., and No fol. are foliar N application at the time of anthesis (Zadok’s scale 60), foliar N application at the time of tillering (Zadok’s scale 23), and no foliar application, respectively.
Appendix (continued)
Bly, A.G., and H.J. Woodard. 2003. Foliar nitrogen application timing influence on grain yield and protein concentration of hard red winter and spring wheat. Agron. J. 95:335–338.Farmaha, B.S., and A.L. Sims. 2013a. Yield and protein response of wheat cultivars to polymer-coated urea and urea. Agron. J. 105:229–236. Erratum (2013) 105:555– 555.Farmaha, B.S., and A.L. Sims. 2013b. The influence of PCU and urea fertilizer mixtures on spring wheat protein concentrations and economic returns. Agron. J. 105:1328–1334
Wiersma, J. and A.L. Sims 2014. Late season applications of nitrogen in spring wheat. Minnesota Crop News. July 3, 2014. Minnesota Extension, U of M, St. Paul, Minnesota.Woolfolk, C.W., W.R. Raun, G.V. Johnson, W.E. Thoma son, R.W. Mullen, K.J. Wynn, and K.W. Freeman. 2002. Influence of late-season foliar nitrogen applica tions on yield and grain nitrogen in winter wheat. Agron. J. 94:429–434
Publications

Page 77
Fig. 2. Effect of nitrogen foliar application (30 lbs N/ac) on soft dough tissue N concentration (A), grain yield (B), protein con-centration (C), and grain test weight (D). Same lowercase letters indicate no significant difference foliar treatments for the given variable. Anth., Till., and No fol. are foliar N application at the time of anthesis (Zadok’s scale 60), foliar N application at the time of tillering (Zadok’s scale 23), and no foliar application, respectively.
Research Questions
Colon cancer is the third most common cancer in both men and women. We have recently accumulated results from several animal studies demonstrating that red wheat has a significant ability to reduce colon cancer risk. White wheat, depending on the marker of colon cancer risk used, had ei-ther less ability than red wheat or no ability to reduce cancer risk.
The overall objective of this proposal will be to determine the effect of feeding red wheat and white wheat on risk of colon cancer risk in an animal model, the carcinogen-treated rat. The specific aims will be as follows:
1) To confirm that red wheat reduces the number of pre-cancerous lesions that develop in the colon of
carcinogen-treated rats, particularly in relation to white wheat.
2) To determine whether red wheat reduces the development of cancer stem cells in the colon of carcinogen-treated rats.
Results
The graduate student conducting the study has now acquired the skills that will be used in measuring the pre-cancerous lesions and has begun learning the immunohis-tochemical techniques that will be used in determining the number of cancer stem cells that develop. The 10 week animal feeding trial is concluding now, and tissues are being processed and sent to the histology laboratory for preparation for immunohistochemistry. Counting of pre-cancerous lesions will begin in the next 1-2 weeks. Immunohistochemical detec-tion of cancer stem cellswill begin in 4-6 weeks.
Application/Use
If our hypothesis is correct, that red wheat will reduce co-lonic pre-cancerous lesions and accumulation of cancer stem cells in the colon, this will provide much more convincing evidence that red wheat protects against colon cancer. This message can be used to promote red wheat consumption. Given that currently there is a growing movement promoting consumption of gluten-free (i.e. non-wheat containing) foods, this would provide a strong justification for including red wheat-containing products in the diet.
Material and Methods
We have administered a colon-specific carcinogen (di-methylhydrazine) to three groups of rats (12 per group) and then 4 days later begin feeding one of three diets, as follows: a wheat-free control diet, a diet containing 65% refined red wheat, and a diet containing 65% refined white wheat. After 10 weeks, the rat colons are removed and cleaned. One half the colon (split longitudinally) will be used for counting a common marker of early colon cancer risk, called aberrant crypt foci, under a light microscope by our usual procedure.
The other half will be processed for detection of a stem cell marker. This will be done by immunohistochemistry. Briefly, the colon will be fixed in formalin, embedded in paraffin, and cut into very thin sections (4 µm) en face, which will be mounted on glass slides. The sections on the slide will then be covered with a solution containing an antibody specific for the stem cell marker (called Lgr5), followed by another solu-tion which will cause a color to develop wherever there is an-tibody bound to Lgr5. The amount of color is then measured under a light microscope using image analysis software. If red wheat decreases the amount of color, this indicates that it decreased the number of cancer stem cells that developed in the crypts.
Economic Benefit to a Typical 500 Acre Wheat Enterprise:
If our findings show a reduction in colon cancer risk in our animal model, as hypothesized, this can be used to promote red wheat consumption, and to offer a counter message to those promoting gluten-free diets. This could increase de-mand for red wheat, and thus potentially increase the price of red wheat.
Related Research
We are currently conducting studies examining the effect of vegetables on reducing risk of colon cancer, using a food-borne carcinogen that develops in well-done meat and fish. This carcinogen belongs to a group of compounds referred to as heterocyclic aromatic amines (HAA). Since HAA are present in the diet, they represent a more realistic carcinogen than the carcinogen used in our present project – dimethyl-hydrazine – which is not found in the diet. If our studies with HAA indicate that it is an appropriate carcinogen for use in studies of diet and colon cancer, we would consider using HAA as the colon carcinogen in future studies of the reduc-tion in colon cancer risk with red wheat, in order to provide greater relevance to thestudies.
Recommended Future Research
Unfortunately, human studies of reduction in risk in colon cancer are extremely expensive and difficult, and can only be done using very indirect, and therefore uncertain, markers. Thus, animal studies will continue to be the type of studies that will need to be done. Although most studies of colon cancer in animal models use a chemical carcinogen, such as we are doing, there are genetic models of colon cancer. To further establish the cancer-protecting effect of red wheat, a study using one of these genetic models of colon cancer could be used. Establishing a protective effect of red wheat against colon cancer in both chemically-induced colon cancer and genetically-induced colon cancer would be extremely powerful evidence that red wheat protects against colon cancer.
Reduction in Colon Cancer Risk by Red Wheat ConsumptionDaniel Gallaher, Dept. of Food Science & Nutrition, U of M
2014 RESEARCH REPORT

Page 78
Research Questions
1) Does the application of sulfur (S) increase grain yield and grain protein concentration of hard red spring wheat, and if so, what is the optimal application rate for S?
2) Can plant tissue analysis be used to determine whether hard red spring wheat varieties differ in their po-tential response to S fertilizer?
3) Can S increase the baking quality of break made from hard red spring wheat and is there an impact of S nutrition on the potential production of acrylamide during baking?
Results
The field sites were selected to represent differing conditions that may affect response to S (Table 1). The site at Crookston included a soil with poor drainage and a relatively high concentration of soil organic matter at the soil surface. Past research funded from 2008 to 2009 by the Minnesota Wheat growers found no impact of S on a single variety, Glenn, grown, in Northwest Minnesota. Kimball represented a site with a medium surface soil texture over gravelly subsoil. This site, while higher in organic matter, should have a greater potential to leach sulfate. However, the total amount of sulfate-S in the top two feet was the greatest at Kimball (Table 2). Increased sulfate-s could be due to previous manure application at this site. Kimball was not irrigated thus there were not incidental application of sulfate-S through irrigation water. Staples was irrigated and had the lowest concentration of soil organic matter in the top six inches of soil. Past re-search with corn has shown that response to S can greatly be affected by the amount of sulfate-S applied with irriga-tion water. It was found that as much as 10-15 lbs of S, as sulfate, could be applied on an annual basis depending on the amount of irrigation water applied over the growing season. Increased rainfall in June (Table 1) decreased the need for irrigation until late in the growing season. This could potentially increase the response to fertilizer S at this location. Currently, S fertilizer is only recommended for sandy soils with low concentration of organic matter in the surface soils.
Statistical significance, by location, for spring wheat grain yield, grain protein concentration, and the total amount of protein produced per acre is summarized in Ta-ble 3. As expected, yield differed consistently among the varieties. Faller produced the greatest yield across sites followed by RBO7, Mayville, Glenn, Vantage, and lastly, Select. The only surprise out of the ranking was Glenn which was one of the top yielding varieties at two locations
(Crookston and Staples). Grain protein concentration was greatest for Vantage and Glenn while Faller producing the least. Total protein produced per acre was greatest for the top yielding variety, Faller, and the varieties with the great-est protein (Glenn and Vantage). The only surprise in the site data was the high protein concentrations measured at Staples. We are in the process of analyzing the grain for total nitrogen to determine if the levels produced were as high as measured on the NIR. Higher levels might be expected if nitrate levels in the irrigation water were high enough to continually feed nitrate in the plant at or post anthesis.
The varieties were selected based on flag leaf tissue data collected from the variety trials at anthesis during 2011 and 2012. Selections were made based on variet-ies that tended to have increased concentration in S at sites were S availability appeared to be greater (RB07 and Mayville), varieties that appeared to respond no better or worse than others [average varieties (Select and Glenn)], and varieties that appeared to respond less to increased availability of S (Faller and Vantage). The sets were designed to compare varieties that were higher yield, low protein, and low yield high protein. We quested whether the flag leaf tissue concentration would indicate that a vari-ety is more or less responsive to S.
There was no detectable increase in yield at the Crookston and Kimball locations. Yield data for these locations was analyzed together. Data from Staples were analyzed separately as S increased yield only at Staples. Figure 1 summarizes yield data from Crookston and Kimball while Staples is summarized in Figure 2. We were interested whether an interaction between S and variety would occur across sites to determine if varieties responded differently to fertilizer application. The interac-tion was highly insignificant for all of the locations which indicate that the varieties studied had a similar grain yield response to S at all of the locations. When averaged across varieties, grain yield was increased by 6 bushels per acre (Figure 3) by the lowest rate of S applied (7.5 lbs per acre) which is surprising as our current suggestions for similar soil types is nearly three times that rate. Grain yield was similar between the 7.5 and 15 lb S application rates. One piece of data that has not been considered is the amount of S applied in the irrigation water. A sample has been submitted for analysis but we have not received the data at this time. Once the data is available it may provide information on why a response only occurred to the lowest rate of S. Since irrigation did not begin until July, the amount of S needed to increase yield may have
Variation in Response to Sulfur Among Spring Wheat GenotypesDaniel Kaiser, Department of Soil, Water and Climate, U of M
2014 RESEARCH REPORT

Page 79
been small since the amount taken up is low early in the growing season.
Grain protein concentration was not affected at any location while the total amount of protein produced was increased by S applied at Staples due to the increase in grain yield (data are not shown). The fact that grain protein concentration was not affect is not surprising as it confirms previously collected data. The total concentra-tion of protein is typically affected by nitrogen and not S. We have seen instances where the type of protein in the grain may change due to an application of S but the total concentration remains unchanged. For instance, S containing proteins such as cysteine and methionine can be increased when S is applied relative to other non-S containing proteins. While S can impact nitrogen utiliza-tion in plants the lack of nitrogen deficiency in this study (nitrogen was kept at non-limiting levels) resulted in a low chance for S to affect nitrogen nutrition in the plant. There is no evidence that farmers growing hard red spring wheat should be concerned that S may be limiting protein levels.
Baking quality, amino acid concentration in grain, and grain and flag leaf S concentration measurements were planned for this research. While the data have been collected we still are waiting on analysis to be conducted since most of this work will be funded by in-kind work. A supplemental report will be provided including this data once it is made available for analysis. We anticipated that only the yield and grain protein concentration would be available for the year-end report for the initial funding request.
Application/Use
The data from the first year of this project indicate that some changes may be required to the current fertilizer guidelines for wheat. Changes were made when the Fertilizer Guidelines for Wheat in Minnesota publication was updated in 2012. Some changes included a general framework of S guidelines for eroded low organic matter soils (less than2.0% organic matter in the top six inches). An addition year of data would be beneficial to compare the response that occurred at the Staples location to determine if our current suggestion of 25 lbs of S may be greater than what is required to grow wheat on irrigated sandy soils in Minnesota.
There may be some benefit in baking quality with S. However, until protein premium/discounts reflect qual-ity over the quantity there may be a limited impact to the bottom line of a wheat grower. Since this work was being conducted in-kind at the USDA grain quality lab there was no cost for this work included in the budget of this grant. Previous research has demonstrated benefits of S on bak-ing quality. This study provides a better comparison as it includes multiple varieties.
Our goal for comparing the varieties was to determine if tissue sampling could be used to determine responsive-ness of varieties to S. Since there was no evidence that a variety by S interaction occurred, it is unlikely that the tis-sue data had much value in determining whether S would benefit one variety over another. One caution about this work is that since yield was only affected at one location it is hard to draw hard conclusions unless the effect can be replicated. More locations and one or two additional years of funding would greatly benefit this project to determine if similar effect can be replicated across sites and years. Overall, our data from this study and past research indi-cated that significant caution should be taken when using plant tissue samples for guiding fertilizer application.
Material and Methods
Small plot S fertilization studies will be established alongside selecting spring wheat variety trials. Three loca-tions were studies. Sites at Crookston Kimball were non-irrigated and an irrigated site was established at Staples. Six wheat varieties will be selected using the stability analysis conducted for spring wheat flag leaf tissue among varieties in 2011 and 2012 at 17 locations. Two varieties will be selected that were considered in the high, average, and low response to S categories and that vary in protein and yield potential. The varieties preliminarily selected are Faller, Vantage, Select, Glenn, Mayville, and RB07. Sulfur rates used will be a non-fertilized control (0 lbs S per acre) and rates of 7.5 and 15 lbs of S per acre. Sulfur was applied to the soil surface at seeding. The source of S was granular ammonium sulfate (21-0-0-24). Nitrogen was applied to balance the rate of nitrogen applied with the high rate of ammonium sulfate. Nitrogen, phosphorus, and potassium were kept at non-limiting rates according to current recommendations. Blanket N was split applied at Staples with half of the N applied after seeding prior to emergence and the remaining applied near the boot stage. All S, P and K were applied as a single application prior to or at-seeding (S treatments).
Grain yield was measured for all plots and a sub-sample of grain was collected and will be analyzed for protein, nitrogen, and S concentration. Baking quality and amino acid concentration (asparagine) will be measured to determine potential for acrylamide formation. Acrylamide concentration will not be directly measured. Grain cys-teine and methionine may also be measured to compare with total S uptake. Due to the difficulty of analysis, the amino acid concentration and baking quality data may not be available for the November 15 reporting. The data will be made available to the Minnesota Wheat Research and Communication Council as a supplementary report when fully analyzed.
continued on page 80

Page 80
Economic Benefit to a Typical 500 Acre Wheat Enterprise
Assuming a wheat price of $6 per bushel, the response at Staples would result in an additional $36 per acre in added crop value across the varieties. If S cost was $0.50 per lb of S, the rate needed to increase yield (7.5 lb per acre) would cost a grower $3.75 per acre resulting in a net profit of $32.25 per acre and would total $16,125 for a 500 acre operation. The question remains whether the 7.5 lb rate is needed? Since we did not use a smaller rate it is unclear if application of 5 lb of S would result in the same yield. However, the low cost of the treatment relative to the added value of the crop can easily pay for the addi-tional cost of the fertilizer. When S is deficient, application of S is highly profitable for hard red spring wheat.
Even with the low total cost associated with the rate of S needed to increase yield, if a site is not responsive a grower should highly consider using money intended for S for nitrogen especially in years where yield potential and protein discounts are greater. Since there has been no evidence for increased grain protein due to S applica-tion in several studies dating back to 2008 S should not play a role in making decisions on fertilizer application for increasing grain protein concentration.
Related Research
A S study was concluded in 2009 which was funded by the Minnesota Wheat Growers that studied the effect of S source, rate, and timing for wheat grown on soils with rela-tively high concentration of organic matter. This current study provided supporting data for the previous research but focuses on questions received following the previous study on whether we would expect response to S to be greater for varieties which are greater yielding than Glenn which was used in the previous research. We are also following up on information collected in a study funded in 2011 and 2012 that included a survey of flag leaf tissue nutrient concentration. The current research will deter-
mine if there is any value in tissue concentration data and whether tissue concentration can help predict a varieties responsiveness to a specific fertilizer.
Recommended Future Research
Since we have not been able to consistently detect sig-nificant yield response to S application in hard red spring wheat an additional year or two of follow up research would be beneficial to see if we can replicate responses that occurred at Staples in 2014. In addition, we would like to continue targeting field sites on lower organic mat-ter, eroded, soils to see if we can replicate data collected in corn which suggests soils with less than 3.0% organic matter in the top six inches may be highly responsive to S. Additional years would provide a stronger set of guidelines for when and where to apply S in hard red spring wheat.
Our initial contacts with growers of irrigated wheat also indicate a need to study nitrogen guidelines for irrigated coarse textured soils. While there acreage may be low there is some wheat grown in rotation with other crops on irrigated soils. All of our current research has focused on the primary wheat growing regions in Minnesota which are non-irrigated. A nitrogen study was established at Staples along with the S study in 2014. Additional funding for S research would allow us to also conduct nitrogen studies under irrigation that would provide data for nitrogen guide-lines for irrigated wheat.
Publications
Kaiser, D.E., J.J. Wiersma, and J.A. Anderson. 2014. Genotype and Environment Variation in Elemental Concentration of Spring Wheat Flag Leaves. Agron. J. 106:324-336.
**Paper was a summary of work funding by MN wheat for the 2011 and 2012 growing seasons
Location County Soil Type Soil Texture Seeding Date May June July
Crookston Polk Wheatville Sandy Loam 17-May 2.6 6.8 2.2Kimball Stearns Fairhaven Silt Loam 26-Apr 4.4 7.6 1.9Staples Wadena Verndale Sandy Loam 7-May 3.6 5.9 7.8
Monthly Total Precipitation
Table 1. Trial location, planting information, and monthly total precipitation for spring wheat S rate studies.
-----inches-----
Appendix
continued from page 79
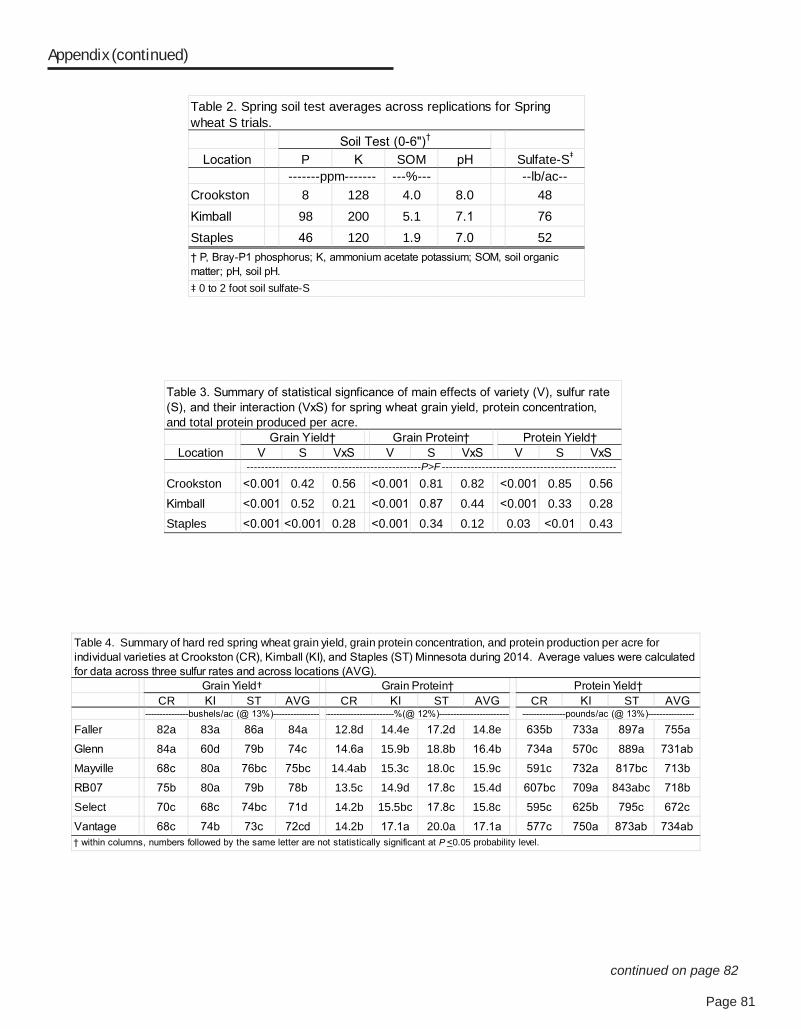
Page 81
Appendix (continued)
Location P K SOM pH Sulfate-S‡
---%--- --lb/ac--Crookston 8 128 4.0 8.0 48Kimball 98 200 5.1 7.1 76Staples 46 120 1.9 7.0 52
Soil Test (0-6")†
-------ppm-------
Table 2. Spring soil test averages across replications for Spring wheat S trials.
† P, Bray-P1 phosphorus; K, ammonium acetate potassium; SOM, soil organic matter; pH, soil pH.‡ 0 to 2 foot soil sulfate-S
Location V S VxS V S VxS V S VxS
Crookston <0.001 0.42 0.56 <0.001 0.81 0.82 <0.001 0.85 0.56Kimball <0.001 0.52 0.21 <0.001 0.87 0.44 <0.001 0.33 0.28Staples <0.001 <0.001 0.28 <0.001 0.34 0.12 0.03 <0.01 0.43
Table 3. Summary of statistical signficance of main effects of variety (V), sulfur rate (S), and their interaction (VxS) for spring wheat grain yield, protein concentration, and total protein produced per acre.
Grain Yield† Grain Protein† Protein Yield†
------------------------------------------------P>F ------------------------------------------------
CR KI ST AVG CR KI ST AVG CR KI ST AVG
Faller 82a 83a 86a 84a 12.8d 14.4e 17.2d 14.8e 635b 733a 897a 755a
Glenn 84a 60d 79b 74c 14.6a 15.9b 18.8b 16.4b 734a 570c 889a 731ab
Mayville 68c 80a 76bc 75bc 14.4ab 15.3c 18.0c 15.9c 591c 732a 817bc 713b
RB07 75b 80a 79b 78b 13.5c 14.9d 17.8c 15.4d 607bc 709a 843abc 718b
Select 70c 68c 74bc 71d 14.2b 15.5bc 17.8c 15.8c 595c 625b 795c 672c
Vantage 68c 74b 73c 72cd 14.2b 17.1a 20.0a 17.1a 577c 750a 873ab 734ab
Grain Yield† Grain Protein† Protein Yield†
Table 4. Summary of hard red spring wheat grain yield, grain protein concentration, and protein production per acre for individual varieties at Crookston (CR), Kimball (KI), and Staples (ST) Minnesota during 2014. Average values were calculated for data across three sulfur rates and across locations (AVG).
† within columns, numbers followed by the same letter are not statistically significant at P <0.05 probability level.
---------------bushels/ac (@ 13%)---------------- -------------------------%(@ 12%)-------------------------- ---------------pounds/ac (@ 13%)----------------
continued on page 82

Page 82
Crookston and Kimball, MN 2014
Whe
at Y
ield
@ 1
3% M
oist
ure
(bu/
acre
)0
20
40
60
80
100No Sulfur7.5 lb S/acre15 lb S/acre
Faller Glenn Mayville RB07 Select Vantage
Figure 1. Summary of variety response to sulfur averaged together for the Crookston and Kimball locations studied in 2014.
Staples, MN 2014
Whe
at Y
ield
@ 1
3% M
oist
ure
(bu/
acre
)
0
20
40
60
80
100No Sulfur7.5 lb S/acre15 lb S/acre
Faller Glenn Mayville RB07 Select Vantage
Figure 2. Summary of variety response to sulfur at the Staples, Mn locations studied in 2014.
Wheat Response to Sulfur Rate: 2014
Whe
at Y
ield
@ 1
3% M
oist
ure
(bu/
acre
)
40
60
80
100
No Sulfur7.5 lb S/acre15 lb S/acre
Crookston and Kimball Staples
Wheat Response to Sulfur Rate: 2014
Whe
at G
rain
Pro
tein
@ 1
2% M
oist
ure
(%)
10
12
14
16
18
20
22No Sulfur7.5 lb S/acre15 lb S/acre
Crookston and Kimball Staples
Figure 3. Impact of sulfur rate on hard red spring wheat grain yield and grain protein concentration for Crookston and Kimball (average across location) where sulfur did not increase yield and Staples were an application of 7.5 lbs of S per acre increased yield over the control (no sulfur).
continued from page 81

Page 83
Research Questions
The objectives of this proposal are to i) develop im-proved varieties and germplasm combining high grain yield, disease resistance, and end-use quality; and ii) provide performance data on wheat varieties adapted to the state of Minnesota.
Results
During the 2013/2014 crossing cycle, 278 crosses were made. The State Variety Trial, which contained 31 re-leased varieties, 15 University of Minnesota experimental lines, and 5 experimental lines from other programs was grown at a total of 15 locations in 2014. During the 2014 growing season, another 228 advanced experimental lines were evaluated in advanced yield trials at 8-11 locations. An additional 668 lines were evaluated in preliminary yield
trials at 1-2 locations. A total of 7,730 yield plots were harvested in 2014. Fusarium-inoculated, misted nurser-ies were established at Crookston and St. Paul. Inocu-lated leaf rust nurseries were conducted at Crookston and St. Paul and a stem rust nursery was also conducted at St. Paul. The disease nurseries involve collabora-tion with agronomists and pathologists at Crookston and with personnel from the Plant Pathology Department and the USDA-ARS. Data from the yield and scab nurseries are summarized and published in Prairie Grains and the MAES’s 2014 Minnesota Field Crop Trials bulletin.
MN08165-8 (MN02268-1/MN01333-A-1) is a candidate for release and has higher protein and grain yield than Van-tage (Table 1). Other advanced experimental lines that are candidates for release in the next 1-2 years are MN10261-1 and MN11325-7. Data of these two experimental lines, recent U of MN releases, and popular varieties are shown in Table 1.
University of Minnesota Wheat Breeding ProgramJames Anderson, Dept. of Agronomy & Plant Genetics, U of M, St. Paul
2014 RESEARCH REPORT
Year Release
MN Acreage
2014 Yield (bu/A)Test Wt(Lb/Bu)
Protein (%)
Straw Strength
Leaf Rust
Bacterial Leaf
Streak ScabEntry % 2014 2-Yr 3-Yr 2-Year 2-Year 1–9 1–9 1–9 1–9MN11325-7 – – 84.3 88.5* – – 13.7* 4 4 4–5 4–5LCS Albany 2008 6.2% 88.8 88.5 85.0 60.5 12.9 5 2 6 4Prosper 2011 20.7% 87.8 87.2 81.0 60.3 13.5 6 5 4 5Faller 2007 87.7 86.1 79.7 60.3 13.4 5 5 4 4MN10261-1 – – 83.5 82.0 – 61.5 14.4 4 1 3 3–4Forefront 2012 82.7 80.7 77.1 60.9 14.5 5 2 3 3MN08165-8 – – 79.7 78.8 75.5 60.3 15.5 5 1 4 4-5Samson 2007 3.6% 77.3 78.5 76.2 58.8 14.1 3 5 5 8SY Soren 2011 8.3% 80.2 78.3 75.7 60.6 14.5 4 3 4 4RB07 2007 1.9% 77.8 77.8 73.3 60.3 14.3 5 2 6 4Norden 2012 2.3% 77.8 77.4 73.4 61.7 13.9 3 2 4 5Vantage 2007 1.3% 75.9 76.3 71.5 61.7 15.1 2 6 7 5WB-Mayville 2011 18.1% 75.3 75.3 73.2 59.4 14.7 3 3 6 7Linkert 2013 3.9% 75.6 75.2 71.7 60.4 15.0 2 3 4 5Rollag 2011 4.8% 76.7 75.0 71.4 61.1 14.9 3 4 4 3No. Env. 15 28 41* Estimated based on performance in 10 AY2 trials in 2013 with Faller and LCS Albany as checks.
Table 1. Comparison of MN08165-8, MN10261-1, and MN11325-7 with other wheat varieties. Varieties are sorted from highest to lowest yielding based on 2 Yr. yield
continued on page 84
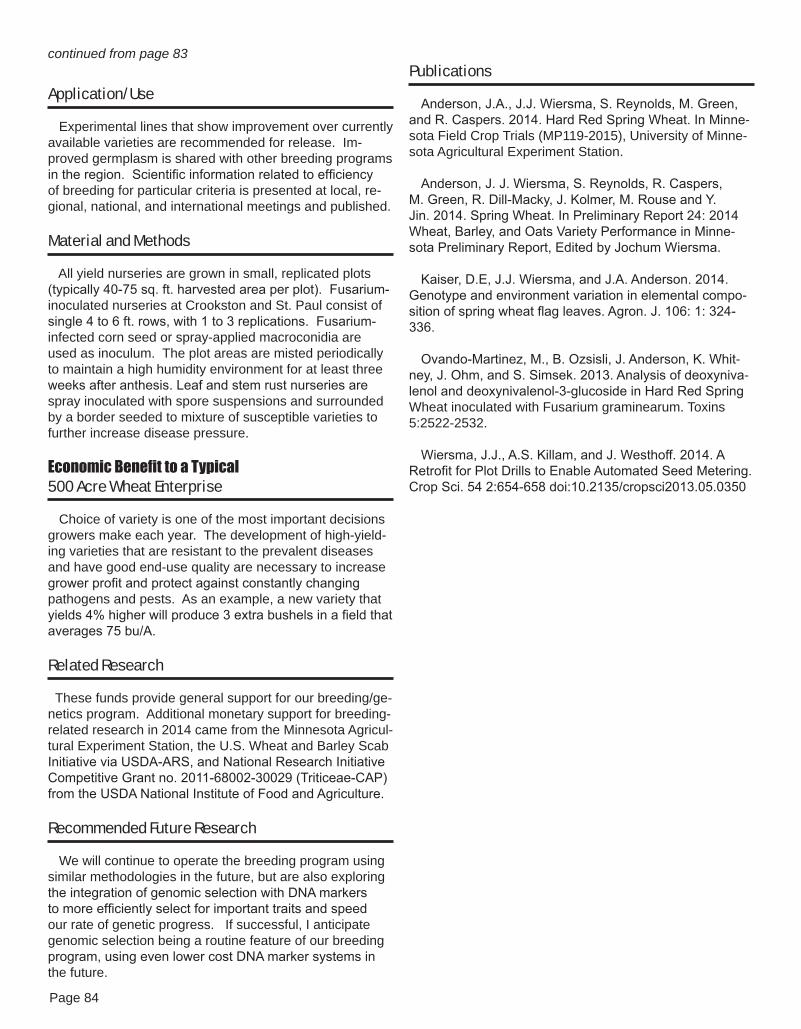
Page 84
Application/Use
Experimental lines that show improvement over currently available varieties are recommended for release. Im-proved germplasm is shared with other breeding programs in the region. Scientific information related to efficiency of breeding for particular criteria is presented at local, re-gional, national, and international meetings and published.
Material and Methods
All yield nurseries are grown in small, replicated plots (typically 40-75 sq. ft. harvested area per plot). Fusarium-inoculated nurseries at Crookston and St. Paul consist of single 4 to 6 ft. rows, with 1 to 3 replications. Fusarium-infected corn seed or spray-applied macroconidia are used as inoculum. The plot areas are misted periodically to maintain a high humidity environment for at least three weeks after anthesis. Leaf and stem rust nurseries are spray inoculated with spore suspensions and surrounded by a border seeded to mixture of susceptible varieties to further increase disease pressure.
Economic Benefit to a Typical 500 Acre Wheat Enterprise
Choice of variety is one of the most important decisions growers make each year. The development of high-yield-ing varieties that are resistant to the prevalent diseases and have good end-use quality are necessary to increase grower profit and protect against constantly changing pathogens and pests. As an example, a new variety that yields 4% higher will produce 3 extra bushels in a field that averages 75 bu/A.
Related Research
These funds provide general support for our breeding/ge-netics program. Additional monetary support for breeding-related research in 2014 came from the Minnesota Agricul-tural Experiment Station, the U.S. Wheat and Barley Scab Initiative via USDA-ARS, and National Research Initiative Competitive Grant no. 2011-68002-30029 (Triticeae-CAP) from the USDA National Institute of Food and Agriculture.
Recommended Future Research
We will continue to operate the breeding program using similar methodologies in the future, but are also exploring the integration of genomic selection with DNA markers to more efficiently select for important traits and speed our rate of genetic progress. If successful, I anticipate genomic selection being a routine feature of our breeding program, using even lower cost DNA marker systems in the future.
Publications
Anderson, J.A., J.J. Wiersma, S. Reynolds, M. Green, and R. Caspers. 2014. Hard Red Spring Wheat. In Minne-sota Field Crop Trials (MP119-2015), University of Minne-sota Agricultural Experiment Station.
Anderson, J. J. Wiersma, S. Reynolds, R. Caspers, M. Green, R. Dill-Macky, J. Kolmer, M. Rouse and Y. Jin. 2014. Spring Wheat. In Preliminary Report 24: 2014 Wheat, Barley, and Oats Variety Performance in Minne-sota Preliminary Report, Edited by Jochum Wiersma.
Kaiser, D.E, J.J. Wiersma, and J.A. Anderson. 2014. Genotype and environment variation in elemental compo-sition of spring wheat flag leaves. Agron. J. 106: 1: 324-336.
Ovando-Martinez, M., B. Ozsisli, J. Anderson, K. Whit-ney, J. Ohm, and S. Simsek. 2013. Analysis of deoxyniva-lenol and deoxynivalenol-3-glucoside in Hard Red Spring Wheat inoculated with Fusarium graminearum. Toxins 5:2522-2532.
Wiersma, J.J., A.S. Killam, and J. Westhoff. 2014. A Retrofit for Plot Drills to Enable Automated Seed Metering. Crop Sci. 54 2:654-658 doi:10.2135/cropsci2013.05.0350
continued from page 83

Page 85
Research Questions
Variability in flour performance and consistency under manufacturing conditions remains an issue for processors. The reasons for variability are many, including genetics, environmental conditions, aging of wheat during the year, blending of wheats and the particular milling fractions that are blended to deliver flour of a certain specification. How-ever, there is evidence that some wheat varieties maintain their quality despite variability in growing season. Wheat is transacted in the market based on protein content, but flour performance is based on protein quality – an attribute that remains difficult to measure or quantify. Recent re-search from our laboratory working with Eastern hard and soft wheats, demonstrated that a new technique – Gluto-peak tester –can distinguish differences between flours with similar protein quantity. However, similar work has not been conducted with western wheat varieties. These ob-servations led us to the next phase of research where we focus on individual wheat varieties. This project proposes to assess if this new technique has the potential predictive capabilities of assessing flour performance. The glutopeak tester is a high shear based technique that provides two attributes of gluten quality; torque that is an indication of strength of gluten and time to peak that is an indication of kinetics of gluten aggregation. The test is rapid (<5 min) and it requires only about 9 g of sample. If the technique has predictive capabilities, then it will be of great value to wheat breeders, elevators, millers and processors to asses wheat quality as opposed to merely protein quantity.
Results
We compared performance of flours from 32 spring wheat varieties grown in different environments during 2012 and 2013 using industry standard procedures to measure water absorption, mixing strength, loaf volume, etc. We subjected the same flours to the glutopeak test, a fast 5-10 min. test that could be used at grain elevators, to test its ability to predict mixing and baking properties. During the test, the sample is mixed with water (ratio of flour : water about 1:1) and subjected to intense mechani-cal action on the speed of the rotating element (from 1900 to 3000 rpm). These conditions - allowing for the formation of gluten - promote a strong increase in the consistency of the slurry up to a maximum peak. From that moment, the continuous mechanical stress causes the breakdown of the gluten network, a phenomenon recorded as a decrease in consistency (see Figure 1). Using this tech-nique we were able to demonstrate that flours with similar
protein content had different gluten aggregation kinetics and conversely wheat flours with different protein content had similar aggregation kinetics in terms of Peak Maxi-mum Time and Peak Torque (Figure 1a). During gluten aggregation, some samples showed different peak torque and peak time but they exhibited the similar values for the area under the peak indicating that they required a similar energy for gluten aggregation and a similar volume of the corresponding bread (samples A and B in Figure 1b). Other samples were characterized by a different ag-gregation kinetics, but they were different in the energy necessary for gluten aggregation and therefore in loaf volume (samples C and D in Figure 1b). Further studies are underway to explain what is the driving force of these differences in gluten aggregation. Considering the data set analyzed (n=128), samples with high peak torque exhib-ited faster aggregation (low peak maximum time; r=-0.62; p<0.01; see Table 1) and they were able to keep high value of consistency even after prolonged mixing (2 min after the peak; r = 0.90; p<0.01; see Table 1).
The charts that report the min, max, average and median values of protein content, peak maximum time, peak torque, area under the curve of the flours of 128 spring wheat samples (see Figure 2) highlight that the set of samples is well distributed around the mean values (the mean and median values are very similar). Samples grown in Stephen, MN - characterized by relatively high protein content - show a faster aggregation (low peak maximum time) and strong gluten formation (high peak torque) on average. Considering the area under the curve - that takes into consideration both the peak torque and time for gluten aggregation - samples grown in Roseau, MN exhibited the lowest value, suggesting weaker glu-ten aggregation performances compared to the samples grown in Oklee and Stephen. As regard the effect of growing year, wheat grown in Stephen 2012 showed - on average - stronger protein network forming than samples grown in Stephen in 2013.
Taking into consideration all the samples (n=128), the peak maximum time from the Glutopeak test was corre-lated with the bake mixing time (r=0.62; p<0.01 see Table 2) and the farinographic stability (r=0.48; p<0.01 see Table 2). Interesting, samples that required higher energy for gluten aggregation exhibited higher mixograph pattern (r=0.40; p<0.01 see Table 2) and farinographic stability (r=0.39; p<0.01 see Table 2).
Evaluating a New Rapid Technique to Assess Spring Wheat Flour Performance
Franciso Diez-Gonzalez, Dept. of Food and Nutrition, U of M, St. Paul
2014 RESEARCH REPORT
continued on page 86

Page 86
Based on the results obtained using the GlutoPeak, 4 varieties (Knudson, Marshall, Prosper and Samson) were chosen for further investigation, because of their high vari-ability (e.g. >20% for the area under the peak). Unlikely, the SDS-solubility data of the dough did not show any strong correlation with the indices from the GlutoPeak test. Samples with faster aggregation exhibited high solubility at the dough development time (r=-0.48; p <0.1). A larger set of samples should be investigated.
Interesting, a significant negative correlation between the maximum torque (that corresponds to the peak occur-ring as gluten aggregates) and the fluorescence intensity (r=-0.71; p<0.01) was observed, suggesting that flours with greater number of hydrophobic patches on the protein surface (great fluorescence intensity) create a weak gluten network during aggregation.
Application/Use
Results demonstrated that gluten aggregation kinetics of varieties grown in different locations and over different years were different. the new technique can be success-fully used for characterizing spring wheat lines.
Material and Methods
Thirty-two varieties of spring wheat were grown in three locations (Roseau, Stephen and Oklee) in 2012-2013, for a total of 128 samples. On the basis of the results, 4 vari-eties (Knudson, Marshall, Prosper, Samson) were chosen for investigating the protein solubility and the hydrophobic interactions during dough-making.
The gluten aggregation properties of flours were mea-sured using the GlutoPeak (Brabender GmbH and Co KG, Duisburg, Germany), according to (Kaur Chandi & Seeth-araman, 2012). An aliquot of 8.5 g of flour was dispersed in 9.5 ml of 0.5M CaCl2. Sample and solvent temperature was maintained at 34 °C by circulating water through the jacketed sample cup. The paddle was set to rotate at 1900 rpm and each test ran for 7 min. The following indices were determined: i) Maximum Torque expressed in Brabender Equivalents (BE) - corresponding to the peak occurring as gluten aggregates; ii) Peak Maximum Time expressed in minutes - corresponding to the time at peak torque; iii) Area under the peak expressed in arbitrary units (AU) - corresponding to the energy required for gluten aggregation; iv) loss of torque 2 minutes after the peak (%) related to the ability of strength of the gluten network during prolonged mixing. A Farinograph-AT (C.W. Brabender Inc., South Hack-ensack, NJ, USA) equipped with a 10 g mixing bowl was used for preparing the dough (at 30°C and 63 rpm). All the dough samples were prepared at a constant water absorp-
tion level (60%). Samples were collected at the dough de-velopment time and at the end of the test (20 min mixing) and immediately transferred to liquid nitrogen followed by freeze-drying. The freeze-dried samples were ground us-ing a pestle and mortar in order to have a powder sample with particle size less than 0.5 mm. Freeze-dried samples containing ~1 mg protein were suspended in 1 mL of a 0.05 M sodium phosphate buffer (pH 6.8) containing 2.0% sodium dodecyl sulfate (SDS) and transferred to a shaker for 60 min at room temperature. After centrifugation (10,000×g for 5 min), the amount of protein in the super-natant was determined colorimetrically using the RC-DC Protein Assay (Bio-Rad, Hercules, CA, USA) based on the Lowry assay (Lowry et al., 1951). Bovine serum albumin was used as a standard and results were expressed as mg soluble protein/g protein. Rearrangement of hydrophobic patches on the protein surface of selected samples were measured by spectro-fluorometric technique, monitoring the chemical environ-ment of extrinsic flourophore1,8-anisolino naphthalene sulfonate (ANS), as described by Bonomi et al. (2004). A Farinograph-AT (C.W. Brabender Inc., South Hackensack, NJ, USA) equipped with a 10 g mixing bowl was used for preparing the dough (at 30°C and 63 rpm). All the dough samples were prepared at a constant water absorption level (60%). ANS (0.2 mM) was added to the water used for making the dough. Dough samples for analyses were collected at the dough development time, corresponding to the time from first addition of water to the point of maxi-mum consistency range. Fresh samples were pulled from the farinograph with minimal additional physical manipula-tion, transferred to a fluorescence cell (quartz-windowed standard surface) and analyzed within 3 min. A fluoropho-tometer (LS 55, Perkin Elmer, Waltham, MA, USA) was used to measure emission spectra from 400-600 nm with excitation at 390 nm.
References
Kaur Chandi, G., Seetharaman, K. (2012) Optimization of gluten peak tester: a statistical approach. Journal of Food Quality 35, 69-75.
Lowry, O.H., Rosebrough, N., J., Farr, A., Randall, R.J. 1951. Protein measurement with the folin phenol reagent. Journal of Biological Chemistry, 193, 265-275.
Related Research
Using this technique, Dr. Seetharaman was able to demonstrate that flours with similar protein content had different gluten aggregation kinetics and conversely wheat flours with different protein content had similar aggrega-tion kinetics. Given that commercial flours are a blend of different wheat varieties and/or types, he conducted a flour blending study to assess the impact on gluten aggregation kinetics. Results suggested that different proportions of
continued from page 85

Page 87
continued on page 88
wheat types in a given blend influence gluten aggregation kinetics. A further exploration to understand reasons for these observations was conducted by isolating gliadin and glutenin from different wheat types (eastern soft, eastern hard, and western hard). The results showed that gliadin and glutenin proteins in the different wheat types were inherently different and blending of gliadin and glutenin from different wheat types did not result in similar gluten aggregation kinetics.
The project is a collaboration with Dr. Jim Anderson,
Wheat Breeder, University of Minnesota and used wheat varieties developed by other scientists in the region.
Recommended Future Research
• Relating gluten aggregation properties and hydropho-bic interactions testing a larger number of varieties, years and locations
• Applying proteomics and thiolomics approach to understand variability in flour performance from wheats grown in different environmental conditions.
Appendix
Figure 1. Examples of GlutoPeak curves

Page 88
continued from page 87

Page 89
Figure 2. Min, max, average and median values for protein and GlutoPeak of 32 spring wheat varieties grown in different environments. continued on page 90
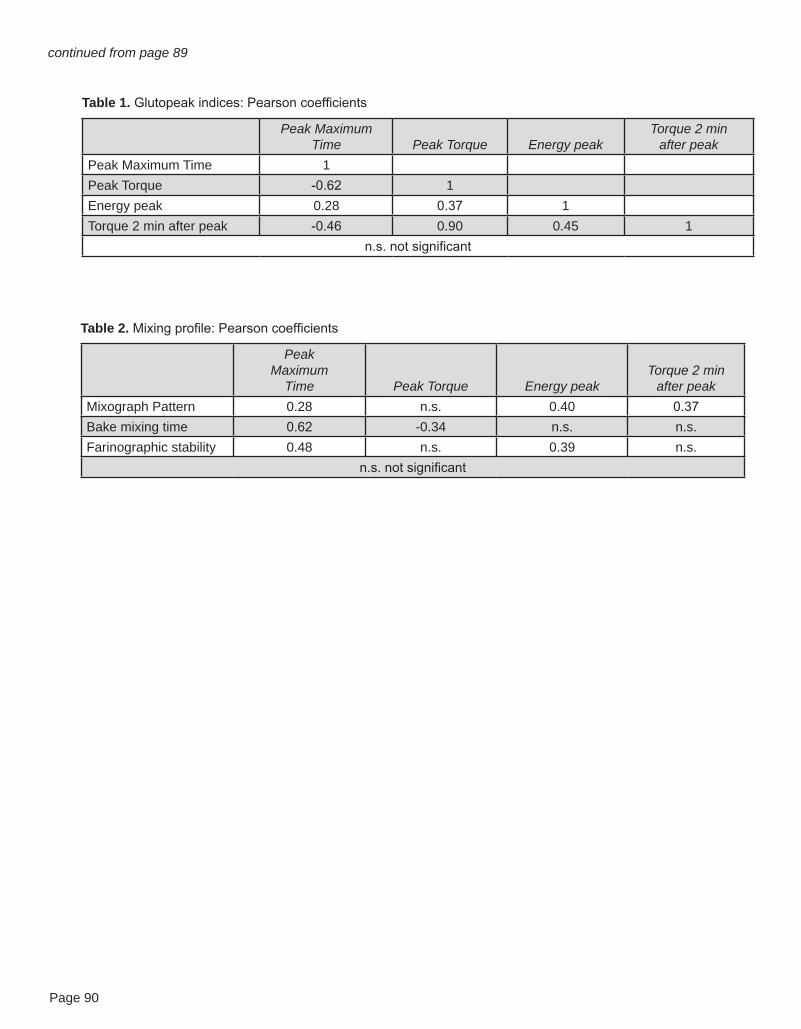
Page 90
Peak Maximum Time Peak Torque Energy peak
Torque 2 minafter peak
Peak Maximum Time 1Peak Torque -0.62 1Energy peak 0.28 0.37 1Torque 2 min after peak -0.46 0.90 0.45 1
n.s. not significant
Table 1. Glutopeak indices: Pearson coefficients
Peak Maximum
Time Peak Torque Energy peakTorque 2 min
after peakMixograph Pattern 0.28 n.s. 0.40 0.37Bake mixing time 0.62 -0.34 n.s. n.s.Farinographic stability 0.48 n.s. 0.39 n.s.
n.s. not significant
Table 2. Mixing profile: Pearson coefficients
continued from page 89
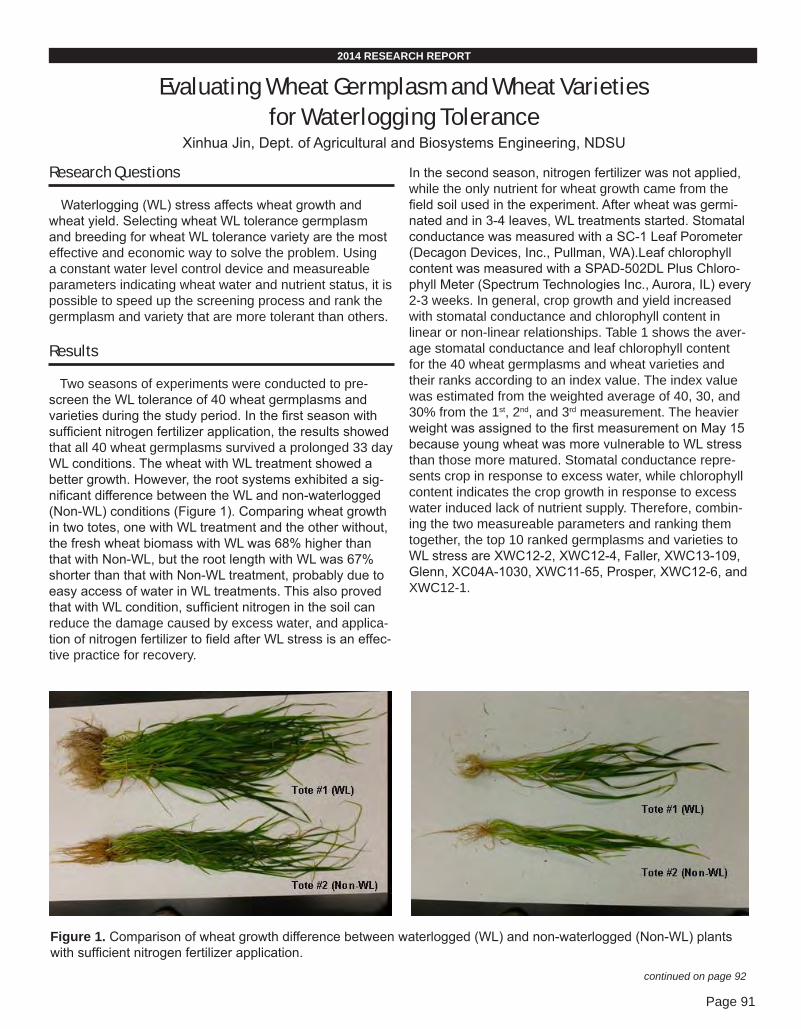
Page 91
continued on page 92
Research Questions
Waterlogging (WL) stress affects wheat growth and wheat yield. Selecting wheat WL tolerance germplasm and breeding for wheat WL tolerance variety are the most effective and economic way to solve the problem. Using a constant water level control device and measureable parameters indicating wheat water and nutrient status, it is possible to speed up the screening process and rank the germplasm and variety that are more tolerant than others.
Results
Two seasons of experiments were conducted to pre-screen the WL tolerance of 40 wheat germplasms and varieties during the study period. In the first season with sufficient nitrogen fertilizer application, the results showed that all 40 wheat germplasms survived a prolonged 33 day WL conditions. The wheat with WL treatment showed a better growth. However, the root systems exhibited a sig-nificant difference between the WL and non-waterlogged (Non-WL) conditions (Figure 1). Comparing wheat growth in two totes, one with WL treatment and the other without, the fresh wheat biomass with WL was 68% higher than that with Non-WL, but the root length with WL was 67% shorter than that with Non-WL treatment, probably due to easy access of water in WL treatments. This also proved that with WL condition, sufficient nitrogen in the soil can reduce the damage caused by excess water, and applica-tion of nitrogen fertilizer to field after WL stress is an effec-tive practice for recovery.
In the second season, nitrogen fertilizer was not applied, while the only nutrient for wheat growth came from the field soil used in the experiment. After wheat was germi-nated and in 3-4 leaves, WL treatments started. Stomatal conductance was measured with a SC-1 Leaf Porometer (Decagon Devices, Inc., Pullman, WA).Leaf chlorophyll content was measured with a SPAD-502DL Plus Chloro-phyll Meter (Spectrum Technologies Inc., Aurora, IL) every 2-3 weeks. In general, crop growth and yield increased with stomatal conductance and chlorophyll content in linear or non-linear relationships. Table 1 shows the aver-age stomatal conductance and leaf chlorophyll content for the 40 wheat germplasms and wheat varieties and their ranks according to an index value. The index value was estimated from the weighted average of 40, 30, and 30% from the 1st, 2nd, and 3rd measurement. The heavier weight was assigned to the first measurement on May 15 because young wheat was more vulnerable to WL stress than those more matured. Stomatal conductance repre-sents crop in response to excess water, while chlorophyll content indicates the crop growth in response to excess water induced lack of nutrient supply. Therefore, combin-ing the two measureable parameters and ranking them together, the top 10 ranked germplasms and varieties to WL stress are XWC12-2, XWC12-4, Faller, XWC13-109, Glenn, XC04A-1030, XWC11-65, Prosper, XWC12-6, and XWC12-1.
Evaluating Wheat Germplasm and Wheat Varieties for Waterlogging Tolerance
Xinhua Jin, Dept. of Agricultural and Biosystems Engineering, NDSU
2014 RESEARCH REPORT
Figure 1. Comparison of wheat growth difference between waterlogged (WL) and non-waterlogged (Non-WL) plants with sufficient nitrogen fertilizer application.

Page 92
continued from page 91
EntryStomatal Conductance (mmol/m2/s)
EntryChlorophyll (SPAD unit)
5/15 6/5 6/23 Index Rank 5/15 6/5 6/23 Index RankXWC12-4 410 326 371 373 1 XWC12-2 36 42 22 34 1XWC12-2 206 672 132 324 2 XWC13-109 44 26 22 32 2Faller 381 495 49 316 3 XWC12-4 46 25 17 31 3Alsen 610 120 45 293 4 XWC12-8 35 28 24 30 4XWC12-6 315 245 306 291 5 XWC11-003 30 26 29 29 5XWC11-65 480 125 166 279 6 Faller 35 27 21 28 6Prosper 371 248 166 273 7 Glenn 30 23 24 26 7XC04A-1030 266 242 261 257 8 Barlow 35 23 14 25 8Glenn 333 98 247 237 9 XC04A-1030 32 20 21 25 9XWC11-002 411 127 106 234 10 XWC11-69 36 16 19 25 10XWC11-63 80 187 470 229 11 XWC12-1 37 27 6 25 11XWC13-109 243 236 183 223 12 XWC11-65 32 13 25 24 12XC02B-121 209 121 335 220 13 XC02B-130 35 21 12 24 13XWC11-67 326 173 116 217 14 Prosper 26 30 16 24 14XWC12-1 276 235 79 205 15 XC02B-121 35 11 20 23 15XWC11-68 372 91 83 201 16 XWC11-008 37 5 19 22 16XC02B-130 265 97 206 197 17 XC02B-120 26 18 20 22 17XWC11-005 295 115 148 197 18 XWC12-6 31 13 19 22 18XWC11-007 278 202 56 189 19 XWC11-68 36 11 14 22 19XWC11-004 285 72 176 188 20 XWC11-72 29 12 21 22 20XC02B-116 237 219 90 188 21 XWC12-9 26 13 22 21 21XWC12-8 186 228 137 184 22 CS 29 17 15 21 22XWC11-59 271 133 104 180 23 XWC12-7 30 11 19 21 23XWC12-5 286 168 41 177 24 XWC12-3 32 14 12 21 24Barlow 207 133 168 173 25 XWC11-002 30 14 14 20 25XWC11-72 246 102 138 170 26 XWC11-63 26 14 19 20 26XWC12-7 208 102 173 166 27 XWC11-75 28 16 14 20 27
XWC12-3 187 200 93 163 28 XC02B-116 29 13 15 20 28XC02B-126 213 170 67 156 29 XWC11-59 31 13 11 20 29XC02B-120 138 230 100 154 30 XWC11-61 27 11 18 19 30XWC11-75 176 123 151 153 31 XWC11-006 30 14 9 19 31XWC11-69 165 85 162 140 32 XWC12-5 28 14 12 19 32XWC11-62 126 185 109 139 33 XC02B-115 32 9 12 19 33XWC11-008 95 32 295 136 34 XWC11-004 27 11 16 19 34CS 81 209 120 131 35 XWC11-67 25 18 12 19 35XWC11-61 139 97 140 127 36 XWC11-62 26 16 10 18 36XC02B-115 161 92 93 120 37 Alsen 23 20 10 18 37XWC12-9 146 80 108 115 38 XWC11-007 28 13 9 18 38XWC11-006 143 78 67 101 39 XC02B-126 26 15 10 18 39XWC11-003 104 50 33 66 40 XWC11-005 23 11 17 18 40
Table 1. Comparison and rank of wheat germplasm and variety based on stomatal conductance and leaf chlorophyll.

Page 93
Application/Use
The primary drive force for this project is to help col-laborator Cai’s research group to speed up their germ-plasm selection process and improve wheat waterlogging tolerance by introducing genes from wild species into the wheat genome. The experimental results were applied by the group immediately in their follow-up research. The performance of five wheat varieties provided useful and immediate information to local production farmers when choosing appropriate varieties in their 2015 spring sea-son. Instead of focusing on crop yield only, if the fall soil moisture is high, and field has poor drainage, three variet-ies, Faller, Glenn, and Prosper, showed better growth and higher tolerance to waterlogging conditions.
Material and Methods
The two experiments were conducted in two large growth chambers, located at the Plant Sciences Depart-ment, North Dakota State University with automatic light, temperature, and relative humidity control. In each cham-ber, three totes, each with 40 growth cones in two racks, were setup side by side, but each tote had its own individ-ual water control device that was located near the edge of the chamber. A split random design experiment was per-formed in each tote, which resulted in two treatments (WL and Non-WL) and three replicates. A total of 240 growth cones, each planted with three wheat seeds, were used in each experiment. Water level was automatically controlled by a constant head device, and crop water consumption was measured by an automatic ET-gage. Pictures were taken 2-3 times per week to monitor wheat response to water. Stomatal conductance was measured by SC-1 Leaf Porometer and leaf chlorophyll content was measured by SPAD-502DL Plus Chlorophyll Meter three times in the season. Due to large number of plants and small space in the growth chamber, each measurement took 1-2 days for two persons to accomplish. All wheat germplasm materials were provided by Cai. Wheat varieties were supplied by the Plant Sciences Department. Lab experiments on seed survival rate under waterlogging conditions are current in progress.
Economic Benefit to a Typical 500 Acre Wheat Enterprise
Comparing spring wheat yield in 2011 and 2012, the yield difference was 10 bu/ac for the northwest region of Minnesota. The difference was probably mainly caused by excess moisture conditions in 2011. Using $7/bu current wheat price as a starting point, the economic benefit to a typical 500 acre wheat enterprise is $35, 000 when main-taining all other conditions the same.
Related Research
Cai’s group is working on alien gene introgression for waterlogging tolerance from wild species into wheat. This research has provided significant information to develop an efficient screening procedure of waterlogging tolerance in the alien gene introgression project and wheat breeding programs. Jia also received funds from ND State Board of Agricultural Research & Education and Wheat Com-mission to assess ND wheat varieties and germplasm for waterlogging tolerance. In addition, Jia’s major research is on impact of drainage water management on crop yield and soil/water quality that she often observed various crop responses to waterlogging conditions in field situations. The lab and field research project provided a full picture of waterlogging stress effect on farming.
Recommended Future Research
Trait evaluation is a critical procedure for wheat germ-plasm and variety development. Little research has been done in the assessment of wheat’s response to waterlogging conditions. This initial study has generated important information for developing an efficient waterlog-ging screening procedure in wheat and identified wheat genotypes with different responses to waterlogging condi-tions. I would like to continue this research to develop an accurate selection criterion for wheat germplasm/variety development by evaluating the response of the adaptive physiological traits to different water stress and help wheat research programs screen germplasm and breeding ma-terials for waterlogging tolerance. I will use measureable and visible physiological traits, such as stomatal conduc-tance, chlorophyll content, tiller number, kernels, and grain yield, to assess wheat germplasm stress tolerance under different growing stages. In addition, I will extend the project to a complete full season in a greenhouse environ-ment in order to measure tiller number, kernels, and grain yield. Along the road, field testing of wheat waterlogging tolerance can be conducted using lysimeters in fields with drainage control.
Page 94
Research Questions
The objective of this project was to allow for timely small grain crop progress and pest identification across the state of Minnesota in order to inform producers of current crop conditions and potential threats. Information was released through media (e.g. weekly radio programs, internet-based news releases, archived web pages, and e-mail). The survey was conducted in coordination with the established NDSU IPM Survey, providing extensive, continuous cover-age of small grain production spanning Minnesota and North Dakota.
Results
2012: Field surveys were initiated the last week of May. Most years that would have coincided with the beginning of agronomic management decisions. However, the warm early spring accelerated crop progress and grain crops as far north as southeast North Dakota had already reached anthesis (early flower), while most fields in northwest Minnesota were in the jointing stage (see map for growth stages May 28 to June 8).
Unfortunately, the early season also saw early and sig-nificant migrations of aster leafhopper and cereal aphids. These events were prior to the start of the surveying but their presence resulted in increased incidence of BYDV/Aster Yellows which was found later. The two pathogens express similar symptoms in wheat and barley making it difficult to distinguish them from one another in the field.
2013: Field surveying was initiated in the latter half of May and in full progress with the first of June. A very slow and delayed planting due to an extended winter and cold/wet spring had the small grains growth significantly behind traditional calendar landmarks. A total of 43 counties were at some time samples throughout the growing season across MN. The start of season was somewhat quite from a pest standpoint with tan spot, septoria, and some cereal aphids identified throughout the state but not in economic severities. The end of season saw a lot more documen-tation of pests such as armyworms, scab, barley yellow dwarf, bacterial leaf blight, and rusts. Aside from the ar-myworms, most of the pests were at post treatment plant stages however surveying identified that scab was a larger production component than originally calculated.
It is important to understand the distinction between incidence and severity for plant pathogens when reviewing the maps. Incidence is defined as the percent of sampled
plants with the pest. Severity is defined as the percent of plant material that is damaged on affected plants. There-fore, maps that report incidence are reporting percent plants affected. Severity tells us how bad infections were when identified.
2014: Field surveys were initiated the last week of May. Delayed planting conditions again resulted in most of the crop being in the initial leaf to tillering stage, how-ever there was earlier planting of a portion of the crop and reflected in locations at the jointing stage (see map for Growth Stages - June 9 to 20). The most important insect related production issues were the appearance of cereal aphids which reached threshold levels in some regions of both states. Small grain diseases by prevalence were Tan Spot, oc-curring throughout the region; Bacterial Leaf Streak in SW and WC MN; Septoria occurring with high incidences in NW MN; Barley Yellow Dwarf incidence was found where aphids established in WC MN; and, Head Blight (scab) in SW and WC MN where wet conditions during heading contributed to higher than forecasted infections. When reviewing the maps. Incidence is defined as “the percent of sampled plants with the disease.” Severity is defined as “the percent of plant tissue that is diseased on affected plants.” Therefore, maps that report incidence are reporting percent plants affected while severity tells us how bad infections were. Efforts this year contributed significantly to the identify-ing Bacterial Leaf Streak statewide severity and presence in addition to varietal responses to the pathogen. The collected data has also proved valuable in explaining final yield and quality reports across the state with a better understanding of contributing factors.
Application/Use
This pest survey was developed and implemented for the early and correct identification of small grain insect and pathology pests across the state of Minnesota and to combine and report those findings with the ongoing project at North Dakota State University (NDSU). The concept builds on the efforts of year one that created a regional approach to surveying and reporting pest data to produc-ers, researcher, consultants, and agricultural industry. The outcomes included identification of growth stages, wheat /barley BYDV, Bacterial Leaf Blight, Wheat Streak Mosiac Virus, Stripe and Leaf Rust, Fusarium Blight, Tan Spot,
Minnesota Small Grain Pest Survey ScoutingDoug Holen, U of M Extension Regional Office, Morris
2014 RESEARCH REPORT

Page 95
continued on page 96
Septoria, Powdery Mildew, Oat Crown Rust, Ergot Wheat Stem Maggot, Cereal Aphids, Aster Leafhoppers, Army-worms
The data collected was reported weekly in print with the NDSU Pest Survey Report and Northwest Cropping Is-sues but was also disseminated to other researchers. The findings were represented to consultants and seed indus-try personnel, as well as discussed at summer plot tours. Sites included LeCenter, Mora, Benson, DeGraff, Fergus Falls, Perley, Strathcona, Hallock and the Northwest Re-search and Outreach field day in Crookston.
This detection and reporting system notified producers of the presence or absence of pests and the incidence and severity of the problem. With that data, producers could make educated, timely, and effective decisions leading to an economically feasible integrated pest management approach. The data collected represented pests found, but equally important was the time they were identified, as well as those not found.
Material and Methods
2012: Two pest scouts were hired to collect the needed data. Scout 1 (Jason Rogers) worked under the supervi-sion of Jochum Wiersma with a home base of Under-wood, represented production areas of Northwestern Minnesota. Scout 2 (Derrick Nelson) worked under the supervision of Doug Holen out of Fergus Falls with geo-graphic responsibilities of West Central, Central, and Southern Minnesota. This project had oversight from faculty of the University of Minnesota St. Paul campus as well as training for job responsibilities and data report-ing with NDSU. Three travel courses were mapped from each home base and traveled weekly to assure maximum geographic representation. Random fields, along with pre-determined sites were sampled with data collection taking place on site with the use of notebook computer systems. Samples were collected for verification if questions persist-ed with findings. All data components were downloaded and forwarded to Phil Glogoza who formatted the data set and then passed it through to NDSU for reporting in their system. Generated data sets were then also forwarded to supervisors. Supervisors were in constant communica-tions with the scouts allowing for current knowledge on findings. About 35 fields per week were sampled between the two scouts. Some fields were revisits if a pest popu-lation warranted monitoring, otherwise new sites were sought.
2013: Two pest scouts were hired to collect the needed data. Scout 1 (Drew Underdahl) worked under the super-vision of Jochum Wiersma and Madeleine Smith with a home base of Crookston, surveying the production areas of Northwestern Minnesota. Scout 2 (Aaron Bengston) worked under the supervision of Doug Holen out of Fergus Falls with geographic responsibilities of West Central,
Central, and Southern Minnesota. Travel and sampling objectives were to represent small grain production areas with data gathered. Both scouts sampled weekly and rotated traveled routes in regions to allow for the largest possible geographic and data representation. While the scouts randomly selected fields for sampling, some fields were targeted as concerns were brought to our attention and occasional fields revisited to monitor pest progress. Goals were to have each scout sample 15 to 20 fields per week.
2014: Two pest scouts were hired to collect the needed data. Scout 1 (Olivia Fischer) worked under the supervi-sion of Jochum Wiersma and Madeleine Smith with a home base of Crookston, surveying the production areas of Northwestern and to some extent Central Minnesota . Scout 2 (Aaron Bengston) worked under the supervision of Doug Holen out of Fergus Falls and Phil Glogoza in Moorhead with geographic responsibilities including West Central, Central, and Southern Minnesota. Travel and sampling objectives were to represent small grain produc-tion across Minnesota. Both scouts sampled weekly and rotated traveled routes in regions to allow for the largest possible geographic representation. While the scouts randomly selected fields for sampling, some fields were targeted as concerns were brought to our attention and occasional fields revisited to monitor pest progress. Goals were to have each scout get 15 to 20 fields per week. Scouts were identifiable as University of Minnesota em-ployees with marked vehicles and shirts.
Economic Benefit to a Typical 500 Acre Wheat Enterprise
The economic benefit was the timing and correct identifi-cation of small grain pests. With that information, produc-ers knew what pest was present, when it was detected, at what levels, and plant growth stage it was found. Deci-sions could then be made as to whether or not treat-ment was necessary, and which products and rates were needed if thresholds were found. Equally important were decisions that pesticide applications were not economi-cally justified due to pest populations and/or plant growth stage. As history has shown, millions of dollars have been lost due to pests such as leaf rust and fusarium head blight, as well as millions spent on pesticides in hope of controlling these and many other small grain pests. An average producer will apply fungicide one to two times per season and insecticide if needed. These efforts allowed for the timely notification of pest populations and allowing for the proper expenditure of money for pest management when and where needed. Much more insecticide was applied to small grains this season as a result of the early detection and alarming populations of aster leafhoppers across two state areas.

Page 96
Related Research (effort)
At this time there is no related effort in Minnesota. The Minnesota Department of Agriculture had previously performed something similar across the state for all crops. That program no longer exists. The absence of an outstate plant pathologist within the University of Minne-sota Extension system also highlighted the need for such a project in the beginning. For three seasons, the proj-ect supervisors have responded to statewide pathology questions and programming. This approach saved many faculty hours by reducing the need for travel to investigate client reports while establishing and process for timely col-lection and representation of area-wide survey data.
There are currently multi-state surveys in collecting spe-cific information on Bacterial Leaf Streak disease and its prevalence and race typing.
NDSU has had the pest survey system in place for many years and our goal from the beginning planning stages was to incorporate our data into their program for a stron-ger and regionally larger report.
With the hiring of a small grains pathologist at NWROC in Crookston, our team added a strong contributor to col-lecting, reporting, and making recommendations.
Recommended Future Research
It is our belief that this surveying effort should continue and can be routinely improved upon with timely starts to the surveying season and quicker data turnaround time to the agricultural community. Discussions have taken place throughout the granting period of adding crops to the survey in tying crop production systems together over time with all pest components of rotations represented. Cur-rently, conversations are occurring to have this effort serve as a template for expanded crop pest surveying.
The benefits of this program include: identify the pres-ence of regional pests in a timely fashion, save countless hours of small grain researchers time and resources in travel and communications, improve knowledge of local-ized pest conditions, increase visibility and perception of overall effort in small grains, establish a cooperative effort with NDSU, generate data for use by local coops, consul-tants, researchers, and producers.
Suggestions to improve the surveying system: Daily log of data collected and dissemination; cooperate with NDSU for training and reporting; better equip the scouts to make the best use of their time; use rental vehicles; develop cards with information on where to access the data that the scouts can hand out to clientele when approached;
and, better planning of travel paths for more direct routes to the most possible fields.
This effort has been successful in correctly identifying many production pests as well as areas in which pests were not present. This information was very useful in small grain field days, workshops, and producer conversa-tions across the state.
Appendix
continued from page 95

Page 97

Page 98

Page 99
continued on page 100
Research Questions
Predicting flour performance and consistency remains a challenge for processors, mainly due to the issue that the nature of interactions between the protein sub-units is different in different types of wheat. Wheat protein qual-ity is being recognized as more important than protein quantity. In recent work in our laboratory, we showed that flour performance is in part related to the kinetics of gluten aggregation as measured by using a Glutopeak tester - a new high shear based procedure developed by Brabender. Furthermore, it has been shown that the nature of gluten aggregation is dependent on the type of protein-protein interaction – either hydrophobic interaction or disulphide interaction (Huschka et al., 2012). Front-face fluores-cence is a well established technique to observe protein conformational changes in protein-based matrices during processing and to assess structural features of proteins in wheat flour dough. The acquisition of Front face fluores-cence spectrophotometer is critical to analyzing the nature of interactions in wheat varieties grown in different years and locations.
Results
Fluorescence spectroscopy is a very powerful tool for studying protein structural changes in complex matrices, such as food products. The fluorescence spectrum is determined by the chemical environment of a fluorescent component (in proteins, it is usually the fluorescent amino acid tryptophan), and therefore, changes in the emission spectra of tryptophan often occur in response to conforma-tional transitions, subunit association, substrate binding, or denaturation of the proteins present in the sample. There is a shift of the maximum of emission to higher wavelength when tryptophan moves from a hydrophobic surrounding to a hydrophilic one (e.g. from the protein interior to the aqueous media). Also fluorescence intensity can change: some molecules can work as quenchers and adsorb the emitted light (Bonomi et al., 2004). Traditionally, fluorescence studies have been performed on clear solutions. Cereal matrices are characterized by a dominant presence of proteins - gliadins and glutelins - that cannot be brought into solution without significant alteration of their structural features. Solid-state Fluores-cence (also known as front-face fluorescence) represents a useful tool for extending studies on reporter molecules to insoluble proteins in semisolid systems, such as those often found in foods.
Information about protein structural organization may be gathered also by using fluorescent dyes. One of the most popular probes is 1-anilinonaphthalene-8-sulfonate (ANS), that becomes fluorescent when interacting with a hydro-phobic region, making it possible to study protein struc-tural changes in complex systems after a specific treat-ment (Bonomi et al., 2004). Titration with ANS may provide information on both the number of surface hydrophobic sites and their average affinity towards the probe. Differ-ences observed at high ANS concentration are more likely to result from changes in the number of probe binding sites, whereas changes observed at low concentrations of ANS would be an indication of changes in the affinity of hydrophobic moieties to the fluorescent probe (Bonomi et al., 2004). Previous studies demonstrated that probe concentrations around 0.2 mM at 40% moisture would be best suited for investigating the behaviour of wheat flours (Huschka et al., 2012). For this reason, in this study, a probe concentration of 0.2 mM was used.
The wavelength of maximum fluorescence emission pro-vides information about the hydrophobic properties of the dough, as it relates to alterations in the chemical environ-ment that surrounds hydrophobic “reporters” (amino acids residues such as tryptophan or non covalently bound probes, such as ANS in this study). In this study, the maxi-mum intensity of ANS emission remained at 470 nm for all the samples, indicating a stable environment for the bound probe (see Figure 1).
Differences in intensity values among the samples sug-gest different exposure of hydrophobic sites on the protein surface (see Figure 2). In particular, low intensity suggests high hydrophobic interactions between proteins. In other words, hydrophobic regions involved in protein-protein interactions were no longer available for binding of the probe and therefore decreased fluorescence intensity was observed. The effect of the location on hydrophobic interactions in wheat doughs seems to be predominant to the effect of the year. Indeed, dough samples can be clearly distinguished into two groups: the varieties culti-vated in Roseau and those cultivated in Oklee exhibited high intensity, while samples cultivated in Stephen in 2012 and 2013 were characterized by low maximum intensity values, indicating a more compact network structure as a result of either low exposure (intramolecular hydropho-bic interactions) or increased intermolecular hydrophobic interactions.
Assessing Gluten Quality - Acquisition of Front Face Fluorescence Spectrophotometer to Study Gluten Quality
Franciso Diez-Gonzalez, Dept. of Food and Nutrition, U of M, St. Paul
2014 RESEARCH REPORT

Page 100
continued from page 99
The emission fluorescence spectra in Figure 1 provide evidence for the appearance of a red-shifted shoulder in the emission fluorescence spectrum (especially for dough samples prepared from Knudson, Marshall, and Samson). Indeed, the extent of probe exposure may be inferred by the ratio of fluorescence intensity at emission wavelengths typical of each species (Caldinelli et al., 2004). The shift toward 505 nm with ANS represents a re-orientation of the probe in the hydrophobic patches of the protein from a mostly buried location to a partially exposed one, which leads to a red-shift in fluorescence. Figure 3 shows the ratio between ANS fluorescence intensities at 505 and 470 nm. This ratio provides an estimate of the ‘‘red shift’’ in the fluorescence emission of protein-bound ANS. In general, Knudson and Samson exhibited an important shift towards 505 nm of the fluorescence emission maximum compared to Marshall and Prosper. Depending on the variety, loca-tion and year increased or decreased the exposure of ANS but a clear trend was not observed (see Figure 3).
Finally, comparing the results obtained from ANS fluo-rescence and those from the Glutopeak test - a new high shear based test that measures the aggregation properties of gluten in wheat flour - a significant negative correlation between the maximum torque (that corresponds to the peak occurring as gluten aggregates) and the fluores-cence intensity (r=-0.71; p<0.01) suggesting that flours with greater number of hydrophobic patches on the protein surface (great fluorescence intensity) create a weak gluten network during aggregation.
Application/Use
The approach here proposed is a rapid technique that requires small amount of sample (10 g for dough prepara-tion; ~1g for analysis). For this reason, it can be used as a routine part of the research working with plant breeders to assess different wheat varieties. In addition, understand-ing the hydrophobic interactions in wheat dough comple-ments the research capabilities and leverage synergies to both assess quality and understand the reasons for wheat variability. Moreover, the quantitation of protein hydropho-bicity can be an essential step for prediction of protein functionality.
Material and Methods
Thirty-two varieties of spring wheat were grown in differ-ent locations (Roseau, Oklee, and Stephen) in 2012-2013, for a total of 128 samples were characterized using a new approach that measures the aggregation properties of wheat gluten. On the basis of the results, 4 varieties (Knudson, Marshall, Prosper, Samson) were chosen for investigating the hydrophobic interactions during dough-making.
Rearrangement of hydrophobic patches on the protein surface of selected samples were measured by spectro-fluorometric technique, monitoring the chemical environ-ment of extrinsic flourophore1,8-anisolino naphthalene sulfonate (ANS), as described by Bonomi et al. (2004). A Farinograph-AT (C.W. Brabender Inc., South Hackensack, NJ, USA) equipped with a 10 g mixing bowl was used for preparing the dough (at 30°C and 63 rpm). All the dough samples were prepared at a constant water absorption level (60%). ANS (0.2 mM) was added to the water used for making the dough. Dough samples for analyses were collected at the dough development time, corresponding to the time from first addition of water to the point of maxi-mum consistency range. Fresh samples were pulled from the farinograph with minimal additional physical manipula-tion, transferred to a fluorescence cell (quartz-windowed standard surface) and analyzed within 3 min. A fluoropho-tometer (LS 55, Perkin Elmer, Waltham, MA, USA) was used to measure emission spectra from 400-600 nm with excitation at 390 nm.
References
Bonomi, F., Mora, G., Pagani, M. A., & Iametti, S. (2004). Probing structural features of water insoluble pro-teins by front-face fluorescence. Analytical Biochemistry, 329, 104–111 Caldinelli, L., Iametti, S., Barbiroli, A., Bonomi, F., Piubelli, L., Ferranti, P., et al. (2004). Unfolding intermediate in the peroxisomal flavoprotein D-amino acid oxidase. Journal of Biological Chemistry, 279, 28426–28434. Huschka, B., Bonomi, F., Marengo, M., Miriani, M., Seeth-araman, K. (2012). Comparison of lipid effects on struc-tural features of hard and soft wheat flour proteins as-sessed by front-face fluorescence. Food Chemistry, 133, 1011-1016.
Related Research
Previously Dr. Seetharaman has published a study on the effect of differences in flour type relating to their protein quantity and quality on their tryptophan solvation behavior as well as their affinity for hydrophobic probes.The project is a collaboration with Dr. Jim Anderson, Wheat Breeder, University of Minnesota and used wheat varieties devel-oped by other scientists in the region.
Recommended Future Research
• Relating gluten aggregation properties and hydro-phobic interactions testing a larger number of varieties, years and locations • Applying proteomics and thiolomics approach to understand variability in flour performance from wheats grown in different environmental conditions.

Page 101
continued on page 102
Figure 1. Fluorescence emission spectra of dough samples collected at the dough development time
Appendix

Page 102
Figure 2. Fluorescence intensity of dough samples corrected for the protein content. Lower values indicate better quality.
Figure 3. Ratio between ANS fluorescence emission intensities at 505 nm and 470 nm. Higher values indicate better quality.
continued from page 101
Page 103
continued on page 104
Research Questions
• To determine the relative efficacy of different active ingredients for control of root rot diseases
• To develop best management practices for the use of seed treatments for spring wheat production in Minnesota
Results
In 2013 across all locations, no significant differences were detected in stand counts, plant heights, biomass or grain yield either between treatments or compared to the untreated control. In 2014, again no differences were detected for grain yield either between treatments or compared to the untreated control, except in the trials near Fergus Falls and Benson. In the Fergus Falls trial tebuco-nazole reduced grain yield compared to the untreated con-trol (p=0.005). In the trial near Benson Raxil MD increased yield compared to the untreated control (P=0.015). This increase in grain yield was likely the result of a higher initial stand observed with Raxil MD when compared to the control (P= 0.014).
No late season symptoms were observed in plots at any of the sites in 2013 or 2014. Preliminary data from the fungal isolations made on mature crowns and roots suggests however that several fungal species, including Fusarium spp. can readily be found. Fungal isolations will continue through the winter months and this data will be analyzed to see if there are any differences in the fungal populations evident between treatments.
The preliminary results from this study suggest that seed treatments will not be needed indiscriminately for the pro-tection of initial stand. The decision to use a seed treat-ment therefore will continue to be a function of the condi-tion of the seed lot and whether loose smut or other seed born disease require control and/or the field history. In only 1 out of 8 environments across the past two years did one of the seed treatments result in a better initial stand compared to the untreated control. In addition, the pre-liminary data from the fungal isolations clearly show that, whilst we might be able to protect the germinating seed and therefore the initial stand establishment, mature plants are still susceptible to late-season infections. These data suggest that seed treatments are not efficacious through-out the whole growing season. Being able to control and/or reduce infections past the window of efficacy of the seed treatments is an important factor in years when
plants are at risk of drought stress. These infected root systems are compromised and are less efficient at tak-ing up water and nutrients. Therefore, rather than relying on seed treatments, genetic resistance to crown and root rot may provide better all-round disease control with less economic risk compared to a seed treatment.
Application/Use
Several fungal species are known to attack wheat seedlings which can result in seedling blights causing poor initial stand establishment. These include fungi such as Pythium spp., Fusarium spp., Rhizoctonia, and Bipolaris sorokiniana. In order to combat this, many crop protection companies have developed seed treatments which aim to combat these diseases and improve seedling vigor. This has led to their wide adoption in wheat growing regions around the world. However, there is little evidence in the scientific literature to demonstrate the efficacy of seed treatments against different fungi and the cost benefit of using these treatments to the grower each year.
Trying to understand which fungicide treatments give the best control of root diseases and the environmental fac-tors which put stand establishment at the most risk, allow growers to only pay for seed treatments when they are likely to provide a benefit to the crop
Material and Methods
In 2013 and 2014 trials were located at four on-farm lo-cations around the state of Minnesota. In 2013 sites were located at Strathcona, Crookston, Fergus Falls and Kim-ball. In 2014 The same locations were used except that the southern location was moved from Kimball to Benson. A randomized complete block design with 5 replicates was set up at each location. Plots were 5ft x 15 ft.
The seed treatments ( listed in table 1 in the appen-dix) were applied to seed using a Hegi small-batch seed treater to coat seed. The rate of the product applied was selected according to labelling regulations. Treatments were selected on the basis of utilizing a range of different fungicides with different modes of action, and selecting both products which combine different fungicides as well as having individual active ingredients represented.
Seed Treatment Trial Evaluating the Effectiveness of Different Active Ingredients Against Latent Root Rot and Crown Rots of Wheat
Madeleine Smith, Northwest Research and Outreach Center, Crookston
2014 RESEARCH REPORT
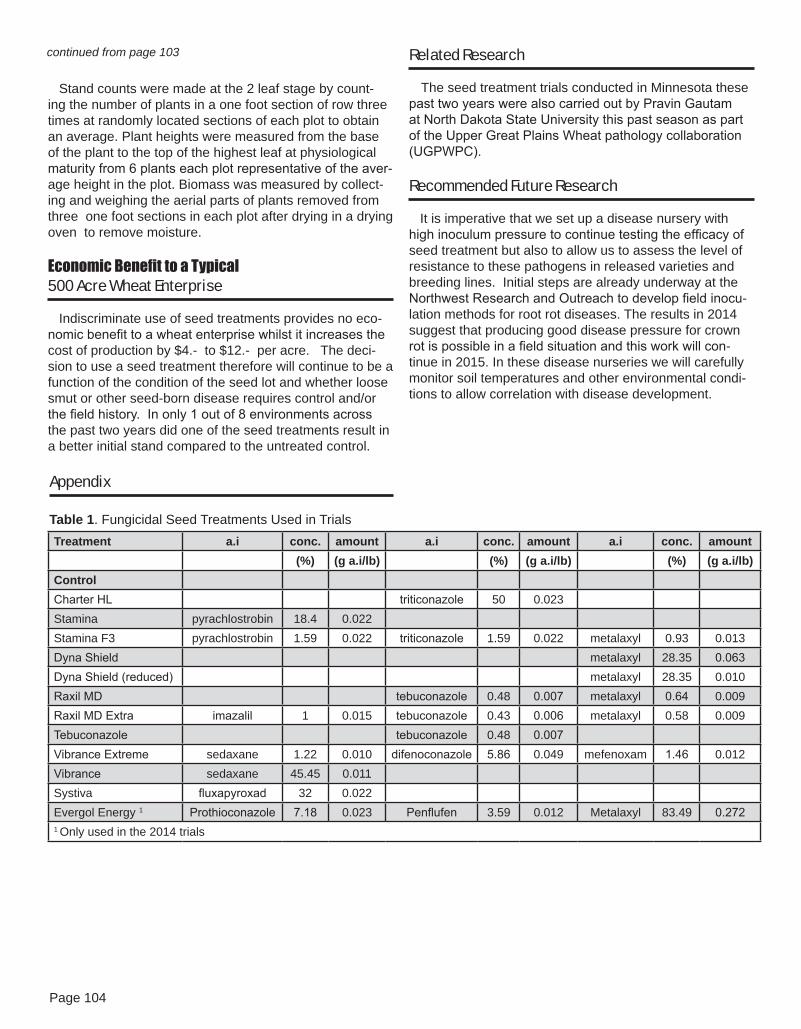
Page 104
Stand counts were made at the 2 leaf stage by count-ing the number of plants in a one foot section of row three times at randomly located sections of each plot to obtain an average. Plant heights were measured from the base of the plant to the top of the highest leaf at physiological maturity from 6 plants each plot representative of the aver-age height in the plot. Biomass was measured by collect-ing and weighing the aerial parts of plants removed from three one foot sections in each plot after drying in a drying oven to remove moisture.
Economic Benefit to a Typical 500 Acre Wheat Enterprise
Indiscriminate use of seed treatments provides no eco-nomic benefit to a wheat enterprise whilst it increases the cost of production by $4.- to $12.- per acre. The deci-sion to use a seed treatment therefore will continue to be a function of the condition of the seed lot and whether loose smut or other seed-born disease requires control and/or the field history. In only 1 out of 8 environments across the past two years did one of the seed treatments result in a better initial stand compared to the untreated control.
Treatment a.i conc. amount a.i conc. amount a.i conc. amount (%) (g a.i/lb) (%) (g a.i/lb) (%) (g a.i/lb)Control Charter HL triticonazole 50 0.023 Stamina pyrachlostrobin 18.4 0.022 Stamina F3 pyrachlostrobin 1.59 0.022 triticonazole 1.59 0.022 metalaxyl 0.93 0.013Dyna Shield metalaxyl 28.35 0.063Dyna Shield (reduced) metalaxyl 28.35 0.010Raxil MD tebuconazole 0.48 0.007 metalaxyl 0.64 0.009Raxil MD Extra imazalil 1 0.015 tebuconazole 0.43 0.006 metalaxyl 0.58 0.009Tebuconazole tebuconazole 0.48 0.007 Vibrance Extreme sedaxane 1.22 0.010 difenoconazole 5.86 0.049 mefenoxam 1.46 0.012Vibrance sedaxane 45.45 0.011 Systiva fluxapyroxad 32 0.022 Evergol Energy 1 Prothioconazole 7.18 0.023 Penflufen 3.59 0.012 Metalaxyl 83.49 0.2721 Only used in the 2014 trials
Table 1. Fungicidal Seed Treatments Used in Trials
Related Research
The seed treatment trials conducted in Minnesota these past two years were also carried out by Pravin Gautam at North Dakota State University this past season as part of the Upper Great Plains Wheat pathology collaboration (UGPWPC).
Recommended Future Research
It is imperative that we set up a disease nursery with high inoculum pressure to continue testing the efficacy of seed treatment but also to allow us to assess the level of resistance to these pathogens in released varieties and breeding lines. Initial steps are already underway at the Northwest Research and Outreach to develop field inocu-lation methods for root rot diseases. The results in 2014 suggest that producing good disease pressure for crown rot is possible in a field situation and this work will con-tinue in 2015. In these disease nurseries we will carefully monitor soil temperatures and other environmental condi-tions to allow correlation with disease development.
continued from page 103
Appendix
Page 105
Treatment a.i conc. amount a.i conc. amount a.i conc. amount (%) (g a.i/lb) (%) (g a.i/lb) (%) (g a.i/lb)Control Charter HL triticonazole 50 0.023 Stamina pyrachlostrobin 18.4 0.022 Stamina F3 pyrachlostrobin 1.59 0.022 triticonazole 1.59 0.022 metalaxyl 0.93 0.013Dyna Shield metalaxyl 28.35 0.063Dyna Shield (reduced) metalaxyl 28.35 0.010Raxil MD tebuconazole 0.48 0.007 metalaxyl 0.64 0.009Raxil MD Extra imazalil 1 0.015 tebuconazole 0.43 0.006 metalaxyl 0.58 0.009Tebuconazole tebuconazole 0.48 0.007 Vibrance Extreme sedaxane 1.22 0.010 difenoconazole 5.86 0.049 mefenoxam 1.46 0.012Vibrance sedaxane 45.45 0.011 Systiva fluxapyroxad 32 0.022 Evergol Energy 1 Prothioconazole 7.18 0.023 Penflufen 3.59 0.012 Metalaxyl 83.49 0.2721 Only used in the 2014 trials
continued on page 106
Introduction:
Historically, the wheat breeding programs at the public universities in the spring wheat region which include MN, ND, MT, and SD have played a major role in the wheat production by releasing well adapted and very competitive wheat cultivars. Among these wheat breeding programs, NDSU is well recognized for its well adapted and high quality germplasm and cultivars. While our goal is to main-tain that hallmark germplasm/cultivars, more emphasis was made recently, in developing high yielding cultivars to meet our growers demand, particularly in the high inputs regions of the Western MN and Eastern ND regions. By combining NDSU resources and the support from the Minnesota Wheat Research and Promotion Council (MN-WRPC), our efforts have bared fruits in 2007 when spring wheat cultivar ‘Faller’ was released by NDSU. Faller has been a major cultivar in the region. It has been the leading cultivar in MN from 2009 to 2012 and the second leading cultivar in ND from 2009 to 2013. Faller was truly, the first variety that combines high yield potential with relatively good quality attributes, challenging all other high yield-ing cultivars released by other breeding programs in the spring wheat region. Just two years after its release, Faller became the leading cultivar in MN in 2009. At a time, 30% of MN total wheat acreages were grown to Faller. In 2013, Faller was still grown on 17.27%, second only to the other NDSU cultivar ‘Prosper’ released jointly with the Univer-sity of MN in 2011. Prosper was released to enhance the wheat production and improve incomes of wheat growers in MN and ND as did Faller. Indeed, just like Faller, Pros-per, after just two years of its release, become the lead-ing cultivar in MN in 2013. In 2014, Faller was planted on 20.7% of total MN wheat acreages followed by Faller with 13.5%. Combined together, the MN wheat acreage grown to both Faller and Prosper surpassed 35% in 2014. De-mand for new adapted cultivars to the MN environments which combine high yield and good and “marketable” qual-ity traits such as grain protein are needed and continues to be a major challenge to the wheat breeding programs. The MNWRPC is well aware of this important research and breeding components and appreciate the impact of new adapted cultivars on the MN wheat growers and the wheat industry. Therefore, the MNWRPC has funded this project since 2011. Continuing support by the MNWPRC to our program will allow us to continue our efforts to release adapted cultivars to the MN wheat growers.
Objectives
This project aims to continue developing superior spring wheat cultivars targeted to MN, particularly the Western wheat growing environments. These cultivars should pos-sess the following traits: • High yield potential. • Good quality characteristics which allow premiums for wheat growers and sustainable competition on the international market. These traits include mainly protein content, milling and baking characteristics. • High levels of resistances to dominant diseases such as leaf diseases including leaf and stem rusts, a continuous threat to wheat. • Good resistance to Fusarium head blight (Scab), still a major disease for wheat in MN and the region. • Resistance to leaf spotting diseases and bacterial leaf diseases that can be devastating in some years.
Research Activities and Prodecures
The funds provided by this project were used to expand our final testing of elite HRSW germplasm developed by our program to an additional two locations in the Western MN (Red River Valley) where wheat is dominant. These two locations were Alvarado and Wolverton, MN. Agro-nomic data including diseases reactions were collected on these advanced yield trials conducted in 2014 at the two MN locations and three other ND testing locations in the Red River Valley (Casselton, Prosper, and Langdon, ND). Unfortunately, in 2014, excess of rain has caused floods at the Wolverton site, which was lost. Therefore, only data from Alavardo site will be presented for 2014 research activities in MN. Currently, seed from this trial are being processed to be send to the quality lab to generate quality performance including grain characteristics, milling and baking data. These data are critical for selecting elite adapted lines further testing or potential cultivars release. In the years spanning this project, several research activi-ties have been conducted by the NDSU spring wheat breeding program in order to achieve this goal. Although these activities have a multidisciplinary character, the wheat breeding program did coordinate them to make sure that the objectives of the project are being addressed efficiently and timely. Among these research activities we can list the following activities:
Continuing Breeding Adapted Spring Wheat Cultivars to Better Serve Minnesota Wheat Growers
Mohamed Mergoum, Dept. of Plant Sciences, NDSU
2014 RESEARCH REPORT

Page 106
continued from page 105
1. Crosses and populations development:About 200 new crosses were specifically made in 2014 to incorporate traits of economic values for wheat grow-ers and industry in the Western MN and Eastern ND into our adapted germplasm. These crosses involved parental lines among the most grown cultivars and elite genotypes adapted to MN environments. These crosses were con-ducted in the Fall and Spring in greenhouse cycles. The F1’s generated by these crosses were (for the crosses made in Fall)/will (for crosses made in Spring) be planted in the greenhouse to generate the F2 populations. The F2 segregating populations generated from the F1’s are usually planted in field each summer. Breeding cycles have now progressed such that many of the new adapted parents have diseases (leaf diseases, FHB…etc.) resis-tances, high yield potential and quality. The key is to com-bine these important traits in one genotype. About 100-200 spikes are selected from the most promising F2 population to be advanced for further generations’ advancement and selections. Subsequently, five to 10 spikes from each se-lected F3 lines are threshed and shipped to New Zealand or Arizona as head-rows for generation advancement and selection for some agronomic traits (lodging, height, matu-rity, shattering, and other plant type). Similar procedures is followed to advance and select this germplasm in further segregating generations until most genes are homozygous for desirable traits.
2. Diseases evaluation/screening:Geramplasm planted in the field were subjected to screen-ing for prevalent diseases in the field. In addition, rusts and Scab screening nurseries are installed in many loca-tions including Prosper, Carrington, and Langdon, ND. Screening of elite material is also done in the greenhouse as well as by our colleagues in Dept. of Plant Pathology.These nurseries provide field screening for leaf diseases, FHB, bacterial blight,..etc resistances of germplasm coming from targeted segregating generations as well as advanced/ elite lines. In 2014, F2 and following gen-erations were screened for most prevalent diseases in the field and in the FHB screening nursery. Among the diseases screened for in the field, leaf diseases (rusts, and leaf spotting diseases), FHB, bacteria and insects (in some years) are the main stresses that are our breeding program is facing. Therefore, all breeding material planted in the jor ones. In addition to the filed screening, the ad-vanced material is subjected to more scrutinized screening for rusts and FHB in specific diseases nurseries. These additional nurseries are installed in Fargo, Prosper, Car-rington, and Langdon, ND. Furthermore, screening of elite material is also done in the greenhouse with emphasis on the new leaf rust race that has overcome the Lr21 gene. This major gene has been used widely for decades to pro-tect our germaplsm against leaf rust in the region. Among the cultivars that have this gene are Faller and Prosper. Fortunately, many other cultivars and germaplsm carry other genes that protect against this new race. In general,
we screen the germaplsm included in the yield trials for the new race under filed condition. 3. Early generations and preliminary and intermedi-ate yield trials evaluation/testing:In 2014, the breeding program evaluated about 200 F2 populations and 16,000 of F3 and F4 generations that were designed for the Eastern ND and Western MN. Similarly, about 1400, and 550 F5 and F6/F7 lines were evaluated for disease resistances and agronomic traits in the pre-liminary yield trials (PYT) and intermediate trials (IYT), respectively. PYTs were conducted in non-replicated plots while IYTs have two replicates in randomized bloc design. Agronomic and disease notes were taken from the field and seed of these entries were evaluated for some quality traits in the laboratory (Dr S. Simsek). These lines were be advanced either to IYT (from PYT) or advanced yield trials (AYT) following cycle.
4. Screening and evaluation of advanced and elites lines: a. MN Testing sitesAs in past few years, with the support of the MNWRPC, the advanced yield trial including 75 lines and checks se-lected from previous yield trials was installed at two extra locations in Western MN in 2014 as it we did in the previ-ous 3 years. The two locations were Wolverton (Southwest MN) and Alvarado (Northwest MN). These two locations are relatively contrasting sites of the Red River Valley where spring wheat is a major crop. These trials were con-ducted in randomized bloc design with 4 replicates. b. ND Testing: The same yield trial conducted in MN sites was tested in 2014 in several locations across ND with three locations in the Red River Valley. These locations are Casselton, Prosper and Langdon. The other yield trials including PYT, IYT, and AYTs were conducted in many sites in the Eastern parts of ND. Number of replicates and experimental design of these trials are similar to those conducted in MN.
5. Quality Evaluation:Samples from plot for the 2014 elite yield trials installed at MN and ND and all other yield trials are sent to our quality laboratory for quality tests. Data on grain characteristics, milling, and dough and baking attributes will be generated for genotypes included in these trials. These data gener-ated each year, are combined with the agronomic perfor-mance had allowed us to make decision whether we need further testing, seed increase, or discard lines. Lines for potential release are also included in these trials and data helped us making decision for final decision. This was cer-tainly, the case of Faller, Prosper, and the 2013 released cultivar Elgin-ND.
6. Markers Assisted Selection (MAS):The use of MAS based on known molecular markers for some quality and disease resistance traits is conducted in collaboration with the Genotyping Center at the USDA-

Page 107
continued on page 108
ARS at Fargo (Dr. Chao Lab.). As in the past, in 2014, DNA samples from about 1500 lines included in the yield trials will be sent to the USDA_ARS Fargo genotyping Center to determine the presence/absence of selected molecular marker in these lines. Particularly, molecular markers for FHB resistance located on chromosome 3BS (Sumai3), leaf diseases, grain protein content,…etc, will be utilized in the screening. The use of these markers is helpful in indicating the absence/presence of the genes of interest. This also helps us in planning our crosses to start combining and pyramiding different genes for some traits including FHB, and rusts.
7. Uniform Regional Nurseries (URN):In 2014, the “traditional” URN was re-lunched again. The URN replaced the “Tri-state Cooperative Trial” (TCT) which included elite material from the three public (ND, MN, and SD) spring wheat breeding programs only and which was established for the first time in 2011. This trial was established to replace the URN that was historically conducted in the spring wheat region.
The 2014 URN included 31 genotypes (25 lines and 6 checks) from divers breeding programs. Our breeding program included five lines in these trials. The URN were conducted in five locations in ND including the Red river Valley at Prosper and Langdon.
Main Results
The weather conditions in 2014 were yet unusual. Due to heavy rains, the Woleverton location was flooded, therefore we lost it. Alavarado however, was overall good except for some lodging that occurred as a results of heavy rains that prevailed late in the season. Therefore, in this report only agronomic data collected at Alavarado are reported. Seed form this location along with other ND loca-tions are being processed to be sent to the quality lab. for further analysis and generating data on milling and baking performance.
As in the past, the data on yield and other major agro-nomic and quality traits collected across both MN and ND locations during the advanced generations testing are vital for making decision for releasing cultivars or advancing elite germplasm for further testing. Grain yield is consid-ered the top choice trait by growers for cultivar selection in the MN and eastern ND regions. Quality, particularly pro-tein is also considered when choosing cultivars by grow-ers. In this report, for the above reasons and because the quality data are not ready, we focus mainly on grain yield of lines grown in 2014. Hence, the yield data for the MN site ALavarado are represented in Figure 1 for 2014; and Figures 2 and 3 for 2013 (also reported in 2013 report). Yields levels at Alvarado were relatively high in both 2014 (Figure 1) and 2013 (Figure 2) seasons compared to those obtained at Wolverton (Figure 3) (2013 only). The overall average yield at Alvarado in 2014 was 61.6 bu/ac and the
highest performing genotype was Faller with 76.8 bu/ac. Among the non-released lines, two had high yield, similar Faller, with higher test weight for one line. Quality data will reveal if the high yielding lines have better quality perfor-mance than Faller and Prosper. In 2013, yields levels (Figures 2 and 3) –as reported in 2013 report- achieved at MN locations were high, par-ticularly at Alavarado (Figures 2). This reflects the record yield achieved overall in the State of MN. The average yield trial was 88.3 and 57.3 at Alvarado and Wolverton, respectively. Faller was the highest yielding cultivar in both locations reaching the maximum yield levels of 100.1 and 79.6 bu/ac, followed by Prosper with 99.6 and 77.8 bu/ac at Alvarado and Woleverton, respectively (Figures 2 and 3). In the same trials, 27and 15 lines had yields between 91 1nd 100 bu/ac at Alvarado and more than 71 bu/ac at Wolverton. The yields of the recently released cultivar “Elgin-ND” across Alvarado and Wolverton were 96 and 74.5 bu/ac, respectively (Figures 2 and 3). Major Achievements
Elite yield trials conducted since 2011 at MN and eastern ND generated valuable data for our breeding program. In 2014, samples from these trials will be analyzed for quality performance at the NDSU quality lab. and DNA samples from these genotypes will be sent to the USDA-ARS lab to be diagnosed for several molecular markers. The data generated from these trial allow us to identify potential lines for release or to advance for further testing in the future.
With the funding from the MNWRPC -which started even prior to 2011- our breeding program developed several cultivars that have contributed significantly to the MN wheat growers’ income. Among these cultivars, Faller, Prosper and recently Elgin-ND are millstones in our breed-ing program.
• Elgin-ND: This is the most recent released (2013) cultivar of our breeding program. Elgin-ND, in general has much higher yield than all other cultivars except Faller and Prosper. While Elgin-ND’ yield over many years is close to Faller yield, its protein level is significantly higher than both Faller and Prosper. The yields of Elgin-ND at Alavara-do in 2014 was 66 bu/ac compared to 76.8 and 73.3 bu/ac for Faller and Prosper, respectively (Figure 1). Similarly, in 2013, Elgin-ND yields were also high (96 and 74.5 bu/ac) compared to Faller (100.1 and 79.6 bu/ac) and Prosper (99.6 and 77.8 bu/ac) at Alvarado and Woleverton, re-spectively (Figures 2 and 3). In 2012, across Alvarado and Wolverton, Elgin yields were respectively, 69.8 and 66 bu/ac compared to 74.9 and 64.1 bu/ac for Faller. In the same trial Prosper yields were 82.6 and 66.2 bu/ac, respec-tively. In ND (Table 1), Elgin-ND performed very well in ND across many years/locations from 20008-13. Particularly

Page 108
continued from page 107
in Eastern ND environments which are similar to Western MN, Elgin-ND yield was close to both Faller and Prosper (Table 1).
• Prosper: In 2011 NDSU and the U of MN have jointly released the NDSU developed hard red spring wheat cul-tivar Prosper. It is a semi-dwarf variety with an early to me-dium-early maturity and has exceptionally high yield that equals Faller. It is moderately resistant/moderately sus-ceptible to FHB and resistant to stem rust. Prosper was released to enhance the wheat production and improve incomes of wheat growers in MN and ND as did Faller. Indeed, just like Faller, Prosper, after just two years of its release, become the leading cultivar in MN in 2013 with 17.3% followed by Faller by 17.27%. Combined together, the MN wheat acreage grown to both Faller and Prosper surpassed 34.5% in 2013. In 2014, Prosper acreages in-creased to 20.3% while Faller had 13.46% of MN acreag-es. Both Prosper and Faller are also dominant in ND with 11.7 and 8.8% of ND 6 million acres. Their performance, particularly in Eastern ND was shown to be superior to all cultivars across several years/locations (Table 1).
• Faller: the 2007 release of Faller was a milestone in our NDSU wheat breeding program since it was the first high yielding released cultivar with relatively good qual-ity attributes, challenging all other high yielding cultivars
released by other breeding programs in the spring wheat region. Faller was mainly targeted to the Eastern ND and Western MN because of it very high yield and good disease package. Just two years after its release (2007), Faller became the leading cultivar in MN from 2009 to 2012. At a time 30% of MN total wheat acreages were grown to Faller. In 2013, Faller was still grown on 17.27% second only to Prosper, the other NDSU cultivar released in 2012. In 2014, Faller was still dominant in MN with 13.46% of MN acreages. Faller has been also very popu-lar in ND and performs very well compared to the other leading cultivars including Glenn and Barlow (Table 1). Faller was the second leading cultivar in ND (up to 17.2% of ND 6 million acres) from 2009 to 2011. In 2014, it was still occupying 8.8% of the ND total wheat acreages.
Based on the above statistics, the impact of our breed-ing program on the MN wheat growers through the release of adapted and modern HRSW cultivars is substantial. NDSU cultivars released since 2007, including Faller and Prosper have played a major role in the wheat production in MN, the wheat industry in the US, and wheat export market internationally. It is estimated that Hundreds of mil-lions of dollars may have been generated by these culti-vars for the wheat business as a whole and for MN wheat growers, in particular. Continuing such impact in the future by releasing more adapted and highly perform-ing cultivars remains our goal. To achieve this goal, the support from the MNWRPC is paramount.
No VarietyDays
Heading Height LodgeTomb
stones Leaf DiseaseTest
WeightGrain Yield
Grain Protein
days inch 1-9 % % Lb/bu Bu/ac %
1 Barlow 53.5 33.5 2.2 1.9 9.7 60.9 67.9 14.72 Glenn 53.0 34.9 0.7 0.1 14.5 62.6 64.7 14.83 SY Soren 52.0 27.4 0.0 0.3 16.3 60.8 64.6 15.24 Faller 56.5 33.3 1.9 0.2 12.0 60.2 76.7 13.85 Prosper 56.7 33.2 2.6 0.2 8.6 60.1 75.1 13.96 Kelby 54.6 28.6 1.5 0.5 18.1 59.7 59.6 15.37 Brennan 55.4 28.6 1.9 1.3 21.2 59.6 62.1 15.38 RB07 54.1 31.3 1.7 0.2 24.7 59.8 68.8 14.69 Vantage 59.4 31.3 0.0 2.6 9.4 61.5 65.2 15.810 Elgin-ND 53.9 35.1 3.0 0.6 12.3 59.9 71.4 14.811 Velva 58.0 32.8 1.5 3.4 8.8 58.3 65.1 14.612 Linkert 53.1 27.5 0.0 0.9 13.8 60.8 60.4 15.613 Forefront 49.6 33.9 6.4 0.4 18.8 61.2 62.6 15.014 Advance 52.4 30.0 1.3 1.0 13.8 61.5 65.9 14.0
Table 1. Agronomic performance of Elgin-ND and HRSW checks in Eastern ND during 2008-2013 (32 environments).

Page 109
Figure 1: Frequency distribution of hard red spring lines in relation-ship with yield levels achieved at Alvarado, MN during 2014. NB: Bars for the checks Faller, Glenn, Barlow and Prosper represent yield in bu/ac.
Figure 2: Frequency distribution of hard red spring lines in relationship with yield levels achieved at Alvarado, MN during 2013. NB: Bars for the checks Velva, Elgin-ND, Faller, Glenn, Barlow and Prosper represent yield in bu/ac.
Figure 3: Frequency distribution of hard red spring lines in rela-tionship with yield levels achieved at Wolverton, MN during 2013 (2 replicates only). NB: Bars for the checks Ave. trial, Max, Elgin-ND, Faller, Barlow, and Prosper represent yield in bu/ac.

Page 110
Research Questions
Yield of HRSW is affected by many agronomic practices starting with choice of the cultivar, the planting date, and seeding rate. Previous research has shown that optimum seeding rates differ for individual cultivars (Wiersma, 2004). This research project specifically explores the relationship between a set of genetic traits, including semi-dwarf stature and day length sensitivity, of individual cul-tivars, planting dates, and seeding rates, and to develop regression models that supersede individual cultivars and looks to explain how a group of genetically similar varieties respond to seeding rate.
Results
In both 2013 and 2014 the environment was atypical in that the accumulated growing degree days was behind the historical 30 year average, evidence of a cooler than normal growing season that proves hard red spring wheat response to seeding rate is not always as pronounced as what is expected (Figure 3). At the Kennedy North Dakota Agricultural Weather Network (NDAWN) station, which is just nine miles from the Hallock, MN field trial, there is evidence that the summer was cooler overall, especially at periods of grain fill. Table 2 has results of the seeding rate factor at all environments from 2014. Of the nine environ-ments, four had a range in grain yield of less than 4 bu/ac across the five seeding rates. The other five locations had yield ranges of 5-8 bu/ac across five seeding rates. Within and across locations there were no significant variety by seeding rate interactions in 2014 and therefor no variety specific seeding rate response regressions can be developed. However, the single seed hill plots proved that cultivars have varying propensity to tiller. At Prosper, ND, averaged over all four planting dates as no significant interaction existed, the cultivar ‘Sabin’ had significantly higher stems per plant than any other cultivar (Table 3). Results from Prosper reiterate the importance of tillering when choosing a seeding rate for a specific cultivar. Con-trary to Prosper, ND, results from Crookston, MN, show that with each successive planting date later into the sea-son, the number of stems per plant decreased (Table 4). Two cultivars, ‘Marshall’ and ‘Rollag’ increased total num-ber of stems at the second planting date compared to the first, but followed the general trend at the last two planting dates. Results confirm that as HRSW is planted later, a higher seeding rate should be considered as less tillers can be expected. Varieties and their genetic make-up, in-cluding semi-dwarf stature and day length sensitivity, influ-ence this response. Results from stand counts and head counts leading to a total stems per plant calculation within the solid seeded trials showed a far smaller spread than
in the hill plots, as expected, though six of nine environ-ments had significant differences between cultivars (Table 5). Yield results from the planting date effect from the past two years with cooler than normal periods indicate that increasing seeding rate at later than optimal planting dates will not significantly increase or decrease yield (Table 6). Thus, the unpredictability of growing conditions, especially during critical growth periods, indicate the importance of erring on the side of increased seeding rate. Figures 1 and 2 begin to show the results that were intended from the hypothesis of this research. In 2013, at Crookston, MN, presence of the Rht2 gene at the early planting date did not result in a yield decrease as seeding rate increased, while cultivars that did not have the Rht2 gene had a pronounced yield decrease at increased seeding rates above the optimum. In contrast to that result, when the Rht2 gene was present in a cultivar and the planting date was three weeks later than optimum, the yield curve broke into a large yield decrease after the 1.4 million seeding rate, mirroring the curve of cultivars without Rht2. Results begin to show that knowledge of the genetic makeup of a plant with respect to certain qualitative traits could impact seeding rate decisions.
Application/Use
Evidence from 2013 was that for many cultivars, increas-ing seeding rate up to the highest rate lead to significantly greater yield. Yields in the late planting date at the three locations highlighted in table 5 and 6 show varying re-sults when increasing seeding rate. Evidence from the Crookston location in 2014 is that the highest seeding rate yielded greater than the four lower seeding rates in the late planting date while this trend was not seen in the early planting date. After two years of research the results do not allow us to recommend seeding rates through any genetic analysis of cultivars, however there is promise that this objective can be met.
Material and Methods
Six field locations were established in 2014 at Hallock, Crookston, Perley, Kimball, and Lamberton, MN and Prosper, ND. Locations were chosen to pair locations latitudinal, with Hallock and Crookston, Perley and Pros-per, and Kimball and Lamberton being paired. Four field locations were established in 2013 at Hallock, Crookston, and Perley, MN and Prosper, ND. Locations were chosen to run down latitude lines with Hallock being the valida-tion site for Crookston and Perley being the validation site for Prosper. Crookston (2013 and 2014), Prosper (2014), and Lamberton (2014) used a randomized complete
Optimum Seeding Rates for Diverse HRSW VarietiesJochum Wiersma, Northwest Research and Outreach Center, Crookston
2014 RESEARCH REPORT

Page 111
continued on page 112
block design (RCBD) with a split-split plot restriction with planting date as whole plot, HRSW cultivar as the split plot, and seeding rate as the split-split plot. Hallock (2013 and 2014), Perley (2013 and 2014), Prosper (2013), and Kimball (2014) were RCBD with a split plot restriction with HRSW cultivar as the whole plot and seeding rate the split plot. When planting date was a factor the first plant-ing date would be as close to optimal as possible, and the second planting date three weeks later. The HRSW culti-var factor was twelve cultivars split into six groups of two from known genetic associations for Rht1, Rht2, and day length sensitivity (Table 1). The seeding rate factor had five levels at 600,000, 1,000,000, 1,400,000, 1,800,000, and 2,200,000 live seeds/acre planted. The data collected were stand count at Feekes 1-2, head count at Feekes 11, height, lodging, and grain yield components. Stand counts and head counts were measured from a 3 ft length in two adjacent rows, and used to verify seeding rates and de-termine the number of stems per plant. An additional trial with single seed hill plots was done at Crookston, MN and Prosper, ND in 2014. The trial was designed as a RCBD with a split plot with planting date as the whole plot and cultivar as the split plot. The same twelve cultivars from Table 1 were used, and there were four planting dates at each location, separated by approximately one week. Single seeds were space planted on a one foot spaced grid. Number of stems were counted at Feekes 11.
Economic Benefit to a Typical 500 Acre Wheat Enterprise
Table 7 shows the yield trend at all five seeding rates at Hallock in 2013. Though there was an interaction of cultivar during 2013, this data is averaged over cultivar to show the impact of seeding rate. The optimum seed-ing rate for maximum bet income with yield from Hallock,
2013, and seed costs taken into account, is the 1.4 million seeds per acre rate. The second most economical seed-ing rate was 1.0 million seeds per acre, while 0.6 million seeds per acre would net the lowest. If a farmer were to plant 500 acres with the math from table 7 holding true, planting at the optimum seeding rate of 1.4 million seeds per acre would net $8,618 more than the most uneconomi-cal seeding rate of 0.6 million seeds per acre.
Recommended Future Research
From two years of research into the effect of plant-ing date, seeding rate, and diverse HRSW cultivars it is evident that a third year of research will be needed to fully test the objectives of the research. The atypical growing conditions encountered in either year, especially 2014, limit our ability to meat the objectives of the research. Although some of the data, in particular Figure 1 and 2, strongly suggest that the genetic make-up of contrasting groups of cultivars influences their response to seeding rate and that this response therefor should be able to be predicted. In 2013 we had a spring wheat average yield at Crookston optimum planting date on May 10, 2013 of 91 bu/ac, while at the planting date almost three weeks later on May 28, 2013 averaged a higher yield at 95 bu/ac. In 2014 the seeding rate by cultivar interaction was not as expected, due to cooler than average temperature dur-ing grain fill which allowed wheat tillers to even out yield between seeding rates. While the seeding rate response curve in 2013 is more like what we would expect, we simply do not have a large enough data set to draw robust conclusions and develop the regression models. We will submit a proposal for continuation of this research for the 2015 season, where after, if funded, we will draw final conclusions on the potential of the ideas proposed in this research for choosing a seeding rate based on genetic components of the HRSW cultivar.
Group Cultivar Day length Sensitivity Rht1 Rht2
1 Albany + + -Faller + + -
2 Knudson - + -Samson - + -
3 Briggs + - -Vantage + - -
4 Sabin - - -Oklee - - -
5 Kelby - - +Kuntz - - +
6 Marshall + - +Rollag + - +
Table 1. The HRSW cultivars included in research and presence of day length sensitivity, Rht1, and Rht2 genes

Page 112
continued from page 111
Location
Rate HallockCrookston
PD 1Crookston
PD 2 PerleyProsper
PD 1Prosper
PD 2 KimballLamberton
PD 1Lamberton
PD 2Million seeds/ac
----------------------------------------------------------------bu/ac----------------------------------------------------------------
0.6 76.9 71.3 64.5 88.1 64.8 44.2 83.8 71.6 58.41.0 81.8 75.2 67.2 89.8 65.9 49.1 83.5 75.2 61.51.4 81.8 73.2 67.9 90.7 66.4 48.9 82.6 78.1 63.71.8 82.0 74.2 67.9 88.8 66.5 49.8 80.7 78.0 65.72.2 82.3 73.9 70.5 88.7 65.7 49.0 81.2 79.5 63.8Mean 80.9 73.5 67.6 89.2 65.9 48.2 82.4 76.5 62.6Min 76.9 71.3 64.5 88.1 64.8 44.2 80.7 71.6 58.4Max 82.3 75.2 70.5 90.7 66.5 49.8 83.8 79.5 65.7Range 5.4 3.9 6.0 2.5 1.7 5.6 3.1 7.9 7.3LSD (0.5) 1.5 NS 2.6 NS NS 1.9 NS 2.2 3.3
Table 2. Effect of seeding rate on yield a 6 study locations, with 2 planting dates at 3 locations, 2014.
Cultivar Stems/plantSabin 43.9Marshall 36.1Albany 36.0Knudson 33.9Faller 31.7Oklee 28.4Kuntz 26.7Vantage 25.8Rollag 25.0Briggs 24.2Kelby 20.4Samson 18.7LSD (0.5) 6.2
Table 3. Effect of cultivar on total stems per plant, Prosper, ND, 2014.
Cultivar 23-May 30-May 6-Jun 23-Jun----------------stems/plant----------------
Albany 34.3 25.8 8.5 3.7Briggs 19.3 15.4 14.2 5.5Faller 29.6 26.2 16.3 16.4Kelby 14.3 13.2 11.5 6.5Knudson 24.7 21.5 14.3 8.1Kuntz 16.3 17.7 9.5 5.6Marshall 14.7 24.2 13.5 7.9Oklee 16.1 16.8 12.9 6.0Rollag 11.1 19.8 13.9 5.4Sabin 24.7 24.3 22.8 13.1Samson 18.2 13.8 14.2 7.2Vantage 20.8 20.0 10.6 4.4Mean 20.4 19.9 13.5 7.5LSD (0.05) 6.2 5.1 5.1 5.1
Table 4. Effect of cultivar by planting date interaction on total stems per plant, Crookston, ND, 2014

Page 113
continued on page 114
Cultivar
Location
HallockCrookston
PD 1Crookston
PD 2 PerleyProsper
PD 1Prosper
PD 2 KimballLamberton
PD 1Lamberton
PD 2--------------------------------------------------------stems/plant---------------------------------------------------------
Albany 2.35 1.98 1.51 2.08 2.70 4.24 2.37 3.04 3.26Briggs 2.35 2.04 1.66 2.40 2.93 3.56 2.46 2.78 3.39Faller 2.47 2.02 1.45 1.99 2.53 2.73 2.43 3.03 3.60Kelby 2.05 1.78 1.43 1.78 2.37 3.00 2.19 2.63 3.47Knudson 2.45 2.04 1.82 2.24 2.66 3.20 2.45 3.33 4.19Kuntz 1.71 1.65 1.54 1.70 2.37 3.77 2.12 2.52 3.04Marshall 2.21 1.97 1.60 2.32 2.91 4.16 2.30 3.13 3.60Oklee 2.28 1.69 1.46 1.75 2.18 2.49 2.12 2.80 3.12Rollag 2.75 1.97 1.60 2.02 2.58 4.05 2.43 2.77 3.22Sabin 1.93 1.74 1.25 1.92 2.30 2.58 1.96 2.77 2.52Samson 1.96 1.94 1.44 1.83 2.01 3.13 2.61 2.58 2.85Vantage 1.89 1.60 1.59 2.03 2.46 2.72 2.30 2.22 2.27Mean 2.20 1.87 1.53 2.01 2.50 3.30 2.31 2.80 3.21LSD (0.05) 0.33 0.26 0.23 0.30 0.73 0.68 NS NS NS
Table 5. Effect of cultivar on stems per plant at 6 study locations, with 2 planting dates at 3 locations, 2014.
Planting Date Lamberton, MN 2014600,000 1,000,000 1,400,000 1,800,000 2,200,000 LSD
---------------------------------------bu/ac---------------------------------------Early 71.7 75.2 78.1 78.0 79.5 2.8Late 58.4 61.5 63.7 65.7 63.8 4.0
Crookston, MN 2013Early 88.6 92.6 92.9 91.3 90.8 NSLate 91.0 94.8 97.0 95.5 96.2 NS
Crookston, MN 2014Early 71.3 75.2 73.2 74.2 73.9 NSLate 64.5 67.2 67.9 67.9 70.5 NS
Table 6. Effect of planting date by seeding rate interaction averaged over HRSW cultivar on yield at Lamberton and Crookston, MN, 2014

Page 114
continued from page 113
Figure 1. Effect of Rht2 gene on yield response to seeding rate in the early (optimal) planting date of May 10, Crookston, MN, 2013.
Figure 2. Effect of Rht2 gene on yield response to seeding rate in the late planting date of May 28, Crookston, MN, 2013

Page 115
Figure 3. Accumulated growing degree days at the Kennedy, MN, North Dakota Agricultural Weather Network (NDAWN) for the 2014 dates growing season of the Hallock, MN trial and the 30 year average at Kennedy site.
Table 7. Costs and benefits associated with seeding rate with yields from Hallock, MN, 2013
Seeding Rate Seeding Rate Seed cost 1 Yield Gross Income 2 Net IncomeSeeds/ac -Bushels/ac- --$/acre-- -Bushels/ac- ----$/ac---- ----$/ac----600,000 0.9 13.7 64.8 355.8 342.11,000,000 1.5 22.8 68.8 377.4 354.61,400,000 2.1 32.0 71.3 391.3 359.31,800,000 2.6 41.1 71.4 391.7 350.62,200,000 3.2 50.2 72.4 397.7 347.51 Seed cost of $15.50 per bushel of HRSW.2 December wheat price of $5.49
References
Wiersma, J.J. 2002. Determining an optimum seeding rate for spring wheat in Northwest Minnesota. Online. Crop Management doi:10.1094/CM-2002-0510-01-RS.

Page 116
Research
We have identified elevators in western Minnesota and eastern North Dakota that have price data for alternative spring wheat protein levels. Will be gathering this data over the next several weeks. We have also updated our existing protein spread information, which uses data from the USDA Agricultural Marketing Service for two major terminal markets.
A short presentation on spring wheat protein premiums/discounts was included in NDSU Agricultural Lenders Conferences. The Agricultural Lenders Conferences provides updates on crop, livestock and biofuels outlook, an update on farm program changes and a review of farm financial performance. Approximately 400 agricultural lenders from North Dakota, Minnesota, South Dakota and Montana attended this year conference in 2014.
A review of research studies concerning post-anthesis application of nitrogen to enhance wheat protein levels is underway. A draft of the post-anthesis decision tool is be-ing prepared.
Planning for the 2014/15 winter meeting season is un-derway, and we will coordinate with the Minnesota Wheat Research and Promotion Council to present preliminary results when they areavailable.
Progress Report to Minnesota Wheat Research and Promotion Council on the Spring Wheat Protein Spread Project
Frayne Olson, Dept. of Agribusiness and Applied Economics, NDSU

Page 117
2014 Wheat, Barley and Oat Variety Performance in Minnesota - Preliminary Report
The 2014 growing season was in many ways a carbon copy of the 2013 season. Overall, the spring wheat pleas-antly surprised most while the winter wheat, oats, and barley were a bit of a disappointment for some. While the barley crop was especially impacted by excess moisture earlier in the season, winter wheat and oats were severely affected by Fusarium head blight and crown rust, respec-tively.
After a brutally cold winter 2014 started much the same as 2013 with a cold and wet April. By the end of April only 9% of the oats, and 2% of the spring wheat and barley acreage had been seeded. This compares to a 5-year average of roughly 40% seeded for all three crops. Cool and wet conditions continued for much of May and June. Field work started in earnest in the third week of May and by May 29th, 67% of the spring wheat, 63% of the barley, and 85% of the oat acreage had been planted; a good week behind the 2013 pace and nearly 20% behind the 5-year average pace. By the third week of June nearly 60% of the State’s topsoil and over half of the subsoil were rated as having a moisture surplus; a far cry from 2012 and 2013 drought conditions. Although the excess pre-cipitation caused crop losses in individual fields , USDA’s June yield prognosis had Minnesota’s spring wheat yield predicted at 52 bushels per acre, only 1 bushel lower than in 2013 but still 2 bushels higher than 2012. Early disease problems centered around tan spot and Septoria, especially in wheat following wheat. The de-layed start in combination with the cool conditions allowed for an early epidemic to develop throughout the state and producers were encouraged to stop the tan spot and Sep-toria epidemic with the use of a fungicide at or before the 5-leaf stage (Feekes 5). Crown rust of oats was detected by the third week of June in central Minnesota and, with many of the oat varieties being moderate to very suscep-tible, ultimately caused substantial yield losses across the southern half of the state. Leaf rust of wheat and stem rust of oats were detected by the second week of July, but the diseases reached economic levels in only a few fields. Damages due to Fusarium head blight were severe in winter wheat and the earliest spring wheat, especially in southern and west central Minnesota. The later seeded spring wheat crop largely escaped damages due to FHB. Nonetheless, most spring wheat that has been delivered is being tested for the presence of deoxynivalenol or DON, underscoring the nervousness of the domestic and foreign buyers alike.
When harvest finally commenced producers were pleasantly surprised with the spring wheat grain yields. By August 24th only 22% of the spring wheat had been har-vested which compared to 60% in 2013. Weather delays
pushed harvest further back and fueled concerns about quality losses, in particular sprout damage. By September 15th only 75% of the spring wheat acreage had been har-vested with much of the crop in Kittson, Roseau, Marshall, and Pennington counties still standing. The USDA placed the state’s final average at 55 bushels per acre in their September summary, two bushels lower than the past two years. The adverse conditions for barley were reflected in the state’s average yield of 52 bushels per acre, nearly a third less than the state’s average in 2013.
The overall quality of the spring wheat crop is, with especially the vitreous kernels count and the grain protein content , below traditional levels for hard red spring wheat. Weathering as a result of the harvest delays explain the lower vitreous kernel count and slightly lower test weights. The grain protein content varies greatly between varieties and fields. This variability can generally be traced back to not just the varietal differences but also the differences in fertility management, especially with regard to N.
Spring wheat acreage remained the same at 1.2 million acres planted in 2014. Barley and oat acreage contin-ued their decline with 75,000 and 230,000 planted acres, respectively.
INTRODUCTION Successful small grain production begins with selection of the best varieties for a particular farm or field. For that reason, varieties are compared in trial plots on the Min-nesota Agricultural Experiment Station (MAES) sites at St. Paul, Rosemount, Waseca, Lamberton, Morris, and Crookston. In addition to the six MAES locations, trials are also planted with a number of farmer cooperators. The cooperator plots are handled so factors affecting yield and performance are as close to uniform for all entries at each location as possible.
The MAES 2014 Wheat, Barley, and Oat Variety Perfor-mance in Minnesota Preliminary Report 24 is presented under authority granted by the Hatch Act of 1887 to the Minnesota Agricultural Experiment Station to conduct performance trials on farm crops and interpret data to the public.
The MAES and the College of Food, Agricultural and Natural Resource Sciences (CFANS) grants permission to reproduce, print, and distribute the data in this publication - via the tables - only in their entirety, without rearrange-ment, manipulation, or reinterpretation. Permission is also granted to reproduce a maturity group sub-table provided the complete table headings and table notes are included. Use and reproduction of any material from this publication must credit the MAES and the CFANS as its source.

Page 118
VARIETY CLASSIFICATIONS Varieties are listed in the tables alphabetically. No other distinction or classification is used to group varieties. Seed of tested varieties can be eligible for certification, and use of certified seed is encouraged. However, cer-tification does not imply a recommendation. Registered and certified seed is available from seed dealers or from growers listed in the ‘Minnesota Crop Improvement As-sociation 2015 Directory’, available through the Minnesota Crop Improvement Association office in St. Paul or online at http://www.mncia.org INTERPRETATION OF THE DATA The presented data are the preliminary variety trial infor-mation for single (2014) and multiple years (2012-2014) comparisons in Minnesota. The yields are reported as a percentage of the location mean, with the overall mean (bu/A) listed below. Two-year and especially one-year data are less reliable and should be interpreted with cau-tion. In contrast, averages across multiple environments, whether they are different years and/or locations, provide a more reliable estimate of mean performance and are more predictive of what you may expect from the variety the next growing season. The least significant difference or LSD is a statistical method to determine whether the observed yield difference between any two varieties is due to true, genetic differences between the varieties or due to experimental error. If the difference in yield between two varieties equals or exceeds the LSD value, the higher yielding one was indeed superior in yield. If the difference is less, the yield difference may have been due to chance rather than genetic differences, and we are unable to dif-ferentiate the two varieties. The 5% unit indicates that, with 95% confidence, the observed difference is indeed a true difference in performance. Lowering this confidence level will allow more varieties to appear different from each other, but also increases the chances that false conclu-sions are drawn.
THE AUTHORS AND CONTRIBUTORS This report is written, compiled, and edited by Dr. Jo-chum Wiersma, Small Grains Specialist. The contributing authors/principal investigators are:
Dr. James Anderson, Wheat Breeder, Department of Agronomy & Plant Genetics, St. Paul; Dr. Kevin Smith, Barley Breeder, Department of Agronomy & Plant Ge-netics, St. Paul; Dr. Ruth Dill-Macky, Plant Pathologist, Department of Plant Pathology, St. Paul; Dr. Brian Stef-fenson, Plant Pathologist, Department of Plant Pathology, St. Paul; Dr. James Kolmer, USDA-ARS, Cereal Disease Laboratory, St. Paul; Dr. Matt Rouse, USDA-ARS, Cereal Disease Laboratory, St. Paul; Dr. Yue Jin, USDA-ARS, Cereal Disease Laboratory, St. Paul; Dr. Madeleine Smith, Extension Plant Pathologist, Northwest Research & Out-reach Center, Crookston.
Matt Bickel, Robert Bouvette, James Cameron, Roger Caspers, Doug Holen, Dave Graftstrom, Matt Green, Mark Hanson, Tom Hoverstad, George Nelson, Steve Quiring, Susan Reynolds, Edward Schiefelbein, Galen Thompson, and Donn Vellekson supervised fieldwork at the various sites.
Special thanks are also due to all cooperating producers.
SPRING WHEATJames Anderson, Jochum Wiersma, Susan Reynolds, Roger Caspers, Matt Green, Ruth Dill-Macky, James Kolmer, Matt Rouse, and Yue Jin.
Faller and Prosper combined maintained their share of nearly a third of Minnesota’s spring wheat acres in 2014. WB-Mayville moved up to the 2rd most popular variety with 18%. The next three varieties, each with between 5-7% of the acres were SY-Soren, LCS Albany, and Rol-lag. LCS Iguacu, Prevail, SY-Ingmar, and WB9507 were varieties released in 2014 and their results have been added to the tables. Three varieties from Croplan Genet-ics, a new provider of HRSW genetics in the region, were also tested for the first time this year. Testing of Edge, Sa-bin, and Select was discontinued. The results of the state yield trials are summarized in Tables 1 through 7. The av-erage yield across the six southern testing locations was 75 bu/A in 2014. This compares to an average of 65 bu/A in 2013 and a three-year average of 65 bu/A. The seven northern locations averaged 84 bu/A in 2013 compared to 89 bu/A last year and 83 bu/A for the three-year average.
Tables 4, 5, and 6 present the relative grain yield of test-ed varieties in 1, 2, and 3-year comparisons. LCS Albany, Faller, Prosper, and HRS3419 were the top yielders in the northern locations and LCS Albany topped the southern testing locations in 2014. Other varieties that yielded well statewide in 2014 were SY-Rowyn and LCS Iguacu. LCS Albany, Faller, and Prosper were the top yielders in the 3-year comparisons. Higher yielding cultivars tend to be lower in grain protein as is the case with these three va-rieties. In cooler, more-productive growing seasons, this may mean that grain protein percentage ends up below 14.0%. N fertility management is paramount to maximize grain yield and grain protein.
The varietal characteristics are presented in Tables 1, 2, and 3. Table 3 summarizes all the disease reactions for individual varieties. Varieties that are rated 4 or bet-ter are considered the best hedge against a particular diseases. Varieties that are rated 7 or higher are likely to suffer significant economic losses under even moder-ate disease pressure. Table 7 provides insight of how varieties respond to the use of fungicides. In Lamberton, Morris, Crookston, and Roseau the State Variety Trials are grown in duplicate. The duplicate trial is treated with fungicides at Feekes 5, 9, and 10.51 to eliminate, to the extent possible, any fungal pathogens that potentially can

Page 119
continued on page 120
reduce grain yield and quality. Averaged across varieties over 3 years, the use of fungicide increased grain yield by 15 bushels per acre in the northern locations and 5 bu/A in southern locations. Individual varieties may have very different responses to fungicide, depending on their level of susceptibility to and intensity of fungal diseases. Use the information in Tables 3 and 7 to gain an understanding how individual varieties should be managed to reduce the yield losses caused by fungal pathogens such as tan spot, leaf and stripe rust, and FHB.
The foliar disease rating represents the total complex of leaf diseases other than the rusts, and includes the Septoria complex and tan spot. Although varieties may differ from their response to each of those diseases, the rating does not differentiate among them. Therefore, the rating should be used as a general indication and only for varietal selection in areas where these diseases historical-ly have been a problem or if the previous crop is wheat or barley. Tan spot was again widespread in 2014 and likely caused significant yield reduction in susceptible varieties. Control of leaf diseases with fungicides may be warranted, even for those varieties with an above average rating. Leaf rust was not a problem in 2014. However, growers should consider a variety’s rating for leaf rust, and plan to use a fungicide if a variety is rated 5 or higher for either leaf or stem rust and disease levels warrant treatment.
Bacterial Leaf Streak cannot be controlled with fungi-cides. Variety selection of more resistant varieties is the only recommended practice at this time if you have a history of problems with this disease. Breaker, Forefront, Prevail, LCS Breakaway, SY Ingmar, and SY-Rowyn offer the best resistance while varieties like LCS Albany, RB07, Vantage, and WB-Mayville have a rating of 6 or 7, indi-cating that they are the most consistently affected by the disease.
Variety selection for 2015 continues to be a balance between yield potential, disease responses, and grain quality. Vigilance against FHB remains paramount as economic losses can quickly add up with varieties rated 6 or higher. Glenn, Forefront, and Rollag provide the best resistance against FHB. Forefront has good adaptation to southern locations and both Forefront and Rollag are competitive varieties for the northern locations. LCS Al-bany, Barlow, Breaker, Faller, RB07, and SY-Soren are all varieties with a rating of 4 for FHB. Combined, this group of varieties includes some of the top yielders (LCS Albany, Faller) and varieties with higher grain protein content such as Rollag, Barlow, and Glenn.
BARLEYKevin Smith, Ruth Dill-Macky, Jochum Wiersma,Brian Steffenson, and Ed Schiefelbein The results of the state yield trials are summarized in Table 8. The average yield across the four testing loca-
tions (Morris, St. Paul, Stephen, and Roseau) was 103 bu/A in 2014. This is 11 bushels higher than the trial’s average in 2013. The highest yields were recorded in Roseau and the lowest yields were recorded in Stephen (Table 8 ). Rasmusson was the highest yielding variety followed by Celebration, Innovation and Pinnacle based on the 3 year state averages. Agronomic characteristics are described in Table 9. Lacey, Rasmusson, Tradition, Pinnacle, and Stellar-ND are the most lodging resistant of the group. The two-rowed varieties Pinnacle and Rawson had the plumpest grain while Celebration was thinner than the other varieties. Grain proteins for the six-rowed variet-ies ran from 12.9% (Innovation) to 13.8% (Robust). While the two-rowed varieties Pinnacle and Rawson had 12.0% and 12.7% protein, respectively. Table 10 describes the reaction of the currently grown varieties to the six major diseases in the region. Bacterial Leaf Streak (BLS) cannot be controlled by fungicides and there are only minimal differences in resistance among the current varieties. Conlon and Celebration have the best net blotch resistance while Quest and Conlon have the best FHB resistance among the varieties presented. The two-rowed varieties are a little more susceptible to spot blotch.
OATSJochum Wiersma, Roger Caspers, Ruth Dill-Macky, Matt Green
The results of the Minnesota Field Crops Trials for oats are summarized in Tables 12 through 14. The average yield across the five trial locations (Lamberton, Morris, Crookston, Stephen, and Roseau) was a 170 bu/a. This is substantially higher than 2013 and can partially be explained by a difference in protocol. Many of the oat varieties are moderately to very susceptible to crown rust (a crown rust rating >4). Consequently crown rust infec-tions will affect the measured grain yield. As the goal of the trials is to measure yield potential rather than the susceptibility to crown rust it was decided to treat all yield trials with a fungicide when the flag leaf was fully extended (Feekes 9), the optimum time to control crown rust. Table 12 presents the relative grain yield of the tested varieties in 1 and 3 year comparisons. Deon, the lat-est University of Minnesota release, was the top yielding variety across the State in both the single and three year comparisons followed by Newburg, the 2011 release from North Dakota State University.
Agronomic characteristics and disease reactions are presented in Table 13 and 14, respectively. Relative matu-rity as measured by the number of days to heading, plant height, and resistance to lodging have been converted to a 1-9 scale to allow for easier interpretation of the data. Differences for all three characteristics are generally com-pressed in the southern half of the state or when seeding

Page 120
Entry Origin1 Days to Heading2 Height2 (inches) Straw Strength3
Advance 2012 SDSU 60.2 31.5 6Barlow 2009 NDSU 56.8 32.8 6Breaker 2008 WestBred 59.2 33.1 4Elgin-ND 2013 NDSU 58.2 35.8 6Faller 2007 NDSU 61.8 34.2 5Forefront 2012 SDSU 55.9 35.7 5Glenn 2005 NDSU 56.4 34.2 4HRS 3361 2013 CROPLAN by WinField 59.6 31.2 3HRS 3378 2013 CROPLAN by WinField 58.0 30.7 5HRS 3419 2014 CROPLAN by WinField 63.0 30.7 2
Jenna 2009 Syngenta 62.3 31.3 4Knudson 2001 Syngenta 59.9 31.6 5LCS Albany 2009 Limagrain Cereal Seeds 61.1 31.2 5LCS Breakaway 2012 Limagrain Cereal Seeds 56.9 29.8 4LCS Iguacu 2014 Limagrain Cereal Seeds 60.8 30.8 4LCS Powerplay 2012 Limagrain Cereal Seeds 58.7 30.8 5Linkert 2013 MN 58.2 30.0 2Marshall 1982 MN 63.1 32.2 4Norden 2012 MN 59.6 31.0 3Prevail 2014 SDSU 58.1 34.3 4Prosper 2011 NDSU 61.8 34.6 6RB07 2007 MN 58.2 31.7 5Rollag 2011 MN 58.6 30.3 3Samson 2007 WestBred 57.6 28.9 3SY Ingmar 2014 Syngenta 59.4 31.2 4SY-Rowyn 2013 Syngenta 56.3 29.4 5SY-Soren 2011 Syngenta 58.0 29.6 4Vantage 2007 WestBred 62.8 32.3 2
WB-Digger 2010 WestBred 58.4 32.2 5WB-Mayville 2011 WestBred 56.4 30.9 3WB9507 2013 WestBred 57.9 33.1 5Mean 59.1 31.81 Abbreviations: MN = Minnesota Agricultural Experiment Station; NDSU = North Dakota State University Research Foundation; SDSU = South Dakota Agricultural Experiment Station. 2 2014 data. 3 1-9 scale in which 1 is the strongest straw and 9 is the weakest. Based on 2008-2014 data. The rating of newer entries may change by as much as one rating point as more data are collected.
Table 1. Origin and agronomic characteristics of hard red spring wheat varieties in Minnesota in single-year (2014) and multiple year comparisons.
continued from page119
is delayed and protracted in the northern half of the State or when seeding early. Presenting averages of the actual data therefore can be misleading. The disease ratings are based on inoculated screening nurseries for crown rust and smut on the University of Min-nesota’s St. Paul campus and for Barley yellow dwarf virus or red leaf of oats on the University of Illinois’ Champaign Urbana campus. Consider most oat varieties to be moder-
ately to very susceptible to crown rust. The use of a fungi-cide at Feekes 9 is warranted if crown rust is present in the lower canopy at that time and the variety has a crown rust rating of 4 and higher. Expect some yield losses due to crown rust with the most susceptible cultivars even when a fungicide application is made at Feekes 9 if conditions for crown rust remain favorable during the grain fill period. Therefore selecting moderately susceptible cultivars like Deon, Esker is still prudent.

Page 121
EntryTest Weight
(lbs/bu)Protein 1
%Baking
Quality 2Preharvest Sprouting 3
2014 2-Yr 2014 2-YrAdvance 60.9 61.1 13.6 13.4 Low–Medium 4Barlow 60.5 60.5 14.5 14.6 Medium–High 2Breaker 60.7 61.1 14.0 14.0 Medium–High 4Elgin-ND 60.0 59.9 14.4 14.3 Medium–High 2Faller 60.2 60.3 13.3 13.4 Medium 2Forefront 60.9 60.9 14.6 14.5 Medium 4Glenn 61.8 61.8 14.8 14.7 High 1HRS 3361 59.5 – 13.9 – – –HRS 3378 60.0 – 14.0 – – –HRS 3419 59.9 – 12.9 – – –Jenna 59.7 60.0 14.2 14.2 Medium 5Knudson 59.6 59.8 13.4 13.5 Medium–High 2LCS Albany 60.4 60.5 13.0 12.9 Low–Medium 5LCS Breakaway 61.4 61.4 14.4 14.5 Medium 3LCS Iguacu 61.2 61.2 12.6 12.7 – 2LCS Powerplay 60.9 60.9 13.4 13.6 – 1Linkert 60.3 60.4 14.9 15.0 High 2Marshall 59.5 59.5 13.3 13.2 Low 2Norden 61.4 61.7 13.9 13.9 Medium 1Prevail 60.5 60.2 13.7 13.7 – 5Prosper 60.4 60.3 13.4 13.5 Medium 2RB07 60.2 60.3 14.2 14.3 Medium–High 2Rollag 61.1 61.1 14.8 14.9 Low–Medium 1Samson 58.0 58.8 14.2 14.1 Medium 5SY Ingmar 60.9 – 14.4 – – –SY Rowyn 61.1 60.8 13.7 13.7 – 4SY Soren 60.6 60.6 14.4 14.5 Medium 1Vantage 61.9 61.7 15.2 15.1 Medium 3WB-Digger 58.5 59.0 13.9 13.8 Low–Medium 5WB-Mayville 58.9 59.4 14.7 14.7 Medium–High 4WB9507 58.9 – 13.7 – – –Mean 60.3 60.5 14.1 14.1No. Environments 12 22 12 221 12% moisture basis. 2 2004-2013 crop years.3 1-9 scale in which 1 is best and 9 is worst. Values of 1-3 should be considered as resistant.
Table 2. Grain quality of hard red spring wheat varieties in Minnesota in single-year (2014) and multiple-year comparisons.

Page 122
Entry
LeafRust
StemRust2
BacterialLeaf Streak3
Other LeafDiseaes4 Scab
Advance 3 1 4 5 –Barlow 4 1 4 4 4Breaker 2 2 2 3 4Elgin-ND 2 2 4 5 5Faller 5 1 4 4 4Forefront 2 4 3 4 3Glenn 4 1 4 5 3HRS 3361 – 3 4 4 –HRS 3378 – 3 6 5 –HRS 3419 – 1 6 3 –Jenna 3 2 5 4 7Knudson 2 3 4 3 6LCS Albany 2 3 6 5 4LCS Breakaway 4 2 3 5 5LCS Iguacu 4 2 4 4 –LCS Powerplay 5 1 5 5 5Linkert 3 1 4 4 5Marshall 8 1 6 7 7Norden 2 1 4 4 5Prevail 1 3 2 6 -Prosper 5 2 4 4 5RB07 2 2 6 6 4Rollag 4 2 4 5 3Samson 5 1 5 6 8SY Ingmar – 1 3 6 –SY Rowyn 2 1 3 6 –SY Soren 3 1 4 4 4Vantage 6 3 7 6 5WB-Digger 3 1 5 5 7WB-Mayville 3 2 6 7 7WB9507 – 3 6 3 –1 1-9 scale where 1=most resistant, 9=most susceptible. 2 Stem rust levels have been very low in production fields in recent years, even on susceptible varieties.3 Bacterial leaf streak symptoms are highly variable from one environment to the next. The rating of newer entries may change by as much as one rating point as more data is collected. 4 Combined rating of tan spot and Septoria spp.
Table 3. Disease reactions1 of hard red spring wheat varieties in Minnesota in multiple-year comparisons (2012-2014).

Page 123
Ben
son
Kim
ball
LeC
ente
r1La
mbe
rton
Mor
risS
t. P
aul
Was
eca
Ent
ry20
142-
Yr3-
Yr20
142-
Yr20
142-
Yr20
142-
Yr3-
Yr20
142-
Yr3-
Yr20
142-
Yr3-
Yr20
142-
Yr3-
Yr
Adv
ance
100
102
102
9799
7796
10
611
110
810
611
010
986
107
100
8210
210
1
Bar
low
8994
9491
9677
9198
102
100
9810
110
391
100
9983
8590
Bre
aker
100
9797
9798
8395
9910
010
099
100
101
104
107
104
9495
99
Elg
in-N
D90
9493
9495
7488
102
102
102
101
101
9998
9810
075
8788
Falle
r10
710
810
610
810
012
211
010
610
510
710
710
610
311
110
610
798
9797
Fore
front
9510
010
210
510
510
910
898
9810
111
010
410
810
910
410
411
411
511
4
Gle
nn96
9393
8897
9089
9293
9410
198
9681
8787
7983
77
HR
S 3
361
99–
–10
6–
105
–98
––
98–
–10
4–
–10
9–
–
HR
S 3
378
99–
–94
–82
–10
0–
–84
––
83–
–12
0–
–
HR
S 3
419
101
––
114
–13
7–
116
––
103
––
109
––
115
––
Jenn
a96
102
103
106
103
9910
910
110
110
610
610
310
711
110
411
011
110
511
7
Knu
dson
9397
9810
310
399
102
104
101
105
9998
102
9597
102
9698
105
LCS
Alb
any
108
110
111
112
107
9811
611
811
512
111
111
111
511
911
411
913
413
213
4
LCS
Bre
ak10
010
210
298
9999
106
9396
9197
9810
284
9897
8492
93
LCS
Igua
cu10
410
8–
110
105
122
–10
210
4–
101
103
–11
811
6–
104
119
–
LCS
PP
100
100
101
104
102
117
109
105
106
101
9610
110
394
9596
104
9496
Link
ert
9293
9499
101
9610
492
9395
8890
9088
9095
101
9510
2
Mar
shal
l10
299
9997
9377
7990
8987
8888
8088
8382
7882
78
Nor
den
101
9999
9591
9097
100
9999
9194
9897
9593
113
104
109
Pre
vail
107
105
101
104
105
118
106
9510
110
011
411
111
211
411
111
012
613
411
9
Pro
sper
112
108
110
102
103
109
105
106
109
105
113
113
112
111
111
111
120
115
112
RB
0795
9799
9996
9799
104
106
102
9410
098
8891
9480
8788
Rol
lag
100
9598
9997
8696
9594
9194
9393
9788
9083
8384
Sam
son
9397
100
9297
9111
192
9698
8793
9694
9499
100
105
107
SY In
gmar
113
––
106
–13
1–
102
––
106
––
102
––
94–
–
SY R
owyn
108
105
–10
611
012
0–
103
107
–11
811
5–
103
104
–11
910
6–
SY S
oren
9999
100
101
100
9610
410
710
210
410
510
010
098
9710
194
9410
0
Vant
age
9797
9698
9984
9095
9210
094
9289
101
9394
7892
93
WB
-Dig
ger
9710
310
794
9994
104
9210
199
8798
9897
100
103
7189
101
WB
-May
ville
9910
210
390
9810
711
487
8895
8285
9099
9710
380
8997
WB
9507
104
––
110
–12
3–
107
––
106
––
114
––
122
––
Mea
n (b
u/A)
113.
099
.995
.088
.377
.853
.756
.081
.669
.756
.280
.669
.366
.467
.173
.462
.137
.644
.042
.2
LSD
(0.1
0)8.
57.
77.
24.
97.
39.
510
.77.
65.
74.
28.
08.
16.
54.
77.
35.
26.
56.
05.
51 2
014
and
2014
dat
a
Tab
le 4
. Rel
ativ
e gr
ain
yiel
d of
har
d re
d sp
ring
whe
at v
arie
ties
in s
outh
ern
Min
neso
ta lo
catio
ns in
sin
gle-
year
(201
4) a
nd m
ultip
le-y
ear c
ompa
rison
s (2
012-
2014
).

Page 124
Cro
okst
onFe
rgus
Fal
lsH
allo
ckO
klee
Perle
yR
osea
uS
teph
enS
trath
cona
1
Ent
ry20
142-
Yr3-
Yr20
142-
Yr3-
Yr20
142-
Yr3-
Yr20
142-
Yr3-
Yr20
142-
Yr20
142-
Yr3-
Yr20
142-
Yr3-
Yr20
142-
Yr
Adv
ance
101
100
101
9197
9910
410
110
296
9693
105
104
9095
959
59
79
61
01
96
Bar
low
8489
9380
8591
9997
9710
099
9894
9510
110
210
39
91
02
10
09
81
01
Bre
aker
9910
096
9596
9998
9799
9093
9496
9898
103
103
96
10
01
01
10
19
7
Elg
in-N
D99
101
103
9999
100
106
101
9996
9998
9910
097
101
102
10
31
06
10
29
49
5
Falle
r12
311
811
611
511
410
811
411
211
011
011
010
710
610
510
310
910
91
08
10
91
08
10
89
8
Fore
front
103
102
107
112
106
108
104
9696
9810
110
210
210
010
296
961
07
10
01
01
10
01
05
Gle
nn85
8790
8188
8999
9190
9796
9393
9498
9490
9697
9510
194
HR
S 3
361
99–
–10
7–
–99
––
102
––
99–
105
––
96–
–95
–
HR
S 3
378
89–
–80
––
98–
–92
––
103
–94
––
97–
–97
–
HR
S 3
419
108
––
132
––
107
––
112
––
108
–11
0–
–10
0–
–11
2–
Jenn
a99
100
103
112
112
112
9798
100
100
102
102
9810
110
210
110
610
197
102
100
106
Knu
dson
106
104
101
100
102
102
107
103
101
9810
099
100
100
9697
9810
310
010
093
95
LCS
Alb
any
116
113
111
116
121
121
108
110
112
115
112
116
101
9910
511
211
411
210
911
010
911
1
LCS
Bre
aker
8589
8977
8793
9899
9910
398
103
9899
9793
9797
9297
9899
LCS
Igu
acu
111
109
–12
011
8–
9910
1–
114
109
–10
210
710
810
9–
106
100
–10
8–
LCS
Pow
erpl
ay97
102
106
104
101
101
100
103
102
102
104
107
9497
107
108
107
9810
510
510
610
1
Link
ert
9597
9584
8792
9799
9995
9496
9596
104
9898
9694
9310
098
Mar
shal
l92
9695
8896
9298
9996
8290
9010
099
9095
9496
100
9691
88
Nor
den
9699
9996
9796
9998
9710
110
110
198
9992
9698
101
100
100
100
101
Pre
vail
9899
9911
810
910
710
110
210
110
197
9798
9810
410
110
010
095
9710
310
4
Pro
sper
116
112
107
116
113
109
112
109
109
111
112
111
107
108
107
107
110
105
113
110
107
99
RB
0710
210
110
098
9898
9610
110
098
9799
102
101
100
9898
102
9998
9899
Rol
lag
102
9710
297
9899
9998
9896
9696
9797
9491
9397
9598
9596
Sam
son
8793
9684
9410
210
210
310
410
710
510
810
210
411
310
510
310
410
110
210
610
7
SY I
ngm
ar10
4–
–10
0–
–98
––
94–
–99
–94
––
97–
–10
1–
SY R
owyn
111
106
–11
410
8–
103
102
–10
410
1–
9897
9994
–97
93–
97–
SY S
oren
102
9910
010
210
010
299
9699
9910
010
395
9910
510
010
298
9599
101
108
Vant
age
9392
9310
010
398
9395
9495
9594
9999
9398
9590
101
100
102
101
WB
-Dig
ger
9410
010
292
9710
110
610
510
610
810
811
099
103
105
100
101
9810
210
211
010
7
WB
-May
ville
8693
9381
8796
9899
9910
210
010
199
9410
697
9894
9194
9910
2
WB
9507
111
––
116
––
112
––
109
––
107
–10
3–
–11
2–
–99
–
Mea
n (b
u/A)
94.7
91.2
81.3
78.4
82.4
78.2
87.8
101.
097
.393
.586
.184
.982
.186
.887
.779
.478
.160
.479
.078
.389
.980
.1
LSD
(0.1
0)94
.76.
66.
75.
78.
38.
45.
45.
94.
75.
65.
76.
53.
76.
48.
35.
82.
76.
95.
65.
81 2
012
and
2014
dat
a
Tab
le 5
. Rel
ativ
e gr
ain
yiel
d of
har
d re
d sp
ring
whe
at v
arie
ties
in n
orth
ern
Min
neso
ta lo
catio
ns in
sin
gle-
year
(201
4) a
nd m
ultip
le-y
ear c
ompa
rison
s (2
012-
2014
).

Page 125
State North SouthEntry 2014 2-Yr 3-Yr 2014 2-Yr 3-Yr 2014 2-Yr 3-YrAdvance 97 100 100 98 99 98 96 102 103Barlow 93 96 97 95 96 97 91 96 97Breaker 97 99 99 97 98 98 97 99 100Elgin-ND 96 98 98 99 100 100 93 96 96Faller 110 109 107 111 111 108 108 106 105Forefront 104 102 103 103 100 102 104 104 106Glenn 93 93 92 94 93 92 91 92 91HRS 3361 101 - - 100 - - 102 - -HRS 3378 94 - - 94 - - 94 - -HRS 3419 111 - - 111 - - 112 - -Jenna 102 102 105 101 101 104 103 103 107Knudson 99 100 101 100 100 100 98 100 102LCS Albany 111 112 114 110 111 112 113 113 117LCS Breakaway 94 96 98 94 94 97 95 98 99LCS Iguacu 108 108 - 108 107 - 108 109 -LCS Powerplay 101 102 103 101 103 104 102 101 101Linkert 95 95 96 96 95 96 93 94 96Marshall 91 93 91 92 96 94 91 90 87Norden 98 98 98 98 98 99 97 97 98Prevail 105 104 103 103 100 100 109 110 107Prosper 110 110 109 110 110 108 110 110 109RB07 98 98 98 100 99 99 95 97 97Rollag 96 95 96 97 96 97 95 93 93Samson 97 99 102 100 101 103 92 96 101SY Ingmar 103 - - 98 - - 108 - -SY-Rowyn 106 104 - 103 100 - 110 109 -SY-Soren 101 99 101 100 99 101 101 99 102Vantage 95 96 96 96 98 97 94 94 95WB-Digger 98 101 103 102 103 104 92 99 102WB-Mayville 94 95 98 96 95 97 93 95 100WB9507 109 - - 108 - - 110 - -Mean (bu/A) 79.8 79.3 74.6 84.3 86.9 83.1 74.6 70.6 64.8LSD (0.10) 2.9 2.0 1.6 4.0 2.5 2.2 4.1 3.1 2.3No. Environments 15 28 41 8 15 22 7 13 19
Table 6. Relative grain yield of hard red spring wheat varieties in Minnesota in single-year (2014) and multiple-year comparisons (2012-2014).

Page 126
North South South
State
2014 2-Year 3-Year 2014 2-Year 3-Year 2014 2-Year 3-YearEntry Conv Int Conv Int Conv Int Conv Int Conv Int Conv Int Conv Int Conv Int Conv IntAdvance 87.0 105.3 83.1 99.4 78.1 92.4 85.9 91.8 76.7 75.2 66.3 71.5 86.4 98.5 79.9 87.3 72.2 82.0Barlow 84.4 101.4 80.9 94.5 78.2 89.3 79.5 83.0 70.7 67.5 62.2 67.2 81.9 92.2 75.8 81.0 70.2 78.2Breaker 89.8 103.7 86.6 97.4 79.0 90.3 80.3 84.8 69.2 70.3 61.8 67.0 85.0 94.2 77.9 83.9 70.4 78.7Elgin-ND 89.6 102.6 86.2 96.9 81.9 90.1 82.4 86.3 70.7 68.5 61.4 65.4 86.0 94.5 78.4 82.7 71.6 77.8Faller 103.1 117.1 97.1 106.9 89.8 99.3 86.3 90.3 73.1 71.0 64.1 68.6 94.7 103.7 85.1 88.9 77.0 84.0Forefront 93.7 106.0 84.9 94.9 81.1 89.0 84.3 84.7 70.0 68.3 64.3 65.8 89.0 95.4 77.4 81.6 72.7 77.4Glenn 83.2 99.5 77.0 90.7 72.0 83.3 78.5 85.4 66.5 66.9 58.2 64.1 80.8 92.5 71.8 78.8 65.1 73.7HRS 3361 93.2 110.0 – – – – 79.2 84.0 – – – – 86.2 97.0 – – – –HRS 3378 83.4 103.2 – – – – 74.7 81.6 – – – – 79.0 92.4 – – – –HRS 3419 99.2 118.1 – – – – 88.8 94.0 – – – – 94.0 106.1 – – – –Jenna 91.4 102.2 85.6 95.6 83.2 91.2 84.0 85.4 70.8 68.7 65.2 67.5 87.7 93.8 78.2 82.1 74.2 79.4Knudson 92.4 105.9 86.1 97.2 79.3 91.6 82.1 82.6 69.3 67.7 63.1 65.3 87.3 94.2 77.7 82.5 71.2 78.4LCS Albany 100.7 111.0 95.7 105.7 89.7 98.0 92.7 87.1 78.7 72.1 72.1 70.4 96.7 99.0 87.2 88.9 80.9 84.2LCS Breaker 83.2 104.4 77.6 93.1 74.1 88.2 76.9 87.9 67.5 69.8 59.4 66.7 80.0 96.1 72.6 81.4 66.7 77.5LCS Iguacu 99.6 111.9 92.8 102.5 – – 82.4 88.5 72.2 71.1 – – 91.0 100.2 82.5 86.8 – –LCS Powerplay 92.9 110.9 89.5 102.8 85.0 96.6 81.7 85.9 71.9 70.0 62.5 69.1 87.3 98.4 80.7 86.4 73.7 82.8Linkert 90.5 103.7 83.1 92.9 77.0 86.1 73.1 78.6 63.7 63.3 56.5 61.6 81.8 91.1 73.4 78.1 66.8 73.9Marshall 83.1 105.7 81.3 96.6 75.5 89.5 72.2 82.2 61.7 64.4 50.8 62.5 77.7 94.0 71.5 80.5 63.1 76.0Norden 85.7 103.0 83.3 96.9 78.5 90.1 77.1 84.0 67.1 66.7 60.4 64.9 81.4 93.5 75.2 81.8 69.4 77.5Prevail 92.2 103.1 85.3 94.9 79.5 89.3 84.8 82.7 73.7 67.6 65.3 65.0 88.5 92.9 79.5 81.2 72.4 77.2Prosper 101.8 115.5 93.5 104.9 86.5 99.5 88.7 90.0 77.2 72.5 66.8 70.2 95.3 102.8 85.3 88.7 76.7 84.8RB07 92.3 108.9 84.7 98.2 79.0 91.1 80.3 84.0 71.5 67.7 61.2 63.1 86.3 96.5 78.1 82.9 70.1 77.1Rollag 89.3 103.8 80.6 93.8 78.0 87.8 76.2 79.7 64.9 62.2 56.4 59.5 82.8 91.7 72.7 78.0 67.2 73.7Samson 90.6 104.0 84.1 94.4 79.3 89.4 72.5 86.1 65.6 71.4 59.6 69.0 81.6 95.0 74.9 82.9 69.4 79.2SY Ingmar 90.7 103.0 – – – – 84.5 88.7 – – – – 87.6 95.8 – – – –SY Rowyn 96.0 106.9 85.6 96.0 – – 89.7 91.9 77.1 71.7 – – 92.8 99.4 81.4 83.8 – –SY Soren 94.4 107.2 85.3 95.3 80.6 92.4 86.0 86.3 70.2 68.7 62.7 65.4 90.2 96.7 77.7 82.0 71.6 78.9Vantage 85.0 95.4 80.7 91.5 75.2 86.3 76.4 82.6 64.0 65.8 57.5 62.1 80.7 89.0 72.3 78.7 66.4 74.2WB-Digger 90.8 107.9 85.5 101.1 81.1 96.0 72.6 84.3 68.9 69.1 60.5 67.9 81.7 96.1 77.2 85.1 70.8 81.9WB-Mayville 87.2 105.1 80.4 94.6 75.9 90.9 68.4 80.6 60.0 65.4 56.4 61.5 77.8 92.8 70.2 80.0 66.1 76.2WB9507 97.6 110.4 – – – – 86.2 92.9 – – – – 91.9 101.6 – – – –Mean (bu/A) 106.3 85.2 97.3 79.9 91.2 80.9 85.7 69.7 68.6 61.4 65.9 86.2 96.0 77.5 82.9 70.7 78.5LSD (0.10) 8.2 5.3 54.4 4.4 4.2 8.1 5.7 4.4 3.7 4.0 3.0 5.7 4.9 3.6 3.2 3.0 2.6No. Environment 2 4 4 6 6 2 2 4 4 6 6 4 4 8 8 12 12
Table 7. Grain yield (bushels per acre) of hard red spring wheat varieties grown under conventional and intensive management.

Page 127
North South South
State
2014 2-Year 3-Year 2014 2-Year 3-Year 2014 2-Year 3-YearEntry Conv Int Conv Int Conv Int Conv Int Conv Int Conv Int Conv Int Conv Int Conv IntAdvance 87.0 105.3 83.1 99.4 78.1 92.4 85.9 91.8 76.7 75.2 66.3 71.5 86.4 98.5 79.9 87.3 72.2 82.0Barlow 84.4 101.4 80.9 94.5 78.2 89.3 79.5 83.0 70.7 67.5 62.2 67.2 81.9 92.2 75.8 81.0 70.2 78.2Breaker 89.8 103.7 86.6 97.4 79.0 90.3 80.3 84.8 69.2 70.3 61.8 67.0 85.0 94.2 77.9 83.9 70.4 78.7Elgin-ND 89.6 102.6 86.2 96.9 81.9 90.1 82.4 86.3 70.7 68.5 61.4 65.4 86.0 94.5 78.4 82.7 71.6 77.8Faller 103.1 117.1 97.1 106.9 89.8 99.3 86.3 90.3 73.1 71.0 64.1 68.6 94.7 103.7 85.1 88.9 77.0 84.0Forefront 93.7 106.0 84.9 94.9 81.1 89.0 84.3 84.7 70.0 68.3 64.3 65.8 89.0 95.4 77.4 81.6 72.7 77.4Glenn 83.2 99.5 77.0 90.7 72.0 83.3 78.5 85.4 66.5 66.9 58.2 64.1 80.8 92.5 71.8 78.8 65.1 73.7HRS 3361 93.2 110.0 – – – – 79.2 84.0 – – – – 86.2 97.0 – – – –HRS 3378 83.4 103.2 – – – – 74.7 81.6 – – – – 79.0 92.4 – – – –HRS 3419 99.2 118.1 – – – – 88.8 94.0 – – – – 94.0 106.1 – – – –Jenna 91.4 102.2 85.6 95.6 83.2 91.2 84.0 85.4 70.8 68.7 65.2 67.5 87.7 93.8 78.2 82.1 74.2 79.4Knudson 92.4 105.9 86.1 97.2 79.3 91.6 82.1 82.6 69.3 67.7 63.1 65.3 87.3 94.2 77.7 82.5 71.2 78.4LCS Albany 100.7 111.0 95.7 105.7 89.7 98.0 92.7 87.1 78.7 72.1 72.1 70.4 96.7 99.0 87.2 88.9 80.9 84.2LCS Breaker 83.2 104.4 77.6 93.1 74.1 88.2 76.9 87.9 67.5 69.8 59.4 66.7 80.0 96.1 72.6 81.4 66.7 77.5LCS Iguacu 99.6 111.9 92.8 102.5 – – 82.4 88.5 72.2 71.1 – – 91.0 100.2 82.5 86.8 – –LCS Powerplay 92.9 110.9 89.5 102.8 85.0 96.6 81.7 85.9 71.9 70.0 62.5 69.1 87.3 98.4 80.7 86.4 73.7 82.8Linkert 90.5 103.7 83.1 92.9 77.0 86.1 73.1 78.6 63.7 63.3 56.5 61.6 81.8 91.1 73.4 78.1 66.8 73.9Marshall 83.1 105.7 81.3 96.6 75.5 89.5 72.2 82.2 61.7 64.4 50.8 62.5 77.7 94.0 71.5 80.5 63.1 76.0Norden 85.7 103.0 83.3 96.9 78.5 90.1 77.1 84.0 67.1 66.7 60.4 64.9 81.4 93.5 75.2 81.8 69.4 77.5Prevail 92.2 103.1 85.3 94.9 79.5 89.3 84.8 82.7 73.7 67.6 65.3 65.0 88.5 92.9 79.5 81.2 72.4 77.2Prosper 101.8 115.5 93.5 104.9 86.5 99.5 88.7 90.0 77.2 72.5 66.8 70.2 95.3 102.8 85.3 88.7 76.7 84.8RB07 92.3 108.9 84.7 98.2 79.0 91.1 80.3 84.0 71.5 67.7 61.2 63.1 86.3 96.5 78.1 82.9 70.1 77.1Rollag 89.3 103.8 80.6 93.8 78.0 87.8 76.2 79.7 64.9 62.2 56.4 59.5 82.8 91.7 72.7 78.0 67.2 73.7Samson 90.6 104.0 84.1 94.4 79.3 89.4 72.5 86.1 65.6 71.4 59.6 69.0 81.6 95.0 74.9 82.9 69.4 79.2SY Ingmar 90.7 103.0 – – – – 84.5 88.7 – – – – 87.6 95.8 – – – –SY Rowyn 96.0 106.9 85.6 96.0 – – 89.7 91.9 77.1 71.7 – – 92.8 99.4 81.4 83.8 – –SY Soren 94.4 107.2 85.3 95.3 80.6 92.4 86.0 86.3 70.2 68.7 62.7 65.4 90.2 96.7 77.7 82.0 71.6 78.9Vantage 85.0 95.4 80.7 91.5 75.2 86.3 76.4 82.6 64.0 65.8 57.5 62.1 80.7 89.0 72.3 78.7 66.4 74.2WB-Digger 90.8 107.9 85.5 101.1 81.1 96.0 72.6 84.3 68.9 69.1 60.5 67.9 81.7 96.1 77.2 85.1 70.8 81.9WB-Mayville 87.2 105.1 80.4 94.6 75.9 90.9 68.4 80.6 60.0 65.4 56.4 61.5 77.8 92.8 70.2 80.0 66.1 76.2WB9507 97.6 110.4 – – – – 86.2 92.9 – – – – 91.9 101.6 – – – –Mean (bu/A) 106.3 85.2 97.3 79.9 91.2 80.9 85.7 69.7 68.6 61.4 65.9 86.2 96.0 77.5 82.9 70.7 78.5LSD (0.10) 8.2 5.3 54.4 4.4 4.2 8.1 5.7 4.4 3.7 4.0 3.0 5.7 4.9 3.6 3.2 3.0 2.6No. Environment 2 4 4 6 6 2 2 4 4 6 6 4 4 8 8 12 12
Minnesota • 2014 Variety Trials

Page 128
Crookston Morris Stephen St. Paul Roseau State MeanEntry 2-Yr 1 2014 2-Yr 2 2014 3-Yr 2014 2-Yr 2 2014 3-Yr 2014 3-YrCelebration 105 116 101 109 104 106 103 106 99 109 104Conlon 94 99 99 113 102 87 92 78 85 94 95Innovation 103 92 107 97 96 131 120 95 101 104 104Lacey 104 104 103 99 98 97 97 107 106 102 103Pinnacle 105 104 103 97 105 97 100 113 108 103 104Quest 98 106 106 91 100 111 112 107 103 104 100Rasmusson 102 113 117 111 104 106 110 97 109 107 109Rawson 101 71 81 93 99 86 94 98 101 87 94Robust 98 92 88 99 94 96 91 109 100 99 96Stellar-ND 100 97 92 99 100 89 90 91 93 94 96Tradition 91 102 99 93 98 94 91 97 94 97 95Mean (bu/A) 91 99 85 52 108 111 125 149 96 103 101LSD (0.05) 10 11 11 12 9 19 11 14 9 10 41 2012 and 2013 data.2 2013 and 2014 data.
Table 8. Relative grain yield of barley varieties at several locations in Minnesota single-year (2014) and multiple year comparisons (2012-2014).
Entry 2014 1 2-Yr 2 3-YrCelebration 104 104 105Conlon 89 91 92Innovation 101 104 103Lacey 105 106 104Pinnacle 101 100 103Quest 101 103 97Rasmusson 111 110 110Rawson 92 91 96Robust 93 93 94Stellar-ND 101 102 98Tradition 103 101 99Mean (bu/A) 113 110 109LSD (0.05) 9 9 71 Fergus Falls and Hallock sites were not harvested.2 Perley and Strathcona sites were not harvested.
Table 9: Relative grain yield of barley varieties in on-farm trials at Fergus Falls, Hallock, Oklee, Perley, Kimball and Strathcona, Minnesota.
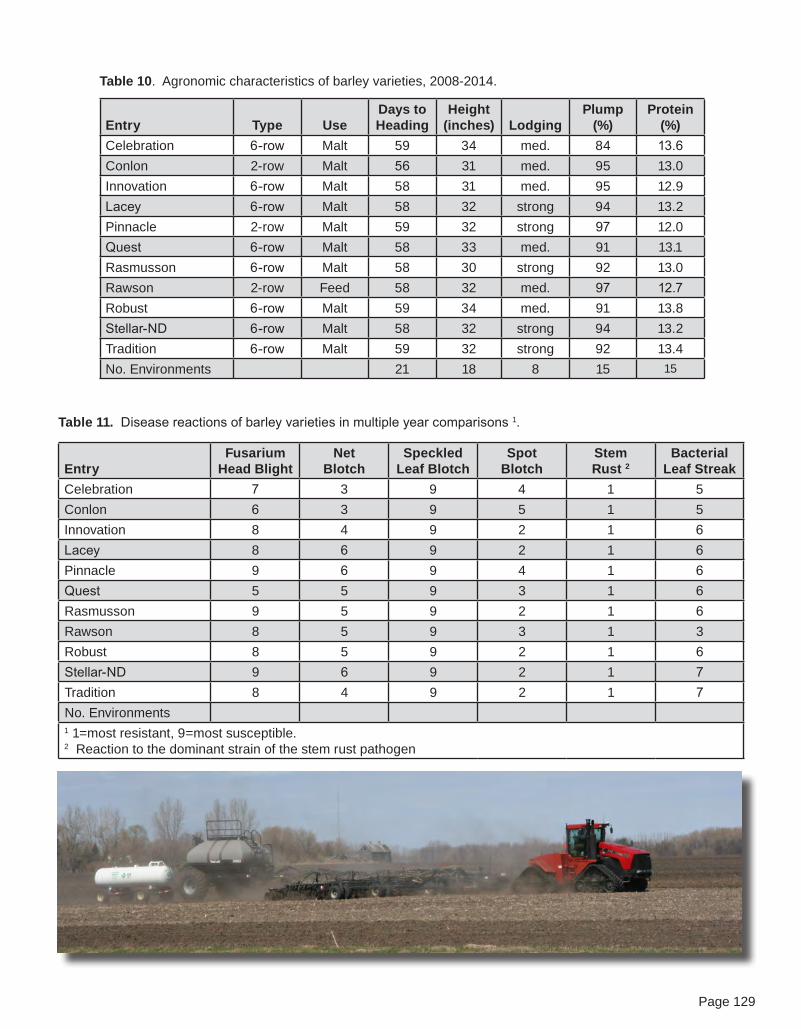
Page 129
Entry Type UseDays to Heading
Height (inches) Lodging
Plump(%)
Protein(%)
Celebration 6-row Malt 59 34 med. 84 13.6Conlon 2-row Malt 56 31 med. 95 13.0Innovation 6-row Malt 58 31 med. 95 12.9Lacey 6-row Malt 58 32 strong 94 13.2Pinnacle 2-row Malt 59 32 strong 97 12.0Quest 6-row Malt 58 33 med. 91 13.1Rasmusson 6-row Malt 58 30 strong 92 13.0Rawson 2-row Feed 58 32 med. 97 12.7Robust 6-row Malt 59 34 med. 91 13.8Stellar-ND 6-row Malt 58 32 strong 94 13.2Tradition 6-row Malt 59 32 strong 92 13.4No. Environments 21 18 8 15 15
EntryFusarium
Head BlightNet
BlotchSpeckled
Leaf BlotchSpot
BlotchStemRust 2
BacterialLeaf Streak
Celebration 7 3 9 4 1 5Conlon 6 3 9 5 1 5Innovation 8 4 9 2 1 6Lacey 8 6 9 2 1 6Pinnacle 9 6 9 4 1 6Quest 5 5 9 3 1 6Rasmusson 9 5 9 2 1 6Rawson 8 5 9 3 1 3Robust 8 5 9 2 1 6Stellar-ND 9 6 9 2 1 7Tradition 8 4 9 2 1 7No. Environments1 1=most resistant, 9=most susceptible.2 Reaction to the dominant strain of the stem rust pathogen
Table 11. Disease reactions of barley varieties in multiple year comparisons 1.
Table 10. Agronomic characteristics of barley varieties, 2008-2014.
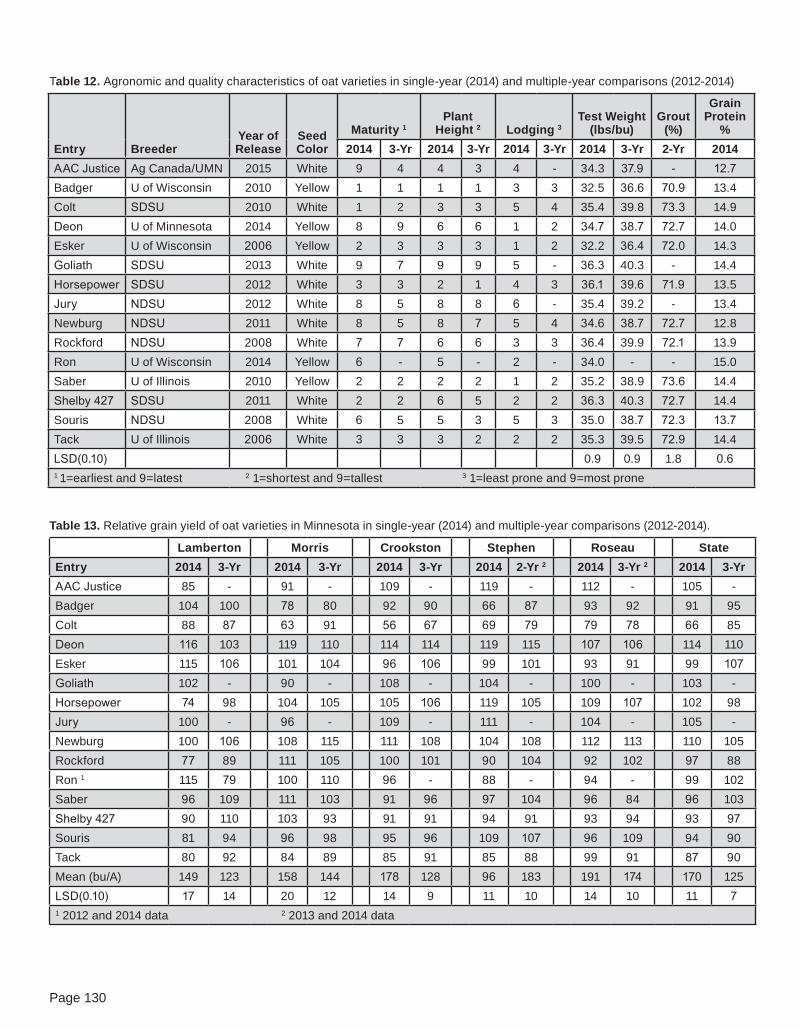
Page 130
Entry BreederYear of Release
Seed Color
Maturity 1Plant
Height 2 Lodging 3Test Weight
(lbs/bu)Grout
(%)
Grain Protein
%2014 3-Yr 2014 3-Yr 2014 3-Yr 2014 3-Yr 2-Yr 2014
AAC Justice Ag Canada/UMN 2015 White 9 4 4 3 4 - 34.3 37.9 - 12.7Badger U of Wisconsin 2010 Yellow 1 1 1 1 3 3 32.5 36.6 70.9 13.4Colt SDSU 2010 White 1 2 3 3 5 4 35.4 39.8 73.3 14.9Deon U of Minnesota 2014 Yellow 8 9 6 6 1 2 34.7 38.7 72.7 14.0Esker U of Wisconsin 2006 Yellow 2 3 3 3 1 2 32.2 36.4 72.0 14.3Goliath SDSU 2013 White 9 7 9 9 5 - 36.3 40.3 - 14.4Horsepower SDSU 2012 White 3 3 2 1 4 3 36.1 39.6 71.9 13.5Jury NDSU 2012 White 8 5 8 8 6 - 35.4 39.2 - 13.4Newburg NDSU 2011 White 8 5 8 7 5 4 34.6 38.7 72.7 12.8Rockford NDSU 2008 White 7 7 6 6 3 3 36.4 39.9 72.1 13.9Ron U of Wisconsin 2014 Yellow 6 - 5 - 2 - 34.0 - - 15.0Saber U of Illinois 2010 Yellow 2 2 2 2 1 2 35.2 38.9 73.6 14.4Shelby 427 SDSU 2011 White 2 2 6 5 2 2 36.3 40.3 72.7 14.4Souris NDSU 2008 White 6 5 5 3 5 3 35.0 38.7 72.3 13.7Tack U of Illinois 2006 White 3 3 3 2 2 2 35.3 39.5 72.9 14.4LSD(0.10) 0.9 0.9 1.8 0.61 1=earliest and 9=latest 2 1=shortest and 9=tallest 3 1=least prone and 9=most prone
Table 12. Agronomic and quality characteristics of oat varieties in single-year (2014) and multiple-year comparisons (2012-2014)
Lamberton Morris Crookston Stephen Roseau StateEntry 2014 3-Yr 2014 3-Yr 2014 3-Yr 2014 2-Yr 2 2014 3-Yr 2 2014 3-YrAAC Justice 85 - 91 - 109 - 119 - 112 - 105 -Badger 104 100 78 80 92 90 66 87 93 92 91 95Colt 88 87 63 91 56 67 69 79 79 78 66 85Deon 116 103 119 110 114 114 119 115 107 106 114 110Esker 115 106 101 104 96 106 99 101 93 91 99 107Goliath 102 - 90 - 108 - 104 - 100 - 103 -Horsepower 74 98 104 105 105 106 119 105 109 107 102 98Jury 100 - 96 - 109 - 111 - 104 - 105 -Newburg 100 106 108 115 111 108 104 108 112 113 110 105Rockford 77 89 111 105 100 101 90 104 92 102 97 88Ron 1 115 79 100 110 96 - 88 - 94 - 99 102Saber 96 109 111 103 91 96 97 104 96 84 96 103Shelby 427 90 110 103 93 91 91 94 91 93 94 93 97Souris 81 94 96 98 95 96 109 107 96 109 94 90Tack 80 92 84 89 85 91 85 88 99 91 87 90Mean (bu/A) 149 123 158 144 178 128 96 183 191 174 170 125LSD(0.10) 17 14 20 12 14 9 11 10 14 10 11 71 2012 and 2014 data 2 2013 and 2014 data
Table 13. Relative grain yield of oat varieties in Minnesota in single-year (2014) and multiple-year comparisons (2012-2014).
Page 131
2014 North Dakota Hard Red Spring Wheat Variety Trial Results for 2014 and Selection Guide - Preliminary Report By Joel Ransom, Mohamed Mergoum, Senay Simsek, Maricelis Acevedo, Tim Friesen, Zhaohui Liu and Shao-bin Zhong (NDSU Main Station); John Rickertsen (Het-tinger Research Extension Center); Eric Eriksmoen (North Central Research Extension Center, Minot); Bryan Hanson (Langdon Research Extension Center); Glenn Martin (Dickinson Research Extension Center); Gautam Pradhan (Williston Research Extension Center); Blaine Schatz and Mike Ostlie (Carrington Research Extension Center).
Hard red spring (HRS) wheat was harvested from 6.19 million acres in 2014, up from 5.06 million acres in 2013. The average yield of spring wheat was 47.5 bushels/acre (bu/a), up slightly from the yield of 46 bu/a recorded last year.
Barlow was again the most popular HRS wheat variety in 2014, occupying 15.7 percent of the planted acre-age, followed by Prosper (11.7), SY Soren (10.4), Faller (8.8), Glenn (8.2), and WB Mayville (4.4). SY Soren was released by Syngenta/AgriPro and WB Mayville was released by Monsanto/WestBred. All other varieties are NDSU releases.
Much of the spring wheat was planted later than is considered optimal due to a late and wet spring. However, temperatures were moderate during much of the growing season which helped the development of relatively high yield potential even in the late plantings. There were some reports of scab damage, and DON levels varied consider-ably depending on planting and flowering date and variety grown.
Successful wheat production depends on numerous factors, including selecting the right variety for a particular area. The information included in this publication is meant to aid in selecting that variety or group of varieties. Char-acteristics to consider in selecting a variety may include yield potential, protein content when grown with proper fer-tility, straw strength, plant height, reaction to problematic pests (diseases, insects, etc.) and maturity. Every grow-ing season differs; therefore, when selecting a variety, we recommend using data that summarize several years and locations. Choose the variety that, on average, performs the best at multiple locations near your farm during several years. Selecting varieties with good milling and baking quality also is important to maintain market recognition and avoid discounts. Hard red spring wheat from the northern Great Plains is known around the world for its ex-cellent end-use quality. Millers and bakers consider many factors in determining the quality and value of wheat they purchase. Several key parameters are: high test weight
(for optimum milling yield and flour color), high falling num-ber (greater than 300 seconds indicates minimal sprout damage), high protein content (the majority of HRS wheat export markets want at least 14 percent protein) and ex-cellent protein quality (for superior bread-making quality as indicated by traditional strong gluten proteins, high baking absorption and large bread loaf volume).Gluten strength, and milling and baking quality ratings, are provided for individual varieties based on the results from the NDSU field plot variety trials. These ratings are ap-plied to varieties grown for multiple years at seven NDSU Research Extension Centers across the state to provide producers and end users with end-use performance data. The wheat protein data often are higher than obtained in actual production fields but can be used to compare differ-ences among varieties. The agronomic data presented in this publication are from replicated research plots using experimental designs that enable the use of statistical analysis. These analyses enable the reader to determine, at a predeter-mined level of confidence, if the differences observed among varieties are reliable or if they might be due to error inherent in the experimental process. The LSD (Least Significant Difference) values beneath the columns in the tables are derived from these statistical analyses and apply only to the numbers in the column in which they ap-pear. If the difference between two varieties exceeds the LSD value, it means that with 90 percent confidence (LSD probability 0.10), the higher-yielding variety has a signifi-cant yield advantage. When the difference between two varieties is less than the LSD value, no significant differ-ence was found between those two varieties under those growing conditions.
NS is used to indicate no significant difference for that trait among any of the varieties at the 90 percent level of confidence. The CV stands for coefficient of variation and is expressed as a percentage. The CV is a measure of variability in the trial. Large CVs mean a large amount of variation that could not be attributed to differences in the varieties. Yield is reported at 13.5% moisture while protein content is reported at 12% moisture content. Presentation of data for the entries tested does not imply approval or endorsement by the authors or agencies conducting the test. North Dakota State Univer-sity approves the reproduction of any table in the publication only if no portion is deleted, appropriate footnotes are given and the order of the data is not rearranged. Additional data from county sites are available from each Research Extension Center at www.ag.ndsu.edu/varietytrials/spring-wheat.
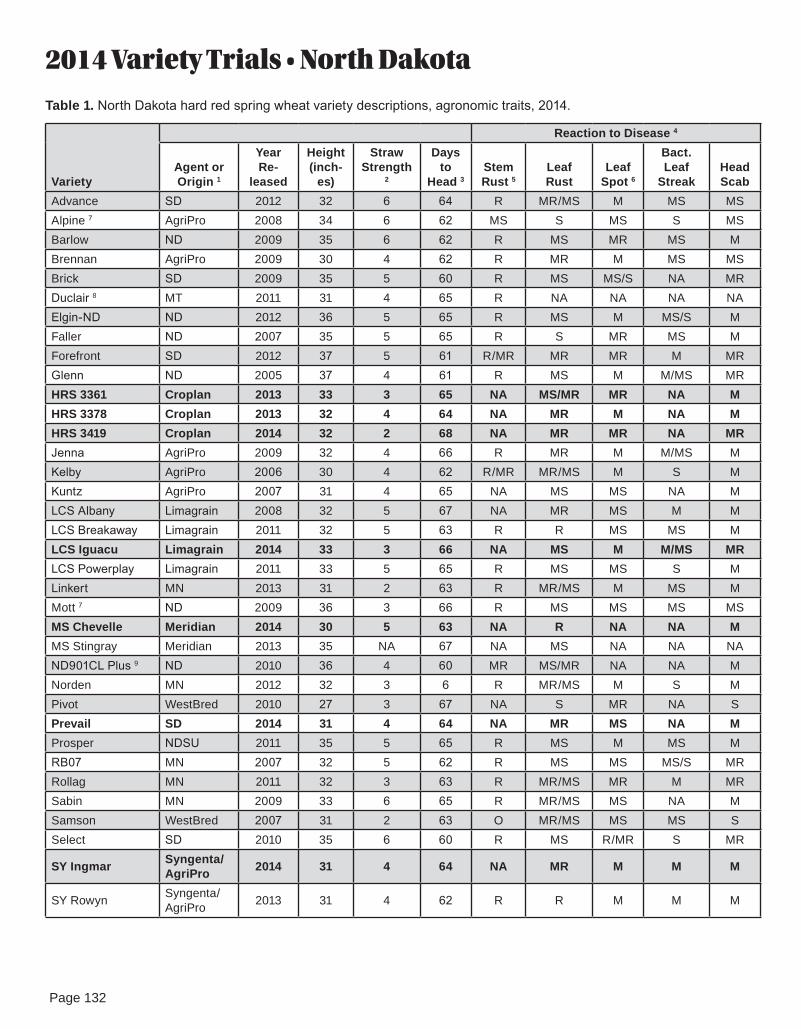
Page 132
2014 Variety Trials • North Dakota
Variety
Reaction to Disease 4
Agent orOrigin 1
YearRe-
leased
Height(inch-
es)
StrawStrength
2
Days to
Head 3StemRust 5
LeafRust
LeafSpot 6
Bact. Leaf
StreakHeadScab
Advance SD 2012 32 6 64 R MR/MS M MS MSAlpine 7 AgriPro 2008 34 6 62 MS S MS S MSBarlow ND 2009 35 6 62 R MS MR MS MBrennan AgriPro 2009 30 4 62 R MR M MS MSBrick SD 2009 35 5 60 R MS MS/S NA MRDuclair 8 MT 2011 31 4 65 R NA NA NA NAElgin-ND ND 2012 36 5 65 R MS M MS/S MFaller ND 2007 35 5 65 R S MR MS MForefront SD 2012 37 5 61 R/MR MR MR M MRGlenn ND 2005 37 4 61 R MS M M/MS MRHRS 3361 Croplan 2013 33 3 65 NA MS/MR MR NA MHRS 3378 Croplan 2013 32 4 64 NA MR M NA MHRS 3419 Croplan 2014 32 2 68 NA MR MR NA MRJenna AgriPro 2009 32 4 66 R MR M M/MS MKelby AgriPro 2006 30 4 62 R/MR MR/MS M S MKuntz AgriPro 2007 31 4 65 NA MS MS NA MLCS Albany Limagrain 2008 32 5 67 NA MR MS M MLCS Breakaway Limagrain 2011 32 5 63 R R MS MS MLCS Iguacu Limagrain 2014 33 3 66 NA MS M M/MS MRLCS Powerplay Limagrain 2011 33 5 65 R MS MS S MLinkert MN 2013 31 2 63 R MR/MS M MS MMott 7 ND 2009 36 3 66 R MS MS MS MSMS Chevelle Meridian 2014 30 5 63 NA R NA NA MMS Stingray Meridian 2013 35 NA 67 NA MS NA NA NAND901CL Plus 9 ND 2010 36 4 60 MR MS/MR NA NA MNorden MN 2012 32 3 6 R MR/MS M S MPivot WestBred 2010 27 3 67 NA S MR NA SPrevail SD 2014 31 4 64 NA MR MS NA MProsper NDSU 2011 35 5 65 R MS M MS MRB07 MN 2007 32 5 62 R MS MS MS/S MRRollag MN 2011 32 3 63 R MR/MS MR M MRSabin MN 2009 33 6 65 R MR/MS MS NA MSamson WestBred 2007 31 2 63 O MR/MS MS MS SSelect SD 2010 35 6 60 R MS R/MR S MR
SY Ingmar Syngenta/AgriPro 2014 31 4 64 NA MR M M M
SY Rowyn Syngenta/AgriPro 2013 31 4 62 R R M M M
Table 1. North Dakota hard red spring wheat variety descriptions, agronomic traits, 2014.

Page 133
2014 Variety Trials • North Dakota
SY Soren Syngenta/AgriPro 2011 30 4 63 R R M S M
SY Tyra 8 Syngenta/AgriPro 2011 31 5 62 R R MS S S
Vantage WestBred 2007 32 2 67 MR R MS MS/S MSVelva NDSU 2011 35 4 63 R R M S MSWB9507 WestBred 2013 32 5 61 NA MR R NA MRWB9879CLP 9 WestBred 2012 33 4 64 NA MS MR NA MSWB Digger WestBred 2009 34 6 63 MR R M NA MSWB Gunnison WestBred 2013 31 NA 65 NA MS MS M MSWB Mayville WestBred 2011 30 4 63 R R MS S S1 Refers to agent or developer: MN = University of Minnesota; MT = Montana State University; ND = North Dakota State University; SD = South Dakota State University; Bold varieties are those recently released, so data is limited and rating values may change. NA indicates insufficient information is available to make an accurate assessment.2 Straw Strength = 1 to 9 scale, with 1 the strongest and 9 the weakest. These values are based on recent data and may change as more data become available.3 Days to Head = the number of days from planting to head emergence from the boot averaged from several locations in 2010 and 2011.4 R = resistant; MR = moderately resistant; M = intermediate; MS = moderately susceptible; NA = Not adequately tested; S = susceptible. 5 Fargo stem rust nursery inoculated with Puccinia graminis f. sp. Tritici races TPMK, TMLK, RTQQ, QFCQ and QTHJ.6 Leaf spot refers to the leaf fungal diseases such as tan spot and septoria. It does not include bacterial leaf streak.7 Hard white wheat.8 Solid stemmed or semisolid stem, imparting resistance to sawfly.9 CL = refers to a Clearfield variety, with tolerance to the Beyond™ family of herbicides.
Table 1 continued...
Variety
2014 N.D.
Planted OBS 1Test
WeightProtein12% MB
Vitre-ous
kernelsFalling
NumberFarinograph
Stability
Farino-graph
AbsorptionLoaf
Volume
Mill and Bake
Quality Rating
(% area) (lb/bu) (%) (%)(sec-onds) (minutes) (%) (cc)
(1-5 Stars) 2
Advance -- 13 62.9 13.4 63 424 10.2 59.5 922 **Barlow 15.7 13 62.5 14.9 80 403 11.2 66.0 981 ***Brennan 3.2 13 62.4 14.6 64 442 7.8 63.5 908 *Elgin-ND 2.7 13 61.4 14.5 84 423 9.0 64.4 967 **Faller 8.8 13 61.0 13.7 69 433 11.6 63.0 954 **Forefront -- 13 62.3 14.2 60 429 10.7 61.1 966 ***Glenn 3 8.2 13 63.9 15.1 89 407 13.8 65.2 983 *****Jenna 1.1 13 61.3 14.0 55 440 8.7 62.9 928 **LCS Break-away
-- 7 63.8 14.8 84 447 6.5 64.2 913 *
Linkert -- 13 62.1 15.3 74 452 18.1 63.2 976 ****Norden -- 13 63.3 13.9 86 413 8.8 63.2 923 **Prevail -- 10 61.5 13.8 62 398 9.1 60.7 915 **Prosper 11.7 13 61.3 13.9 69 419 10.9 63.2 944 **Rollag 1.5 13 62.6 14.8 70 522 7.2 65.9 877 *Select 1.1 13 62.9 14.2 71 443 7.4 62.7 915 *SY Soren 10.4 13 62.3 14.6 60 447 10.0 62.4 948 **Vantage 1.9 13 63.1 15.7 87 358 11.4 64.0 943 ***Velva 1.3 13 61.2 14.1 75 412 10.0 63.2 921 **Analyses conducted at the NDSU Hard Red Spring Wheat Quality Laboratory in Fargo, N.D. For footnotes, see bottom of Table 3
Table 2. Analytical milling and baking data from field plot variety trials at Carrington, Casselton, Dickinson, Hettinger, Langdon, Minot and Williston, 2012 and 2013 (unless otherwise noted).

Page 134
Variety
2014 N.D.
PlantedOBS
1Test
Weight
Protein12 % MB
VitreousKernels
FallingNumber
FarinographStability
FarinographAbsorption
LoafVolume
Mill and Bake
Quality Rating
(% area) (lb/bu) (%) (%) (seconds) (minutes) (%) (cc) (1-5) 2
Advance -- 7 63.7 13.1 63 425 9.5 60.2 908 **Barlow 15.7 7 63.4 14.7 83 389 9.1 66.6 955 ***Brennan 3.2 7 62.9 14.6 67 432 7.8 64.3 896 *Duclair -- 4 61.8 13.8 72 401 9.6 61.2 916 **Elgin-ND 2.7 7 62.5 14.4 91 420 8.3 65.3 961 **Faller 8.8 7 62.1 13.7 73 424 10.3 64.1 951 ***Forefront -- 7 62.9 14.2 62 425 10.3 62.1 956 ***Glenn 3 8.2 7 64.6 15.0 93 388 11.7 65.7 981 *****Jenna 1.1 7 62.0 13.7 53 436 8.5 63.4 914 **Kelby 1.9 5 62.5 15.0 64 415 7.9 63.6 921 **Linkert -- 7 63.0 14.8 73 449 17.1 63.8 959 ****Mott 2.9 6 62.9 14.4 78 386 9.3 62.5 903 ***Norden -- 7 64.2 13.6 83 421 8.7 64.3 901 **LCS Albany -- 5 62.7 13.0 62 433 7.5 59.1 875 *
LCS Breakaway -- 6 64.1 14.7 82 450 6.3 64.2 909 *LCS Powerplay -- 6 63.6 13.8 73 418 7.0 65.6 915 *Prevail -- 7 61.8 13.8 62 387 8.0 61.5 915 **Prosper 11.7 7 62.8 13.6 76 415 9.8 64.3 936 **RB07 2.6 5 62.8 14.3 75 411 10.5 62.5 971 ***Rollag 1.5 7 63.5 14.7 75 521 6.7 67.1 863 *Select 1.1 7 63.4 13.9 75 428 7.3 63.2 903 *Steele-ND 1.7 6 63.6 14.5 72 408 8.3 64.9 958 ***SY Rowyn -- 7 62.7 13.6 63 443 21.9 61.0 929 ****SY Soren 10.4 7 63.1 14.4 66 425 9.4 63.2 941 ***Vantage 1.9 7 63.7 15.1 82 342 11.1 64.3 937 ***Velva 1.3 7 62.2 14.2 74 416 9.4 64.1 916 **WB Mayville 4.4 5 62.5 14.7 66 474 10.9 65.7 942 ***Analyses conducted at the NDSU Hard Red Spring Wheat Quality Laboratory in Fargo, N.D.1 Observations 2 Mill and Bake Quality Rating scale 1 to 5, with 1 being low and 5 being superior.3 Glenn is the current Wheat Quality Council check variety for comparing new experimental lines and newly released varieties.
Table 3. Analytical milling and baking data from field plot variety trials at Dickinson, Hettinger, Langdon, Minot and Williston, 2013 (unless otherwise noted).
2014 Variety Trials • North Dakota

Page 135
2014 Variety Trials • North Dakota Carrington Casselton Prosper Langdon Avg. Eastern N.D.
Variety 2014 3 Yr. 2014 3 Yr. 2014 2 Yr. 2014 3-Yr. 2014 2/3 Yr.-------------------------------------------------(bu/a)-----------------------------------------------------------
Advance 88.9 60.2 90.3 78.7 83.8 69.4 84.9 87.5 87.0 74.0
Alpine 85.8 61.9 79.0 76.1 75.1 66.1 91.5 89.9 82.9 73.5
Alsen 85.4 61.7 74.6 69.2 72.0 60.3 -- -- -- --
Barlow 87.4 64.9 78.2 68.5 77.3 62.5 85.5 83.7 82.1 69.9
Breaker 85.8 61.3 89.4 75.5 82.4 67.9 83.1 85.6 85.2 72.6
Brennan 83.3 62.9 82.3 73.2 77.3 63.8 80.0 75.0 80.7 68.7
Duclair 75.5 -- 83.9 -- 75.0 -- -- -- -- --
Elgin-ND 93.2 66.8 88.5 76.1 78.8 67.4 90.1 88.6 87.7 74.7
Faller 110.9 72.4 101.2 82.5 92.0 73.3 95.5 97.5 99.9 81.4
Forefront 92.9 67.9 91.5 78.2 83.2 71.4 74.3 80.2 85.5 74.4
Glenn 87.6 61.3 76.5 66.5 77.2 67.7 75.8 78.3 79.3 68.5
Howard 94.2 67.1 86.8 75.8 79.9 65.3 -- -- -- --
HRS 3361 100.0 -- -- -- -- -- 84.6 -- -- --
HRS 3378 85.6 -- -- -- -- -- 87.1 -- -- --
HRS 3419 110.2 -- -- -- -- -- 88.9 -- -- --
Jenna 100.0 69.1 87.8 80.0 77.6 67.2 87.0 85.4 88.1 75.4
Kelby 83.6 60.5 72.9 66.4 75.7 66.3 -- -- -- --
LCS Albany 106.5 67.5 93.7 -- 77.9 -- 95.2 93.0 93.3 --
LCS Breakaway 89.3 61.2 82.3 -- 83.2 -- 77.1 80.3 83.0 --
LCS Iguacu 94.5 -- 94.6 -- 85.2 -- 90.6 -- 91.2 --
LCS Powerplay 96.6 66.5 87.8 -- 79.4 -- 88.1 88.1 88.0 --
Linkert 92.3 65.5 83.8 -- 77.5 -- 81.7 77.7 83.8 --
Mott 97.2 66.0 89.5 74.3 80.1 63.0 -- -- -- --
MS Chevelle 102.6 -- 81.0 -- 81.7 -- 91.2 -- 89.1 --
MS Stingray 105.4 -- 102.1 -- 78.0 -- 93.4 -- 94.7 --
ND901CL Plus 83.3 60.7 78.9 67.3 76.3 63.8 -- -- -- --
Norden 96.3 64.0 83.7 74.6 78.5 64.0 80.5 80.9 84.8 70.9
Prevail 93.4 67.7 -- -- -- -- 84.8 82.5 -- --
Prosper 105.2 69.4 89.9 76.1 90.1 74.5 92.9 95.4 94.5 78.9
RB07 92.2 63.7 90.6 75.9 79.2 67.6 88.3 86.1 87.6 73.3
Rollag 97.5 67.9 83.8 72.0 80.8 66.4 85.1 79.4 86.8 71.4
Samson 72.6 57.4 81.1 76.9 82.7 67.0 86.3 83.1 80.7 71.1
Select 94.8 66.6 80.9 72.3 83.0 61.7 77.3 79.8 84.0 70.1
Steele-ND 89.8 64.3 83.0 73.8 76.4 64.6 -- -- -- --
SY605 CL 82.9 59.2 82.6 72.5 85.5 70.4 -- -- -- --
SY Ingmar 90.9 -- 89.6 -- 76.1 -- 86.8 -- 85.9 --
SY Rowyn 93.1 64.5 93.1 -- 87.0 -- 87.0 86.8 90.1 --
SY Soren 89.9 63.5 83.1 74.6 74.3 65.2 85.1 80.8 83.1 71.0
SY Tyra 85.0 58.8 78.6 70.3 63.3 54.0 -- -- -- --
Vantage 92.3 61.9 82.2 70.7 70.0 54.4 81.4 78.0 81.5 66.3
Velva 90.2 59.1 86.3 75.3 70.5 58.8 92.6 87.9 84.9 70.3
WB Digger 94.8 66.6 95.2 80.7 80.1 67.6 90.3 89.5 90.1 76.1
WB Mayville 77.9 57.7 76.6 68.6 80.8 64.4 81.4 79.2 79.2 67.5
WB9507 104.8 -- -- -- -- -- 86.8 -- -- --
Mean 91.3 63.9 84.9 73.8 78.2 65.0 85.7 84.2 86.5 72.4
CV% 5.6 -- 4.9 -- 8.1 -- 5.6 -- -- --
LSD 0.10 6.0 -- 4.9 -- 7.4 -- 5.5 -- -- --
Table 4. Yield of hard red spring wheat varieties grown at four locations in eastern North Dakota, 2012-2014.

Page 136
Dickinson Hettinger Minot Williston Avg. Western N.D. Variety 2014 3 Yr. 2014 3 Yr. 2014 3 Yr. 2014 3 Yr. 2014 3 Yr.
------------------------------------------------------------------(bu/a)--------------------------------------------------------------------Advance 88.1 67.4 89.0 80.6 67.1 60.5 38.0 33.0 70.6 60.4
Alpine 92.6 68.0 -- -- 55.7 47.8 46.1 -- -- --
Barlow 91.1 69.3 80.1 73.3 62.2 55.8 36.3 35.0 67.4 58.4
Breaker 88.4 67.6 84.5 76.6 -- -- 39.0 35.7 -- --
Brennan 84.9 66.2 80.4 76.7 54.1 49.2 41.3 37.5 65.2 57.4
Duclair 88.5 -- -- -- 66.6 54.2 40.3 36.6 -- --
Elgin-ND 88.9 69.0 88.5 77.4 62.3 52.9 41.7 37.6 70.4 59.2
Faller 95.1 73.2 94.1 72.4 76.4 62.4 41.5 34.7 76.8 60.7
Forefront 80.0 64.3 85.2 75.3 55.8 49.2 45.0 40.2 66.5 57.3
Glenn 86.0 67.9 77.1 69.6 57.5 50.8 33.7 35.3 63.6 55.9
Howard 91.2 69.3 80.3 74.4 72.0 59.1 40.5 33.1 71.0 59.0
HRS 3361 83.9 -- 88.2 -- 56.6 -- 38.0 -- 66.7 --
HRS 3378 92.7 -- 89.6 -- 58.7 -- 36.5 -- 69.4 --
HRS 3419 69.8 -- 97.9 -- 67.7 -- 41.9 -- 69.3 --
Jenna 93.3 73.2 86.5 75.4 67.5 52.2 42.5 38..9 72.5 66.9
Kelby 81.3 61.4 -- -- 54.9 47.9 37.8 36.4 -- --
LCS Albany 91.2 68.7 95.4 -- 77.1 62.3 44.0 35.7 76.9 --
LCS Breakaway 88.9 66.6 86.4 -- 63.1 55.8 37.1 36.3 68.9 --
LCS Iguacu 78.2 -- 88.2 -- 60.0 -- 39.6 -- 66.5 --
LCS Powerplay 92.2 72.5 82.9 -- 65.0 58.6 40.9 40.1 70.3 --
Linkert 87.2 64.8 80.5 74.0 61.1 -- 41.6 37.7 67.6 58.8
Mott 87.0 66.9 78.9 72.4 60.6 54.9 38.9 33.4 66.4 56.9
MS Chevelle -- -- 91.3 -- 65.0 -- -- -- -- --
MS Stingray 87.4 -- 95.9 -- 75.1 -- -- -- -- --
ND901CL Plus 79.5 63.9 73.5 66.1 59.9 51.9 37.0 33.0 62.5 53.7
Norden 87.4 67.4 83.5 75.3 54.3 55.2 39.7 36.0 66.2 58.5
Prevail 85.3 63.1 87.2 79.2 74.1 57.9 43.3 -- 72.5 --
Prosper 88.7 67.8 86.3 75.3 74.7 61.7 41.6 35.4 72.8 60.1
RB07 61.1 58.7 84.1 75.4 61.1 53.0 42.6 38.1 62.2 56.3
Rollag 86.5 65.6 84.2 76.2 63.2 56.1 40.2 -- 68.5 --
Samson 87.6 70.3 90.1 79.9 65.0 53.7 41.5 37.4 71.1 60.3
Select 82.4 63.4 82.6 73.9 53.4 57.3 36.1 35.9 63.6 57.6
Steele-ND 79.9 63.9 80.9 73.5 69.3 58.0 41.3 33.9 67.9 57.3
SY605 CL 89.8 67.8 83.1 78.4 60.4 51.3 37.9 33.6 67.8 57.8
SY Ingmar 88.3 -- 82.1 -- 68.1 -- 44.2 -- 70.7 --
SY Rowyn 87.0 65.4 85.0 79.4 74.6 -- 37.3 -- 71.0 72.4
SY Soren 86.9 66.5 86.2 80.2 62.3 50.6 37.2 35.6 68.2 58.2
SY Tyra 90.8 68.7 85.7 78.1 56.7 53.7 41.2 36.2 68.6 59.2
Vantage 83.1 61.8 75.4 67.7 56.3 50.9 38.3 33.4 63.3 53.5
Velva 96.0 72.7 85.7 77.6 66.2 57.1 46.2 39.7 73.5 61.8
WB Digger 96.0 72.7 92.5 83.9 68.8 56.6 42.9 36.4 75.1 62.4
WB Gunnison 86.4 64.7 73.4 65.2 60.2 47.8 40.4 32.4 65.1 52.5
WB Mayville 93.2 67.9 79.7 73.0 66.6 52.9 40.4 34.8 70.0 57.2
WB9507 89.0 -- 92.8 -- 73.4 -- 45.0 -- 75.1 --
WB9879CLP 90.8 -- 83.4 -- 56.9 -- 38.0 -- 67.3 --
Mean 86.9 67.1 85.2 75.2 63.8 54.5 40.3 35.8 69.1 58.2
CV % 5.4 -- 5.2 -- 11.3 -- 8.0 -- -- --
LSD 0.10 5.5 -- 5.2 -- 8.3 -- 3.8 -- -- --
Table 5. Yield of hard red spring wheat varieties grown at four locations in western North Dakota, 2012-2014.

Page 137
Variety Carrington Casselton Prosper Dickinson Hettinger Langdon Minot Williston State Avg.Advance 14.0 13.2 14.5 11.7 12.7 12.6 12.4 14.8 13.2
Alpine 14.9 13.5 14.2 12.6 -- 12.9 12.8 13.9 13.5
Alsen 15.0 14.4 15.0 -- -- -- -- -- 14.8
Barlow 14.6 13.5 14.8 12.5 13.8 13.9 14.4 15.5 14.1
Breaker 14.4 13.3 14.6 11.8 13.2 13.0 13.5 14.8 13.6
Brennan 14.4 14.3 14.3 12.5 12.5 13.8 14.7 15.5 14.0
Duclair 14.3 13.5 14.9 12.1 -- -- 14.0 14.5 13.9
Elgin-ND 14.8 13.6 14.3 12.7 13.4 13.7 13.9 15.4 14.0
Faller 14.3 12.2 13.8 11.9 11.9 12.3 12.7 14.5 13.0
Forefront 14.7 14.1 14.4 12.7 13.2 13.8 13.5 14.4 13.9
Glenn 15.3 14.0 14.5 11.7 14.5 14.4 14.6 15.3 14.3
Howard 14.6 13.3 14.6 12.7 12.9 -- 14.4 14.7 13.9
HRS 3361 14.3 -- -- 11.7 11.7 13.5 13.8 15.4 13.4
HRS 3378 13.5 -- -- 11.6 12.1 12.4 13.1 14.3 12.8
HRS 3419 13.5 -- -- 11.6 11.8 12.3 11.5 14.2 12.5
Jenna 14.6 13.5 14.7 12.2 13.0 12.7 14.3 14.3 13.7
Kelby 14.4 14.4 14.9 13.8 -- -- 13.7 15.3 14.4
LCS Albany 13.6 12.3 13.5 11.4 12.2 11.7 12.1 14.4 12.7
LCS Breakaway 15.0 13.9 14.8 12.3 13.5 13.7 14.5 15.2 14.1
LCS Iguacu 12.5 12.3 13.3 10.6 11.1 11.6 12.0 14.1 12.2
LCS Powerplay 14.2 12.8 13.9 12.4 12.4 13.4 13.9 14.8 13.5
Linkert 14.8 14.7 15.2 13.7 14.2 13.6 14.3 15.8 14.5
Mott 15.1 13.5 14.8 12.5 12.9 -- 13.6 15.3 14.0
MS Chevelle 13.2 13.1 13.7 -- 10.7 12.5 12.7 -- 12.7
MS Stingray 12.2 11.3 12.7 11.0 10.5 10.7 10.9 -- 11.3
ND901CL Plus 16.6 14.8 15.5 13.0 14.9 - 14.6 16.9 15.2
Norden 13.9 13.2 14.3 12.1 12.5 13.2 13.4 14.5 13.4
Prevail 14.1 13.0 14.4 12.9 12.2 13.3 13.8 14.5 13.5
Prosper 14.2 12.1 13.8 11.5 11.7 12.4 13.1 15.3 13.0
RB07 14.8 13.5 14.5 13.1 13.3 13.8 13.4 15.0 13.9
Rollag 15.2 13.9 15.2 13.2 13.7 14.1 14.0 15.4 14.3
Samson 13.6 13.4 14.2 11.9 11.8 12.5 13.0 14.5 13.1
Select 14.7 13.2 14.0 12.3 12.7 13.7 13.3 14.7 13.6
Steele-ND 14.6 13.5 14.2 12.7 13.6 -- 14.2 14.8 13.9
SY605 CL 15.8 13.7 14.9 13.2 14.1 -- 13.3 15.6 14.4
SY Ingmar 14.8 13.9 15.2 12.7 13.2 13.7 14.1 15.1 14.1
SY Rowyn 13.9 13.1 13.7 12.7 12.0 12.9 12.9 14.0 13.2
SY Soren 14.7 13.9 14.9 12.4 13.4 13.4 13.6 15.5 14.0
SY Tyra 13.7 12.5 14.1 11.9 11.8 -- 13.2 14.3 13..1
Vantage 16.6 15.1 15.5 13.1 14.9 14.4 14.4 16.1 15.0
Velva 14.8 12.9 15.1 12.3 13.0 12.5 13.8 14.9 13.7
WB Digger 15.1 13.3 14.2 10.9 12.7 12.8 13.5 14.5 13.4
WB Mayville 14.8 14.1 14.3 12.0 13.2 13.6 14.1 14.3 13.8
WB9507 14.8 -- -- 11.8 12.2 13.1 13.2 15.4 13.4
WB9879CLP -- -- -- 12.8 12.3 -- 12.4 15.1 13.2
Mean 14.5 13.4 14.4 12.3 12.8 13.1 13.5 14.9 13.6
CV % 1.6 3.6 4.1 6.4 3.7 4.2 6.8 4.0 --
LSD 0.10 0.3 0.6 0.7 1.1 0.5 0.7 1.1 0.7 --
Table 6. Protein at 12 percent moisture of hard red spring wheat varieties grown at eight locations in North Dakota, 2014.
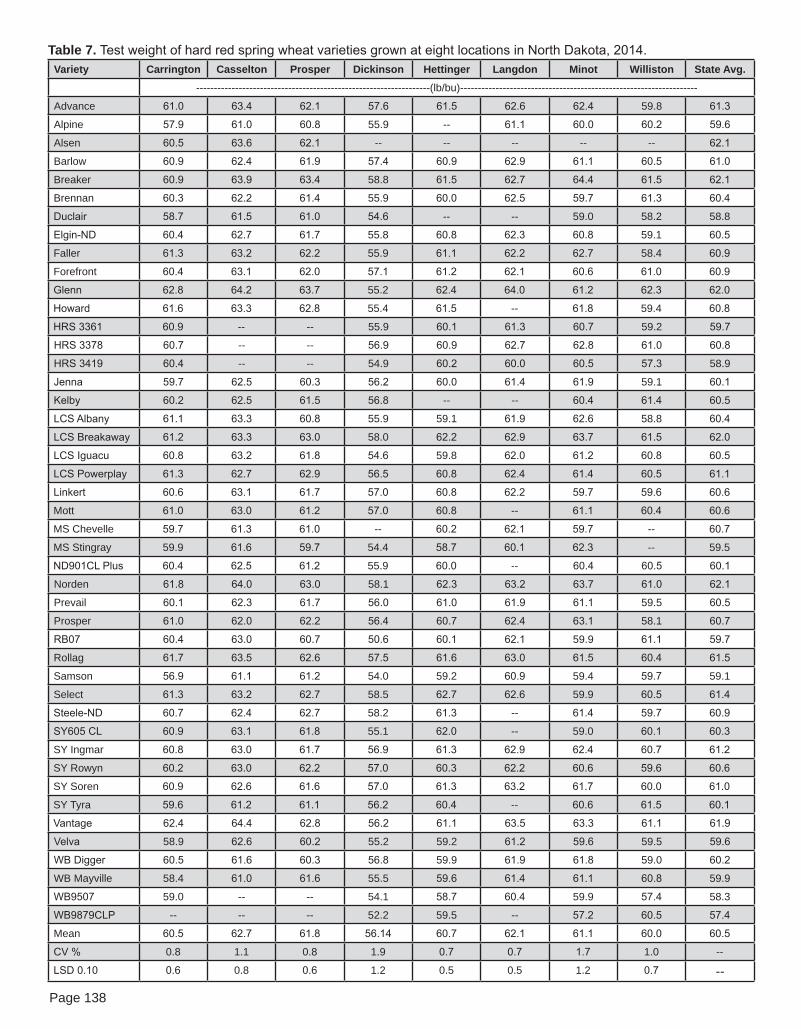
Page 138
Variety Carrington Casselton Prosper Dickinson Hettinger Langdon Minot Williston State Avg.------------------------------------------------------------------(lb/bu)-------------------------------------------------------------------
Advance 61.0 63.4 62.1 57.6 61.5 62.6 62.4 59.8 61.3
Alpine 57.9 61.0 60.8 55.9 -- 61.1 60.0 60.2 59.6
Alsen 60.5 63.6 62.1 -- -- -- -- -- 62.1
Barlow 60.9 62.4 61.9 57.4 60.9 62.9 61.1 60.5 61.0
Breaker 60.9 63.9 63.4 58.8 61.5 62.7 64.4 61.5 62.1
Brennan 60.3 62.2 61.4 55.9 60.0 62.5 59.7 61.3 60.4
Duclair 58.7 61.5 61.0 54.6 -- -- 59.0 58.2 58.8
Elgin-ND 60.4 62.7 61.7 55.8 60.8 62.3 60.8 59.1 60.5
Faller 61.3 63.2 62.2 55.9 61.1 62.2 62.7 58.4 60.9
Forefront 60.4 63.1 62.0 57.1 61.2 62.1 60.6 61.0 60.9
Glenn 62.8 64.2 63.7 55.2 62.4 64.0 61.2 62.3 62.0
Howard 61.6 63.3 62.8 55.4 61.5 -- 61.8 59.4 60.8
HRS 3361 60.9 -- -- 55.9 60.1 61.3 60.7 59.2 59.7
HRS 3378 60.7 -- -- 56.9 60.9 62.7 62.8 61.0 60.8
HRS 3419 60.4 -- -- 54.9 60.2 60.0 60.5 57.3 58.9
Jenna 59.7 62.5 60.3 56.2 60.0 61.4 61.9 59.1 60.1
Kelby 60.2 62.5 61.5 56.8 -- -- 60.4 61.4 60.5
LCS Albany 61.1 63.3 60.8 55.9 59.1 61.9 62.6 58.8 60.4
LCS Breakaway 61.2 63.3 63.0 58.0 62.2 62.9 63.7 61.5 62.0
LCS Iguacu 60.8 63.2 61.8 54.6 59.8 62.0 61.2 60.8 60.5
LCS Powerplay 61.3 62.7 62.9 56.5 60.8 62.4 61.4 60.5 61.1
Linkert 60.6 63.1 61.7 57.0 60.8 62.2 59.7 59.6 60.6
Mott 61.0 63.0 61.2 57.0 60.8 -- 61.1 60.4 60.6
MS Chevelle 59.7 61.3 61.0 -- 60.2 62.1 59.7 -- 60.7
MS Stingray 59.9 61.6 59.7 54.4 58.7 60.1 62.3 -- 59.5
ND901CL Plus 60.4 62.5 61.2 55.9 60.0 -- 60.4 60.5 60.1
Norden 61.8 64.0 63.0 58.1 62.3 63.2 63.7 61.0 62.1
Prevail 60.1 62.3 61.7 56.0 61.0 61.9 61.1 59.5 60.5
Prosper 61.0 62.0 62.2 56.4 60.7 62.4 63.1 58.1 60.7
RB07 60.4 63.0 60.7 50.6 60.1 62.1 59.9 61.1 59.7
Rollag 61.7 63.5 62.6 57.5 61.6 63.0 61.5 60.4 61.5
Samson 56.9 61.1 61.2 54.0 59.2 60.9 59.4 59.7 59.1
Select 61.3 63.2 62.7 58.5 62.7 62.6 59.9 60.5 61.4
Steele-ND 60.7 62.4 62.7 58.2 61.3 -- 61.4 59.7 60.9
SY605 CL 60.9 63.1 61.8 55.1 62.0 -- 59.0 60.1 60.3
SY Ingmar 60.8 63.0 61.7 56.9 61.3 62.9 62.4 60.7 61.2
SY Rowyn 60.2 63.0 62.2 57.0 60.3 62.2 60.6 59.6 60.6
SY Soren 60.9 62.6 61.6 57.0 61.3 63.2 61.7 60.0 61.0
SY Tyra 59.6 61.2 61.1 56.2 60.4 -- 60.6 61.5 60.1
Vantage 62.4 64.4 62.8 56.2 61.1 63.5 63.3 61.1 61.9
Velva 58.9 62.6 60.2 55.2 59.2 61.2 59.6 59.5 59.6
WB Digger 60.5 61.6 60.3 56.8 59.9 61.9 61.8 59.0 60.2
WB Mayville 58.4 61.0 61.6 55.5 59.6 61.4 61.1 60.8 59.9
WB9507 59.0 -- -- 54.1 58.7 60.4 59.9 57.4 58.3
WB9879CLP -- -- -- 52.2 59.5 -- 57.2 60.5 57.4
Mean 60.5 62.7 61.8 56.14 60.7 62.1 61.1 60.0 60.5
CV % 0.8 1.1 0.8 1.9 0.7 0.7 1.7 1.0 --
LSD 0.10 0.6 0.8 0.6 1.2 0.5 0.5 1.2 0.7 --
Table 7. Test weight of hard red spring wheat varieties grown at eight locations in North Dakota, 2014.

Page 139
NOTES_______________________________________________________________________________________________
_______________________________________________________________________________________________
_______________________________________________________________________________________________
_______________________________________________________________________________________________
_______________________________________________________________________________________________
_______________________________________________________________________________________________
_______________________________________________________________________________________________
_______________________________________________________________________________________________
_______________________________________________________________________________________________
_______________________________________________________________________________________________
_______________________________________________________________________________________________
_______________________________________________________________________________________________
_______________________________________________________________________________________________
_______________________________________________________________________________________________
_______________________________________________________________________________________________
_______________________________________________________________________________________________
_______________________________________________________________________________________________
_______________________________________________________________________________________________
_______________________________________________________________________________________________
_______________________________________________________________________________________________
_______________________________________________________________________________________________
_______________________________________________________________________________________________
_______________________________________________________________________________________________
_______________________________________________________________________________________________
_______________________________________________________________________________________________
_______________________________________________________________________________________________
_______________________________________________________________________________________________
_______________________________________________________________________________________________

Page 140
Minnesota Wheat Research & Promotion Council2600 Wheat Drive • Red Lake Falls, MN 56750
Ph: 218-253-4311 or 800-242-6118 www.smallgrains.org
University of Minnesota Extension240 Coffey Hall • 1420 Eckles Ave.
St. Paul, MN 55108-6068Ph: 612-624-1222
www.extension.umn.edu
151 Saint Andrews Ct # 710 Mankato, MN 56001
(507) 388-1635www.mnsoybean.com
738 1st Ave. E Shakopee, MN 55379
(952)-233-0333 www.mncorn.org
The report of research projects are advised by the Small Grains Research & Communications Committee and funded in part by the Minnesota Wheat Checkoff. Sponsors that help fund this book are the
Minnesota Wheat Research & Promotion Council, the University of Minnesota, Minnesota Soybean Research and Promotion Council and the Minnesota Corn Research and Promotion Council.