Pengaruh Globalisasi Dan Modernisasi Terhadap Perubahan Sosi
Upload
annis-hortonCategory
view
216download
2
2013 WATER QUALITY 2013 WATER QUALITY (B&C) (B&C)
Dan Nichols Dan Nichols [email protected]@ns.whiting.k12.in.us
Adapted from Adapted from 2012-13 SOSI2012-13 SOSI

EVENT COMPONENTS EVENT COMPONENTS
• Ecology Content – 2013Ecology Content – 2013– Part 1 – Freshwater and Estuary Ecology Part 1 – Freshwater and Estuary Ecology – Part 2 – Identify Macro-flora and fauna Part 2 – Identify Macro-flora and fauna – Part 3 – Water Monitoring and AnalysisPart 3 – Water Monitoring and Analysis
• Process skillsProcess skills in data, graph and diagram analysis

EVENT PARAMETERS (Div B)EVENT PARAMETERS (Div B)
• Division B – Division B – Each team may bring one 3-ring Each team may bring one 3-ring binder, any size, containing information in any binder, any size, containing information in any form from any source. The materials must be 3-form from any source. The materials must be 3-hole punched and inserted into the rings, (Sheet hole punched and inserted into the rings, (Sheet protectors are allowed). Each team is also protectors are allowed). Each team is also allowed to bring one student built allowed to bring one student built salinometer/hydrometer for testing and up to 2 salinometer/hydrometer for testing and up to 2 non-programmable, non-graphing calculators. non-programmable, non-graphing calculators. Each participant must bring Z87 chemical splash Each participant must bring Z87 chemical splash gogglesgoggles

EVENT PARAMETERS (Div C)EVENT PARAMETERS (Div C)• Division C – Division C – Each team may bring only one 8.5” x Each team may bring only one 8.5” x
11” two-sided page of notes that contains 11” two-sided page of notes that contains information in any form from any source, one information in any form from any source, one student built salinometer/hydrometer for testing student built salinometer/hydrometer for testing and up to 2 non-programmable, non-graphing and up to 2 non-programmable, non-graphing calculators. Each participant must bring Z87 calculators. Each participant must bring Z87 chemical splash goggles. chemical splash goggles.

Part 1: Freshwater and Estuary EcologyAreas such as:
– Freshwater EcologyFreshwater Ecology– Aquatic Food Chains and WebsAquatic Food Chains and Webs– Population DynamicsPopulation Dynamics– Community Interactions Community Interactions – Nutrient Recycling Nutrient Recycling – Water CycleWater Cycle– Aquatic Chemistry and its implications for life Aquatic Chemistry and its implications for life – Potable Water TreatmentPotable Water Treatment– Waste Water TreatmentWaste Water Treatment– Watershed Resource Management IssuesWatershed Resource Management Issues– Sedimentation Pollution Sedimentation Pollution – Exotic/invasive/harmful speciesExotic/invasive/harmful species

General Principles of Freshwater and Estuary Ecology
ECOLOGYECOLOGY – how organisms interact with one another and with their environment
ENVIRONMENTENVIRONMENT – living and non-living components • ABIOTICABIOTIC – non-living component or physical factors – non-living component or physical factors
as soil, rainfall, sunlight, temperaturesas soil, rainfall, sunlight, temperatures• BIOTICBIOTIC – living component are other organisms – living component are other organisms.

ECOLOGICAL ORGANIZATION
• INDIVIDUALINDIVIDUAL – individual organisms• POPULATIONPOPULATION – organisms of same species in
same area (biotic factors)• COMMUNITYCOMMUNITY – several populations in same
area (biotic factors) • ECOSYSTEMECOSYSTEM – community plus abiotic factors • BIOSPHEREBIOSPHERE – all ecosystems on earth

Aquatic Ecosystems
Lotic ecosystems – flowing waterStreams Rivers
Lentic ecosystems – still waterPondsLakesWetlands
Estuary ecosystems

Watershed
A watershed or drainage basin is an area of land where water from rain and melting snow or ice drains downhill into a body of water, such as a river, lake, reservoir, estuary, wetland, sea or ocean.

ECOLOGY OF INDIVIDUALS
• Homeostasis Homeostasis – delicate balance– delicate balance • Components Components – Physiological Ecology Physiological Ecology – Temperature and Water BalanceTemperature and Water Balance– Light and Biological CyclesLight and Biological Cycles– Physiological Ecology and ConservationPhysiological Ecology and Conservation

ECOLOGY OF POPULATIONS
• Properties of populationsProperties of populations• Patterns of distribution and densityPatterns of distribution and density• Intraspecific competitionIntraspecific competition• Population dynamicsPopulation dynamics• Growth and regulationGrowth and regulation• Altering population growthAltering population growth• Human impactHuman impact
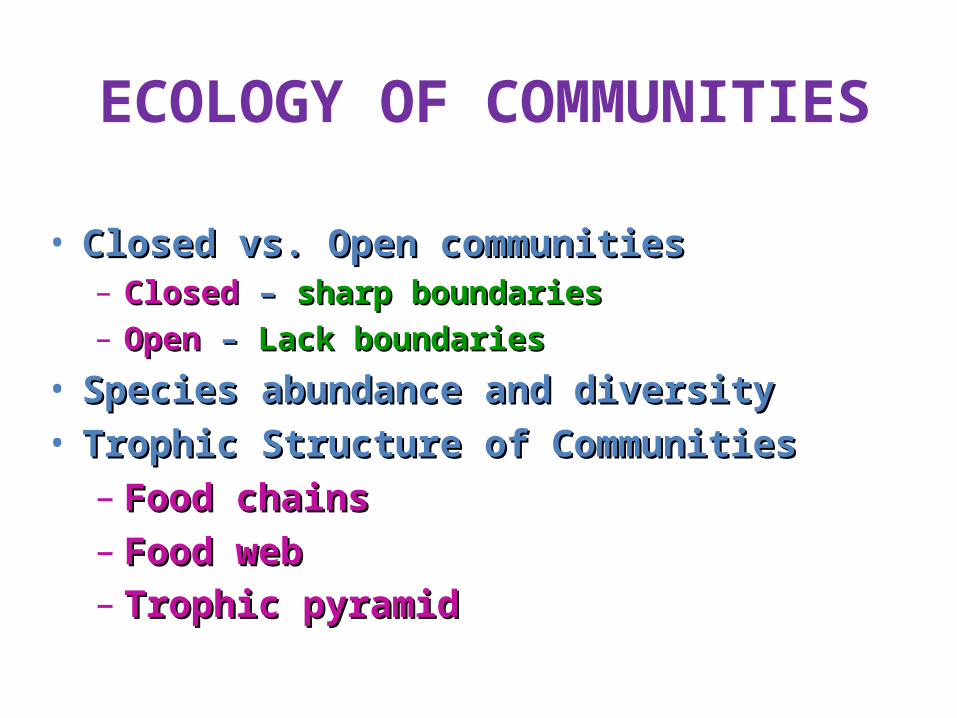
ECOLOGY OF COMMUNITIES
• Closed vs. Open communitiesClosed vs. Open communities– ClosedClosed – – sharp boundariessharp boundaries– OpenOpen – – Lack boundariesLack boundaries
• Species abundance and diversitySpecies abundance and diversity• Trophic Structure of CommunitiesTrophic Structure of Communities– Food chainsFood chains– Food webFood web– Trophic pyramidTrophic pyramid

Food Chain
algae mayflies stoneflies trout humans
• Producer• 1st order Consumer or Herbivore• 2nd order Consumer or 1st order Carnivore• 3rd order Consumer or 2nd order Carnivore• 4th order Consumer or 3rd order Carnivore• Decomposers – consume dead and decaying matter as
bacteria

Food Web

INTERACTIONS AMONG SPECIES
• InteractionsInteractions• Interspecific competitionInterspecific competition• PredationPredation• ExploitationExploitation• SymbiosisSymbiosis

Types of Species Interactions
• NeutralNeutral – two species do not interact – two species do not interact • Mutualism Mutualism – both benefit – both benefit • CommensalismCommensalism – one benefits, other neutral – one benefits, other neutral • ParasitismParasitism – one benefits, one harmed – one benefits, one harmed
but not killed but not killed • PredationPredation – one benefits, other killed – one benefits, other killed
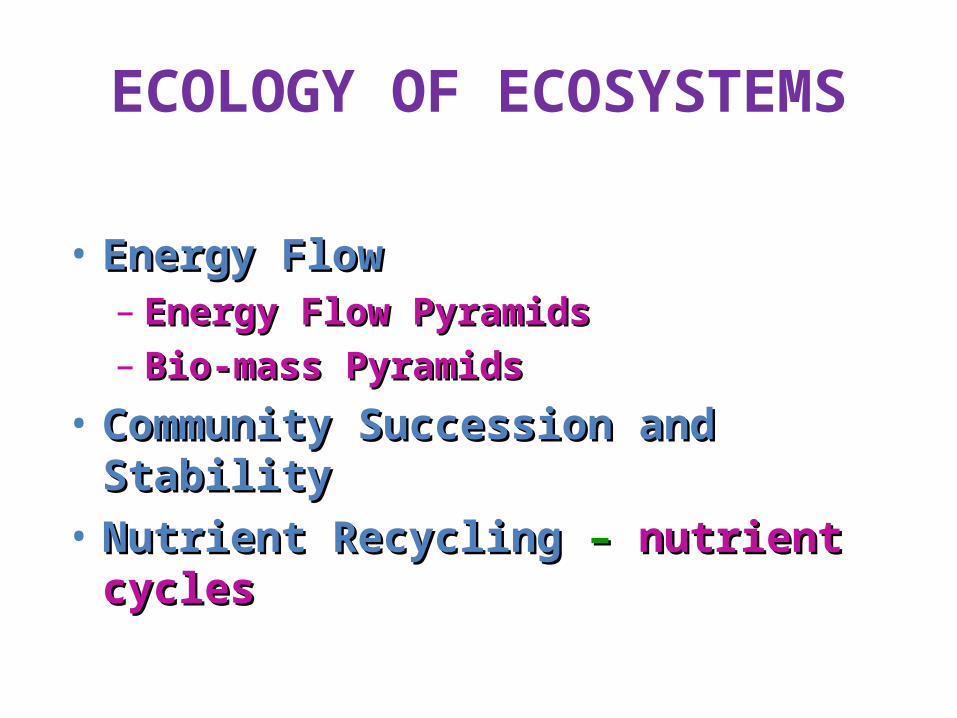
ECOLOGY OF ECOSYSTEMS
• Energy Flow Energy Flow – Energy Flow PyramidsEnergy Flow Pyramids– Bio-mass PyramidsBio-mass Pyramids
• Community Succession and StabilityCommunity Succession and Stability• Nutrient Recycling Nutrient Recycling – – nutrient cycles nutrient cycles

Energy vs Nutrient
• Nutrients – cyclic(Biogeochemical Cycles)
• Energy flow – one way

Ecologic Pyramids
Ecological pyramid - a graph representing trophic level numbers within an ecosystem. The primary producer level is at the base of the pyramid with the consumer levels above. Numbers pyramid - compares the number of individuals in each trophic level. May be inverteddue to size of individualsBiomass pyramid - compares the total dry weight of the organisms in each trophic level. Energy pyramid - compares the total amount of energy available in each trophic level. This energy is usually measured in kilocalories.

Ecological Pyramids

Biogeochemical Cycles recycles nutrients
• Hydrologic CycleHydrologic Cycle • Phosphorus CyclePhosphorus Cycle
• Nitrogen CycleNitrogen Cycle
• Carbon CycleCarbon Cycle

Nitrogen Cycle

Phosphorus Cycle

Carbon Cycle

Hydrologic (Water) Cycle

Potable Water Treatment

Sewage Treatment
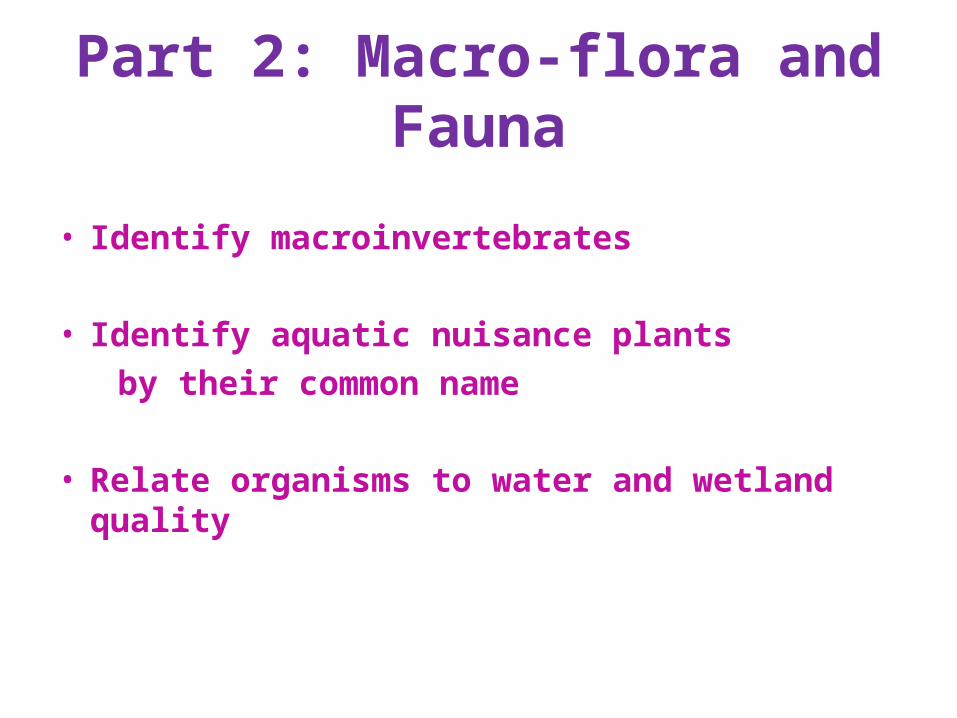
Part 2: Macro-flora and Fauna
• Identify macroinvertebrates
• Identify aquatic nuisance plants by their common name
• Relate organisms to water and wetland quality
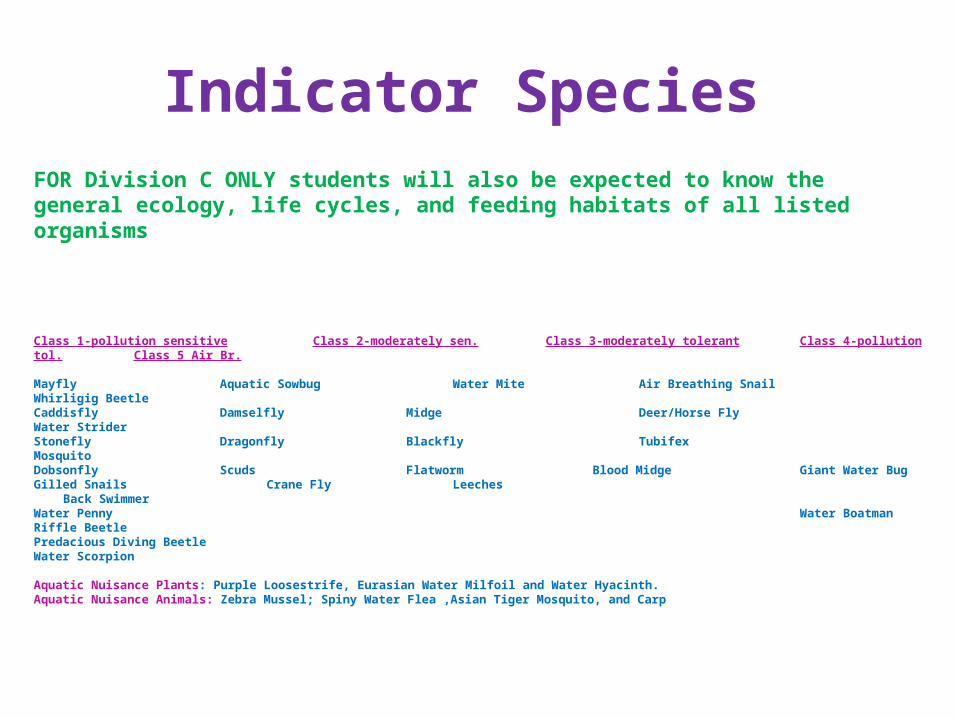
Indicator Species
FOR Division C ONLY students will also be expected to know the general ecology, life cycles, and feeding habitats of all listed organisms
Class 1-pollution sensitive Class 2-moderately sen. Class 3-moderately tolerant Class 4-pollution tol. Class 5 Air Br.
Mayfly Aquatic Sowbug Water Mite Air Breathing Snail Whirligig BeetleCaddisfly Damselfly Midge Deer/Horse Fly Water StriderStonefly Dragonfly Blackfly Tubifex Mosquito Dobsonfly Scuds Flatworm Blood Midge Giant Water BugGilled Snails Crane Fly Leeches Back SwimmerWater Penny Water BoatmanRiffle Beetle Predacious Diving BeetleWater Scorpion
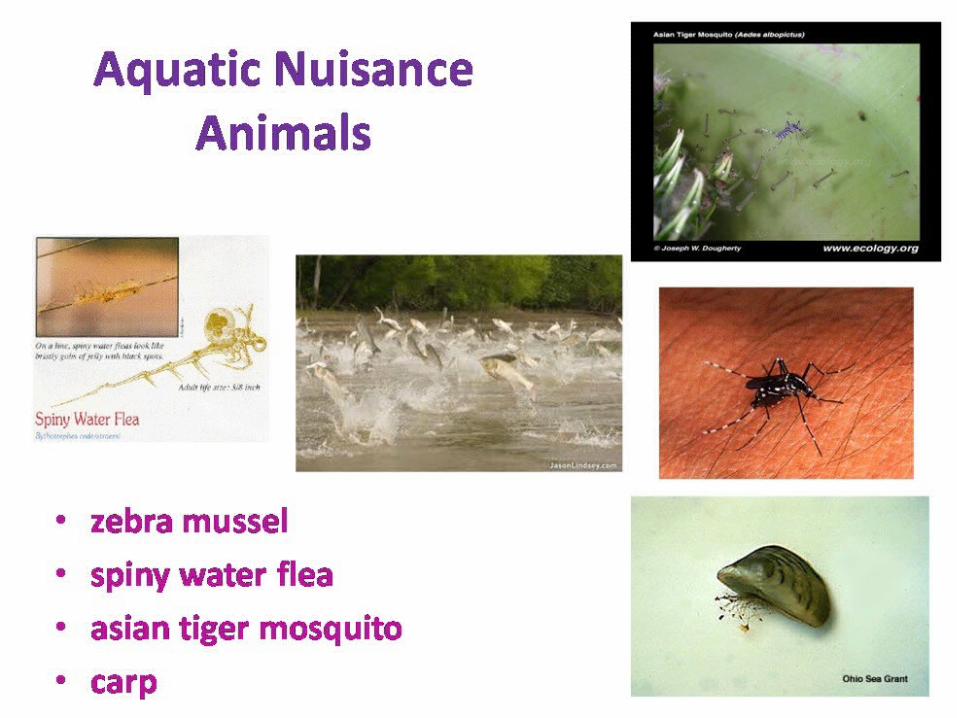
Aquatic Nuisance Plants: Purple Loosestrife, Eurasian Water Milfoil and Water Hyacinth.Aquatic Nuisance Animals: Zebra Mussel; Spiny Water Flea ,Asian Tiger Mosquito, and Carp


Part 3: Water Monitoring
• Understand and interpret data related to testing procedures and purposes for water testing (No actual testing)
• Build and demonstrate a salinometercapable of testing saltwater (1-10%)

Chemical Analysis • Salinity - Salinity - only actual testing with salinometeronly actual testing with salinometer• pHpH• PhosphatesPhosphates• Dissolved oxygenDissolved oxygen• TemperatureTemperature• NitratesNitrates• Fecal ColiformFecal Coliform• Total solidsTotal solids• Biochemical oxygen demand Biochemical oxygen demand
Their relationship to one anotherTheir relationship to one another

Salinomter – Hydrometer
• SalinometersSalinometers / HydrometersHydrometers
• HydrometerHydrometer calibrated to read in % of salt concentration
• MaterialsMaterials – soda straw modeling clay a fine-tipped permanent marker a tall clear container to hold the solution for calibrating your device salt for mixing one or more standard
solutions water (tap water will work-distilled is
better)
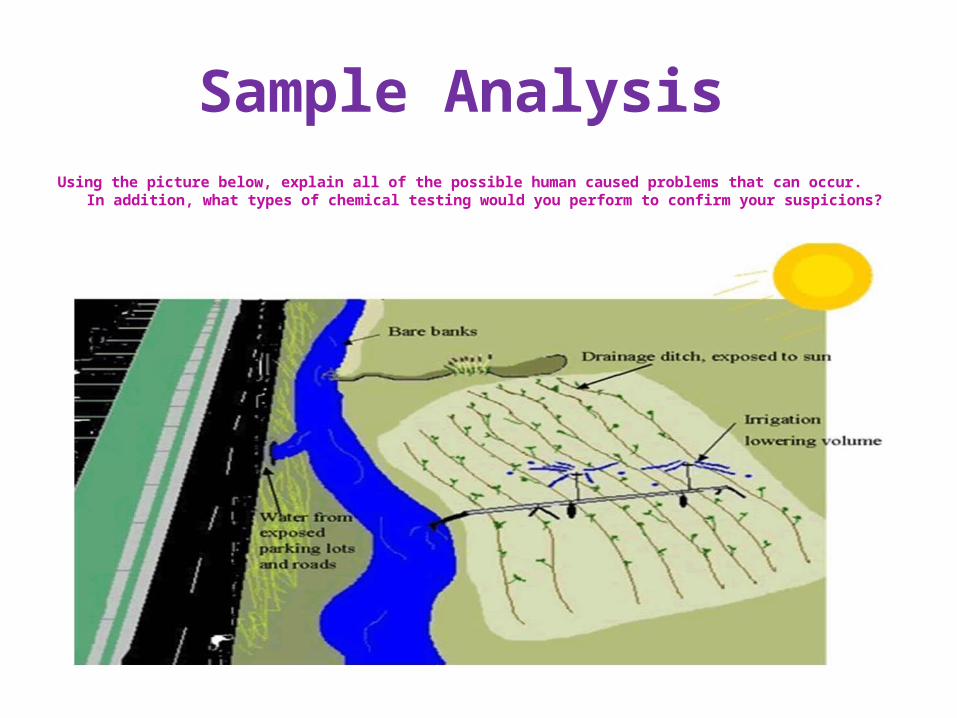
Sample Analysis Using the picture below, explain all of the possible human caused problems that can occur. In addition, what
types of chemical testing would you perform to confirm your suspicions?