2013 Fourth Quarter Treasury Bulletin-1
44
TREASUR Octo Ministry of Fin RY QUARTERLY BULLETIN: ober - December 2013 nance & Economic Developme ent
-
Upload
kristi-duran -
Category
Documents
-
view
214 -
download
0
Transcript of 2013 Fourth Quarter Treasury Bulletin-1

TREASURY QUARTERLY
October
Ministry of Finance
TREASURY QUARTERLY BULLETIN:
ober - December 2013
Ministry of Finance & Economic Development
& Economic Development

1
Table of Contents
INTRODUCTION .................................................................................................................................................. 3
REAL SECTOR ...................................................................................................................................................... 4
Agriculture ..................................................................................................................................................... 4
Progress on the Basic Input Package Scheme ............................................................................................ 5
The 2014 Tobacco Marketing Season ........................................................................................................ 6
Cotton Production 2013/2014 Season ...................................................................................................... 6
Quarterly Milk Production ......................................................................................................................... 7
Grain Deliveries .......................................................................................................................................... 8
Agriculture Commodity Prices ................................................................................................................... 9
Mining .......................................................................................................................................................... 11
Gold Production ....................................................................................................................................... 13
Nickel ....................................................................................................................................................... 14
Platinum ................................................................................................................................................... 14
Chrome .................................................................................................................................................... 15
International Mineral Prices .................................................................................................................... 15
Value Addition and Beneficiation ............................................................................................................ 15
Manufacturing ............................................................................................................................................. 16
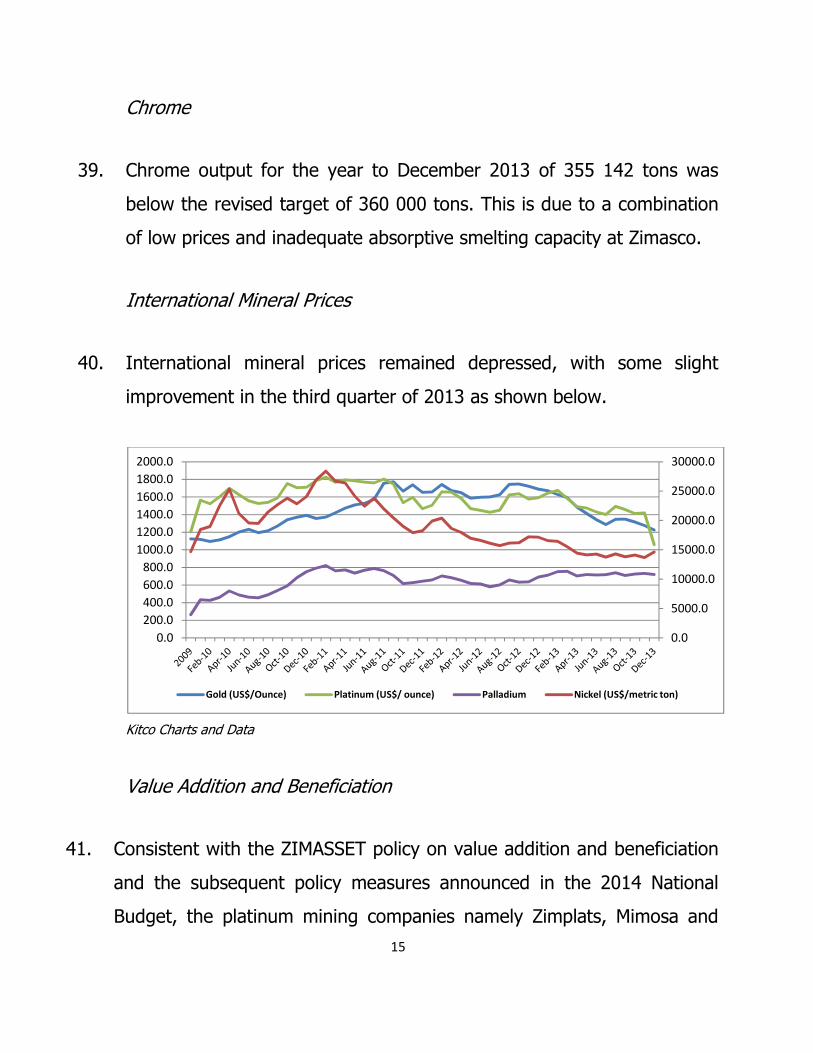
Electricity ..................................................................................................................................................... 18
PRICES .............................................................................................................................................................. 19
BUDGET PERFORMANCE .................................................................................................................................. 20
Revenue Performance ................................................................................................................................. 20
Performance of Revenue Heads .................................................................................................................. 22
Expenditures ................................................................................................................................................ 26

2
Recurrent Expenditure ............................................................................................................................. 26
Capital Expenditure .................................................................................................................................. 27
Financing .................................................................................................................................................. 28
FINANCIAL SECTOR .......................................................................................................................................... 29
Money Supply .............................................................................................................................................. 29
Domestic Credit ....................................................................................................................................... 31
Zimbabwe Stock Exchange........................................................................................................................... 32
EXTERNAL SECTOR ........................................................................................................................................... 34
Exports ......................................................................................................................................................... 34
Imports ......................................................................................................................................................... 35
Trade Gap ..................................................................................................................................................... 37
CONCLUSION .................................................................................................................................................... 37
STATISTICAL TABLES ......................................................................................................................................... 38

3
INTRODUCTION
1. The Fourth Quarter Treasury Bulletin provides an update on fiscal and
economic developments for the period October - December 2013 as
well as an overview of economic performance for 2013.
2. The last quarter of the year also coincided with the introduction of
Government’s Economic Blue Print, “Zimbabwe Agenda for Sustainable
Socio Economic Transformation (ZIM-ASSET) 2013 – 2018”.
3. ZIM-ASSET focuses on five priority areas namely;
• Food Security and Nutrition
• Social Services and Poverty Eradication;
• Infrastructure and Utilities;
• Value Addition & Beneficiation; and
• Fiscal Reforms
4. The fourth quarter also saw the announcement of the 2014 National
Budget to Parliament on the 19th of December 2013. The formulation of
the budget was guided by the ZIMASSET policy document.
5. Consequently, key parameters for the 2014 budget are indicated below:

4
2014 Projections
National Accounts (Real Sector)
Real GDP at market prices ( million US$) 12 337
Nominal GDP at market prices (million us$) 14 065
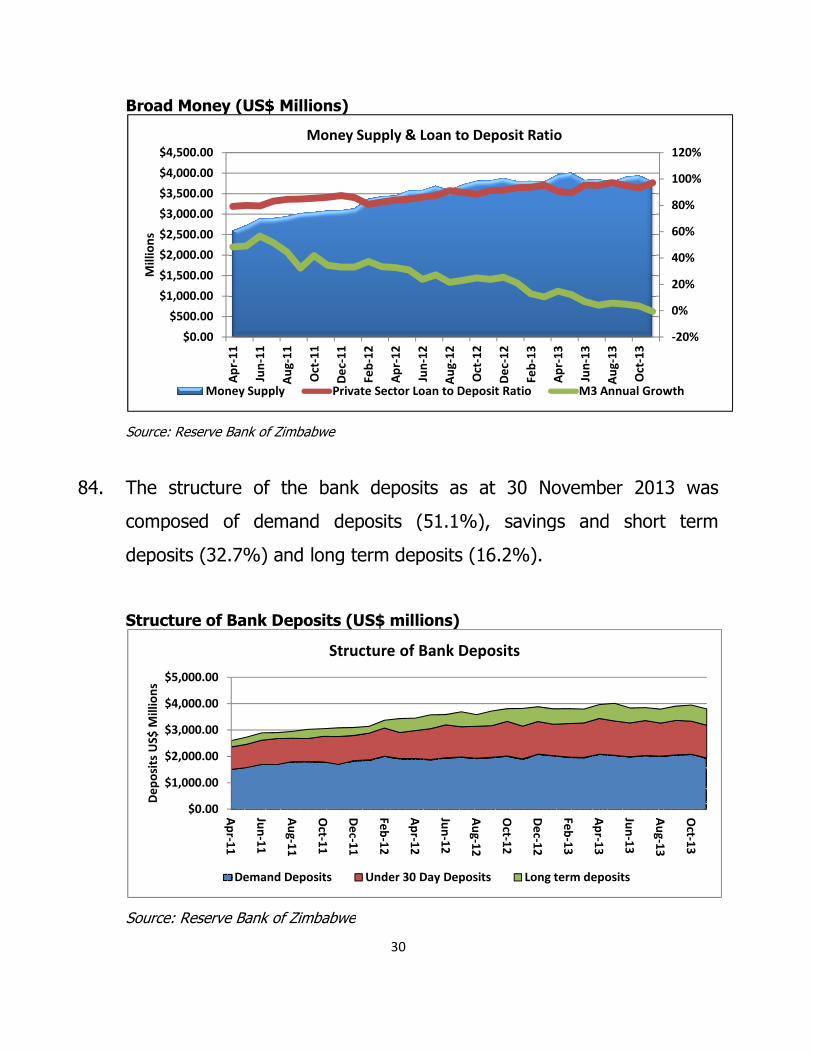
Real GDP Growth (%) 6.1
Inflation (annual average) % 1.5
Government Accounts
Revenues & Grants (Millions US$) 4 120
% of GDP 29.3
Expenditures & Net Lending (million US$) 4 120
% of GDP 29.3
Balance of Payments Accounts
Exports (million US$) 5 024
Imports (million US$) 8 321
Current Account Balance (million US$) -2 471
Source: Ministry of Finance and Economic Development
REAL SECTOR
Agriculture
6. The 2013/14 agricultural summer cropping season experienced a late
start to the season, with rains received from late November.
7. However, the quality of the season has since improved significantly
following incessant rains received throughout the country. The wet
spell is expected to continue into the first quarter of 2014.

5
Progress on the Basic Input Package Scheme
8. In support of the 2013/14 agriculture season, Government provided
support to farmers under the Basic Input Package Scheme valued at
US$161 million.
9. Distribution under the Input Pack Scheme as at 31 December 2013
stood as follows:
• 16 548 tons of maize seed and small grains valued at US$39.4
million;
• 36 923 tons of compound D fertilizer valued at US$22.89 million;
• 24 353 tons of ammonium nitrate fertilizer valued at US$17.05
million; and
• 5 765 tons of lime valued at US$795 862.
Distribution of Inputs Contracted Deliveries by Suppliers Balance Based on
as at 31 December 2013 Contracted Tonnage
Company Quantity Value Quantity Value Quantity Value
(tons) (US$) (tons) (US$) (tons) (US$)
Maize seed 16,285 39,084,000 16181 38,744,688 104 339,312
Small Grains 665 1,000,000 367 676,325 298 323,675
Subtotal 16,950 40,084,000 16,548 39,421,013 402 662,987
Compound D 81,000 50,220,000 36,923 22,892,415 44,077 27,327,585
Ammonium Nitrate 80,000 56,000,000 24,353 17,046,925 55,647 44,327,605
LIME 30,000 4,150,000 5,765 795,862 24,235 3,354,138
Sub total 191,000 110,370,000 67,041 40,735,202 123,959 75,009,328
Grand total 150,454,000 80,156,215 75,672,315
Source: Ministry of Agriculture, Mechanisation & Irrigation Development

6
The 2014 Tobacco Marketing Season
10. The Tobacco Auction Floors are expected to be opened on 19 February
2014, with three auction floors, namely, Tobacco Sales Floor (TSF),
Boka Auction floors, and Premier Tobacco Floor having applied to
participate in the marketing of the crop.
11. Furthermore, TIMB advised that other companies have applied to
operate auction floors under a decentralised framework targeting Karoi,
Rusape, Mvurwi, Marondera and Mutare.
12. A total of 171 million kgs of tobacco expected to be delivered during
the 2014 marketing season. This will represent a 2.6% increase from
the 2013 deliveries of 166 million kgs.
13. According to Tobacco Industry Marketing Board (TIMB), 91 278 farmers
registered to grow flue-cured tobacco in the 2013/14 summer cropping
season, 28.7% up from the 70 904 registered in the 2012/13 season.
Cotton Production 2013/2014 Season
14. Registration of cotton growers closed on the 15th of December 2013.
The total number of growers is estimated at 171,303 farmers and an
estimated total area of 310 429 hectares.

7
15. The 1st tranche of inputs comprising of basal fertilizer compound L,
cotton seeds and chemicals have already been distributed to farmers
under contract farming arrangements.
16. There are 12 contractors in the 2013/2014 cotton production season,
namely; Cottco, China Africa, Cargill, SinoZim, Romsdal, Sinotex,
Grafax, Olam, Parrogate, Insing and Jinmac.
Quarterly Milk Production
17. Milk production for the period October to December 2013 stood at 14.2
million litres, 4.2% lower than the 14.8 million litres realised during the
same period in 2012. About 54.7 million litres of milk was produced in
2013, which is marginaly lower than 55.9 million litres produced in
2012 as indicated in the Table below.
Milk Production in litres
2010 2011 2012 2013
QI 10,731,820.0 11,925,314.0 12,809,452.0 13,320,384.0
QII 11,005,382.0 12,269,132.0 13,561,975.0 13,170,235.0
QIII 12,759,226.0 13,117,285.0 14,724,455.0 13,959,069.0
QIV 12,691,665.0 13,291,614.0 14,833,812.0 14,217,407.0
Total 47,188,093.0 50,603,345.0 55,929,694.0 54,667,095.0
Source: Dairy Association of Zimbabwe

8
Grain Deliveries
18. Cumulative deliveries to the Grain Marketing Board (GMB) under the
Strategic Grain Reserve (SGR), stood at 36,592 metric tons as at 31
December 2013.
2013 Grain Deliveries Price/Ton US$378.82 US$466 US$378.82
Commodities Maize Wheat Small Grains
Tons Value (US$) Tons Value (US$) Tons Value (US$)
April
May
June
July 7,312 2,770,042
August 12,897 4,886,256
September 1,818 688,936
October 5,959 2,257,795 1,981 923,180 169 49,855
November 3,145 1,191,602 4,038 1,881,546 16
December
Total 36,592. 13,863, 206 6,019 2,804,726 185.0 49,855
Source: Grain Marketing Board
19. Of this amount, about 9,104 metric tons were delivered during the
three months to December. The low deliveries are attributed to low
harvests due to the erratic rainfall pattern during the 2012/2013
agricultural season, as well as the delays in payments by GMB, forcing
farmers to sell to other dealers and millers.
20. The annual national requirement under the SGR is 500 000 metric tons.

9
Agriculture Commodity Prices
21. International agriculture commodity prices increased by 2.3% in
December. Major notable drivers of the increase relate to soyabean
which jumped from US$476.7 per ton in November to US$488.7 in
December on strong Chinese feed demand.
22. Cotton prices on the other hand increased to 87.5 cents per pound in
December from 84.6 cents per pound in November benefiting from
lower than anticipated production in the United States.
23. On the other hand, cereal prices, declined by 3% in 2013, owing to
recovery of production. Maize prices declined to US$197.5 per tons in
December from US$199.1 per ton in November. Wheat prices declined
by 5%, recording US$291.6 per ton in December from US$306.8 in
November.
24. Groundnuts prices fell by 8% to US$2 207.5 per ton in December, from
US$2 392.2 per ton in November, mainly as a result of favorable
harvests.
25. Sugar prices fell by 7% to 16.4 cents per pound in December, from
17.7 cents per pound in November, also on the back of abundant
supply.

10
26. The Table below indicates some selected international agricultural
prices for the period under review.
Selected International Agriculture Commodity Prices
Commodities Annual 2013 Quarterly 2013 Monthly
Units 2011 2012 2013 QI QII QIII QIV Oct Nov Dec
Wheat $/MT 223.7 316.2 313.3 355.7 321.4 313.8 305.9 325.1 306.8 291.6
Maize $/MT 186 291.8 298.4 317.3 305.1 290.9 240.4 201.7 199.1 197.5
Rice $/MT 520.6 551.7 580.2 580.3 570.7 550.7 504 453.3 448.8 447.5
Soybeans $/MT 384.9 484.2 537.8 544.4 532.8 540 516.5 479.4 476.7 488.7
Groundnuts $/MT 1239.4 1724 2318.2 2091.8 2521.0 2347.1 2312.7 2056 2392.2 2207.5
Sugar cts/lb 20.9 26.2 21.4 19.6 18.5 17.3 17.3 17.7 17.7 16.4
Cotton cts/lb 103.5 154.6 89.2 82.1 89.9 92.7 91.8 87.2 84.6 87.5
Source: IMF Commodity Prices
27. On the domestic market, agriculture commodity prices have remained
relatively unchanged for the three months under review. The table
below summarises the prices of some selected domestic commodities:
Selected Domestic Agriculture Commodity Prices
Commodity Price (US$/ton) Buyer
Groundnuts 1100 Breckabury
Soya beans 690 Kurima Gold
Wheat 470 Kurima Gold/National Foods
Maize 379 GMB
Barley 450 Delta
Source: AMA, GMB, Delta

11
Mining
28. Mineral output in 2013 indicates strong performance in respect of gold,
nickel and coal, whose perfomance surpassed the 2013 revised targets.
However, platinum group of metals and chrome output were marginally
below target.
29. Declining international mineral prices were the biggest factor weighing
down on improved mineral production, as most mineral prices were on
a downward trend since the beginning of the year.
30. Below is a summary of individual mineral outputs in 2013.

12
Monthly Mineral Production — January-December 2013 MINERAL Jan-13 Feb-13 Mar-13 Apr-13 May-13 Jun-13 Jul-13 Aug-13 Sep-13 Oct-13 Nov-13 Dec
2013 Total
Volume projection
Gold \kg 1,088.44 1,066.38 1,111.39 1,168.23 1,238.28 1,146.59 1,292.60 1,203.02 1,153.50 1,281.59 1,155.76 1,151.00 14,056.78 14,000.00
Nickel \t 739.37 882.88 775.1 947.54 1,238.28 1,145.67 1,238.29 1,127.31 1,816.51 1,572.47 1,494.29 1,235.00 14,057.86 12,000.00
Chrome \t 9,223.00 11,142.00 11,609.00 10,520.00 21,654.00 27,925.00 27,336.00 43,096.00 55,850.00 48,170.00 45,760.00 42,857.00 355,142.00 360,000.00
Platinum\kg 1,007.59 1,219.61 1,069.03 976.45 1,093.55 1,233.25 1,064.54 1,062.10 1,112.49 994.75 1,131.26 1,001.00 12,965.62 13,000.00
Palladium \kg 767.75 422.63 802.01 736.91 853.95 975.22 832.55 823.73 851.8 775.99 907.95 892 9,642.49 9,800.00
Coal 349044.14 328346.3 392655.9 328591.67 330150.35 491094.37 415913.69 418493.81 403038.44 359649.5 359649.5 359649.5 4536277 3300000
Source: Chamber of Mines and Fidelity Printers

13
2013 Quarterly Mineral Production QI QII QIII QIV Total Projection
Gold \kg
3,266.22 3,553.13 3,649.12 3,588.35 14,056.82 14000
Nickel \t
2397.35 3,177.01 4,182.11 4,301.76 14,057.86 12000
Coal \t
1,070,046.34 1,149,836.39 1,237,445.94 1,078,948.50 4,536,277.17 3 300
Chrome \t
31,974.00 60,099.00 126,282.00 136,787.00 355,142.00 360 000
Platinum \kg
3,296.23 3,303.25 3,239.13 3,127.01 12,965.62 13000
Palladium \kg
1,992.39 2,566.08 2,508.08 2,575.94 9,642.49 9800
Source: Chamber of Mines
Gold Production
31. Cumulative gold production for the year to December 2013 was 14
056.82 kgs against a revised target of 14 000 kgs. However, output for
the fourth quarter of 2013 declined to 3 588.35 kgs compared to 3
649.12 kgs produced in the third quarter of the same year.
32. The decline in the performance of gold, especially in the fourth quarter,
is partly explained by the continued deceleration of international gold
prices from the peak of US$1 670.95 in January to US$1272.47 in the
last quarter of 2013.
33. In addition, Mwana Africa, one of the biggest gold producers,
temporarly shut down its operations in December 2013 to undertake
some modifications at one of its mills. While this affected gold output,
the move is expected to boost gold throughput in 2014.

14
34. Furthermore, the introduction of a lower rate of royalty at 3% from 7%
for small scale miners will have a positive impact on guaranteeing
improved sales to the formal system and hence, reduce leakages.
Nickel
35. Cumulative nickel output for the year to December 2013 amounted to
14 057.86 tons against the revised target of 12 000 tons. The improved
performance is on account of successful recapitalisation of BNC which
facilitated enhanced production during the second half of the year.
36. Subsequently, output in the fourth quarter increased to 4 301.76 tons
from 4 182.11 tons produced in the previous quarter.
Platinum
37. Annual platinum output for 2013 at 12 965.62 kgs slightly failed to
meet the set target of 13 000 kgs by 34kgs, due to declining platinum
prices on the international market.
38. The underperformance of platinum also implies subdued pereformance
in the related platinum group of metals such as palladium, rhodium,
lithium, iridium and rhuthenium.
15
Chrome
39. Chrome output for the year to December 2013 of 355 142 tons was
below the revised target of 360 000 tons. This is due to a combination
of low prices and inadequate absorptive smelting capacity at Zimasco.
International Mineral Prices
40. International mineral prices remained depressed, with some slight
improvement in the third quarter of 2013 as shown below.
Kitco Charts and Data
Value Addition and Beneficiation
41. Consistent with the ZIMASSET policy on value addition and beneficiation
and the subsequent policy measures announced in the 2014 National
Budget, the platinum mining companies namely Zimplats, Mimosa and
0.0
5000.0
10000.0
15000.0
20000.0
25000.0
30000.0
0.0
200.0
400.0
600.0
800.0
1000.0
1200.0
1400.0
1600.0
1800.0
2000.0
Gold (US$/Ounce) Platinum (US$/ ounce) Palladium Nickel (US$/metric ton)

16
Unki have already submitted plans to set up a platinum refinery plant in
the country.
Manufacturing
42. In 2013, the manufacturing sector faced a number of challenges,
resulting in average capacity utilisation declining to 39.6%, compared
to 44.9% recorded in 2012.
43. According to the Confederation of Zimbabwe Industries (CZI)
Manufacturing Survey of August 2013, the obtaining capacity utilisation
across sub sectors are indicated below.
Manufacturing sector Average Capacity Utilisation (%) in 2012
Average Capacity Utilisation (%) in 2013
Bakers 40.0 82.5
Battery 76.5 71.5
Building (construction and related)
59.5 44.1
Car Assemblers 30.3 13.1
Electric Appliances Manufacturers
43.8 37.5
Engineering Iron and Steel 36.7 27.7
Food, Dairy and Beverages 58.2 42.0
Grain Millers 30.0 50.0
Chemical 41.6 30.0
Leather and Allied 27.5 11.3
Pharmaceuticals 58.0 20.0
Plastic, Packaging and Rubber 46.1 38.0
Paper, Printing and Publishing 58.3 55.0
Textiles and Clothing 34.4 35.3
Timber Processors 53.8 58.0
Source: CZI
44. The low capacity utilisation levels have been mirrored by company
closures and/or scaling down of operations. The most affected

17
subsectors included textiles and ginning, clothing and footwear, paper,
printing and publishing, chemicals and petroleum products as well as
pharmaceuticals.
45. Most company closures have been recorded in Bulawayo and Mutare,
resulting in de-industrialisation and job losses.
46. The major factor behind company closures is the difficult operating
environment, partly emanating from the influx of cheap imports,
thereby negatively affecting the competitiveness of the local industry.
47. The 2014 National Budget, therefore, proposed a number of measures
aimed at levelling the playing field through some tariff adjustments on
a number of domestically manufactured products. These include,
among others:
• Steel and Plastic;
• Dairy Products;
• Biscuit;
• Paint;
• Metal and Electrical;
• Rubber Industries; and
• Oil Expressers.
48. These supportive measures should augment the recovery of the
manufacturing sector, which is estimated to grow by 3.2% in 2014.

Electricity
49. The electricity generation capacity deteriorated significantly during the
last quarter of the year. After reaching a peak of over 1200 MW/h in
July and August, electricity generation declined to below 1000 MW/h
during the months of October and November. Th
intermittent breakdowns at Hwange and Kariba
thermal power stations
50. However, power generation
2012, as generating plants managed to run consistently in the first ten
months of the year as indicated in the table below.
Source: Ministry of Energy and Power Development
0
200
400
600
800
1000
1200
1400
Jan Feb
MW/h
Monthly Electricity Generation Capacities: 2012 VS 2013
18
The electricity generation capacity deteriorated significantly during the
last quarter of the year. After reaching a peak of over 1200 MW/h in
July and August, electricity generation declined to below 1000 MW/h
the months of October and November. This
intermittent breakdowns at Hwange and Kariba, as well as other small
thermal power stations.
However, power generation in 2013 was slightly higher
generating plants managed to run consistently in the first ten
months of the year as indicated in the table below.
Source: Ministry of Energy and Power Development
Feb Mar Apr May Jun Jul Aug Sep
Monthly Electricity Generation Capacities: 2012 VS 2013
2012 2013
The electricity generation capacity deteriorated significantly during the
last quarter of the year. After reaching a peak of over 1200 MW/h in
July and August, electricity generation declined to below 1000 MW/h
is was due to
as well as other small
higher compared to
generating plants managed to run consistently in the first ten
Oct Nov
Monthly Electricity Generation Capacities: 2012 VS 2013

19
51. In 2014, electricity sector is expected to grow by 4.5%, benefiting from
the on-going rehabilitation works at Hwange and small thermal power
stations.
PRICES
52. The general price level in the economy has been on a downward trend,
with year on year inflation opening the year at 2.5% and declining to
0.33% in December 2013.
Source: ZIMSTAT, Reserve Bank of South Africa
53. Annual inflation in October, recorded 0.59%, slightly dropping to 0.54%
in November, and 0.33% in December.
8.0
8.5
9.0
9.5
10.0
10.5
-1.0
-0.5
0.0
0.5
1.0
1.5
2.0
2.5
3.0
3.5
Jan Feb Mar Apr May Jun Jul Aug Sep Oct Nov DecR
an
d/U
S$
%
2013 Inflation & Rand/US$ exchange rate Profile
Rand/US$ exchange rate Month on Month inflation Year on Year inflation

20
54. On a monthly basis, deflation of -0.01% and -0.1% were recorded for
the month of October and December, respectively. In November,
overall prices gained 0.20% to record a monthly inflation of 0.09%.
55. This deceleration reflects weak aggregate demand induced by tight
liquidity, low disposable incomes, steady international oil and food
prices as well as stable inflation expectations.
56. Furthermore, given that 70% of our imports are from South Africa, the
depreciation of the rand against the United States dollar was also a
contributing factor.
BUDGET PERFORMANCE
Revenue Performance
57. Total revenue collections during the fiscal year 2013, amounted to
US$3.74 billion against a target of US$3.86 billion, resulting in a
negative variance of US$118.96 million.
58. Tax revenue contributed US$3.41 billion or 91% of total revenue
against a target of US$3.65 billion, giving a negative variance of
US$232.34 million.

59. Benefiting from telecommunication licence fees, non
collections were US$327.0 million
target of US$213.6 million. This gives a positive variance of US$113.10
million.
60. Telecommunication licence fees
61. Revenue performance reflects severe underperformance in the last
quarter of the year, as indicated in the
Source: Ministry of Finance and Economic Development
62. Historically, bulky of the revenues are collected in the last quarter of
the year. However, a complete reversal of this trend was noted
economy experienced liquidity constraint, which worsened during
last quarter of 2013.
Jan Feb
Actuals 254.50 269.47 314.00
Target 273.66 249.82 301.86
US
$M
illi
on
s
21
Benefiting from telecommunication licence fees, non-
US$327.0 million, or 9% of total revenue
rget of US$213.6 million. This gives a positive variance of US$113.10
icence fees alone amounted to US$151.5 million.
evenue performance reflects severe underperformance in the last
as indicated in the table below.
Source: Ministry of Finance and Economic Development
Historically, bulky of the revenues are collected in the last quarter of
However, a complete reversal of this trend was noted
economy experienced liquidity constraint, which worsened during
Mar Apr May Jun Jul Aug Sep Oct
314.00 271.04 363.59 354.41 323.03 319.54 353.43 278.15
301.86 282.83 293.2 360.21 292.66 293.6 367.15 328.83
Revenues:Jan-Dec 2013
-tax revenue
or 9% of total revenues, against a
rget of US$213.6 million. This gives a positive variance of US$113.10
US$151.5 million.
evenue performance reflects severe underperformance in the last
Historically, bulky of the revenues are collected in the last quarter of
However, a complete reversal of this trend was noted as the
economy experienced liquidity constraint, which worsened during the
Oct Nov Dec
278.15 259.10 380.89
328.83 351.71 464.48

Performance of Revenue Heads
63. Revenue heads that contributed significantly to total revenue include,
Value added Tax (28%), individuals (20%), Excise Duty (14%),
Corporate Tax (11%) and Customs Duty (10%).
64. Other taxes which include domestic dividends and interests and
royalties among others, contributed 9% to total revenue.
65. The breakdown of revenue performance is indicated in the chart below.
Source: Ministry of Finance and Economic Development
Value Added Tax
(VAT)
28%
Other indirect taxes
2%
2013 Revenue Composition
22
Performance of Revenue Heads
Revenue heads that contributed significantly to total revenue include,
Value added Tax (28%), individuals (20%), Excise Duty (14%),
Corporate Tax (11%) and Customs Duty (10%).
Other taxes which include domestic dividends and interests and
others, contributed 9% to total revenue.
The breakdown of revenue performance is indicated in the chart below.
Source: Ministry of Finance and Economic Development
PAYE
20%
Corporate Tax
11%
Customs duties
10%Excise duties
14%
Non-tax Revenue
9%
2013 Revenue Composition
Revenue heads that contributed significantly to total revenue include,
Value added Tax (28%), individuals (20%), Excise Duty (14%),
Other taxes which include domestic dividends and interests and
The breakdown of revenue performance is indicated in the chart below.
Corporate Tax
11%
Other Profit
and Income
Taxes
6%

66. Although VAT, Corporate tax, customs duty contributed significantly to
tax revenue, they however performed below
below.
Source: Ministry of Finance and Economic Development
67. This underperformance is attributed to general economic slowdown,
with the liquidity situation worsening during the last quarter.
-
200.0
400.0
600.0
800.0
1,000.0
1,200.0
2013 Revenue Performance (Actuals vs Targets)
23
Although VAT, Corporate tax, customs duty contributed significantly to
they however performed below the 2013 targets as shown
Source: Ministry of Finance and Economic Development
This underperformance is attributed to general economic slowdown,
with the liquidity situation worsening during the last quarter.
2013 Revenue Performance (Actuals vs Targets)
Although VAT, Corporate tax, customs duty contributed significantly to
the 2013 targets as shown
This underperformance is attributed to general economic slowdown,
with the liquidity situation worsening during the last quarter.
2013 Revenue Performance (Actuals vs Targets)
Actual
Target

Source: Ministry of Finance and Economic Development
68. Total revenue collections for the last quarter of 2013 amounted to
US$918.14 million, against a quarterly target of US$1.145 billion
a negative variance of about US$226 million.
Summary of Quarterly Revenue Heads Performance for
Revenue and Grants
Revenue
Tax revenue
Personal income tax
Corporate income tax
Other direct taxes
Customs
Excise
Value added Tax
Other indirect taxes
Non Tax revenue
Grants
Source: Ministry of Finance and Economic Development
0.00
200.00
400.00
600.00
800.00
1000.00
1200.00
Q1
Actual 837.97
Target 825.336
US
$ M
illi
on
s
2013 Quarterly Revenue Performance
24
Source: Ministry of Finance and Economic Development
Total revenue collections for the last quarter of 2013 amounted to
against a quarterly target of US$1.145 billion
a negative variance of about US$226 million.
Summary of Quarterly Revenue Heads Performance for (Millions Us$)2012 2013
QI QII QIII QIV QI QII
771.1 825.9 902.3 1027.3 838.0 989.0
771.1 825.9 902.3 1027.3 838.0 989.0
709.6 787.5 825.8 907.6 804.1 842.7
145.3 156.3 163.0 187.9 174.3 174.3
75.2 104.1 117.2 109.4 86.0 99.5
55.3 85.8 75.5 76.3 65.3 68.4
87.9 81.1 89.3 107.3 89.2 90.3
88.9 86.6 101.8 110.9 111.8 130.6
242.7 257.2 270.1 308.1 269.3 255.1
14.3 16.4 8.9 7.9 8.2 24.5
61.5 38.4 76.6 119.8 33.9 146.4
0.0 0.0 0.0 0.0 0.0 0.0
Source: Ministry of Finance and Economic Development
Q1 Q2 Q3 Q4
837.97 989.03 996.00 918.14
825.336 936.243 953.403 1145.02
2013 Quarterly Revenue Performance
Total revenue collections for the last quarter of 2013 amounted to
against a quarterly target of US$1.145 billion, giving
(Millions Us$) 2013
QIII QIV
989.0 996.0 918.14
989.0 996.0 918.14
842.7 891.8 875.47
174.3 211.3 184.47
102.4 116.45
44.4 49.09
91.5 90.28
130.6 129.9 138.16
255.1 284.0 259.68
28.3 37.41
146.4 104.2 42.67
0.0 0
Q4
918.14
1145.02

69. The Table below shows the nominal growth in revenues per quarter
from 2011 to 2013.
Source: Ministry of Finance and Economic Development
70. The ratio of revenue to GDP has been increasing since 2009
there are signs of stagnating between 2012 and 2013
below.
Source: Ministry of Finance and
0
200
400
600
800
1000
Q1
US
$ M
illi
on
s
Quarterly Revenues: 2011
25
The Table below shows the nominal growth in revenues per quarter
Source: Ministry of Finance and Economic Development
The ratio of revenue to GDP has been increasing since 2009
there are signs of stagnating between 2012 and 2013, as indicated
Source: Ministry of Finance and Economic Development
Q2 Q3 Q4
Quarterly Revenues: 2011-2013
The Table below shows the nominal growth in revenues per quarter
The ratio of revenue to GDP has been increasing since 2009, although
, as indicated
2011
2012
2013

Expenditures
71. Cumulative expenditure
billion, against targeted expenditure
expenditures, US$3.52 billion went towards recurrent expenditure,
while capital expenditure
US$396.1 million and US$71.65 million, respectively.
Source: Ministry of Finance and Economic Development
Recurrent Expenditure
72. Of the total, recurrent expenditures took up 88% of total expenditures.
Employment costs alone
48% of the total budget
0.00
50.00
100.00
150.00
200.00
250.00
300.00
350.00
400.00
450.00
500.00
Jan Feb
Revenues 254.5 269.4
Expenditures 225.5 324.5
US
$ M
illi
on
s
2013 Revenues vs Expenditures
26
Cumulative expenditures to December 2013 amounted to
against targeted expenditures of US$3.86 billion. Of these
expenditures, US$3.52 billion went towards recurrent expenditure,
while capital expenditure and net lending absorbed the remaining
US$396.1 million and US$71.65 million, respectively.
Source: Ministry of Finance and Economic Development
Recurrent Expenditure
recurrent expenditures took up 88% of total expenditures.
alone amounted to US$1.9 billion, constituting about
of the total budget and 55% of total recurrent expenditure
Feb Mar Apr May Jun Jul Aug Sep Oct
269.4 314.0 271.0 363.5 354.4 323.0 319.5 353.4 278.1
324.5 322.7 248.2 307.8 310.7 397.7 336.3 302.0 388.7
2013 Revenues vs Expenditures
amounted to US$3.99
of US$3.86 billion. Of these
expenditures, US$3.52 billion went towards recurrent expenditure,
and net lending absorbed the remaining
recurrent expenditures took up 88% of total expenditures.
amounted to US$1.9 billion, constituting about
recurrent expenditures.
Nov Dec
259.1 380.7
317.3 483.0

73. Accordingly, US$1.59 billion was left for other recurrent exp
as goods and services, interest payments and current transfers.
74. The graph below shows
Source: Ministry of Finance and Economic Development
Capital Expenditure
75. A total of US$386.5 million
benefitting mainly key
education, water and sanitation.
Interest on Debt
1%
Current Transfers
28%
Capital Expenditure
10%
27
US$1.59 billion was left for other recurrent exp
as goods and services, interest payments and current transfers.
The graph below shows the structure of expenditures for the year
Source: Ministry of Finance and Economic Development
US$386.5 million was expended on capital projects
key ongoing projects in sectors of transport, health,
water and sanitation.
Employment Costs
48%
Other Goods &
Services
11%
Current Transfers
Capital ExpenditureNet Lending
2%
Expenditures for Jan-Dec 2013
US$1.59 billion was left for other recurrent expenses such
as goods and services, interest payments and current transfers.
of expenditures for the year.
was expended on capital projects,
transport, health,

28
76. Some of the key interventions in water and sanitation included dam
construction, water conveyance infrastructure, rehabilitation and
upgrading of water and sewer infrastructure in urban settlements and
the rural water and sanitation programmes with disbursements
amounting to US$97.9 million, as at 30 November 2013.
77. The Table below shows disbursements for major water and sanitation
projects:-
PROJECT DISBURSEMENTS TO NOVEMBER 2013
Tokwe Murkosi Dam 65,962,300
Mutange Dam 1,088,392
Gwayi-Shangani Dam 9,370,000
Osborne Dam 322,000
Mtshabezi Pipeline 4,200,000
Wenimbi Pipeline 1,617,000
Local Authorities 8,964,300
Water Supplies 3,116,200
Rural Water and Sanitation 3,300,000
Grand Total 97,940,192
Source: Ministry of Finance and Economic Development
Financing
78. Given total expenditures of US$3.99 billion, and total revenues of
US$3.74 billion, a budget overrun of US$246.36 million for the year was
realised.
79. The deficit was financed mainly through the issuance of Treasury Bills.

29
FINANCIAL SECTOR
80. The 2013 fourth quarter was characterised by some turbulence in the
financial sector, with cash shortages being experienced in some
banking institutions.
81. Trust Banking Corporation succumbed to poor asset quality,
mismanagement, under-capitalisation and unsoundness resulting in the
cancellation of their banking licence by the Reserve Bank of Zimbabwe
on 6 December 2013.
Money Supply
82. As at 30 November 2013, total banking sector deposits stood at
US$3.807 billion, representing an annual decrease of -0.46% compared
to an annual growth of 23.8% during the same period in 2012. The
stagnation in money supply is being reflected by the current low annual
inflation level of 0.33% in December 2013.
83. The Chart below shows the growth rate in broad money since 2011 and
the loan to deposit ratio.
Broad Money (US$ Millions)
Source: Reserve Bank of Zimbabwe
84. The structure of the bank deposits
composed of demand deposits (51.1%), savings and short term
deposits (32.7%) and long term deposits (16.2%).
Structure of Bank Deposits (US$ millions)
Source: Reserve Bank of Zimbabwe
$0.00
$500.00
$1,000.00
$1,500.00
$2,000.00
$2,500.00
$3,000.00
$3,500.00
$4,000.00
$4,500.00
Ap
r-1
1
Jun
-11
Au
g-1
1
Mil
lio
ns
Money Supply
$0.00
$1,000.00
$2,000.00
$3,000.00
$4,000.00
$5,000.00
Ap
r-11
Jun
-11
Au
g-1
1
De
po
sits
US
$ M
illi
on
s
Demand Deposits
30
Broad Money (US$ Millions)
: Reserve Bank of Zimbabwe
The structure of the bank deposits as at 30 November 2013 was
composed of demand deposits (51.1%), savings and short term
deposits (32.7%) and long term deposits (16.2%).
Structure of Bank Deposits (US$ millions)
Source: Reserve Bank of Zimbabwe
Oct
-11
De
c-1
1
Feb
-12
Ap
r-1
2
Jun
-12
Au
g-1
2
Oct
-12
De
c-1
2
Feb
-13
Ap
r-1
3
Jun
-13
Au
g-1
3
Money Supply & Loan to Deposit Ratio
Private Sector Loan to Deposit Ratio M3 Annual Growth
Oct-1
1
De
c-11
Feb
-12
Ap
r-12
Jun
-12
Au
g-1
2
Oct-1
2
De
c-12
Feb
-13
Ap
r-13
Structure of Bank Deposits
Demand Deposits Under 30 Day Deposits Long term deposits
November 2013 was
composed of demand deposits (51.1%), savings and short term
-20%
0%
20%
40%
60%
80%
100%
120%
Au
g-1
3
Oct
-13
M3 Annual Growth
Jun
-13
Au
g-1
3
Oct-1
3
Long term deposits
31
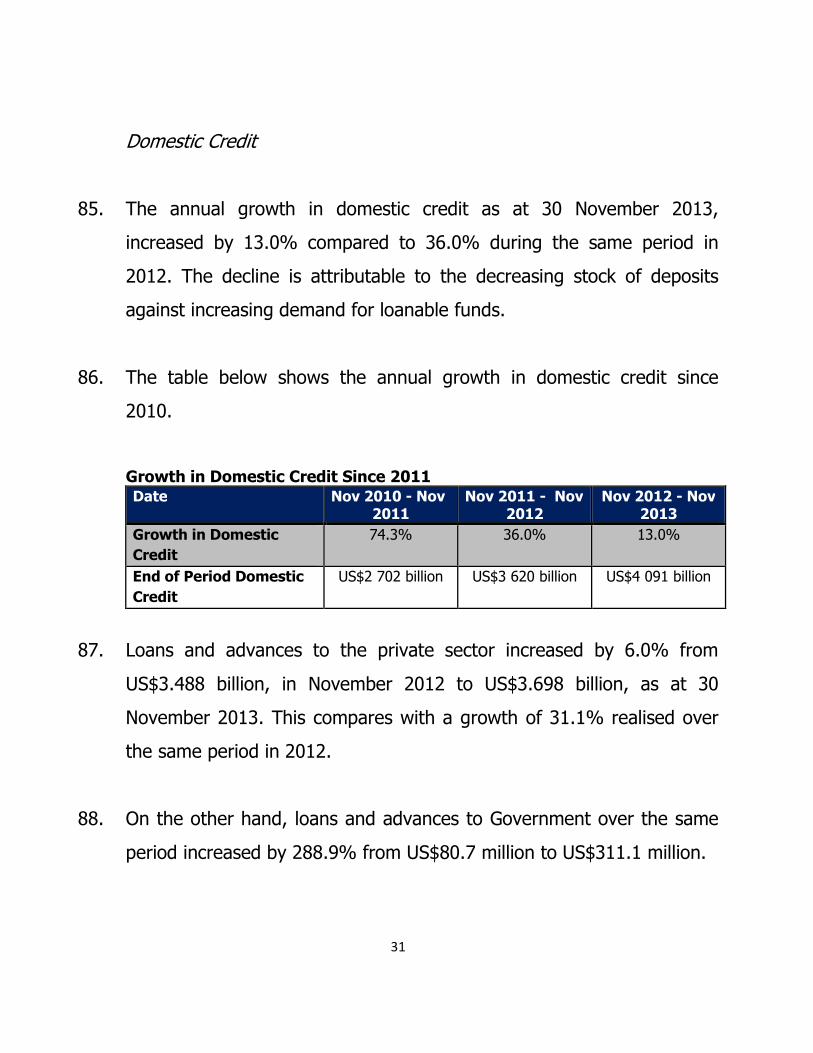
Domestic Credit
85. The annual growth in domestic credit as at 30 November 2013,
increased by 13.0% compared to 36.0% during the same period in
2012. The decline is attributable to the decreasing stock of deposits
against increasing demand for loanable funds.
86. The table below shows the annual growth in domestic credit since
2010.
Growth in Domestic Credit Since 2011 Date Nov 2010 - Nov
2011 Nov 2011 - Nov
2012 Nov 2012 - Nov
2013
Growth in Domestic
Credit
74.3% 36.0% 13.0%
End of Period Domestic
Credit
US$2 702 billion US$3 620 billion US$4 091 billion
87. Loans and advances to the private sector increased by 6.0% from
US$3.488 billion, in November 2012 to US$3.698 billion, as at 30
November 2013. This compares with a growth of 31.1% realised over
the same period in 2012.
88. On the other hand, loans and advances to Government over the same
period increased by 288.9% from US$80.7 million to US$311.1 million.

89. The sectoral analysis of banking sector loans and advances showed
that cumulative funding to agricul
manufacturing got the lion’s share at 18%, 17%, 17% and 16%
respectively, as shown in the graph below
Distribution of Loans and Advances
Zimbabwe Stock Exchange
90. The industrial index grew by 32.6% during the year 2013
annual growth of 4.5% in 2012. The index
152.4 points and reached an all
2013, before closing the year
91. The mining index continued with contrary market sentiments
declined by 29.4%, compared to a growth of 51.3% in 2012.
Transport
2%
Distribution
17%
32
The sectoral analysis of banking sector loans and advances showed
that cumulative funding to agriculture, distribution, services and
manufacturing got the lion’s share at 18%, 17%, 17% and 16%
as shown in the graph below:
Distribution of Loans and Advances
Zimbabwe Stock Exchange
The industrial index grew by 32.6% during the year 2013
annual growth of 4.5% in 2012. The index opened the year 2013 at
reached an all-time high of 232.87 points in July
before closing the year at 202.12 points.
The mining index continued with contrary market sentiments
compared to a growth of 51.3% in 2012.
Agriculture
18%Construction
2%
Manufacturing
16%
Mining
7%
Services
17%
Individuals
16%
Transport
Distribution
Others
5%
The sectoral analysis of banking sector loans and advances showed
ture, distribution, services and
manufacturing got the lion’s share at 18%, 17%, 17% and 16%,
The industrial index grew by 32.6% during the year 2013, from an
opened the year 2013 at
time high of 232.87 points in July
The mining index continued with contrary market sentiments, as it
compared to a growth of 51.3% in 2012. The index
Construction
Manufacturing

was 65.12 points at the beginning of the year
45.79 points.
Source: Reserve Bank of Zimbabwe
92. The total market capitalisation
of the year, and grew by 31.3% to US$5.203 billion
2013. This is shown in the graph below.
Zimbabwe Stock Exchange Performance: 2009
Source: Reserve Bank of Zimbabwe
-
2,000
4,000
6,000
8,000
De
c-1
2
Jan
-13
US
$ M
illi
on
s
-
50.00
100.00
150.00
200.00
250.00
Jan-12 Apr-12
Po
ints
33
was 65.12 points at the beginning of the year, and closed the year at
Source: Reserve Bank of Zimbabwe
The total market capitalisation was US$3.963 billion, at the beginning
and grew by 31.3% to US$5.203 billion, as at
. This is shown in the graph below.
Zimbabwe Stock Exchange Performance: 2009 – 2013
Source: Reserve Bank of Zimbabwe
Jan
-13
Feb
-13
Ma
r-1
3
Ap
r-1
3
Ma
y-1
3
Jun
-13
Jul-
13
Au
g-1
3
Se
p-1
3
Oct
-13
Market Capitalisation
Mkt Cap
Jul-12 Oct-12 Jan-13 Apr-13 Jul-13
ZSE Indices
Industrial Index Mining Index
closed the year at
at the beginning
31 December
No
v-1
3
De
c-1
3
Oct-13

34
EXTERNAL SECTOR
Exports
93. Total exports for the period January to December 2013 amounted to
US$3.5 billion, compared to US$3.8 billion, realised during the same
period in 2012. Minerals contributed the bulk of the exports for the
period under review. The major exports destination remains South
Africa.
94. The table below shows monthly exports for the period January to
December 2012 and 2013, respectively.
Exports: 2012 &2013 Comparisons Month 2012 2013
January 258,124,310 279,555,180
February 255,206,355 279,047,033
March 309,946,785 253,927,213
April 227,035,793 209,914,487
May 278,145,876 278,314,632
June 232,719,132 244,883,722
July 338,011,302 287,436,037
August 449,726,798 282,668,224
September 324,018,806 308,664,377
October 479,772,803 363,714,307
November 414,848,477 467,471,012
December 314,872,655 251,838,635
Total 3,882,429,092 3,507,434,859
Source: ZIMSTAT

95. In the month of December,
from US$467.5 million
representing a 46% de
Source: ZIMSTAT: 2013
Imports
96. Cumulatively, imports to
Foodstuffs, motor vehicles and fuel contributed the bulk of the imports.
97. The table below shows monthly
December 2013 and 2013
-
200
400
600
800
1,000
1,200
Q1
35
December, exports decreased to US$251.8 million
US$467.5 million, realised in the month of November
decline.
Cumulatively, imports to December 2013, amounted to US$
Foodstuffs, motor vehicles and fuel contributed the bulk of the imports.
The table below shows monthly imports for the period January to
2013, respectively.
Q2 Q3 Q4
2013 Quarterly Exports (US$M)
US$251.8 million,
of November,
amounted to US$7.7 billion.
Foodstuffs, motor vehicles and fuel contributed the bulk of the imports.
ports for the period January to
Exports

Imports: 2012 &2013 Comparisons Month
January
February
March
April
May
June
July
August
September
October
November
December
Total
Source: ZIMSTAT, 2013
98. In the month of December
from US$594.3 million
a 3% decrease.
Source: ZIMSTAT: 2013
-
500
1,000
1,500
2,000
2,500
Q1
2013 Quarterly Imports (US$M)
36
Comparisons 2012 2013
604,942,503 606,712,339
470,517,060 499,162,650
512,150,918 532,812,989
490,167,867 963,636,659
523,853,496 580,022,084
500,698,805 714,119,959
673,099,276 572,670,193
798,780,788 704,166,464
628,045,550 750,242,892
887,243,186 609,822,386
708,791,048 594,277,521
665,251,758 576,576,958
7,463,542,255 7,704,223,094
December, imports decreased to US$576.6
US$594.3 million, recorded in the previous month. This represents
Q2 Q3 Q4
2013 Quarterly Imports (US$M)
013
606,712,339
499,162,650
532,812,989
963,636,659
580,022,084
714,119,959
572,670,193
704,166,464
750,242,892
609,822,386
594,277,521
576,576,958
7,704,223,094
576.6 million,
recorded in the previous month. This represents
Imports

37
Trade Gap
99. Cumulatively, overall trade gap to December 2013, amounted US$4.2
billion.
100. The trade gap for the month of December worsened to US$324.7
million from US$126.8 million, realised in the month of November 2013.
CONCLUSION
101. The overall economic performance for 2013 was not impressive. Most
economic indicators performed well below their targets. The economic
growth targets for the year were revised downwards, while revenue
collections also were well below targets.
102. However, prospects remain positive in the future, anchored by full
implementation of ZIMASSET and the supportive measures as
contained in the 2014 National Budget.

38
STATISTICAL TABLES
Budget Outturn: Jan – December 2013
ZIMBABWE BUDGET CUMULATIVE DATA: 2013
ACTUALS (US$)
CUM ACTUAL to DEC 2013
Jan-13 Feb-13 Mar-13 Apr-13 May-13 Jun-13 Jul-13 Aug-13 Sep-13 Oct-13 Nov-13 Dec-13 Dec-13
Total Revenue Including Retained Revenue,Transfers & Prepayments
263,322,595.4
277,624,816.2
324,114,157.0
281,118,395.4
373,338,288.5
364,949,954.3
332,838,987.8
329,917,199.1
364,432,332.4 286,915,734.6
266,321,441.0 391,590,668.2 3,856,484,569.8
-
Total Revenue Including Zimra Grant 254,502,364.
7 269,468,315.
4 313,999,640.
0 271,037,925.
9 363,588,165
.8 354,406,650.
6 323,032,992.
5 319,539,891.
2 353,430,354.
3 278,154,664.5 259,103,119.
7 380,777,335.7 3,741,041,420.2
-
Total Government Revenue (Net) 254,502,364.
7 269,468,315.
4 313,999,640.
0 271,037,925.
9 363,588,165
.8 354,406,650.
6 323,032,992.
5 319,539,891.
2 353,430,354.
3 278,154,664.5 259,103,119.
7 380,777,335.7 3,741,041,420.2
-
Tax Revenue 245,291,304.
7 258,828,013.
1 299,951,221.
4 251,986,599.
6 268,800,925
.7 321,893,080.
0 266,941,568.
6 286,147,936.
5 338,740,994.
8 263,013,004.3 247,610,090.
6 364,851,625.5 3,414,056,364.6
-
Tax on Income and profits 92,159,226.3 97,734,752.7 135,598,254.
9 95,260,008.8 97,348,120.
5 149,534,341.
7 92,714,707.9 105,973,358.
5 159,388,135.
7 93,311,598.4 83,596,740.5 173,103,339.2 1,375,722,585.1
Individuals 62,761,331.9 55,575,917.6 55,929,755.2 52,952,796.6 61,401,994.7 59,932,757.0 61,174,231.4 73,900,288.5 76,255,733.8 57,500,694.9 52,069,978.6 74,898,947.2 744,354,427.4
Companies 16,418,982.6 11,747,265.8 57,796,936.4 19,947,795.8 15,461,969.2 64,073,904.4 17,238,897.4 16,161,504.5 68,958,046.7 18,542,353.7 15,058,391.9 82,850,001.6 404,256,049.9
Domestic dividend and interest 3,081,626.0 70,137.8 4,172,065.9 846,586.3 3,170,748.3 4,266,725.4 834,086.6 1,646,346.5 2,807,443.0 1,302,314.4 1,121,750.1 1,560,678.1 24,880,508.3
Tobacco Levy
301,483.9 1,839,560.2 3,182,836.3 2,998,115.1 963,848.6 442,564.4 106,786.3 18,503.6 - 21,544.0
9,875,242.3
Royalties 6,259,119.5 26,001,779.8 10,853,017.3 13,457,817.9 9,828,109.7 14,708,976.8 8,020,432.3 9,584,567.7 7,364,712.8 9,978,943.6 10,276,884.5 8,044,184.4 134,378,546.4
Other income taxes 868,115.5 1,336,827.8 1,901,535.9 1,670,225.1 1,582,106.1 2,557,632.0 1,489,395.9 1,369,342.0 1,058,162.9 2,549,615.2 2,157,252.1 2,117,524.4 20,657,734.8
Vehicle Carbon Tax 2,770,050.7 2,701,340.0 3,105,384.0 3,201,950.8 2,905,077.6 3,030,497.5 3,515,100.1 3,204,522.9 2,925,533.1 3,437,676.7 2,890,939.3 3,632,003.4 37,320,076.1
TAX ON GOODS & SERVICES
-
Customs duties 24,376,463.1 27,200,299.4 37,638,021.8 28,494,165.5 31,386,994.
4 30,390,589.5 32,501,640.3 29,260,598.7 29,755,654.6 29,355,775.2 30,507,829.6 30,413,742.1 361,281,774.2
Oil products - -
-
16,921,092.0 -
16,921,092.0
Other(Prime &Surtax) 24,376,463.1 27,200,299.4 37,638,021.8 28,494,165.5 31,386,994.4 30,390,589.5 32,501,640.3 29,260,598.7 12,834,562.6 29,355,775.2 30,507,829.6 30,413,742.1 344,360,682.2

39
ZIMBABWE BUDGET CUMULATIVE DATA: 2013
ACTUALS (US$)
CUM ACTUAL to DEC 2013
Jan-13 Feb-13 Mar-13 Apr-13 May-13 Jun-13 Jul-13 Aug-13 Sep-13 Oct-13 Nov-13 Dec-13 Dec-13
Excise duties 30,599,735.4 34,752,231.0 46,464,443.7 43,547,125.0 44,355,672.
1 42,730,501.0 42,657,329.5 43,286,287.0 43,961,230.1 49,184,876.2 41,245,760.0 47,666,157.0 510,451,347.9
Beer 10,117,668.1 8,218,369.5 13,994,398.2 7,623,017.1 8,717,830.9 7,690,496.0 5,966,440.8 6,948,343.2 7,553,206.9 8,087,089.0 7,120,225.5 7,419,722.2 99,456,807.5
Wines and Spirits 1,071,508.1 702,577.9 979,185.7 1,044,745.4 907,314.5 1,143,097.0 1,002,702.9 1,042,122.8 3,254,932.5 1,126,722.2 1,206,271.8 1,233,878.2 14,715,059.1
Tobacco 2,517,539.5 1,624,680.0 2,099,032.9 1,554,623.4 2,619,125.7 2,554,029.3 1,649,341.2 1,606,590.0 1,171,808.8 1,686,660.0 2,169,968.5 2,338,300.0 23,591,699.3
Second Hand Motors Vehicles 387,671.0 556,073.0 453,879.3 425,738.0 614,637.2 851,552.1 640,878.6 489,629.5 558,684.5 661,054.0 580,272.5 497,027.9 6,717,097.5
Fuels 16,505,348.6 23,650,530.6 28,937,947.5 32,899,001.1 31,490,944.3 30,491,326.6 33,387,231.1 33,198,482.8 31,421,117.7 37,620,838.1 30,165,604.1 36,173,425.9 365,941,798.4
Electric lamp
5,819.6
10,734.9 1,118.7 1,479.8 2,512.9 3,417.5 3,802.9 28,886.2
Value Added Tax (VAT) 97,041,720.4 96,604,456.4 75,668,628.2 78,167,686.0 89,914,536.
5 87,035,265.9 88,483,199.0 99,329,600.6 96,182,635.4 83,933,550.1 86,479,912.3 89,265,108.2 1,068,106,299.2
VAT on Domestic Goods 67,872,356.4 68,682,535.2 46,395,926.2 50,094,733.3 60,406,379.9 60,637,134.7 56,074,363.6 72,079,192.4 57,167,899.0 58,605,666.7 54,405,362.7 56,702,762.6 709,124,312.5
Imported Goods & Services 37,572,399.9 39,220,806.1 46,878,179.3 38,396,550.4 42,376,336.1 39,358,182.2 43,008,755.0 40,562,705.1 45,746,663.4 43,008,874.3 45,034,600.6 42,038,794.7 503,202,846.9
Refunds (8,403,035.8) (11,298,884.8) (17,605,477.3) (10,323,597.6) (12,868,179.4
) (12,960,051.0) (10,599,919.5) (13,312,297.0) (6,731,926.9) (17,680,990.9) (12,960,051.0) (9,476,449.1) (144,220,860.3)
Other indirect taxes 1,114,159.4 2,536,273.6 4,581,872.8 6,517,614.2 5,795,602.1 12,202,382.0 10,584,691.9 8,298,091.8 9,453,339.0 7,227,204.5 5,779,848.3 24,403,278.8 98,494,358.2
-
Non-tax Revenue 9,211,060.0 10,640,302.4 14,048,418.6 19,051,326.3 94,787,240.
2 32,513,570.6 56,091,423.8 33,391,954.7 14,689,359.5 15,141,660.2 11,493,029.1 15,925,710.2 326,985,055.6
-
Revenue from Investments & Property 562,896.4 563,756.2 1,382,442.6 9,724,324.0 505,289.8 891,200.2 7,635,900.0 4,459,867.5 5,600,926.8 1,777,833.4 410,729.2 7,096,426.0 40,611,592.1
RBZ remittances
-
Govt Property rent, interest and dividends etc. 562,896.4 563,756.2 1,382,442.6 9,724,324.0 505,289.8 891,200.2 7,635,900.0 4,459,867.5 5,600,926.8 1,777,833.4 410,729.2 7,096,426.0 40,611,592.1
Fees: Govt./Dept facilities & services 6,750,729.15 7,629,799.7 10,761,380.8 7,429,429.5 92,642,765.8 22,418,599.7 47,241,051.7 27,883,320.0 7,329,404.5 11,745,510.1 8,054,154.2 7,523,458.6 257,409,603.8
Pension Contribution 69,599.5 227,211.9 44,595.3 71,552.3 97,467.8 7,933,817.0
45,812.7 223,507.8 26,881.8 1,444,118.4 81,369.4 10,265,933.9
Other
-
Gvt sales,licences,fines etc 812,727.7 1,266,884.3 580,966.7 733,669.0 621,011.0 597,577.5 435,207.9 376,195.3 563,348.2 1,033,852.1 401,345.1 598,128.9 8,020,913.7
Judicial Fines 561,437.3 450,349.3 383,753.4 434,212.3 468,161.9 448,880.4 466,119.9 427,718.1 460,956.0 453,122.8 571,115.9 473,136.1 5,598,963.3
Refunds of Miscellaneous Payments from Votes 6,484.99 382,834.2 463,355.9 594,319.3 281,216.8 122,199.7 41,357.8 78,189.8 416,362.8 31,416.7
4,301.8 2,422,039.8
Miscellaneous 398,427.3 94,080.3 412,665.5 37,069.4 27,379.1 50,669.3 208,263.9 49,662.6 23,715.7 17,419.4 31,625.1 22,891.9 1,373,869.4

40
ZIMBABWE BUDGET CUMULATIVE DATA: 2013
ACTUALS (US$)
CUM ACTUAL to DEC 2013
Jan-13 Feb-13 Mar-13 Apr-13 May-13 Jun-13 Jul-13 Aug-13 Sep-13 Oct-13 Nov-13 Dec-13 Dec-13
Banking Levy 30,826.0 10,909.8 4,186.4 8,471.1 125,713.2 32,141.8 42,266.4 48,247.4 46,153.4
125,997.4 474,912.9
-
Retained & Prepaid Revenue(Others) 8,820,230.7 8,156,500.8 10,114,517.1 10,080,469.6 9,750,122.7 10,543,303.7 9,805,995.3 10,377,307.9 11,001,978.1 8,761,070.1 7,218,321.3 10,813,332.5 115,443,149.7
Aids Levy 2,306,222.8 1,679,344.3 3,328,487.3 2,187,008.2 2,238,756.2 3,611,844.5 2,347,037.4 2,702,058.3 4,229,527.6 2,287,633.5 2,017,291.4 4,594,629.6 33,529,841.1
Noczim Levy 5,139,396.4 5,286,291.8 5,462,936.7 6,061,761.4 5,382,832.0 5,510,430.7 5,863,920.2 5,877,763.0 5,415,456.9 6,473,436.6 5,197,509.8 6,214,667.94 67,886,403.3
Toll fees 1,374,611.6 1,190,864.8 1,323,093.1 1,831,699.9 2,128,534.5 1,421,028.4 1,595,037.7 1,797,486.7 1,356,993.6
3,520.0 4,035.0 14,026,905.3
Prepayment Account 7,774,048.7 3,011,832.0 (9,060,372.6) 3,427,176.7 (7,104,161.7) (5,996,319.3) (2,867,141.6) 3,223,919.9 437,479.9 383,161.6 6,904,075.3 (4,356,980.5) (4,223,281.6)
EXPENDITURES ACTUALS (US$)
CUM ACTUAL to DEC
2013
Jan-13 Feb-13 Mar-13 Apr-13 May-13 Jun-13 Jul-13 Aug-13 Sep-13 Oct-13 Nov-13 Dec-13 Dec-13
Total Exp including Retained Grants(ZIMRA,AIDS&NOCZIM) 225,497,981.
8 331,998,622.
6 329,719,995.
6 256,984,255.
7 316,186,584
.5 340,871,273.
2 406,856,857.
9 344,590,146.
5 313,345,821.
2 398,373,304.2 326,147,536.
7 490,245,695.3 4,080,818,075.0
-
Total expenditure and net lending including ZIMRA Grant 225,497,981.
8 324,553,003.
4 322,754,359.
6 248,192,831.
7 307,828,984
.0 333,249,685.
0 397,734,582.
7 336,378,288.
9 302,063,941.
6 388,728,319.7 317,386,466.
6 483,030,894.0 3,987,399,339.0
-
Total expenditure and net lending (Net) 225,497,981.
8 324,553,003.
4 322,754,359.
6 248,192,831.
7 307,828,984
.0 333,249,685.
0 397,734,582.
7 336,378,288.
9 302,063,941.
6 388,728,319.7 317,386,466.
6 483,030,894.0 3,987,399,339.0
-
Current Expenditure 220,352,337.
8 288,088,222.
4 302,276,427.
5 239,521,648.
7 244,803,466
.0 310,765,177.
0 372,264,763.
7 302,142,009.
6 281,884,759.
9 275,737,095.1 296,554,061.
6 385,304,913.0 3,519,694,882.2
-
Goods and services 134,132,091.
0 206,797,040.
0 184,389,362.
0 158,992,982.
0 186,753,029
.0 219,832,212.
0 186,571,214.
0 221,065,774.
5 189,211,925.
0 174,094,042.0 217,215,451.
0 286,124,957.0 2,365,180,079.5
Employment Costs 123,071,218.0 167,980,111.0 156,201,781.0 135,279,161.0 155,703,674.0 154,451,735.0 153,276,674.0 148,427,534.0 147,944,336.0 143,123,588.0 190,861,315.0 249,424,560.0 1,925,745,687.0
Domestic Travel Expenses 501,411.0 757,012.0 11,527,073.0 1,190,152.0 1,008,222.0 664,598.0 1,842,373.0 931,904.0 374,924.0 1,468,737.0 476,900.0 889,649.0 21,632,955.0
Foreign Travel Expenses 3,553,812.0 4,743,852.0 5,077,053.0 3,896,036.0 6,349,391.0 5,142,123.0 1,867,470.0 3,982,015.0 4,024,435.0 3,288,300.0 4,559,517.0 5,684,913.0 52,168,917.0
Communication, Supplies and Services 130,733.0 7,927,341.0 315,104.0 1,427,870.0 3,287,003.0 39,296,689.0 7,462,244.0 29,879,982.5 772,373.0 827,306.0 11,919,456.0
103,246,101.5
Education supplies and Services 1,500.0 4,300.0 4,052.0 18,771.0 50,082.0 640,002.0 24,324.0 - 60,448.0 11,704.0 318,011.0 11,331.0 1,144,525.0

41
ZIMBABWE BUDGET CUMULATIVE DATA: 2013
ACTUALS (US$)
CUM ACTUAL to DEC 2013
Jan-13 Feb-13 Mar-13 Apr-13 May-13 Jun-13 Jul-13 Aug-13 Sep-13 Oct-13 Nov-13 Dec-13 Dec-13
Medical Supplies and services 94,700.0 935,212.0 337,335.0 196,705.0 248,562.0 104,829.0 1,353,211.0 199,087.0 379,506.0 2,526,263.0 331,339.0 406,825.0 7,113,574.0
Office supplies and services 86,085.0 205,198.0 236,773.0 202,099.0 250,367.0 223,044.0 248,171.0 121,739.0 174,495.0 188,129.0 57,018.0 265,141.0 2,258,259.0
Training expenses 136,461.0 277,541.0 68,849.0 169,735.0 248,661.0 185,554.0 311,094.0 100,639.0 144,264.0 203,403.0 71,637.0 165,779.0 2,083,617.0
Rental and other service charges 2,318,587.0 15,920,119.0 3,293,741.0 5,551,287.0 5,198,969.0 5,727,713.0 6,797,729.0 24,233,610.0 19,837,194.0 3,881,474.0 1,422,742.0 11,462,741.0 105,645,906.0
Institutional provisions 590,626.0 1,763,982.0 1,299,337.0 1,585,266.0 2,046,178.0 1,896,898.0 1,979,827.0 1,804,707.0 806,250.0 2,868,553.0 2,732,065.0 2,904,734.0 22,278,423.0
Other 99,442.0 1,189,732.0 474,841.0 673,550.0 1,215,724.0 1,059,650.0 482,053.0 583,058.0 4,795,030.0 254,936.0 264,209.0 1,157,773.0 12,249,998.0
Maintenance of capital works 1,650,197.0 2,248,178.0 1,594,510.0 2,436,765.0 3,869,231.0 2,136,914.0 3,270,668.0 1,570,884.0 1,805,005.0 2,442,642.0 1,525,196.0 7,268,518.0 31,818,708.0
Programmes 1,897,319.0 2,844,462.0 3,958,913.0 6,365,585.0 7,276,965.0 8,302,463.0 7,655,376.0 9,230,615.0 8,093,665.0 13,009,007.0 2,676,046.0 6,482,993.0 77,793,409.0
Interest on debt 536,206.8 264,444.4 8,076,624.5 166,666.7 787,437.0 1,817,617.0 98,412.7 78,730.2 8,517,379.9 362,888.1 224,383.6 2,201,220.0 23,132,010.7
Foreign
7,835,513.3
649,659.0 437,993.0
7,046,827.9 324,792.1
602,343.6 16,897,128.9
Domestic 536,206.8 264,444.4 241,111.1 166,666.7 137,778.0 1,379,624.0 98,412.7 78,730.2 1,470,552.0 38,096.0 224,383.6 1,598,876.4 6,234,881.8
Current transfers 85,684,040.0 81,026,738.0 109,810,441.
0 80,362,000.0 57,263,000.
0 89,115,348.0 185,595,137.
0 80,997,505.0 84,155,455.0 101,280,165.0 79,114,227.0 96,978,736.0 1,131,382,792.0
Pensions 34,853,900.0 37,304,000.0 33,729,300.0 33,691,000.0 34,885,000.0 34,900,000.0 34,900,000.0 34,900,000.0 34,311,000.0 34,776,000.0 34,985,000.0 34,900,000.0 418,135,200.0
Other grants and transfers 50,830,140.0 43,722,738.0 76,081,141.0 46,671,000.0 22,378,000.0 54,215,348.0 150,695,137.0 46,097,505.0 49,844,455.0 66,504,165.0 44,129,227.0 62,078,736.0 713,247,592.0
Capital expenditure 5,145,644.0 36,064,781.0 7,878,800.0 10,831,183.0 38,411,274.
0 21,984,508.0 22,399,819.0 31,183,904.0 13,724,908.0 101,872,557.0 20,332,405.0 86,225,981.0 396,055,764.0
Breeding stock
-
-
-
Furniture and Equipment
4,400.0 564,697.0 205,059.0 837,337.0 4,964,789.0 195,419.0 238,209.0 1,933,935.0 1,413,821.0 388,501.0 72,173,557.0 82,919,724.0
Vehicles, Plant and Mobile equipment
485,000.0
- 41,350.0 148,050.0
37,795.0 - 721,513.0 - 4,500.0 1,438,208.0
Acquisition of buildings 1,850,644.0 5,449,877.0 481,803.0 503,085.0 8,463,151.0 2,932,958.0 3,316,790.0 2,648,900.0 2,975,129.0 9,826,654.0 2,454,904.0 2,115,145.0 43,019,040.0
Intangible assets
500,000.0
668,344.0 35,447.0
880,000.0 105,000.0 1,000,000.0 - 700,000.0 3,888,791.0
Feasibility studies
100.0
12,361.0 42,799.0 15,725.0 -
37,334.0
108,319.0
Capital transfers 3,295,000.0 29,625,404.0 2,368,300.0 10,123,039.0 28,388,731.0 11,348,465.0 18,871,885.0 27,379,000.0 8,710,844.0 88,325,235.0 17,489,000.0 11,232,779.0 257,157,682.0
Equity participation
4,464,000.0
2,512,000.0
- 548,000.0
7,524,000.0
Repayments
-
Net Lending - 400,000.0 12,599,132.2 (2,160,000.0
) 24,614,244.
0 500,000.0 3,070,000.0 3,052,375.3 6,454,273.8 11,118,667.6 500,000.0 11,500,000.0 71,648,692.9

42
ZIMBABWE BUDGET CUMULATIVE DATA: 2013
ACTUALS (US$)
CUM ACTUAL to DEC 2013
Jan-13 Feb-13 Mar-13 Apr-13 May-13 Jun-13 Jul-13 Aug-13 Sep-13 Oct-13 Nov-13 Dec-13 Dec-13
Long-term loans (net) - 400,000.0 12,599,132.2 (2,160,000.0
) 24,614,244.
0 500,000.0 3,070,000.0 3,052,375.3 6,454,273.8 11,118,667.6 500,000.0 11,500,000.0 71,648,692.9
Loan and debt
400,000.0 12,599,132.2
24,614,244.0 500,000.0 3,070,000.0 3,052,375.3 6,454,273.8 11,118,667.6 500,000.0 11,500,000.0 73,808,692.9
Recoveries
(2,160,000.0)
(2,160,000.0)
Investments -
-
Short-term loans (net) - - - -
-
Lending
-
Other Grants - 7,445,619.1 6,965,636.0 8,791,424.0 8,357,600.5 7,621,588.2 9,122,275.2 8,211,857.6 11,281,879.5 9,644,984.5 8,761,070.1 7,214,801.3 93,418,736.0
Noczim Grant
5,139,396.4 5,286,291.8 5,462,936.7 6,170,592.3 5,382,832.0 5,510,430.7 5,863,920.2 8,579,821.2 5,415,456.9 6,473,436.6 5,197,509.8 64,482,624.5
Aids Grant
2,306,222.8 1,679,344.3 3,328,487.3 2,187,008.2 2,238,756.2 3,611,844.5 2,347,937.4 2,702,058.3 4,229,527.6 2,287,633.5 2,017,291.4 28,936,111.5
FINANCING (20,000,000.
0) (15,150,000.
0) (2,414,381.7
) (5,150,000.0
) 39,135,714.
0 (21,783,390.
1) 41,135,714.0 (5,864,286.0
) 59,106,008.0 (20,084,508.8
) 47,350,000.0 36,322,770.7 132,603,640.1
-
Foreign Financing (net) (150,000.0) (150,000.0) (22,414,381.
7) 4,850,000.0 (150,000.0) (16,069,104.
1) (150,000.0) (150,000.0) (23,751,134.
0) (792,236.0) (150,000.0) 78,926,347.0 19,849,491.1
Borrowings-SDR
5,000,000.0
5,000,000.0
Loan(Medical Equipment)
83,406,336.0 83,406,336.0
Repayments (150,000.0) (150,000.0) (22,414,381.7) (150,000.0) (150,000.0) (16,069,104.1) (150,000.0) (150,000.0) (23,751,134.0) (792,236.0) (150,000.0) (4,479,989.0) (68,556,844.9)
-
Total Domestic Financing (19,850,000.
0) (15,000,000.
0) 20,000,000.0 (10,000,000.
0) 39,285,714.
0 (5,714,286.0
) 41,285,714.0 (5,714,286.0
) 82,857,142.0 (19,292,272.8
) 47,500,000.0 (42,603,576.3
) 112,754,148.9
Treasury Bills
40,000,000.0
45,000,000.0
37,000,000.0
47,500,000.0
169,500,000.0
Loans
100,000,000.0
100,000,000.0
Repayments (19,850,000.0) (15,000,000.0) (20,000,000.0) (10,000,000.0) (5,714,286.0) (5,714,286.0) (5,714,286.0) (5,714,286.0
) (17,142,858.0) (19,292,272.8)
(42,603,576.3) (166,745,851.1)
SDF
10,000,000.0
10,000,000.0
DEFICIT
-
Surplus (Deficit) excluding grants 29,004,382.9 (55,084,688.
0) (8,754,719.7
) 22,845,094.2 55,759,181.
8 21,156,965.6 (74,701,590.
2) (16,838,397.
7) 51,366,412.7 (110,573,655.
2) (58,283,346.
8) (102,253,558.
4) (246,357,918.8)
-

43
ZIMBABWE BUDGET CUMULATIVE DATA: 2013
ACTUALS (US$)
CUM ACTUAL to DEC 2013
Jan-13 Feb-13 Mar-13 Apr-13 May-13 Jun-13 Jul-13 Aug-13 Sep-13 Oct-13 Nov-13 Dec-13 Dec-13
Surplus (Deficit) including grants 37,824,613.6 (54,373,806.
4) (5,605,838.6
) 24,134,139.8 57,151,704.
0 24,078,681.1 (74,017,870.
2) (14,672,947.
4) 51,086,511.2 (111,457,569.
6) (59,826,095.
6) (98,655,027.1
) (224,333,505.2)
-
TOTAL FINANCING 9,004,382.9 (70,234,688.
0) (11,169,101.
4) 17,695,094.2 94,894,895.
8 (626,424.5) (33,565,876.
2) (22,702,683.
7) 110,472,420.
7 (130,658,164.
0) (10,933,346.
8) (65,930,787.6
) (113,754,278.8)
BREAKDOWN OF DOMESTIC FINANCING
-
-
Non-bank Domestic Financing (net) 9,004,382.9 (70,234,688.
0) (11,169,101.
4) 17,695,094.2 94,894,895.
8 (626,424.5) (33,565,876.
2) (22,702,683.
7) 110,472,420.
7 (130,658,164.
0) (10,933,346.
8) (65,930,787.6
) (113,754,278.8)
Surplus
-
Tax Reserve Certificates/Prepayments 7,774,048.7 3,011,832.0 (9,060,372.6) 3,427,176.7 (7,104,161.7) (5,996,319.3) (2,867,141.6) 3,223,919.9 437,479.9 383,161.6 6,904,075.3 (4,356,980.5) (4,223,281.6)
Opening bank balances 176,418,398.
4 168,163,641.
8 129,930,538.
2 142,087,259.
9 107,282,555
.6 100,852,822.
5 132,421,751.
8 74,688,639.2 77,851,196.2 140,271,307.1 72,965,373.4 50,036,623.0 1,372,970,107.0
Payments in transit (25,033,188.1) 28,989,752.4 32,386,195.6 (55,926,975.2) (94,220,467.3
) 38,191,673.1 (21,300,094.8) 22,641,320.9 (48,489,789.6) 62,969,068.7 (18,899,478.9) 39,108,290.8 (39,583,692.4)
Closing bank balances 168,163,641.8 129,930,538.2 142,087,259.9 107,282,555.6 100,852,822.5 132,421,751.8 74,688,639.2 77,851,196.2 140,271,307.1 72,965,373.4 50,036,623.0 19,357,145.7
Source: Ministry of Finance and Economic Development