
2012 Q1 Report
15
QUARTERLY ECONOMIC UPDATE | Q1 2012
-
Upload
columbus-2020 -
Category
Career
-
view
578 -
download
1
description
Our Q1 report, with statistics on new business attraction and expansion, employment rates, industry growth, and much more.
Transcript of 2012 Q1 Report

QUARTERLY ECONOMIC UPDATE | Q1 2012
Th
e
TOTAL PAYROLL EMPLOYMENT
Source: Current Employment Statistics, U.S. Bureau of Labor Statistics. Source: Local Area Unemployment Statistics, Bureau of Labor Stats.
Seasonal adjustment of MSA employment by Regionomics LLC. Seasonal adjustment of regional rate by Regionomics LLC.
COLUMBUS REGION LABOR FORCE
Source: Local Area Unemployment Statistics, Bureau of Labor Stats.
Seasonal adjustment of regional rate by Regionomics LLC.
1
COLUMBUS REGION UNEMPLOYMENT
RATE
QUARTERLY ECONOMIC UPDATE | Q1 2012
EMPLOYMENT, LABOR FORCE, UNEMPLOYMENT RATES
88.0
90.0
92.0
94.0
96.0
98.0
100.0
102.0
1/0
8
4/0
8
7/0
8
10/0
8
1/0
9
4/0
9
7/0
9
10/0
9
1/10
4/1
0
7/1
0
10/1
0
1/11
4/1
1
7/1
1
10/1
1
1/12
Ind
ex: 1/
08
= 1
00
.0
Columbus MSA Ohio US
920
970
1,020
1,070
1,120
1/0
8
4/0
8
7/0
8
10/0
8
1/0
9
4/0
9
7/0
9
10/0
9
1/10
4/1
0
7/1
0
10/1
0
1/11
4/11
7/1
1
10/1
1
1/12
Th
ou
san
ds
Labor force
Labor force, normal growth
Resident employment
0%
2%
4%
6%
8%
10%
12%
1/0
8
4/0
8
7/0
8
10/0
8
1/0
9
4/0
9
7/0
9
10/0
9
1/10
4/1
0
7/1
0
10/1
0
1/11
4/1
1
7/1
1
10/1
1
1/12
Columbus Region Ohio U.S.
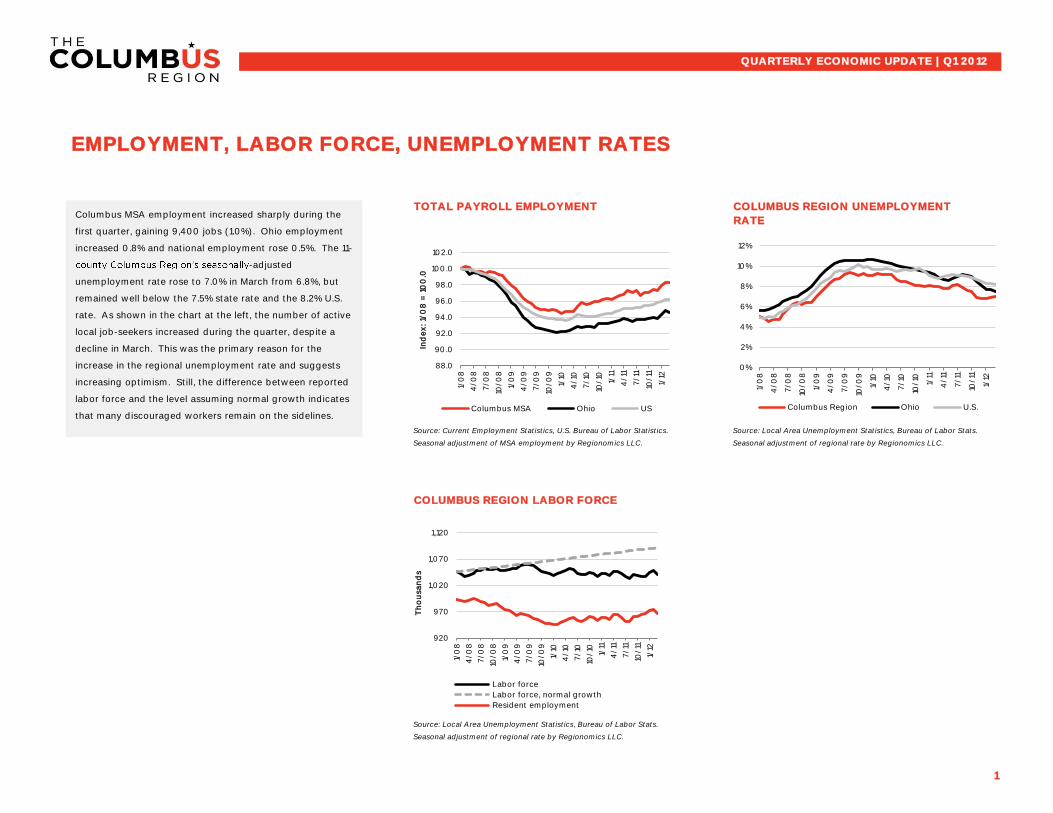
Columbus MSA employment increased sharply during the
first quarter, gaining 9,400 jobs (1.0%). Ohio employment
increased 0.8% and national employment rose 0.5%. The 11-
-adjusted
unemployment rate rose to 7.0% in March from 6.8%, but
remained well below the 7.5% state rate and the 8.2% U.S.
rate. As shown in the chart at the left, the number of active
local job-seekers increased during the quarter, despite a
decline in March. This was the primary reason for the
increase in the regional unemployment rate and suggests
increasing optimism. Still, the difference between reported
labor force and the level assuming normal growth indicates
that many discouraged workers remain on the sidelines.

MANUFACTURING
PROFESSIONAL & BUSINESS SERVICES FINANCE & INSURANCE
Source: Current Employment Statistics, U.S. Bureau of Labor Statistics.
Seasonal adjustment of MSA employment by Regionomics LLC.
2
TRANSPORTATION, WAREHOUSING &
WHOLESALE
QUARTERLY ECONOMIC UPDATE | Q1 2012
EMPLOYMENT BY INDUSTRY
The charts on this and the next page highlight employment
Distribution industries (including transportation,
warehousing, and wholesale trade) added 1,000 jobs (1.3%)
during the first quarter versus statewide growth of 1.9% and
0.6% nationwide. Manufacturing lost 3,300 jobs (5.0%)
while Ohio employment increased 1.3% and U.S.
employment rose 1.0%. The weakness in local
manufacturing employment growth seems to be due to
improving efficiency rather than weakness in the sector
itself. However, Columbus Region manufacturers are likely
to reach the limit of their productivity growth and will need
to increase employment, as their counterparts have
elsewhere. Business service employment increased 2,300
(1.6%), better than the statewide gain of 0.5% and the U.S.
gain of 1.1%. Finance and insurance lost 400 jobs (0.6%),
compared to gains of 0.5% in Ohio and 0.2% nationwide.
70.0
75.0
80.0
85.0
90.0
95.0
100.0
105.0
110.0
1/0
8
4/0
8
7/0
8
10/0
8
1/0
9
4/0
9
7/0
9
10/0
9
1/10
4/1
0
7/1
0
10/1
0
1/11
4/1
1
7/1
1
10/1
1
1/12
Ind
ex: 1/
08
= 1
00
.0
Columbus MSA Ohio US
70.0
75.0
80.0
85.0
90.0
95.0
100.0
105.0
110.0
1/0
8
4/0
8
7/0
8
10/0
8
1/0
9
4/0
9
7/0
9
10/0
9
1/10
4/1
0
7/1
0
10/1
0
1/11
4/1
1
7/1
1
10/1
1
1/12
Ind
ex: 1/
08
= 1
00
.0
Columbus MSA Ohio US
70.0
75.0
80.0
85.0
90.0
95.0
100.0
105.0
110.0
1/0
8
4/0
8
7/0
8
10/0
8
1/0
9
4/0
9
7/0
9
10/0
9
1/10
4/1
0
7/1
0
10/1
0
1/11
4/1
1
7/1
1
10/11
1/12
Ind
ex: 1/
08
= 1
00
.0
Columbus MSA Ohio US
70.0
75.0
80.0
85.0
90.0
95.0
100.0
105.0
110.0
1/0
8
4/0
8
7/0
8
10/0
8
1/0
9
4/0
9
7/0
9
10/0
9
1/10
4/1
0
7/1
0
10/1
0
1/11
4/1
1
7/1
1
10/11
1/12
Ind
ex: 1/
08
= 1
00
.0
Columbus MSA Ohio US

LEISURE & HOSPITALITY
GOVERNMENT RETAIL
Source: Current Employment Statistics, U.S. Bureau of Labor Statistics.
Seasonal adjustment of MSA employment by Regionomics LLC.
3
HEALTHCARE & SOCIAL ASSISTANCE
QUARTERLY ECONOMIC UPDATE | Q1 2012
EMPLOYMENT BY INDUSTRY (continued)
Columbus MSA healthcare employment enjoyed
particularly strong growth, gaining 2,700 jobs (2.4%) versus
Ohio and U.S growth of 1.4% and 0.7%, respectively. While
it is possible that the Bureau of Labor Statistics may revise
these estimates downward later , the latest increase in
healthcare employment is part of a longer-term trend.
Leisure and hospitality lost 500 jobs (0.5%), compared to
statewide growth of 0.1% and U.S. growth of 0.9%.
Government employment was essentially unchanged in the
Columbus MSA after a sustained decline in 2011.
Nationwide government employment was also unchanged
but the sector gained 0.2% in Ohio. Columbus MSA retail
added a massive 3,400 jobs (3.5%) while Ohio gained 1.6%
and the U.S. lost 0.3%. The $28.4 billion in taxable sales in
the Region during 2011 represented an after-inflation
increase of 2.8% from the 2010 level.
85.0
90.0
95.0
100.0
105.0
110.0
115.0
120.0
125.0
1/0
8
4/0
8
7/0
8
10/0
8
1/0
9
4/0
9
7/0
9
10/0
9
1/10
4/1
0
7/1
0
10/1
0
1/11
4/1
1
7/1
1
10/1
1
1/12
Ind
ex: 1/
08
= 1
00
.0
Columbus MSA Ohio US
70.0
75.0
80.0
85.0
90.0
95.0
100.0
105.0
110.0
1/0
8
4/0
8
7/0
8
10/0
8
1/0
9
4/0
9
7/0
9
10/0
9
1/10
4/1
0
7/1
0
10/10
1/11
4/1
1
7/1
1
10/1
1
1/12
Ind
ex: 1/
08
= 1
00
.0
Columbus MSA Ohio US
70.0
75.0
80.0
85.0
90.0
95.0
100.0
105.0
110.0
1/0
8
4/0
8
7/0
8
10/0
8
1/0
9
4/0
9
7/0
9
10/0
9
1/10
4/1
0
7/1
0
10/10
1/11
4/1
1
7/1
1
10/1
1
1/12
Ind
ex: 1/
08
= 1
00
.0
Columbus MSA Ohio US
70.0
75.0
80.0
85.0
90.0
95.0
100.0
105.0
110.0
1/0
8
4/0
8
7/0
8
10/0
8
1/0
9
4/0
9
7/0
9
10/0
9
1/10
4/10
7/1
0
10/10
1/11
4/1
1
7/11
10/1
1
1/12
Ind
ex: 1/
08
= 1
00
.0
Columbus MSA Ohio US
CONSTRUCTION
MANUFACTURING WHOLESALE TRADE
Source: Current Employment Statistics, U.S. Bureau of Labor Statistics. Source: Current Employment Statistics, U.S. Bureau of Labor Statistics.
Seasonal adjustment of MSA employment by Regionomics LLC.
4
QUARTERLY ECONOMIC UPDATE | Q1 2012
CURRENT EMPLOYMENT STATISTICS REVISIONS
TOTAL PAYROLL EMPLOYMENT
TOTAL SEASONALLY ADJUSTED PAYROLL
EMPLOYMENT, MONTHLY
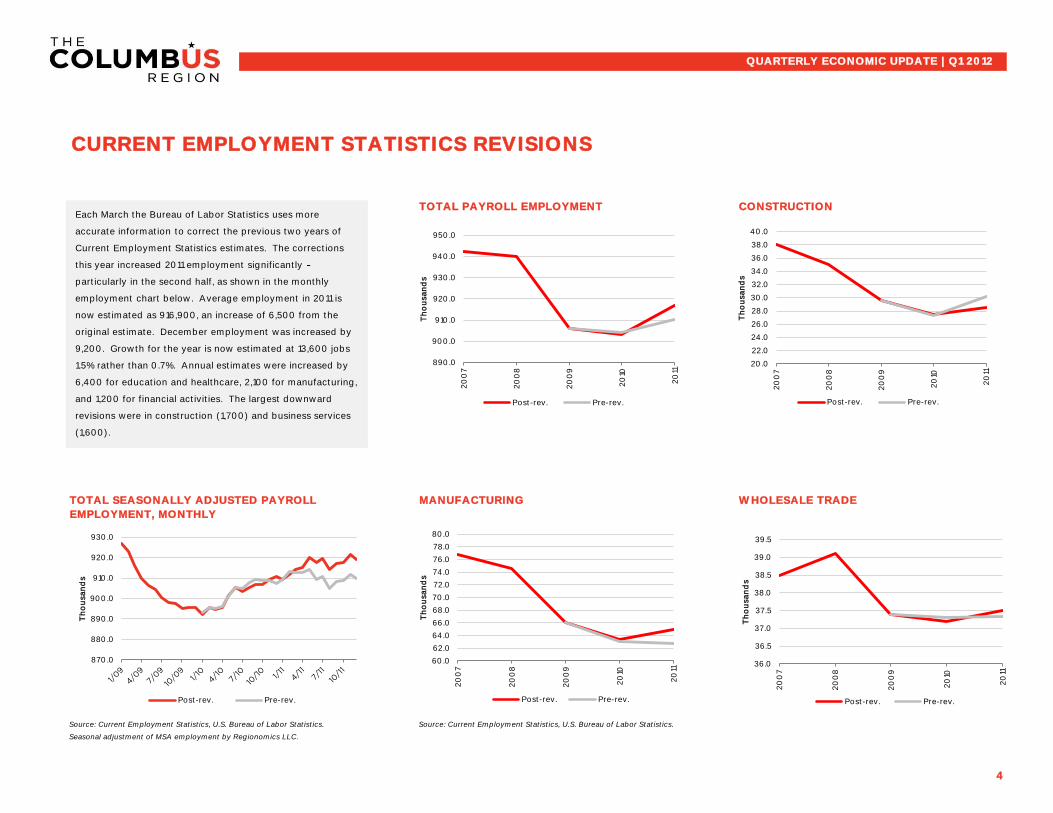
Each March the Bureau of Labor Statistics uses more
accurate information to correct the previous two years of
Current Employment Statistics estimates. The corrections
this year increased 2011 employment significantly
particularly in the second half, as shown in the monthly
employment chart below. Average employment in 2011 is
now estimated as 916,900, an increase of 6,500 from the
original estimate. December employment was increased by
9,200. Growth for the year is now estimated at 13,600 jobs
1.5% rather than 0.7%. Annual estimates were increased by
6,400 for education and healthcare, 2,100 for manufacturing,
and 1,200 for financial activities. The largest downward
revisions were in construction (1,700) and business services
(1,600).
870.0
880.0
890.0
900.0
910.0
920.0
930.0
Th
ou
san
ds
Post-rev. Pre-rev.
890.0
900.0
910.0
920.0
930.0
940.0
950.0
20
07
20
08
20
09
20
10
20
11
Th
ou
san
ds
Post-rev. Pre-rev.
20.0
22.0
24.0
26.0
28.0
30.0
32.0
34.0
36.0
38.0
40.0
20
07
20
08
20
09
20
10
20
11
Th
ou
san
ds
Post-rev. Pre-rev.
60.0
62.0
64.0
66.0
68.0
70.0
72.0
74.0
76.0
78.0
80.0
20
07
20
08
20
09
20
10
20
11
Th
ou
san
ds
Post-rev. Pre-rev.
36.0
36.5
37.0
37.5
38.0
38.5
39.0
39.5
20
07
20
08
20
09
20
10
20
11
Th
ou
san
ds
Post-rev. Pre-rev.

Source: Current Employment Statistics, U.S. Bureau of Labor Statistics.
5
QUARTERLY ECONOMIC UPDATE | Q1 2012
TRANSPORTATION & WAREHOUSING
CURRENT EMPLOYMENT STATISTICS REVISIONS (continued)
RETAIL TRADE FINANCIAL ACTIVITIES PROFESSIONAL & BUSINESS
SERVICES
EDUCATION & HEALTH SERVICES OTHER SERVICES GOVERNMENTLEISURE & HOSPITALITY
94.0
95.0
96.0
97.0
98.0
99.0
100.0
101.0
102.0
103.0
104.0
20
07
20
08
20
09
20
10
20
11
Th
ou
san
ds
Post-rev. Pre-rev.
40.0
42.0
44.0
46.0
48.0
50.0
52.0
20
07
20
08
20
09
20
10
20
11
Th
ou
san
ds
Post-rev. Pre-rev.
66.0
67.0
68.0
69.0
70.0
71.0
72.0
73.0
74.0
20
07
20
08
20
09
20
10
20
11
Th
ou
san
ds
Post-rev. Pre-rev.
144.0
146.0
148.0
150.0
152.0
154.0
156.0
20
07
20
08
20
09
20
10
20
11
Th
ou
san
ds
Post-rev. Pre-rev.
105.0
110.0
115.0
120.0
125.0
130.0
135.0
20
07
20
08
20
09
20
10
20
11
Th
ou
san
ds
Post-rev. Pre-rev.
84.0
85.0
86.0
87.0
88.0
89.0
90.0
20
07
20
08
20
09
20
10
20
11
Th
ou
san
ds
Post-rev. Pre-rev.
34.0
34.5
35.0
35.5
36.0
36.5
37.0
37.5
38.0
20
07
20
08
20
09
20
10
20
11
Th
ou
san
ds
Post-rev. Pre-rev.
154.0
155.0
156.0
157.0
158.0
159.0
160.0
20
07
20
08
20
09
20
10
20
11
Th
ou
san
ds
Post-rev. Pre-rev.
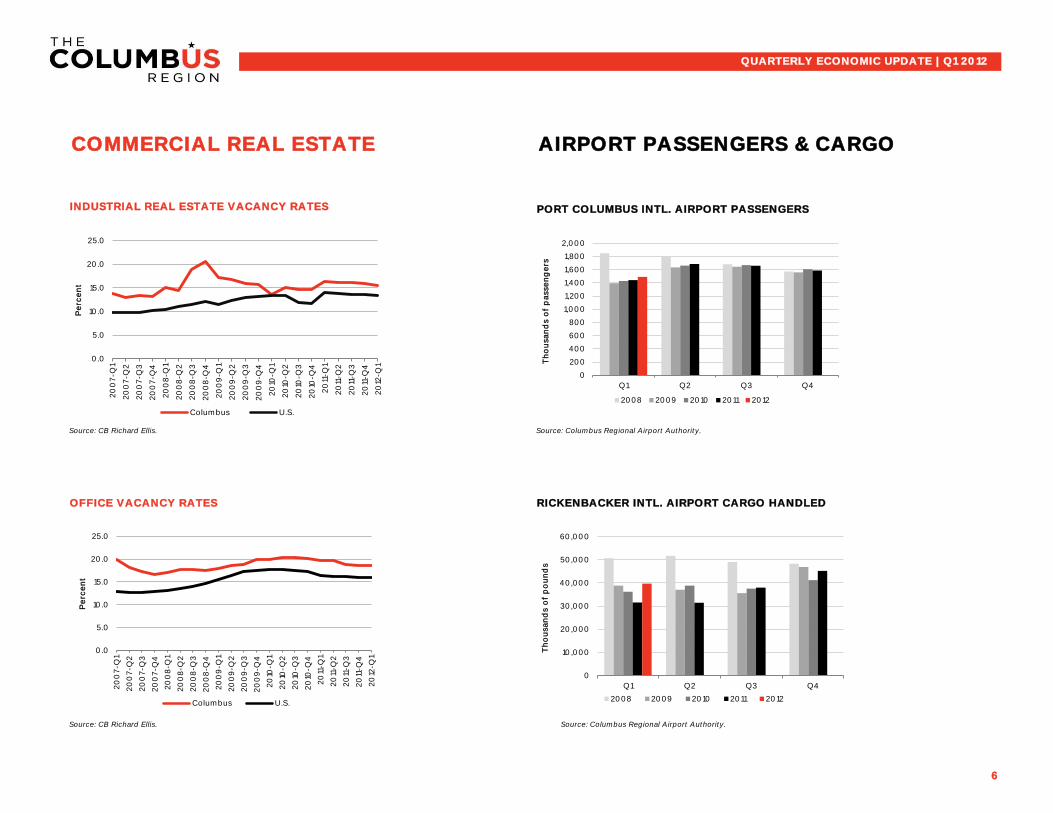
INDUSTRIAL REAL ESTATE VACANCY RATES PORT COLUMBUS INTL. AIRPORT PASSENGERS
Source: CB Richard Ellis. Source: Columbus Regional Airport Authority.
OFFICE VACANCY RATES RICKENBACKER INTL. AIRPORT CARGO HANDLED
Source: CB Richard Ellis. Source: Columbus Regional Airport Authority.
6
QUARTERLY ECONOMIC UPDATE | Q1 2012
AIRPORT PASSENGERS & CARGOCOMMERCIAL REAL ESTATE
0.0
5.0
10.0
15.0
20.0
25.0
20
07-Q
1
20
07-Q
2
20
07-Q
3
20
07-Q
4
20
08
-Q1
20
08
-Q2
20
08
-Q3
20
08
-Q4
20
09
-Q1
20
09
-Q2
20
09
-Q3
20
09
-Q4
20
10-Q
1
20
10-Q
2
20
10-Q
3
20
10-Q
4
20
11-Q
1
20
11-Q
2
20
11-Q
3
20
11-Q
4
20
12-Q
1
Pe
rce
nt
Columbus U.S.
0.0
5.0
10.0
15.0
20.0
25.0
20
07-Q
1
20
07-Q
2
20
07-Q
3
20
07-Q
4
20
08
-Q1
20
08
-Q2
20
08
-Q3
20
08
-Q4
20
09
-Q1
20
09
-Q2
20
09
-Q3
20
09
-Q4
20
10-Q
1
20
10-Q
2
20
10-Q
3
20
10-Q
4
20
11-Q
1
20
11-Q
2
20
11-Q
3
20
11-Q
4
20
12-Q
1
Pe
rce
nt
Columbus U.S.
0
200
400
600
800
1,000
1,200
1,400
1,600
1,800
2,000
Q1 Q2 Q3 Q4
Th
ou
san
ds o
f p
asse
ng
ers
2008 2009 2010 2011 2012
0
10,000
20,000
30,000
40,000
50,000
60,000
Q1 Q2 Q3 Q4
Th
ou
san
ds o
f p
ou
nd
s
2008 2009 2010 2011 2012

Source: U.S. Census Bureau. Source: Columbus Board of Realtors.
CHANGE IN RESIDENTIAL SALES FROM SAME QUARTER PREVIOUS YEAR
Source: Columbus Board of Realtors, National Association of Realtors.
7
QUARTERLY ECONOMIC UPDATE | Q1 2012
HOUSING
RESIDENTIAL SALES, COLUMBUS MLS
AREA
RESIDENTIAL BUILDING PERMITS,
COLUMBUS MSAA total of 1,301 residential building permits were issued in
the Columbus MSA during the first quarter of 2012, 25.5%
more than were issued during the first quarter of 2011. The
multi-unit category continued to represent an unusually
large share of total activity (58.6%); single-unit permits
were down 10.5% from last year. The corresponding U.S.
changes were a 30.5% increase in total permits and an
18.7% increase in single-unit. Quarterly home sales in the
Columbus Multiple Listing Service area (larger than and
somewhat different from the Region) totaled 3,993, up
9.4% from the first quarter of 2011. Total dollar volume of
sales increased 13.7% to nearly $600 million. Nationally,
home sales during the quarter were up 7.2% from last year,
but were 14.4% higher in the Midwest.
0
200
400
600
800
1,000
1,200
1,400
1,600
1,800
Q1 Q2 Q3 Q4
Nu
mb
ne
r o
f P
erm
its
2008 2009 2010 2011 2012
0
1,600
3,200
4,800
6,400
8,000
Q1 Q2 Q3 Q4
Nu
mb
ne
r o
f S
ale
s
2008 2009 2010 2011 2012
-30%
-20%
-10%
0%
10%
20%
30%
40%
20
08
-Q1
20
08
-Q2
20
08
-Q3
20
08
-Q4
20
09
-Q1
20
09
-Q2
20
09
-Q3
20
09
-Q4
20
10-Q
1
20
10-Q
2
20
10-Q
3
20
10-Q
4
20
11-Q
1
20
11-Q
2
20
11-Q
3
20
11-Q
4
20
12-Q
1
Pe
rce
nt
Ch
an
ge
Columbus MLS
U.S.
MSA HOUSE PRICE CHANGE, 2ND QUARTER 2007 TO 4TH QUARTER 2011
Source: Federal Housing Finance Agency House Price Index.
Source: Federal Housing Finance Agency House Price Index.
8
QUARTERLY ECONOMIC UPDATE | Q1 2012
HOUSING (continued)
FHFA HOUSE PRICE INDEX
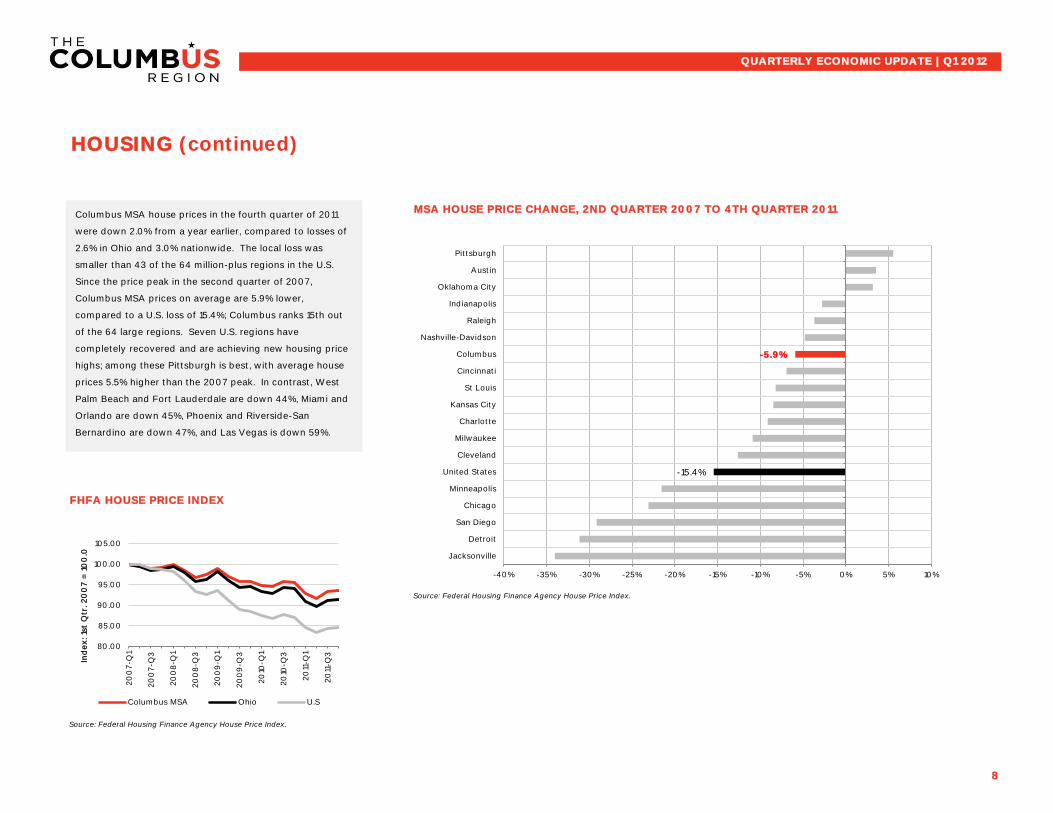
Columbus MSA house prices in the fourth quarter of 2011
were down 2.0% from a year earlier, compared to losses of
2.6% in Ohio and 3.0% nationwide. The local loss was
smaller than 43 of the 64 million-plus regions in the U.S.
Since the price peak in the second quarter of 2007,
Columbus MSA prices on average are 5.9% lower,
compared to a U.S. loss of 15.4%; Columbus ranks 15th out
of the 64 large regions. Seven U.S. regions have
completely recovered and are achieving new housing price
highs; among these Pittsburgh is best, with average house
prices 5.5% higher than the 2007 peak. In contrast, West
Palm Beach and Fort Lauderdale are down 44%, Miami and
Orlando are down 45%, Phoenix and Riverside-San
Bernardino are down 47%, and Las Vegas is down 59%.
-15.4%
-5.9%
-40% -35% -30% -25% -20% -15% -10% -5% 0% 5% 10%
Jacksonville
Detroit
San Diego
Chicago
Minneapolis
United States
Cleveland
Milwaukee
Charlotte
Kansas City
St Louis
Cincinnati
Columbus
Nashville-Davidson
Raleigh
Indianapolis
Oklahoma City
Austin
Pittsburgh
80.00
85.00
90.00
95.00
100.00
105.00
20
07
-Q1
20
07-Q
3
20
08
-Q1
20
08
-Q3
20
09
-Q1
20
09
-Q3
20
10-Q
1
20
10-Q
3
20
11-Q
1
20
11-Q
3
Ind
ex: 1s
t Q
tr. 2
00
7 =
10
0.0
Columbus MSA Ohio U.S

HISTORIC AND FORECAST U.S. GDP; HISTORIC PERSONAL CONSUMPTION
Source: U.S. Bureau of Economic Analysis, Wall Street Journal Economic Forecasting Survey.
CPI INFLATION, LARGE MIDWEST CITIES
Source: Consumer Price Index (CPI-U), U.S Bureau of Labor Statistics
9
QUARTERLY ECONOMIC UPDATE | Q1 2012
GDP AND INFLATION
U.S. Gross Domestic Product (GDP) increased at an annual
rate of 2.2% in the first quarter, less than the previous
was equal to the expectation of economists in the Wall
Street Journal forecasting survey, although less than
forecast in the Bloomberg survey. One positive sign was
the strongest growth in personal consumption in more than
a year (an annual rate of 2.9%) as consumer confidence
continued to improve from its lows of last summer.
Business investment growth slowed, however. The April
Wall Street Journal survey expected GDP growth to rise to
2.7% by the fourth quarter. Economists in the survey put
the risk of a recession at less than 20% the lowest level in
months although they remain concerned about oil prices
and the European economy.
-3%
-2%
-1%
0%
1%
2%
3%
4%
5%
6%
20
07-1
20
07-2
20
07-3
20
07-4
20
08
-1
20
08
-2
20
08
-3
20
08
-4
20
09
-1
20
09
-2
20
09
-3
20
09
-4
20
10-1
20
10-2
20
10-3
20
10-4
20
11-1
20
11-2
20
11-3
20
11-4
20
12-1
An
nu
alize
d C
han
ge
(P
erc
en
t)
All items
Excl.Food &Energy (core)
-10%
-8%
-6%
-4%
-2%
0%
2%
4%
6%
20
07-1
20
07-2
20
07-3
20
07-4
20
08
-1
20
08
-2
20
08
-3
20
08
-4
20
09
-1
20
09
-2
20
09
-3
20
09
-4
20
10-1
20
10-2
20
10-3
20
10-4
20
11-1
20
11-2
20
11-3
20
11-4
20
12-1
20
12-2
20
12-3
20
12-4
An
nu
alize
d C
han
ge
(P
erc
en
t)
GDP
Personal Cons.Exp.

PROJECTS ACTIVE AT END OF EACH MONTH
10
NUMBER OF PROJECTS (2012 v. 2011) FIRST-TIME VISITS (2012 v. 2011)
PROJECTS ACTIVE AT END OF EACH MONTH
BY INDUSTRY
QUARTERLY ECONOMIC UPDATE | Q1 2012
COLUMBUS 2020 PERFORMANCE | PROJECTS JAN-APR 2012
As of April 2012, Columbus 2020 had 78 projects started
year to date, more than 40 percent higher than the 2011
pace. There were also 30 first-time visits to the Columbus
Region by companies year to date through April, more than
double the 2011 pace.
9 11
17 18
11 12
9 9
16
19
13
10
27
12
25
14
0
5
10
15
20
25
30
Jan Feb Mar Apr May Jun Jul Aug Sep Oct Nov Dec
2011 2012
0
7
4
2 2
9 8
3 2
4
8
2
12
6 7
5
0
3
6
9
12
15
Jan Feb Mar Apr May Jun Jul Aug Sep Oct Nov Dec
2011 2012
The composition of projects in the pipeline has changed in
2012 compared to 2011. Existing business projects now
make up 30-40 percent of projects active at any given
time, compared to 10-15 percent in 2011. Establishment of
Columbus 2020's Business Retention and Expansion team
has been a major factor. Industry composition has also
shifted. Office projects represent a greater share now: up
from 11 percent in July 2011 to 34 percent in April 2012. The
number of manufacturing projects has remained steady,
but the percent share fell from 59 to 41 percent.
8 7 6 6 5 7 10 8
17
44 34 34
39
54
61 58
64 61
70 73 65 66
57
66
53 59
0
10
20
30
40
50
60
70
80
Apr2011
May Jun Jul Aug Sep Oct Nov Dec Jan2012
Feb Mar Apr
Existing New
59%
11%
17%
13%
Jul 2011
52%
19%
17%
12%
Oct 2011
49%
19%
17%
15%
Jan 2012
41%
34%
17%
8%
Apr 2012
Manufacturing Office Logistics Tech/R&D
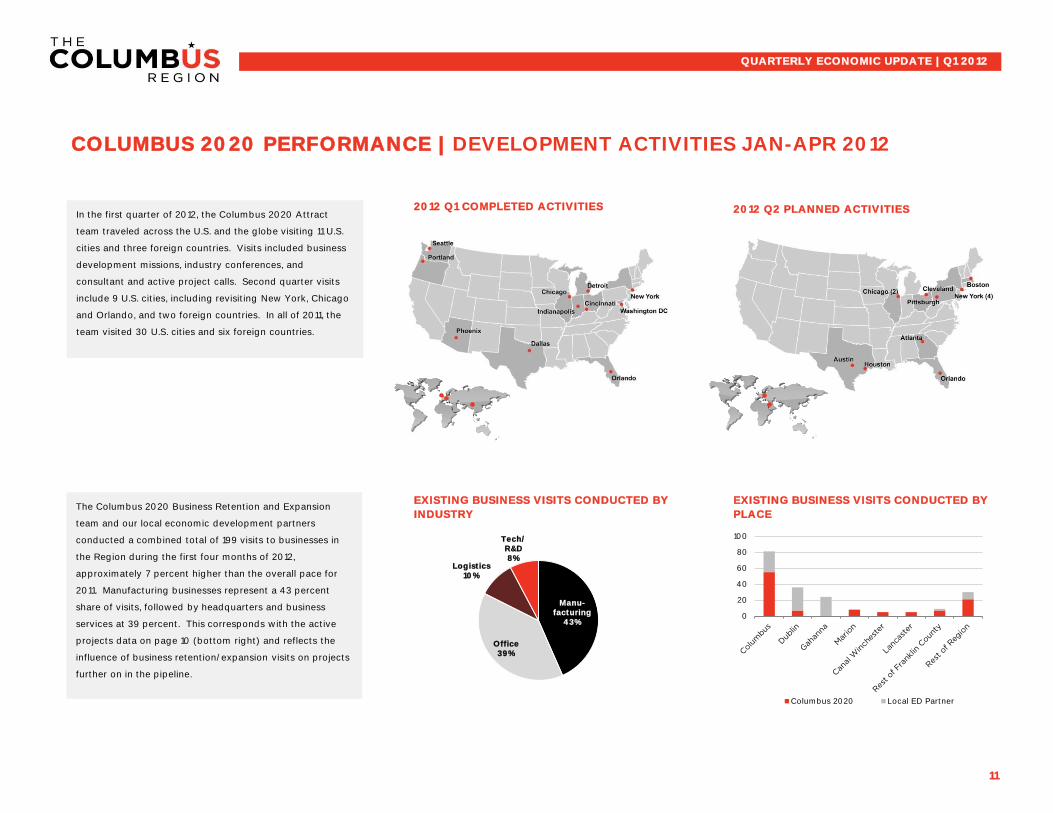
2012 Q2 PLANNED ACTIVITIES
11
COLUMBUS 2020 PERFORMANCE | DEVELOPMENT ACTIVITIES JAN-APR 2012
QUARTERLY ECONOMIC UPDATE | Q1 2012
2012 Q1 COMPLETED ACTIVITIES
EXISTING BUSINESS VISITS CONDUCTED BY
INDUSTRY
EXISTING BUSINESS VISITS CONDUCTED BY
PLACE
In the first quarter of 2012, the Columbus 2020 Attract
team traveled across the U.S. and the globe visiting 11 U.S.
cities and three foreign countries. Visits included business
development missions, industry conferences, and
consultant and active project calls. Second quarter visits
include 9 U.S. cities, including revisiting New York, Chicago
and Orlando, and two foreign countries. In all of 2011, the
team visited 30 U.S. cities and six foreign countries.
The Columbus 2020 Business Retention and Expansion
team and our local economic development partners
conducted a combined total of 199 visits to businesses in
the Region during the first four months of 2012,
approximately 7 percent higher than the overall pace for
2011. Manufacturing businesses represent a 43 percent
share of visits, followed by headquarters and business
services at 39 percent. This corresponds with the active
projects data on page 10 (bottom right) and reflects the
influence of business retention/expansion visits on projects
further on in the pipeline.
Manu- facturing
43%
Office 39%
Logistics 10%
Tech/ R&D 8%
0
20
40
60
80
100
Columbus 2020 Local ED Partner

12
NOTABLE EXPANSIONS & LOCATIONS | JAN-APR 2012
ED PROJECT ANNOUNCEMENTS - JOB
CREATION
ED PROJECT ANNOUNCEMENTS, COUNT
BY MUNICIPALITY
ED PROJECT ANNOUNCEMENTS, COUNT
BY PLACE
QUARTERLY ECONOMIC UPDATE | Q1 2012
ED PROJECT ANNOUNCEMENTS BY
INDUSTRYColumbus 2020 tracks economic development project
announcements in the Columbus Region. Our database contains 47
projects for the first four months of 2012, about the same pace as the
139 projects for all of 2011 . Of the 47 projects, 45% have been in
manufacturing and 27% in headquarters/office functions, roughly
similar to 2011 numbers. Projects year to date in 2012 represent a
combined total of more than 5,000 jobs anticipated to be created or
retained.
44%
25%
12%
19%
2011
45%
27%
13%
15%
Jan-Apr 2012
Manufacturing Office Logistics Tech/R&D
4,132
5,840
7,839
1,083
2,423
1,504
0
2,000
4,000
6,000
8,000
10,000
Attract Expand Retain
2011 Jan-Apr 2012
12
5 5
9
16
0
4
8
12
16
20
Columbus Dublin MountVernon
Rest ofFranklinCounty
Rest ofRegion
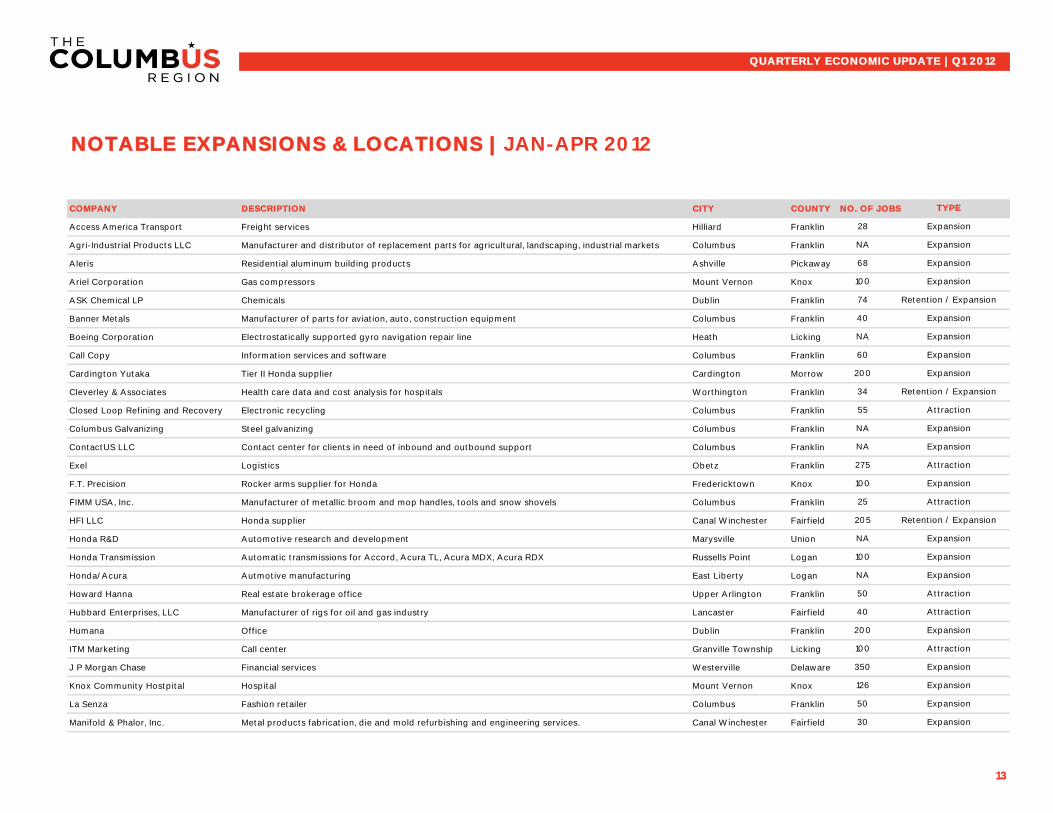
COMPANY DESCRIPTION CITY COUNTY NO. OF JOBS
Access America Transport Freight services Hilliard Franklin
Agri-Industrial Products LLC Manufacturer and distributor of replacement parts for agricultural, landscaping, industrial markets Columbus Franklin
Aleris Residential aluminum building products Ashville Pickaway
Ariel Corporation Gas compressors Mount Vernon Knox
ASK Chemical LP Chemicals Dublin Franklin
Banner Metals Manufacturer of parts for aviation, auto, construction equipment Columbus Franklin
Boeing Corporation Electrostatically supported gyro navigation repair line Heath Licking
Call Copy Information services and software Columbus Franklin
Cardington Yutaka Tier II Honda supplier Cardington Morrow
Cleverley & Associates Health care data and cost analysis for hospitals Worthington Franklin
Closed Loop Refining and Recovery Electronic recycling Columbus Franklin
Columbus Galvanizing Steel galvanizing Columbus Franklin
ContactUS LLC Contact center for clients in need of inbound and outbound support Columbus Franklin
Exel Logistics Obetz Franklin
F.T. Precision Rocker arms supplier for Honda Fredericktown Knox
FIMM USA, Inc. Manufacturer of metallic broom and mop handles, tools and snow shovels Columbus Franklin
HFI LLC Honda supplier Canal Winchester Fairfield
Honda R&D Automotive research and development Marysville Union
Honda Transmission Automatic transmissions for Accord, Acura TL, Acura MDX, Acura RDX Russells Point Logan
Honda/Acura Autmotive manufacturing East Liberty Logan
Howard Hanna Real estate brokerage office Upper Arlington Franklin
Hubbard Enterprises, LLC Manufacturer of rigs for oil and gas industry Lancaster Fairfield
Humana Office Dublin Franklin
ITM Marketing Call center Granville Township Licking
J P Morgan Chase Financial services Westerville Delaware
Knox Community Hostpital Hospital Mount Vernon Knox
La Senza Fashion retailer Columbus Franklin
Manifold & Phalor, Inc. Metal products fabrication, die and mold refurbishing and engineering services. Canal Winchester Fairfield
13
NA Expansion
TYPE
126 Expansion
50 Expansion
30 Expansion
NA Expansion
100 Attraction
100 Expansion
350 Expansion
200 Expansion
100 Expansion
40 Attraction
205 Retention / Expansion
NA Expansion
275 Attraction
NA Expansion
Expansion
55 Attraction
60 Expansion
50 Attraction
25 Attraction
100 Expansion
74 Retention / Expansion
Expansion28
NA Expansion
QUARTERLY ECONOMIC UPDATE | Q1 2012
NOTABLE EXPANSIONS & LOCATIONS | JAN-APR 2012
68 Expansion
200 Expansion
40 Expansion
34 Retention / Expansion
NA
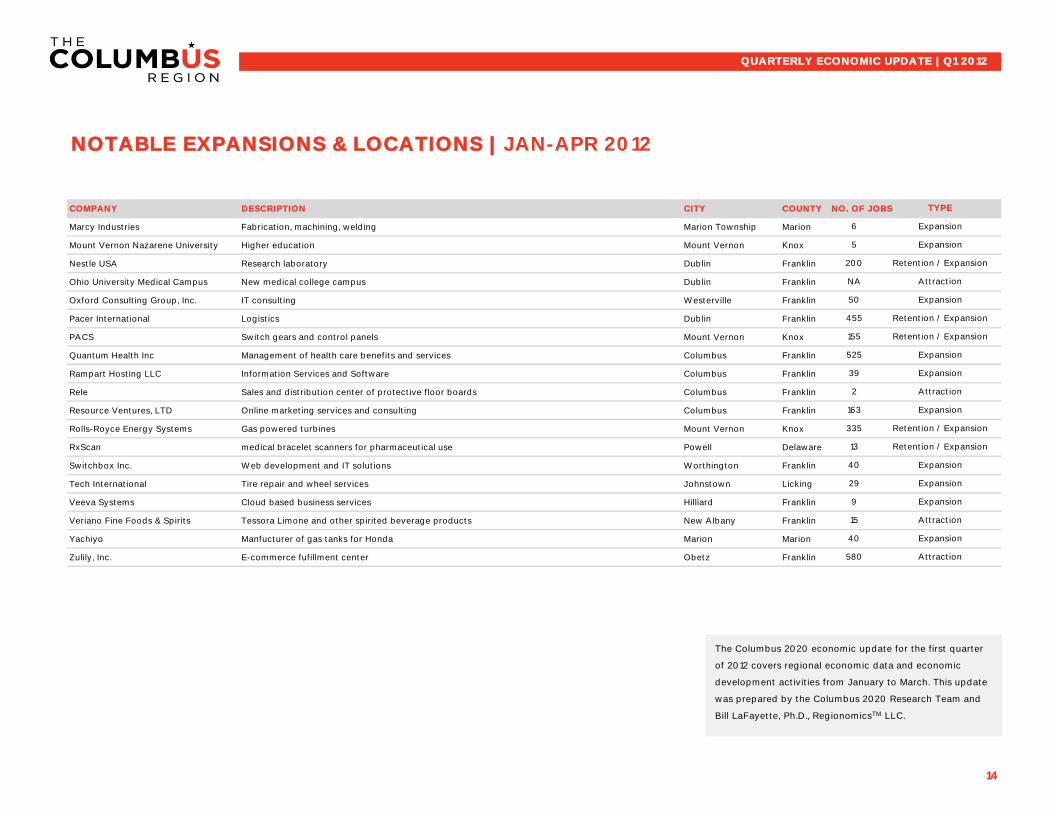
COMPANY DESCRIPTION CITY COUNTY NO. OF JOBS
Marcy Industries Fabrication, machining, welding Marion Township Marion
Mount Vernon Nazarene University Higher education Mount Vernon Knox
Nestle USA Research laboratory Dublin Franklin
Ohio University Medical Campus New medical college campus Dublin Franklin
Oxford Consulting Group, Inc. IT consulting Westerville Franklin
Pacer International Logistics Dublin Franklin
PACS Switch gears and control panels Mount Vernon Knox
Quantum Health Inc Management of health care benefits and services Columbus Franklin
Rampart Hosting LLC Information Services and Software Columbus Franklin
Rele Sales and distribution center of protective floor boards Columbus Franklin
Resource Ventures, LTD Online marketing services and consulting Columbus Franklin
Rolls-Royce Energy Systems Gas powered turbines Mount Vernon Knox
RxScan medical bracelet scanners for pharmaceutical use Powell Delaware
Switchbox Inc. Web development and IT solutions Worthington Franklin
Tech International Tire repair and wheel services Johnstown Licking
Veeva Systems Cloud based business services Hilliard Franklin
Veriano Fine Foods & Spirits Tessora Limone and other spirited beverage products New Albany Franklin
Yachiyo Manfucturer of gas tanks for Honda Marion Marion
Zulily, Inc. E-commerce fufillment center Obetz Franklin
14
2
455 Retention / Expansion
29 Expansion
40 Expansion
Attraction
580 Attraction
39 Expansion
9 Expansion
Attraction
163
TYPE
5 Expansion
NA
200 Retention / Expansion
Attraction
525
50 Expansion
40 Expansion
335 Retention / Expansion
13 Retention / Expansion
15
Expansion
155 Retention / Expansion
Expansion
6 Expansion
QUARTERLY ECONOMIC UPDATE | Q1 2012
NOTABLE EXPANSIONS & LOCATIONS | JAN-APR 2012
The Columbus 2020 economic update for the first quarter
of 2012 covers regional economic data and economic
development activities from January to March. This update
was prepared by the Columbus 2020 Research Team and
Bill LaFayette, Ph.D., RegionomicsTM LLC.