2012 Operating Budget Electric Division Water Division Wastewater Division.
21
2012 Operating Budget Electric Division Water Division Wastewater Division
-
date post
19-Dec-2015 -
Category
Documents
-
view
216 -
download
0
Transcript of 2012 Operating Budget Electric Division Water Division Wastewater Division.

2012 Operating Budget
Electric DivisionWater Division
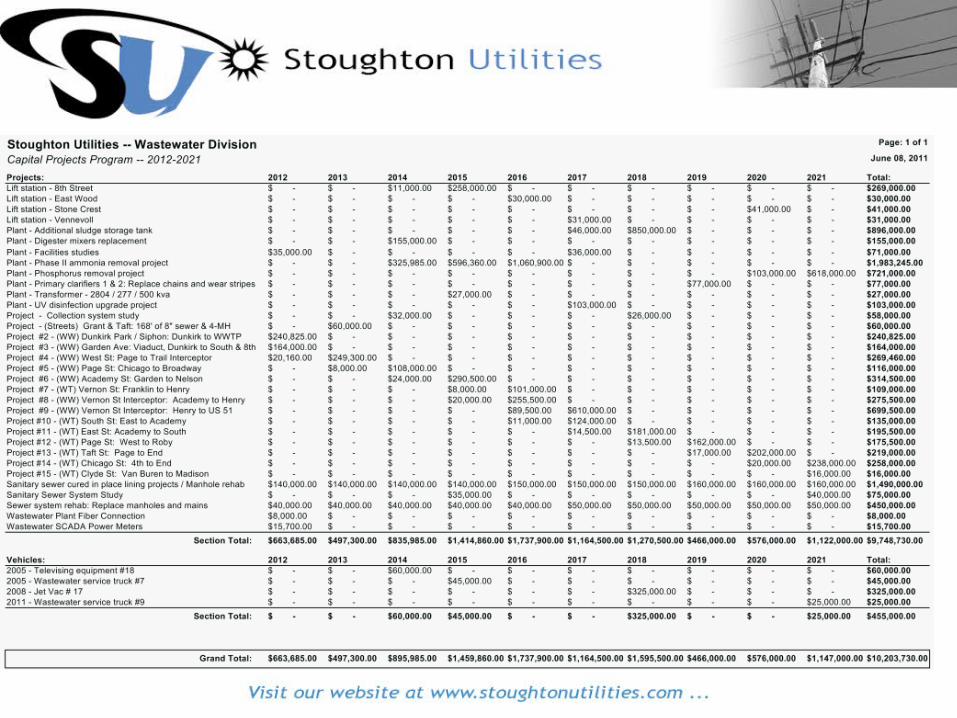
Wastewater Division

Core Utility Operations• Wholesale power purchase• Acceptance and delivery of electricity
to Stoughton residents and five surrounding townships in Dane and Rock Counties
• Pumping,treatment and delivery of water
• Collection, treatment and disposal of wastewater to the Yahara River and nutrients to farm fields


Financial Position• All three divisions are strong• Stable throughout economic
downturn• Commercial/Industrial sales trending
up– Conservative 0.50% increased sales projection
• Adequate and competitive rates – no rate adjustments for 2012
• Staff committed to continuous improvement – cost saving measures

Annual Savings to City Budget and Taxpayers
Description Amount
Payment in lieu of taxes (electric and water) $ 635,500
Building Rent (net of EMS space) $ 84,000
Administration fee $ 55,000
Tax stabilization dividend $ 46,000
Public fire protection removed from tax bill $ 420,000
Wisconsin Retirement System UAAL Payoff $ 24,000
Energy efficiency project savings (235,000 kWh/yr)
$ 32,000
Total (Avoided Property Tax Recovery)
$1,296,500

Continuous Improvements – Annual SavingsProject Description Savings
Engineering/system upgrades
Transruptor project $ 42,000
Hwy N reconstruction (projected) $ 40,000
Voltage conversion to 12.4 kV $ 45,000
Wastewater infiltration/inflow reduction
$ 20,000
Energy efficiency WWTP air blower with VFD $ 17,000
WWTP electric heater replacement $ 6,700
Well Pump – VFD monitoring (SCADA)
$ 18,000
Interior/Exterior Lighting/Other $ 15,000
Personnel Reduce on call staff by 2 $ 40,000
WRS – UAAL Payoff $ 11,000
WRS – shift to employee responsibility
$ 51,000
Vacant position – metering division $ 72,000

Continuous Improvement – Annual SavingsProject Description Savings
Accounting/Customer Service
Outsource – Monthly bill print and mailing
$ 12,000
Electronic (desktop) deposit $ 8,000
In-house year end accrual entries, work order closing, financial statements and regulatory report preparation
$ 10,000
Annual Budget Savings $407,700
Equates to Savings/Residential Customer
$38.39
Future Projects Commercial card expense program
Electronic billing, electronic timesheets
GIS and work order integration
Energy efficiency projects/increased recycling effort

2012 Proposed Cash Outlay - $20,027,340

Operation and Maintenance Expense

Utility Industry Challenges• Cost of improvements to infrastructure• Economic development partnerships• Maintain competitive rates• Retain and attract experienced and
certified staff - Five eligible retirees (20% of
employees) - 17 employees with state licensure
(70% of employees)

Wages – IBEW Contract & Other Position January 1
and July 1, 2010
January 1 and July 1, 2011
January 1, 2012
January 1, 2013
IBEW (Lineman)
3.55%, 3.43%
2.50% 2.50% 2.50%
WPPA and Non-Represented
0.00% 0.00% 5.65% Total Proposed Adjustment
TBD

Cumulative % Wage Adjustments

Wages – Remaining (16 positions)• Utilities Committee request for market
wage comparison (WI Municipal Utilities)• Stoughton Utilities positions are 3.50% to
15.50% below average market wage• Staff recommended revised budget with
market wage adjustments over three years (2012-2014)
• Year 1 (2012) adjustment included in 2012 Budget and approved by Utilities Committee, recommended to Council

Wages – Remaining (16 positions)• Overall wage adjustment in 2012 Proposed
Budget is $56,000 out of $15.3 million• Total Labor, FICA, WRS – 11.2% of O&M Expense• Wage adjustment plus FICA, WRS contribution is
0.37% of operating expenses in 2012 ($0.50 on the average residential customer bill of $136.00)
• Continuous annual improvement savings - $3.20 on average residential monthly customer bill
• Wage adjustment can occur within legal guidelines of the state’s Budget Repair Bill and Biennial Budget

2012 Proposed Budget SummaryElectric Water Wastewater Total
OPERATING REVENUES $ 15,751,784 $ 1,693,648 $ 2,095,262 $ 19,540,694
OPERATING EXPENSES
Operation & Maintenance Expense $ 13,664,824 $ 727,123 $ 911,373 $ 15,303,320
Taxes (PILOT) $ 330,000 $ 305,500 $ - $ 635,500
Depreciation $ 925,500 $ 368,500 $ 703,500 $ 1,997,500
Total Operating Expenses $ 14,920,324 $ 1,401,123 $ 1,614,873 $ 17,936,320
Operating Income $ 831,460 $ 292,525 $ 480,389 $ 1,604,374
Non-operating Revenues (Expenses):
Investment Income $ 140,000 $ 35,000 $ 62,000 $ 237,000
Interest Expenses $ (278,243) $ (94,742) $ (108,148) $ (481,133)
Capital Contributions $ 71,000 $ - $ - $ 71,000 Miscellaneous Revenues (Expenses) $ (35,000) $ (11,300) $ - $ (46,300)
Total Non-operating Revenues (Expenses) $ (102,243) $ (71,042) $ (46,148) $ (219,433)
Net Income $ 729,217 $ 221,483 $ 434,241 $ 1,384,941