2012 Four-State Dairy Nutrition & Management Conference ...
133
Four-State Dairy Nutrition and Management Conference June 13 & 14, 2012 • Dubuque, Iowa Cooperative Extension for: Iowa State University University of Illinois University of Minnesota University of Wisconsin
Transcript of 2012 Four-State Dairy Nutrition & Management Conference ...

Four-State Dairy Nutritionand Management Conference
June 13 & 14, 2012 • Dubuque, Iowa
Cooperative Extension for:Iowa State UniversityUniversity of IllinoisUniversity of MinnesotaUniversity of Wisconsin
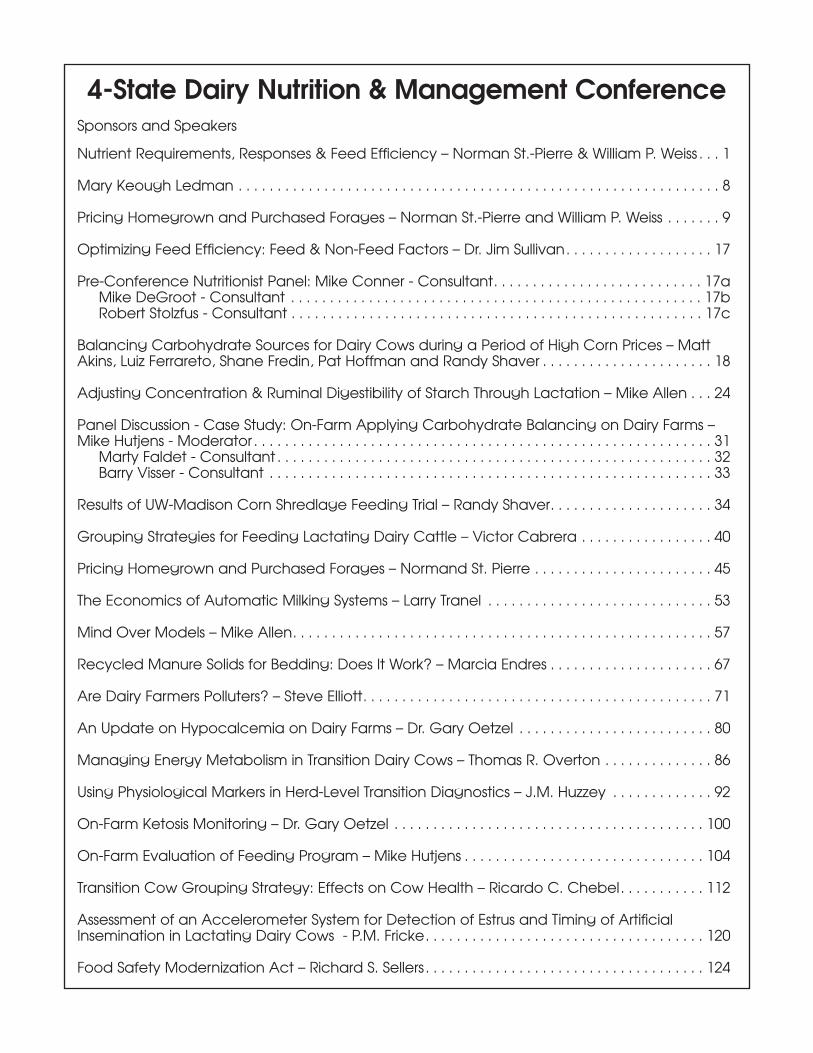
4-State Dairy Nutrition & Management ConferenceSponsors and Speakers
Nutrient Requirements, Responses & Feed Efficiency – Norman St.-Pierre & William P. Weiss . . . 1
Mary Keough Ledman . . . . . . . . . . . . . . . . . . . . . . . . . . . . . . . . . . . . . . . . . . . . . . . . . . . . . . . . . . . . . . 8
Pricing Homegrown and Purchased Forages – Norman St.-Pierre and William P. Weiss . . . . . . . 9
Optimizing Feed Efficiency: Feed & Non-Feed Factors – Dr. Jim Sullivan. . . . . . . . . . . . . . . . . . . 17
Pre-Conference Nutritionist Panel: Mike Conner - Consultant. . . . . . . . . . . . . . . . . . . . . . . . . . . 17aMike DeGroot - Consultant . . . . . . . . . . . . . . . . . . . . . . . . . . . . . . . . . . . . . . . . . . . . . . . . . . . . . 17bRobert Stolzfus - Consultant . . . . . . . . . . . . . . . . . . . . . . . . . . . . . . . . . . . . . . . . . . . . . . . . . . . . . 17c
Balancing Carbohydrate Sources for Dairy Cows during a Period of High Corn Prices – MattAkins, Luiz Ferrareto, Shane Fredin, Pat Hoffman and Randy Shaver . . . . . . . . . . . . . . . . . . . . . . 18
Adjusting Concentration & Ruminal Digestibility of Starch Through Lactation – Mike Allen . . . 24
Panel Discussion - Case Study: On-Farm Applying Carbohydrate Balancing on Dairy Farms –Mike Hutjens - Moderator . . . . . . . . . . . . . . . . . . . . . . . . . . . . . . . . . . . . . . . . . . . . . . . . . . . . . . . . . . . 31
Marty Faldet - Consultant . . . . . . . . . . . . . . . . . . . . . . . . . . . . . . . . . . . . . . . . . . . . . . . . . . . . . . . . 32Barry Visser - Consultant . . . . . . . . . . . . . . . . . . . . . . . . . . . . . . . . . . . . . . . . . . . . . . . . . . . . . . . . . 33
Results of UW-Madison Corn Shredlage Feeding Trial – Randy Shaver. . . . . . . . . . . . . . . . . . . . . 34
Grouping Strategies for Feeding Lactating Dairy Cattle – Victor Cabrera . . . . . . . . . . . . . . . . . 40
Pricing Homegrown and Purchased Forages – Normand St. Pierre . . . . . . . . . . . . . . . . . . . . . . . 45
The Economics of Automatic Milking Systems – Larry Tranel . . . . . . . . . . . . . . . . . . . . . . . . . . . . . 53
Mind Over Models – Mike Allen. . . . . . . . . . . . . . . . . . . . . . . . . . . . . . . . . . . . . . . . . . . . . . . . . . . . . . 57
Recycled Manure Solids for Bedding: Does It Work? – Marcia Endres . . . . . . . . . . . . . . . . . . . . . 67
Are Dairy Farmers Polluters? – Steve Elliott. . . . . . . . . . . . . . . . . . . . . . . . . . . . . . . . . . . . . . . . . . . . . 71
An Update on Hypocalcemia on Dairy Farms – Dr. Gary Oetzel . . . . . . . . . . . . . . . . . . . . . . . . . 80
Managing Energy Metabolism in Transition Dairy Cows – Thomas R. Overton . . . . . . . . . . . . . . 86
Using Physiological Markers in Herd-Level Transition Diagnostics – J.M. Huzzey . . . . . . . . . . . . . 92
On-Farm Ketosis Monitoring – Dr. Gary Oetzel . . . . . . . . . . . . . . . . . . . . . . . . . . . . . . . . . . . . . . . . 100
On-Farm Evaluation of Feeding Program – Mike Hutjens . . . . . . . . . . . . . . . . . . . . . . . . . . . . . . . 104
Transition Cow Grouping Strategy: Effects on Cow Health – Ricardo C. Chebel. . . . . . . . . . . 112
Assessment of an Accelerometer System for Detection of Estrus and Timing of ArtificialInsemination in Lactating Dairy Cows - P.M. Fricke. . . . . . . . . . . . . . . . . . . . . . . . . . . . . . . . . . . . 120
Food Safety Modernization Act – Richard S. Sellers. . . . . . . . . . . . . . . . . . . . . . . . . . . . . . . . . . . . 124

SponsorsThe program committee deeply appreciates the following for their support and commitment tostrengthening the Midwest dairy industry.
UPCOMING CONFERENCE DATESJune 12 & 13, 2013June 11 & 12, 2014
Platinum Co-SponsorsAlltech, Inc. Novus International
Gold
Silver
BronzeMilk Products DuPont
AdisseoAnalabDairyland LaboratoriesDiamond VElanco Animal HealthJEFO NUTRITION USAMycogen Seeds
Prince Agri Products, Inc.QualiTech, Inc.Rock River Laboratory, Inc.RP Feed ComponentsVi-CORWestway Feed Products, LLC
AG ProcessingArm & Hammer Animal NutritionBalchem CorporationBIOMIN USABioZyme, Inc.Byron Seeds, LLCCommodity & Ingredient HedgingCumberland Valley AnalyticalDidion MillingDigi-StarDinamica Generale US, Inc.Enz-A-Bac Advanced ServiceEzfeed/DHI-ProvoKemin Industries
LallemandMicronutrientsMilk Specialties GlobalMIN-ADPapillon Agricultural CompanyPortaCheck, Inc.Quality Liquid FeedsQuality Roasting, Inc.Shredlage, LLCSoyBestSoyPLUS/SoyChlorTrouw Nutrition USAVan Beek Natural ScienceVirtus Nutrition

Take Home MessageNutrient requirements are human constructs.Proving their existence has been so far elusive.
Various functional forms can be fitted to response-type data. Generally, many functions show similarquality of fit to the data, yet have substantiallydifferent implications. This is an area where we needsome younger brains to be put to good use.
Whenever the response function of output tonutritional input(s) is smooth (i.e., continuous firstderivative) and concave (i.e., declining returns toscale) the level of input that maximize its efficiency isalways less than the level of input that maximizesprofits. Consequently, efficiency maximization isalways accompanied by a reduction in the economicefficiency (i.e., profits).
Whenever the penalty to achieve maximum efficiencyis relatively small, setting maximum efficiency as anoperational goal can be desirable. With nutritionalinputs, however, it appears that maximum efficiencyis frequently accompanied with substantial economicpenalties.
1. IntroductionIt used to be so simple: you had cows, you fed them,they gave milk, you got paid and nobody cared aboutmanure. These days are gone and likely will neverbe seen again. Nowadays much attention is beingdedicated to the impact that agriculture in generaland dairy production in particular have on theenvironment. In the process, many are attempting tooptimize the efficiency of dairy production. Morespecifically, the objective no longer is in optimizingproduction, but in maximizing production per unit ofa given input (e.g., maximizing milk production perunit of protein intake, or per unit of N excreted).Deeply embedded into this line of thinking is theoften poorly defined concept of nutritionalrequirements. In this presentation we dispute thewisdom of using nutritional requirements fordefining efficiencies and challenge the desirability ofefficiency maximization.
2. Requirements versus response-based systemsIn a requirement-based system the level ofproduction of the animals is an input (Figure 1). Theoutcome is a set of nutrient input levels believed tohave the ability of supporting (sustaining) the statedlevel of production. There are numerous examples ofsuch systems; one of the best known and often usedis that of the National Research Council (2001).
In a response-based system the level of production ofthe animals is not an input but an output of thesystem’s evaluation (Figure 2). Although anasymptotic value for production might be used as aninput, this is reflective of biological and physicallimitations and not of a desired output level. Theproblem is that many have confused the twoapproaches and have mischaracterized arequirement-based system as a response-basedsystem.
As an example, NRC (2001) indicates that underdefault environmental condition, a mature (65months old) dairy cows weighing 680 kg at a bodycondition score of 3.0 and producing 35 kg of milkper day at 3.5% fat, 3.0% true protein and 4.8%lactose requires 34.8 Mcals/day of net energy forlactation (NEL) and 2,407 g/day of metabolizableprotein (MP). The requirements for an identical cowat a level of production of 25 kg/d are 27.9Mcals/day of NEL and 1,862 g/day of MP. Thecorrect interpretation of these figures is that based onour current nutritional knowledge we have allreasons to believe that the first cow will continue (inthe short term) to produce 35 kg/day and be innutritional balance if the dietary supply matches thestated requirements. Nowhere do theserecommendations imply that if we could stuff 34.8Mcals/day of NEL and 2,407 g/day of MP into thesecond cow her production would rise from 25 kg to35 kg/day. Unfortunately, this has been the common(mis)interpretation of NE-supported and MP-supported milk in the NRC computer model output.As importantly, nowhere does it say that 34.8Mcals/day of NEL and 2,407 g/day of MP is the solecombination of energy and protein input levels that
Nutrient Requirements, Responsesand Feed Efficiency
Normand R. St-Pierre and William P. WeissDepartment of Animal Sciences, The Ohio State University, Columbus, OH-43210
Email: [email protected]
1

could support 35 kg/d. A cow is a very complex anddynamic system where energy supply and the formin which it is supplied (i.e., the substrates) affect thepathways of protein utilization (and vice-versa).Requirement-based systems are useful systems fordetermining feed combinations needed to achieve apre-determined level of production (i.e., commonration balancing). They are, however, grosslyincorrect at predicting animal outputs at supplylevels other than “required” levels.
3. Do animals have requirements?If you come to Ohio State for a graduate degree andif we serve on your graduate committee it is likelythat you will be asked the following question eitherduring your general examination or during yourdefense: do animals have requirements? In 15 years,the answer has been a unanimous “yes”, but with theonly justification that nutritional requirements arebeing taught as dogmas in nutrition classes. Evenmore baffling is that students are at a loss injustifying their answers; they do not know how theywould prove it. A proof in this instance requires acareful definition of what “a requirement” means.
3.1 Narrow definition.The requirement for a given nutrient is a unique levelof supply for which (1) a lesser supply results in alower level of production, and (2) a greater supplydoes not result in additional productivity.Mathematically, this implies a break-point in therelationship between production (e.g. milk) andnutritional supply (e.g. MP). What very few haveever considered is how one could prove the presenceof a break-point, i.e., a point on a curve where thefirst derivative does not exist. This is an entirelydifferent matter than demonstrating that a break-point relationship can be fitted. Many researchershave incorrectly interpreted a good fit as a proof ofconcept. An example will illustrate this fallacy.
3.1.1 Isoleucine (Ile) requirements in growing swine
Results from an experiment reported by Parr et al.(2003) will be used here. In short, growing pigs wereassigned to six different diets varying in dietary Ileconcentrations. Mean average daily gain (ADG) foreach of the 6 treatments are depicted in Figure 3.Results show a general trend towards greater ADG asdietary Ile level increased, but the exact, quantitativerelationship between ADG and Ile is clearly notevident
Under a narrow definition of a nutrient requirement,there should be a dietary Ile concentration that (1)maximizes ADG and (2) where a first derivative doesnot exist. Expressed algebraically, this segmentedlinear model take the following form:
ADG = ADGmax - b (X0 - Ile) if Ile < X0 [1]ADG = ADGmax otherwise.
In [1], ADGmax, b, and X0 are 3 parameters to beestimated. The parameter estimates that result in thebest fit and the resulting model are shown in Figure4. Just looking at these results, one would concludethat the model fits very well the data, with a veryhigh R2 (0.977) and low error (SE = 20.4 g/d). Therequirement for Ile is then estimated at 0.47% of thediet.
3.1.2 Necessary conditions to prove strictrequirements
This is where some people have incorrectly made ahuge leap of faith and concluded from similar typesof data analyses that requirements do exists and areidentifiable. The problem is that the identifiability isbased on the assumption that strict requirements doexist, and that the proof that strict requirements doexist is based on the identifiability. The circularity ofthis argument should be evident. More disconcertingis that nobody has been successful at defining(mathematically) the conditions that would provethat a break-point does exist. This would requireproving that the first derivative does not exist for acertain level of X and nobody seems to know howthat can be proven empirically.
3.2 Broad definition
Under a broad definition, the requirement for a givennutrient is simply a level of supply that results in agiven (desired) level of production. We no longerimpose the condition that lower supply levels resultin less production, and, especially, we no longerimpose the restrictive concept that greater supplylevels do not results in the same level of productivity.When nutrients are looked at on an individual basis,this broad definition is equivalent to fitting aresponse function of production levels on nutrientintake (or density). Properties of the relationship aredependent on the particular type of function beingfitted. The problem is that a great many function canbe fitted, each implying different properties on therelationship between nutritional inputs and
2

production levels. Here again an example should beuseful.
3.2.1 Quadratic response with plateau
This model can be stated as follows:
ADG = ADGmax - b (X0 - Ile)2 if Ile < X0 [2]ADG = ADGmax otherwise.
With this model, the ADG response to dietary level isquadratic up to a level X0 where it reaches a plateau.A big difference between [2] and [1] is that in [2] thefunction is smooth. That is, the first derivative existsfor all levels of Ile. This curves does not have abreakpoint. The parameter estimates resulting in thebest fit and the resulting curve are shown in Figure 5.Although it is tempting to label X0 as “therequirement”, the economic implication of thisfunction is that the optimal level of Ile is less than X0
unless the nutrient is free, or the value of anadditional unit of ADG is infinite – two conditionsthat are highly improbable in the world that we livein. So, although X0 can be labeled as a requirement,animals would never be fed at their “requirementlevel”, but always at a lower level. Note also that the“requirement” calculated from this model (0.501%) is7.3% greater than the requirement calculated from thesegmented-linear model (0.467%).
3.2.2 Monomolecular model
The monomolecular function is similar in shape tothe logistic function past its inflection point. Itsalgebraic form is:
ADG = ADGmax � (1 - B � EXP(-k � Ile)) [3]
This function never reaches a plateau, but convergestowards an asymptote (parameter ADGmax in [3]).Parameter estimates resulting in best fit and theresulting curve are shown in Figure 6. Some haveargued that the level of input at which the secondderivative of this function reaches a minimum can beinterpreted as a “requirement”. As we shall see, thisinterpretation is incorrect.
3.2.3 Quadratic polynomial model
This is the simple quadratic function that we alllearned in high school:
ADG = b0 + b1 � Ile + b2 � Ile2 [4]
Best parameter estimates and the resulting curve areshown in Figure 7. Note that in spite of its simplicity,this function also fits the data very well.
So what is the correct relationship between ADG anddietary Ile in this example? All models presentedinvolve 3 parameters. Based on the highest R2 andthe smallest standard error, some would argue thatthe monomolecular model has the best fit to the data.But to argue that a difference of 0.01 between two R2
is meaningful is ignoring the errors in themeasurements. The fact is that statistics are generallyof little help in assessing the comparative fit ofvarious functions expressing the biological responseof animals to dietary inputs. There are just too manyalternatives and one invariably ends up withmultiple functions that fit the data equally well, butthat imply substantially different interpretations.
4. Population responseThe framework of a segmented-linear responsemodel can only be theoretically valid when data arefrom animals of very similar genetics in near identicalphysiological states and environments. Whenmeasurements are made on individuals who aregenetically different, or under different physiologicalstatus (e.g., stage of lactation in dairy) orenvironments, then the population response isexpected to be smooth even if one assumes that theresponse function of each individual follows a modelof an abrupt threshold and plateau (i.e., thesegmented-linear model). The mathematical andstatistical theory supporting this was developeddecades ago at the University of Reading (Curnow,1973). Figure 8 illustrates the concept. In this figure,although the response of each individual follows asegmented-linear response (thin lines in Figure 8), theresponse averaged across individuals is smooth (i.e.,no break-point), sigmoid, and converges toward anasymptote (the thick line). The exact mathematicalform of the population response function based onsome assumptions regarding the distribution ofindividuals is messy, somewhat complicated, and hasnot been expanded to multiple dimensions when thejoint response to 2 or more nutrients is beinginvestigated. The important point from this work,however, is that there is a strong theoretical basis thatsupports smooth and asymptotic responses tonutrients for groups of individuals even if onebelieves that strict nutrient requirements (as definedin a prior section) do exist for individuals. Response-type experiments in dairy are never conducted onanimals of identical genotypes; physiological status
3

always varies across individuals; and micro-environments are never identical. Therefore,although one can always fit segmented-linear modelsto dairy response experiments as we did in Figure 4,such models make little theoretical sense and thispractice should be discontinued.
5. Nutrient requirements for asymptotic modelsDoepel et al. (2004) have argued (1) using a logisticfunction as the basis for expressing the relationship ofmilk protein or amino acids (AA) output to intake ofvarious amino acids, and (2) to determinerequirements as intake levels where the secondderivative of the logistic function reaches a minimum(Figure 9). The logistic function is indeed a wisechoice, as it closely resembles the complex theoreticalfunction proposed by Curnow (1973) (i.e., sigmoidand asymptotic). The argument for the identificationof requirements is, however, economically incorrect.The level of input where the second derivative of thelogistic function reaches a minimum is in fact thepoint where the average efficiency is maximized. Todeclare this level a requirement is not self-evident.More troublesome is that the supply level that oneshould target to maximize profits should be greaterthan the so-called requirement level; oftentimessubstantially greater. We shall use a concreteexample from Doepel et al (2004) to illustrate whatwe mean.
Figure 10 shows the relationship between Met outputin milk and the total estimated Met supply at theduodenum obtained from a meta-analysis ofliterature data. The Met requirement using asegmented-linear model was 50 g/d. The Met supplylevel where the second derivative of the fitted logisticfunction reached a minimum was also 50 g/d, hencereinforcing the perception that the Met requirementunder the conditions summarized by this meta-analysis is 50 g/d of Met supply at the duodenum.Elementary economics, however, would indicate thatthe profit-maximizing supply is where the marginalvalue is equal to the marginal cost, i.e., the cost of thelast unit added equals the value of the additionalproduct. Expressed mathematically, the optimumMet is that where the derivative of the logisticfunction (i.e., the slope) is equal to the ratio of theprice of dietary Met to that of milk Met.
The cost for Met supplied at the duodenum isapproximately $0.02/g using commercially availablemethionine source. Milk protein (which containsapproximately 3% Met) has averaged a market price
of $2.72/lb ($6.00/kg) between 2005 and 2011 on theU.S. market. This translates to a price of about$0.20/g of milk Met. Hence, the optimum Met supplywould be found as the point on the logistic curve ofFigure 10 where the slope equals 0.02 ÷ 0.20 = 0.10.This occurs approximately at a Met supply of 70 g/d,a level which is 40% greater than that designated asthe “requirement”.
A Met supply of 50g/d at the duodenum yields 26g/d of milk Met, which translates to 867 g/d of milkprotein. The Met efficiency (26 ¸ 50 = 0.52) ismaximized at this level of Met supply. Pricing milkprotein at $6.00/kg, the value of the milk protein is$5.20/d. Using a price of $0.02/g for Met supply atthe duodenum, the 50 g/d of Met costs $1.00/d,resulting in gross margins of $4.20/cow per d.
A Met supply of 70 g/d at the duodenum yields 31g/d of milk Met, which translates to 1,033 g/d ofmilk protein. The Met efficiency at this level ofsupply (31 ÷ 70 = 0.44) is substantially less than at asupply of 50 g/d (0.52; the bigger this number thegreater is the efficiency). The value of the milkprotein, however, is increased to $6.20/d, while thecost of the Met supplied is increased to $1.40/d,resulting in gross margins of $4.80/cow per d. Thus,driving the system towards maximum Met efficiencyresults in a net loss of $4.80 - $4.20 = $0.60/cow perday, or over $200 per lactation compared tosupplying Met for maximum economic returns.
6. Maximum efficiency always comes at a costThe previous example is understandably a little bitnaïve, but served as an illustration of the penaltyassociated with using maximum efficiency of inputsas targets. A few years ago, we conducted a largestudy to estimate the economic penalty that would beassociated with a proposed farm policy that wouldaim at enforcing maximum N efficiency in livestockfeeding (St-Pierre and Thraen, 1999). Using anexpansion of Curnow theory, we developed empiricalresponse model based on net energy lactation (NEL)and crude protein (CP) inputs. The response functionfor cows of average genetic potential is shown inFigure 11 as a contour plot. Note that it is smooth(continuous first partial derivatives) and asymptotic.Using average feed and milk prices during the 1995-1999 period, we determined the input levels thatmaximized nitrogen (N) efficiency, maximized milkproduction, and maximized income over feed costs(IOFC). Results are shown in Figure 11.
4

Table 1 reports results of various calculationscomparing a U.S. national dairy system targetingmaximum economic efficiency vs. maximum inputefficiency (of nitrogen in this case). The total societalcost to a policy enforcing maximum N efficiency ondairy farm was estimated at $1.35 billion per year,which equated to $9.55/kg of reduction in Nexcretion.
ConclusionsAlthough it would appear desirable to thrive towardsefficiency maximization in dairy, this will always beaccompanied with a reduction in profitability.Depending on the size of the profit reduction,maximization of input efficiency can range frombeing achieved at a negligible cost all the way tobeing highly objectionable from an economicstandpoint– or anything in between.
ReferencesCurnow, R. N. 1973. A smooth population response curvebased on an abrupt threshold and plateau model forindividuals. Biometrics 29:1-10.
Doepel, L., D. Pacheco, J. J. Kennely, M. D. Hannigan, I. F.Lopez, and H. Lapierre. 2004. Milk protein synthesis asa function of amino acid supply. J. Dairy Sci. 87:1279-1297.
Parr, T. M., B. J. Kerr, and D. H. Baker. 2003. Isoleucinerequirement of growing (25 to 45 kg) pigs. J. Anim. Sci.81:745-752.
St-Pierre, N. R., and C. S. Thraen. 1999. Animal groupingstrategies, sources of variation, and economic factorsaffecting nutrient balance on dairy farms. J. Dairy. Sci. 82(Suppl. 2):72-83.
Table 1. Immediate economic consequences ofenforcing maximum N efficiency (MAX M/N) asopposed to optimum economic allocation of nutrientinputs (MAX IOFC) on the national cost of producing70 billion kg of milk, assuming a national herd with amilk production potential of 11,350 kg/yr per cow(from St-Pierre and Thraen, 1999).
MAX IOFC MAX M/NActual milk production,kg/cow per year 10,955 9,812N excretion, kg/cowper year 146 111Income over feed costs,$/cow per year $1,893 $1,639Net income, $/cow per year $622 $368Number of cows, millions 6.39 7.13N excretion, tonnes/year 932,940 791,430Net income, million $/year 3975 2624Reduction in net income per kg . 9.55of reduction of N excretion, $/kg of N
Figure 1. Requirement-based system for dietformulation. Level of productivity is an input to thesystem.
Figure 2. Response-based system for dietformulation. Level of productivity is not an input tothe system.
Figure 3. Average daily gain (g/d) in growing pigsas a function of dietary isoleucine concentration (%).Data from Parr et al., 2003.
5

Figure 4. Linear and plateau model of ADG (g/d) ingrowing pigs as a function of dietary Ileconcentration. Data from Parr et al., 2003. Best fit is: Y = 716.3 (±11.8) - 2850 (±361.0) � (0.4669 (±0.0083) –Ile) if Ile < 0.4669,Y = 716.3 (±11.8) otherwise. R2 = 0.977, SE = 20.4 g/d.
Figure 5. Quadratic and smooth plateau model ofADG (g/d) in growing pigs as a function of dietaryIle concentration. Data from Parr et al., 2003. Best fitis: Y = 715.5 (±8.77) – 17,557 (±4260.2) � (0.501 (±0.014) -Ile)2 if Ile < 0.501,Y = 715.5 (±8.77) otherwise. R2 = 0.987, SE = 15.2g/d.
Figure 6. Monomolecular model of ADG (g/d) ingrowing pigs as a function of dietary Ileconcentration. Data from Parr et al., 2003. Best fit is: Y = 733.4 (±10.2) � (1 - 627.4 (±619.2) � EXP(-19.53(±2.62) � Ile)) R2 = 0.993, SE = 11.1 g/d.
Figure 7. Quadratic polynomial model of ADG (g/d)in growing pigs as a function of dietary Ileconcentration. Data from Parr et al., 2003. Best fit is: Y = 2305 (±490.6) + 11,288 (±2073.8) � Ile - 10,479.9(±2156.3) � Ile2
R2 = 0.976, SE = 21.1 g/d.
Figure 8. Illustration of a smooth populationresponse curve (thick line) base on an abruptthreshold and plateau model (i.e., segmented-linearmodel) for individuals (series of thin lines).
6

Figure 9. Representation of a logistic response tohistidine supply (a), with its first (b) and second (c)derivatives. The curve (b) represents the marginalefficiency. The maximum marginal efficiency (a2, b1)is calculated from the first derivative, and the lower(a1, c1) and upper (a3, c2) critical points arecalculated from the second derivative. The uppercritical point is assumed to represent the requirementfor duodenal AA supply. From Doepel et al., 2004.
Figure 10. Relationship between Met output in milkand supply of Met at the duodenum from a meta-analysis of literature data. Data points from the sameexperiment are connected by dotted lines. The logistic(solid line) and segmented linear (dashed line)models are superimposed. From Doepel et al., 2004.
Figure 11. Contour plot showing the responsefunction of milk production to net energy forlactation (NEl) and crude protein (CP) concentrationof the diet (St-Pierre and Thraen, 1999), and the inputcombination leading to maximum nitrogen (N)efficiency (Max M/N), maximum milk production(Max MILK), and maximum income over feed costs(Max IOFC). From St-Pierre and Thraen, 1999.
7
Mary Keough Ledman has over twenty years ofexperience in the dairy industry that includesproduction, processing and policy. She grew-up on a160 acre, 50-cow dairy farm in southern Wisconsinand has worked on farms in Germany, Japan andNew Zealand.
Mary earned a Master of Science degree inAgricultural Economics from Texas A& M Universityand also received a Fulbright Fellowship to study theEuropean Community’s dairy policy in Germany.
Mary’s past work experience includes USDA, Kraftand Stella Foods. In 1995, she founded KeoughLedman Associates, a dairy economic consulting firmthat provides monthly dairy product and milk priceforecasting, economic and policy analysis, dairyproduct and milk sourcing strategies and domesticand international dairy market information.
In April 2012, Mary took over the Daily Dairy Reportwhen the CME discontinued their sponsorship of thereport. Mary and her team dissect the latest marketinformation and explain why the information isimportant to your business.
Today, Mary is going to share with us her outlook ondomestic and global milk and dairy product prices.
Mary Keough Ledman
8

Take Home Message1. The economic value of a feed rests in the value
of its nutrients. In dairy, the economicallyimportant nutrients are net energy lactation(NEL), metabolizable protein (MP), effectiveNDF (eNDF), and non-effective NDF (neNDF).
2. Unit prices of the important nutrients can becalculated using the composition and prices ofall feeds being traded in a given market. Thismethod is available in a Windows-basedsoftware. Alternatively, estimates of unit pricesare being published on a monthly basis in anational dairy magazine for all major dairyregions.
3. Forage composition for NEL, MP, eNDF andneNDF can easily be determined using 11compositional inputs and equations providedin the appendix of this paper. Using data fromour experimental research station, we do notfind a strong association between in vivo totaltract NDF digestibility and in vitro NDFdigestibility (NDFd). At this point we are stillrecommending the use of protein-free NDF andlignin to estimate NDF digestibility.
4. For most feeds, the economic value iscalculated as the simple sum of the values oftheir nutrients. With forages, however, onemust introduce a correction associated withquality because forages are not entirelysubstitutable. Dairy cows exhibit a small, butsignificant response in milk yield when highquality forages are substituted for low qualityforage in otherwise equally balanced diets.
5. The values of three levels of quality withinalfalfa and grass hay are calculated over theperiod of January through March 2012. Inalfalfa, nearly 65% of the total value isassociated with the NEL content, whereas ingrass NEL content accounts for nearly 75% offorage values. Of the 11 compositional inputsrequired in the calculation of hay and silagevalues, NDF, lignin and ash appear to have thegreatest importance.
IntroductionWhat are feeds used for? Animals do not requirefeeds; animals require nutrients. Feeds are nothing
else than containers, packages of nutrients. The solevalue of a feed is in the value of the nutrients that itcontains. A feed containing no nutrient has noeconomic value. No economic value means that it isworthless - ZERO.
What are the nutrients of economic value? Theanswer to that question depends on two things. First,the nutrients of economic value are dependent on theclass of animals under consideration. For example,the nutrients of economic importance are not thesame for beef cattle, lactating dairy cows, dry cows,and replacement animals. Hence a given feed has adifferent economic value to lactating dairy cows andreplacement heifers.
Second, the nutrients of economic value dependwhether one is interested in the strategic value of afeed versus its tactical value. This begs furtherexplanations. A dairy producer feeding 50 lbs/day ofa finely chopped corn silage is looking for attributesin purchased hay that are very specific to the narrowconditions in which it is to be fed. The value of agiven lot of hay to this producer would be entirelytactical – i.e., determined by how well it fits as acomplement to other feed ingredients that areessentially pre-determined. On the other hand, adairy producer who considers all feed components ofhis dairy rations to be exchangeable (tradable) wouldlook at a given lot of hay with a strategic view. Thehay would no longer be looked at as a complement toother pre-determined feeds, but as a component ofthe whole diet. To put it differently, tactical is whenyou have painted yourself in a corner; strategic iswhen you look at the floor configuration before youstart painting.
The economic values calculated in this paper are (1)exclusively for lactating dairy cows, and (2) entirelystrategic.
Of the large set of nutrients required by dairy cows,some have large economic values while others havesmall economic values. The calcium content of feedsis a good example of a nutrient with a smalleconomic value. Calcium can be supplemented veryinexpensively in any dairy diets. This is not to say
Pricing Homegrown and Purchased ForagesNormand St-Pierre and William P. Weiss
Department of Animal Sciences, The Ohio State University, Columbus, OH-43210.Email: [email protected]
9

that calcium is not important to dairy cows or thatration balancing should ignore calcium. It just saysthat the economics of feeding cows have little to dowith calcium.
We have extensively studied the major dairy feedmarkets in the U.S. over a period of 30 years. Acrossall 3 major markets (Midwest, Northeast, West), twosets of nutrients explain over 98% of the variation infeed prices. These are:
1. Net energy for lactation (NEL), rumendegradable protein (RDP), digestible rumenundegradable protein (dRUP), effective neutraldetergent fiber (eNDF), and non-effectiveneutral detergent fiber (neNDF), or
2. NEL, metabolizable protein (MP), eNDF, andneNDF.
The two sets are entirely interchangeable and givevery similar results. The protein requirements ofdairy cows, however, are best expressed asmetabolizable protein. Therefore, nutrient set #2 willbe exclusively used in the balance of this paper.
Unit Prices of Important NutrientsCalculating nutrient unit prices. Feed markets doexist: there are people selling and buying feeds in allmajor dairy regions. But there is no market fornutrients. Or is there? Can we calculate the implicitnutrient prices from the market prices of feedstuffs?
The problem of determining the implicit price ofattributes (the nutrients) embedded in variousproducts (feedstuffs) is not at all unique to thefeed/nutrient complex. Economists have found anelegant way to solve this problem using a methodcalled hedonic pricing. We will not review the detailsof how this work in this paper. Interested reader canconsult St-Pierre and Cobanov (2000) for furtherdetails. In short, prices and nutritional compositionof all ingredients traded in a given market are used toback-calculate, using statistical methods, what themarkets are implicitly pricing the nutrients containedin feeds.
Market prices of nutrients in the Midwest for the 86months between January 2005 and March 2012 areshown in Figure 1. During this period, the cost perunit of NEL has more than tripled, the cost per unit ofMP has doubled, while the cost per unit of eNDF hassurged in the first half of 2011. The U.S. hasexperienced drastic changes in renewable energy
policies during the last decade, some of which havehad a substantial effect on feed prices. However,large variation in nutrient unit prices are still evidenteven over a much shorter period of time such as whathas occurred since January 2011 (Table 1).
What affects nutrient unit prices? Market prices ofall feeds affect nutrient unit prices, not just the pricesof corn, soybean meal and alfalfa hay. Therefore,nutrient unit prices change through time andlocation. We have already shown how nutrients canquickly change through time in Table 1. Because ofregional differences in feed prices and availability,nutrient unit prices also show substantial regionaldifferences (Table 3). In this paper we will be usingMidwest nutrient unit prices. When examining theeffect of time, we will use January 2011 to March 2012prices.
Where do I find the nutrient unit prices? You canpurchase a Windows-based software that we wrote(Sesame) for $10 at www.sesamesoft.com. Beware thatit is NOT the easiest software to use. Alternatively,we publish a regular column in Progressive Dairymanwhere we publish the nutrient unit prices for themajor dairy regions of the U.S.
Forage CompositionNutrient composition used in this paper. Each lot offorage has a unique nutrient composition that affectsits value. The nutrient composition of forages usedas examples in this paper are reported in Table 2. Weused 3 levels of quality for legume hay and grass hay.
A few things are worth mentioning here. First, noticethat the quality of alfalfa (and grass) has a muchsmaller effect on its metabolizable protein than on itscrude protein. Second, observe that in alfalfa thenon-fiber carbohydrates (NFC) contribute 2 timesmore to its energy content (i.e., TDN) than the NDF.In grass, the situation is reversed, with NDFcontributing significantly more to the energy contentthan NFC. Total tract NDF digestibility is greater ingrass (~47%) than in alfalfa (~39%) of equivalentquality.
How are NEL and MP calculated? Equations used inthe calculation of NEL and MP according to NRC(2001) are reported in the appendix. Although theseequations may seem intimidating at first, they caneasily be programmed in a computer spreadsheet.While 9 chemical entries are required for thecalculation of NEL only 5 measurements will have
10

much effect on NEL in practice: DM, CP, NDF, lignin,and ash. Other entries can simply be taken fromstandard feed composition tables.
The calculation of MP requires a measurement of CP,rumen degradability of protein (RUP_CP), and post-ruminal digestibility of RUP (RUPd). Some feedlaboratories provide estimates of RUP_CP, but thevariation within a type of hay is relatively small andlargely inconsequential to the value of the forage.Likewise, table values for RUPd should be used.
What NDF digestibility should be used? The ratio oflignin to protein-free NDF is used to estimate in vivototal tract NDF digestibility (TT-NDFd) in theequation for TDN_NDF reported in the Appendix.The 2/3 exponent is used to convert mass to surfacearea, hence representing the decrease in NDFdigestibility due to the surface interaction (i.e.,coating) of cell walls by lignin. This conceptualinteraction is necessarily a simplification of thecomplex anatomy and chemistry of plant cell walls.Some have advocated the use of in vitro NDFdigestibility (NDFd) as a proxy for the calculated TT-NDFd used when calculating TDN_NDF. Althoughthis approach is appealing, much doubt remainsregarding the relationship between NDFd and TT-NDFd. For example, we have summarized therelationship between TT-NDFd and NDFd for 23diets where TT-NDFd was measured using total fecalcollection in trials conducted at our experimentalresearch station (Figure 2). In this figure, it isapparent that NDFd overestimates differencesbetween treatments and that the magnitude of thedifference in NDFd is not related to the magnitude ofthe difference in TT-NDFd. The ranking withinexperiment was often OK with NDFd, raising thepossibility of using NDFd for energy calculation. It isclear, however, that NDFd cannot be directlysubstituted for TT-NDFd when calculating the energyof a feed. Much work is needed in this area.Meanwhile, we still recommend using the equationwith the ratio of lignin to protein-free NDF forestimating the energy contribution of NDF.
Calculating the Value of a ForageThe value of the nutrients. So far, we have shownthat nutrient unit prices can be calculated frommarket information from all feedstuffs traded in anarea. We also explained how the nutrientcomposition of forages for the economicallyimportant nutrients are calculated. Determining thevalue of the nutrients in a given forage involves a
series of simple arithmetical operations. These areillustrated for the reference alfalfa in Table 4 usingthe average price of nutrients for the Midwest fromJanuary 2011 to March 2012.
Correcting for milk production response. For mostfeeds, the sum of the values of the nutrients ascalculated in the preceding paragraph is its averageeconomic value; but not for forages. While mostfeeds are substitutable based on their nutrientcontent, this is not entirely true for forages. Whatthis means is that two rations balanced for exactly thesame nutrient density (NEL, MP, eNDF, neNDF) butusing forages of different quality do not result inexactly the same milk production. Cows fed theration based on a high quality forage respond toforage quality with additional milk productionmainly through greater dry matter intake (DMI).Note that this is not the same as the response tofeeding forages of different quality, but without anyration re-balancing. Here the rations are identical intheir nutritional content, but cows fed rations basedon higher quality forages achieve a greater level ofmilk production.
We used results from many research trials to calculatethe response to forage quality. Although one couldthink of a better marker of quality than the total NDFcontent of forage, the data did not allow thecalculation of anything more than NDF. Theresulting equations used to calculate the value perton of forage due to milk production responses are:
Alfalfa: Value of Response ($/ton) = [(P-Milk x 0.273x (44 – NDF)] x DM ÷ 100
Grass: Value of Response ($/ton) = [(P-Milk x 0.3 x(53 – NDF)] x DM ÷ 100
where P-Milk is the price of milk ($/cwt). It isimportant to understand that this adjustment to thevalue of forages means that forage values aredependent on milk prices. The difference in thevalue of a high quality forage compared to that of alow quality forage is much smaller when milk pricesare low (such as in 2009) then when milk prices arehigh (as in 2011).
Effect of forage type and quality on the value offorage in 2011. Table 5 summarizes the values ofalfalfa and grass hay for 3 levels of quality for theperiod of January 2011 to March 2012. On anaverage, the range in values due to quality is greaterin grass ($124/ton) compared to alfalfa ($73/ton).This could be due to the arbitrary range of quality
11

selected for the two types of forages. On an average,alfalfa is worth $50/ton more than grass. Comparedto alfalfa, grass hay shows a greater range in valuethrough time: $109 and $126/ton for alfalfa andgrass, respectively. More importantly, the value offorages changes considerably through time even overa short time span.
Contribution to calculated values. The value of aforage is the sum of the values of its importantnutrients plus the milk response associated with theforage quality expressed as NDF content. Thecontribution of each nutrient to the value of a forageis not the same. Table 6 shows the averagecontribution of NEL, MP, eNDF, neNDF, and milkresponse for the 15 months since January 2011 for thereference alfalfa and grass hays. On an average,energy (NEL) content accounts for nearly 65% of thevalue of alfalfa hay and 75% of the value of grass hay.Notice that the protein in alfalfa (20% crude protein)is only worth $7/ton more than the protein in grass(12% crude protein). This is because most of theprotein in forage is rumen degradable (RDP), and theunit value of RDP ($/lb) is generally null and ofteneven slightly negative (results not shown). Producingforages of greater protein content is of little valueunless the protein increase is associated with anincrease in the digestibility (energy) of the resultingfeeds.
In hay and most haycrop silages, most of the NDF iseffective, resulting in very small neNDF content(Table 2). Therefore, the contribution of neNDF to thevalue of long hays could be entirely ignored withoutmeaningful losses in the accuracy of estimating theireconomic values.
Marginal changes from compositional values. The 4nutrients used to calculate the value of a forage arecalculated from 11 compositional entries. We cancalculate the change in the value of our referencealfalfa and grass hay from a one-unit change in eachof the 11 entries (Table 7). One should be extremelycareful in the interpretation of these results. First, aone-unit change does not represent the same degreeof “difficulty” across all compositional elements. Forexample, it is considerably easier to raise the NDF ofgrass by one unit than to raise its ether extracts alsoby one unit. Second, and even more importantly, it isvery difficult in nature to change a compositionalelement by one unit without affecting any of theother compositional elements. For example, crudeprotein in alfalfa is negatively associated with NDF
content. On average, raising crude protein lowers theNDF content (i.e., the plant is more immature).Likewise, NDF and lignin content are positivelyassociated, meaning that an increase in NDF contentis generally associated with an increase in lignincontent. Keeping these reservations in mind,compositional elements can be loosely grouped into 3categories.
1. Those with a small effect on the value of hay:RUP, RUPd and NDFe,
2. Those with a medium effect on the value ofhay: DM, CP, NDICP, and
3. Those with a large effect on the value of hay:ADICP, ether extracts, NDF, lignin and ash.
Ether extracts and ADICP are relatively constantwithin hay type compared to NDF, lignin and ash.NRC (2001) reports standard deviations of 0.4(ADICP), 0.5 (ether extracts), 0.9 (lignin), 1.0 (ash),and 6.3 (NDF) percent. Thus, NDF, lignin, and ashare arguably the most influential compositionalentries to hay values. Note that the net effect of NDFon hay values incorporates its positive effect onforage value from its positive contribution to eNDF,and its negative effects on forage value from itsnegative contribution to NEL and MP.
Concluding remarksThe values calculated in this paper are on a farm-gatebasis (i.e., delivered) and not FOB. Therefore, foragegrowers would have to account for delivery costswhen estimating the value of a given hay or silage.In addition, the values calculated in this paper areaverages and represent what coherent buyers shouldbe willing to pay. Coherent behavior is often anelusive attribute in feed markets. Some buyersconsistently shop for “supreme” quality alfalfa haybecause that’s what they have been using for yearswithout ever considering whether other quality levelsor even other types of feeds make more economicsense. A very thirsty man is much more willing topay an exorbitant price for a cold beer, especially if hefails to consider the free water available from anearby fountain.
ReferencesSt-Pierre, N. R., and D. Glamocic. 2000. Estimating unitcosts of nutrients from market prices of feedstuffs. J.Dairy Sci. 83:1402-1411.
12

Appendix
Equations used to calculate NEL (NE_3X, Mcal/lb) of forages:TDN_NFC = 0.98 x (100 – NDF + NDICP – CP – EE – ASH)TDN_NDF = 0.75 x (NDF – NDICP – LIG) x (1-(LIG/(NDF-NDICP))0.667)TDN_CP = CP x exp(-1.2 x ADICP/CP)TDN_EE = (EE – 1) x 2.25TDN_1X = TDN_NFC + TDN_NDF + TDN_CP + TDN_EE - 7DE_1X = (TDN_NFC x 0.042) + (TDN_NDF x 0.042) + (TDN_CP x 0.056)
+ ((EE-1) x 0.094) - 0.3TDN_3X = TDN_1X x 0.92NE_3X = (0.6532 x DE_1X) - 0.5064 Equations used to calculate the metabolizable protein (MP, % of DM) of forages:dRUP = CP x RUP_CP x RUPd ÷ 10000dMTP = TDN_3X x 1.3 x 0.64 ÷ 10MP = dRUP + dMTPEquations used to calculate effective and non-effective NDF of forages:eNDF = NDF x NDFeneNDF = NDF - eNDFwhere:ADICP = ADF insoluble crude protein (% of DM)ASH = Ash (% of DM)CP = Crude protein (% of DM)dRUP = Digestible RUP (% of DM)dMTP = Digestible microbial true protein (% of DM)EE = Ether extracts (% of DM)eNDF = Effective NDF (% of DM)exp = The exponential function (i.e., e exponent the value in parentheses)LIG = Lignin (% of DM)NDF = Neutral detergent fiber (% of DM)NDFe = NDF effectiveness (% of NDF)NDICP = NDF insoluble crude protein (% of DM)NE_3X = Net energy for lactation measured a 3 times maintenance (Mcal/lb)neNDF = Non-effective NDF (% of DM)RUP_CP = Rumen undegradable protein (% of CP)RUPd = Digestibility of RUP (% of RUP)TDN_1X = Total digestible nutrients at 1 time maintenance (% of DM)TDN_3X = Total digestible nutrients at 3 times maintenance (% of DM)TDN_CP = TDN from the crude protein fraction (% of DM)TDN_EE = TDN from the ether extracts fraction (% of DM)TDN_NDF = TDN from the NDF fraction (% of DM)TDN_NFC = TDN from the NFC fraction (% of DM).
13

Table 1. Nutrient unit prices in the Midwest between January 2011 and March 2012.
Nutrients Average S.D. Min MaxNEL (¢/Mcal) 16.5 2.7 11.1 20.8MP (¢/lb) 23.6 9.6 9.7 40.6eNDF (¢/lb) 3.6 3.5 0.0 11.9neNDF (¢/lb) -8.7 3.7 -13.5 -3.2
Table 2. Nutrient composition of the reference alfalfa hay, reference grass hay, and low and high quality hays usedas examples.
Alfalfa GrassNutrients1 Units Reference Low High Reference Low HighDry matter % 88 88 88 88 88 88Crude protein % 20 16 24 12 8 16NDICP % 2.5 2.5 2.5 4.0 4.0 4.0ADICP % 1.5 1.5 1.5 1.0 1.0 1.0Ether extracts % 2.0 2.0 2.0 2.5 2.5 2.5NDF % 40 44 36 60 68 52ADF % 30 34 26 40 48 32Lignin % 7.0 8.8 5.4 6.5 8.5 4.5Ash % 10 10 10 7 7 7RUP %CP 25 25 25 30 30 30RUPd % RUP 70 70 70 65 65 65Effective NDF % NDF 92 92 92 98 98 98
TDN from NFC % 29.9 29.9 29.9 22.1 18.1 26.0TDN from NDF % 15.4 15.8 14.8 28.3 30.8 25.9TDN from CP % 18.3 14.3 22.3 10.9 6.9 14.8TDN from EE % 2.3 2.3 2.3 3.4 3.4 3.4TDN at 3X % 54.0 50.7 57.1 52.9 47.9 57.9NEL at 3X Mcal/cwt 57.6 51.5 63.5 53.0 44.6 61.5MP at 3X % 7.99 7.02 8.95 6.73 5.55 7.94
———————————————- Units per Ton ———————————————NEL Mcal 1014.2 906.7 1118.1 932.6 785.5 1082.3MP lbs 140.7 123.5 157.6 118.6 97.6 139.7eNDF lbs 647.7 712.4 582.9 1034.9 1172.9 896.9neNDF lbs 56.3 62.0 50.7 21.1 23.9 18.3
1NDICP = NDF insoluble crude protein; ADICP = ADF insoluble crude protein; NDF = neutral detergent fiber; ADF= acid detergent fiber; RUP = rumen undegradable protein; RUPd = RUP digestibility; TDN = total digestiblenutrients; NEL at 3X = net energy for lactation calculated at an intake of 3 times maintenance; MP at 3X =metabolizable protein calculated at 3 times maintenance.
14

Table 3. Nutrient unit prices across 3 regions1, April, 2012.
Nutrients Northeast Midwest WestNEL (¢/Mcal) 20.8 15.2 18.4MP (¢/lb) 18.8 27.2 20.4eNDF (¢/lb) -3.3 -0.2 8.5neNDF (¢/lb) -18.6 -7.1 -4.21 Northeast prices are for NY and northern PA; Midwest prices are for WI and eastern MN; West prices are for theSan Joaquin Valley of CA.
Table 4. Calculation of the value of the nutrients in one ton of the reference alfalfa hay using average nutrient unitprices from January 2011 through March 2012.
DM Mcal or Unit Prices ValueComposition % Pounds per
Ton ¢ $/tonNEL (Mcal/cwt) 57.6 88 1014.2 16.5 167.34MP (% DM) 7.99 88 140.7 23.6 33.20eNDF (% DM) 36.8 88 647.7 3.6 23.31neNDF (% DM) 3.2 88 56.3 -8.7 -4.90Total 218.95
Table 5. Value ($/ton) of alfalfa and grass hay of 3 quality levels, Midwest, January 2011 to March 2012.
Feeds Average SD1 Min MaxAlfalfa - Reference 241 37 193 302
- Low 204 36 162 265- High 277 38 223 338
Grass - Reference 191 46 145 271- Low 129 47 77 210- High 253 47 197 332
1 SD = standard deviation.
Table 6. Average contribution of NEL, MP, eNDF, neNDF, and milk response to the value of our reference alfalfaand grass hays between January 2011 and March 2012.
Alfalfa GrassComponent $/ton % of Total $/ton % of TotalNEL 154.55 64.0 141.75 73.7MP 43.75 18.2 36.88 19.2eNDF 30.44 12.6 48.64 25.3neNDF -4.78 -2.0 -1.79 -0.9Milk 17.29 7.2 -33.26 -17.3Total 240.86 100.0 192.21 100.0
15

Table 7. Marginal change in value of forage hay ($/ton) from a one-unit increase in each of the compositionalentries between January 2011 and March 2012.
Change in forage value ($/ton)Composition entries Alfalfa - Reference Grass - ReferenceDry matter (%) 2.73 2.19Crude protein (% DM) 2.12 2.23NDICP (% DM) 1.28 1.14ADICP (% DM) -5.17 -5.01Ether Extracts (% DM) 4.72 4.72NDF (% DM) -4.96 -5.10Lignin (% DM) -4.42 -5.38Ash (% DM) -3.68 -3.67RUP (% CP) 0.76 0.43RUPd (% RUP) 0.27 0.20NDF Effectiveness (% NDF) 0.93 1.40
Figure 1. Price of nutrients in the Midwest from January 2005 through March 2012. NEl$ = Net energy for lactation ($/Mcal), MP$ = metabolizable protein ($/lb), and e-NDF$ = effective NDF ($/lb).
Figure 2. Relationship between whole diet total tract in vivo NDF digestibility (TT-NDFd) expressed as deviationfrom a control diet and in vitro NDF digestibility (NDFd).
16

Feed prices for the last 5 years have been at historichighs. Coupled with periods of low milk prices, thishas resulted in extremely tight (sometimes negative)margins for dairy producers. The ability ofruminants to convert lower digestibility feedstuffs(forages and other high fiber feeds) into useableproducts has always been a positive attribute and onethat has historically allowed the use of lower costfeedstuffs, often by-products which would be wastedotherwise. However, higher feed prices have affectedeven these lower cost feeds. Thus, the need toevaluate and try to manipulate the conversion of feedto products has been a focus, even in the dairyindustry, where it has not been a traditional area ofconcentration.
Other production livestock species (poultry, swine,beef) have focused heavily on feed efficiency (feedconversion), the efficiency at which feed is convertedto saleable products (i.e., eggs, chicken, pork, beef), asit is one of the main factors, affecting profitability.The dairy industry has been slower to focus on feedefficiency and has primarily been driven to do sowith higher feed prices. But now feed efficiency ormaybe better a better term, feed conversion (feedconverted to milk components), has become a focusin the dairy industry.
Traditionally, feed related factors have been the focuswhen evaluating feed efficiency. We Foragedigestibility, feed particle size, protein levels, fatlevels, starch levels and certain feed additives canaffect feed efficiency. Feed related factors have beenthe focus because that’s what nutritionists know best,and feel they can control the most. Certain cow andenvironmental factors (i.e., days in milk, lactationnumber, heat stress, exercise and acidosis) can affectfeed efficiency. However, these can be more difficultto control and manage.
One additional area that has not been a focus when itcomes to feed efficiency is cow comfort. Cowcomfort issues can affect milk production andcomponents, reproduction and general health, butthese effects in relation to feed efficiency have nottraditionally been an area of focus. Many times,these factors can have greater impact on feedefficiency than feed related factors.
The focus of this presentation will be exploration ofboth feed and non-feed related factors that can havean effect on feed efficiency with a focus on cowcomfort issues. Opportunities to improve feedefficiency, productive efficiency and profitabilitythrough improvements in management will bediscussed.
Optimizing Feed Efficiency:Feed and Non-feed Factors
Jim Sullivan, Ph.D., PAS-Technical Manager-US Dairy Business Unit-Novus [email protected]
17

Dr. Conner is a native of California where he obtained aBachelors degree in 1974 from Cal Poly, San Luis Obispo.He completed his Masters degree in 1977 at Texas A&MUniversity studying lanthanides as ruminant flow markers.Mike then worked with a feed additive companyoverseeing FDA drug registration and compliance for beefcattle feedlots. He then completed his Doctoral degreefrom Texas Tech University in 1985 focusing on chemicaltreatment of cotton gin trash for use by ruminants. Dr.Conner was a feedlot nutritionist with a Midwestern feedcompany and then moved to Tennessee Eastman Companywith development and technical service responsibilities in
the Midwest U.S. He joined Purina Mills, in 1988, as adairy consultant in Texas before becoming an independentdairy consultant in 1991. Dr. Conner currently consultswith dairies in Texas, Oklahoma, New Mexico and Arizonaand also serves as an Expert Legal Witness in dairylitigation. Concurrent with his dairy consultation, Dr.Conner consults with companies to develop and reviewnutrition products for use in ruminant diets. Previousresearch and publications have focused on tallow use inruminants, branch chain fatty acid utilization by beef anddairy cattle and utilization of cotton plant residues bycattle.
BIOGRAPHYMichael C. Conner, PH.D.398 CR 539, Hico, Texas
17a

Mike DeGroot has been an independent dairynutrition and management consultant for seven and ahalf years. He received a B.S. degree in Dairy Scienceand Agribusiness from Cal Poly, San Luis Obispo.He obtained his M.S. degree from Fresno StateUniversity in ruminant nutrition and his Ph. D. inruminant nutrition from Oregon State University.His areas of focus included transition cows andfeeding behavior. Mike consults on over 20 dairies inCalifornia and New Mexico. He has been active inthe industry through the California ARPAS chapterwhere he coauthored a paper on the Variability inChemical Composition and Digestibility of Twelve By-Product Feedstuffs Utilized in the California DairyIndustry. (Professional Animal Scientist 2007 23:148-163).Mike has been on the California Animal NutritionConference Committee for the past 7 years and waschair of the conference in 2011. He has been involvedwith several on farm trials including working withniacin in transition cows. Dr. DeGroot is a guestlecturer at Cal Poly as he sees a need to tie industryin with academia.
How I deal with volatile markets and high feedprices:
1) It is on a herd to herd basis2) We are using a program that we created that
looks at feed value based on current marketprices. We are not afraid to changeingredients as long as we have some measureon whether it worked or not.
3) Depending on herd logistics, I will try tomaintain my fresh and high cows as long aspossible and slowly cut the low rations to seewhere we end up.
4) Utilize tools such as BCS and weight to makesure that we are as accurate as we can be onour inputs in the program and to ensure thatwe can keep the ration cost down as much aspossible.
Feed efficiency:1) It is one of several measurements that I look
at. I think IOFC goes hand and hand with FE2) It is something that we use within herd to see
if things are changing. Based on herdlogistics it can vary by up to two tenths of apoint during certain times of year.
3) Physical characteristics of the ration play ahuge factor in feed efficiency
4) Weigh back or push out is crucial to getting agood accurate number. Not too many of ourherds do weigh back every day. However, Ifeel that it is a good number to have andshould be monitored.
5) Decrease the amount that you will let yourfeeder increase or decrease on a daily basis.This will keep the herd from going throughswings of dry matter intake where sometimesthey are low and other times high, which isnot good for efficiency.
Michael DeGroot
17b

BACKGROUNDGrew up on our family dairy and crop farm inPennsylvania
EDUCATIONGraduate of University of PA School of VeterinaryMedicine in 1979
CAREERVeterinarian with Lancaster Veterinary Associates1979 to present.Provide veterinary and production medicine servicesincluding routine ration formulation andtroubleshooting to dairy clients.
PROFESSIONAL ASSOCIATIONS:American Veterinary Medical Association, AmericanAssociation of Bovine Practitioners, ProfessionalDairy Managers of Pennsylvania, American Registryof Professional Animal Scientists.
DEALING WITH VOLATILE MARKETS:The constant challenge of any business is tomaximize margins, maintain cash flow, and minimizerisks. As markets become more volatile this principledoes not change. The same is true for a dairyenterprise. Feed costs are the single largest expenseto a dairy. The challenge always is to utilizeingredients that give the best bang for the buck.Know what is going into the ration and what isexpected from each ingredient. Balancing rationsbased upon metabolizable energy and metabolizableprotein has been a great step forward in myexperience. Evaluate results of formulation changes.Profitability and economic survival starts withhealthy cows, reproductive efficiency, high qualityforages, and good yields on home grown crops. Usehome grown, on farm feeds as much as possible andstrategically to maintain cash flow. Use appropriateprofessionals to help manage contracts for feed andmilk to minimize risk in the markets. Track healthand culling losses in the herd for areas of weaknessthat need to be corrected. Evaluate replacementprograms for unnecessary expenses. Track feedefficiency to serve as a monitor of changes innutrition and herd dynamics as conditions changeover time. Know why feed efficiency is on the lowor high side of a 1.4 to 1.6 ratio. Look at the wholeherd management program. While the nutritionalprogram is crucial, it’s not the only factor that causedfluctuations in feed efficiency and herd profitability.
Lancaster Veterinary AssociatesRobert Stoltzfus VMD
136 Main StreetSalunga, PA 17538
17c

SUMMARY• Carbohydrates, NDF and NFC, comprise about 70%of DM in diets for lactating cows.
• While diets containing 21% forage-NDF arecommon, depending on forage availability, price andquality, diets can be found within a normal range of16% - 24% forage-NDF (DM basis).
• Maximum NFC guidelines are positively related toforage-NDF content in diets for lactating cows.
• Starch is the major component of the NFC fraction;ruminal and (or) total-tract digestibility of starchvaries depending largely on grain type andprocessing.
• Increased corn prices have created much interest inthe potential for feeding reduced-starch diets.
• Feed efficiency and IOFC results from thecontinuous lactation trials reviewed herein indicatethat, for high producing cows in mid lactation,partially replacing corn grain with NDF from eitherhigh-fiber byproducts or corn silage to formulatereduced-starch diets was not beneficial.
• Rumensin® increased milk production efficiencywhen added to both normal- and reduced-starchdiets.
• Diets containing about 6% total sugar (DM basis)appear to be optimum.
• Greater extent of high-moisture corn fermentation inthe silo increases starch digestibility, apparentlythrough degradation of the starch-protein matrix asreflected by increased ammonia concentrations.
INTRODUCTIONThe carbohydrate fraction, which includes neutraldetergent fiber (NDF) and non-fiber carbohydrate (NFC),comprises approximately 70% of diets for lactating dairycows (DM basis). Meeting a minimum forage-NDFguideline is important for providing sufficient physically-effective NDF (peNDF) to support good rumen function,while exceeding a maximum forage-NDF guideline mayrestrict dry matter intake (DMI) through rumen filllimitation.
1Adapted from papers presented at 2012 SouthwestNutrition Conference (Tempe, AZ) and 2012 Tri-State DairyConference (Ft. Wayne, IN).
When forages are limited and (or) relatively expensive thediet formulations trend toward forage-NDF minimums,while when forages are abundant and (or) are relativelyinexpensive the diet formulations trend toward forage-NDFmaximums. The Dairy NRC (2001) carbohydrateguidelines reflect a positive relationship between dietaryforage-NDF and total NFC, such that the maximum totalNFC guideline is reduced for a 16%-forage-NDF diet(38%) compared to a ≥19%-forage-NDF diet (44%; DMbasis). This can be accomplished by using a greaterproportion high NDF-low NFC byproduct feed ingredientsin reduced-forage-NDF diets, and a greater proportion oflow NDF-high NFC grains in higher-forage-NDF diets.
While diets containing 21% forage-NDF (DM basis; i.e.50% dietary forage with an average NDF content of 42%)are common in the field, depending on forage availability,price and quality, diets can be found within a normal rangeof 16% (i.e. 35% dietary forage with an average NDFcontent of 46%) to 24% forage-NDF (i.e. 60% dietaryforage with and average NDF content of 40%). In additionto these widely divergent dietary forage-NDF contents, thedietary forage-NDF fraction can vary greatly in peNDFdepending largely on particle size and digestibilitydepending largely on lignin content. Furthermore, thedietary NFC fraction is not homogenous and is comprisedof varying proportions of starch, sugars, pectin and organicacids, and also can vary in ruminal and (or) total tractdigestibility, at least in the case of starch, dependinglargely on grain type and processing.
The optimum starch content of diets for lactating dairycows is not well defined, but 25% starch (DM basis) hasbeen suggested based on a review of published feedingtrials (Staples, 2007). Shaver (2010) reported on surveys ofhigh-producing commercial dairy herds performed inWisconsin and Michigan with dietary starch concentrationsaveraging 27% and ranging from 25% to 30% in dietscontaining 21% forage-NDF on average (DM basis).Increased corn prices, however, have created much interestin the potential for feeding reduced-starch diets.Coincident with the interest in reduced-starch diets is arenewed focus on increasing the digestibility of starch bydairy cows. The topics of reduced-starch diets and starchdigestibility will be reviewed and discussed in this paper.
REDUCED-STARCH DIETSResults from published short-term switchback experiments
Balancing Carbohydrate Sources for DairyCows during a Period of High Corn Prices1
Matt Akins, Luiz Ferraretto, Shane Fredin, Pat Hoffman and Randy ShaverDepartment of Dairy Science
University of Wisconsin - Madison
18

suggest that reduced-starch diets are feasible for lactatingdairy cows (Shaver, 2010). Longer-term continuouslactation feeding trials, however, are likely moreappropriate than short-term switchback trials for evaluatingthe effect of reducing dietary starch content on feedefficiency, BW change and income over feed cost (IOFC).Lactation performance responses to reduced-starch dietsfrom five recent continuous lactation experiments will bediscussed herein. Four trials were from UW-Madison (UW;Gencoglu et al., 2010; Ferraretto et al., 2011a,b; Akins etal., 2012) and evaluated high NDF-low starch byproductfeeds as partial corn grain replacers, while a trial from theOhio Agricultural Research and Development Center(OARDC; Weiss et al., 2011) evaluated the partialreplacement of corn grain with corn silage. The forage-NDF concentrations were 20%-21% across all diets with5% to 10%-units less starch for reduced-starch (RS) thannormal-starch (NS) diets in the UW trials. For the OARDCtrial, forage-NDF concentrations were 23% and 26% forthe NS and RS diets, respectively, with 5%-units lessstarch for RS than NS diets. Across the five trials, theearliest and latest days in milk at trial initiation were 51and 114 d, respectively, and treatment length ranged from10 to 14 wk. Milk yield for cows fed the NS diet rangedfrom 38 kg to 52 kg/cow/d across the four trials.
Dry matter intake was greater for RS than NS in 3 of 4UW trials (unaffected by treatment in Akins et al., 2012),but lower for RS than NS in the OARDC trial. GreaterDMI for RS than NS in the UW trials may be related toreduced ruminal propionate concentration (Allen, 1997;Beckman and Weiss, 2005) leading to increased meal sizeand consequently greater DMI (Allen et al., 2009). Firkins(1997) suggested that increased digestibility and passagerate of byproduct NDF can allow for increased NDF intakerelative to forage NDF, which could explain the differencein DMI response for RS between the UW trials and theOARDC trial. In other words rumen fill likely limited DMIin the OARDC trial (23% to 26% forage-NDF), but not inthe UW trials (20% to 21% forage-NDF), where metaboliccontrol of DMI appears to have been more likely (Allen etal., 2009).
Actual milk yield was similar for cows fed RS and NS in 2of 3 UW trials with soy hulls (SH; Gencoglu et al., 2010;Ferraretto et al., 2011b), was lower (P < 0.01) for RS thanNS in the SH trial of Akins et al. (2012), and tended (P <0.07) to be 4% lower for RS than NS in the UW trial withwhole cottonseed (WCS) and wheat middlings (WM;Ferraretto et al., 2011a). Because WCS and WM aremoderate-protein ingredients, they partially replaced bothcorn grain and soybean meal (SBM) in the RS diet. Greaterruminal protein degradation for these ingredients comparedto SBM along with reduced rumen microbial proteinproduction for RS may have decreased metabolizableprotein flow, which could partially explain the decrease inmilk yield (NRC, 2001). Actual milk yield was lower (P <0.05) for RS than NS in the OARDC trial and was
consistent with the DMI response in that trial. Responsesfor milk yield corrected for concentrations of fat, proteinand lactose (solids-corrected milk; SCM) were inconsistentfor the UW trials with either greater (P < 0.03; Gencoglu etal., 2010), trend for lower (P < 0.08; Ferraretto et al.,2011b), or similar (P > 0.10; Ferraretto et al., 2011a; Akinset al., 2012) SCM observed for RS compared to NS. TheSCM yield was lower (P < 0.05) for RS than NS in theOARDC trial and was consistent with the actual milk yieldand DMI responses in that trial. Body weight gain was notdifferent for cows fed RS compared to cows fed NS acrossthe five trials.
Feed efficiencies, across the five trials, were reduced forRS compared to NS by 2% to 12% for Milk/DMI and by1% to 11% for SCM/DMI. Reduced feed efficiency fordairy cows fed RS diets creates an economic concern fornutritionists desiring to use this formulation strategy toreduce diet cost per unit of DM. Midwest USA December-2011 market prices for feed ingredients and milk wereapplied to ration composition, DMI and milk productiondata from the four trials to estimate feed costs and IOFC.Feed costs per unit DM were reduced in 4 of 5 trials by1% to 6% for RS. Feed costs per cow per day for RS,however, were increased for three trials by 1% to 8% anddecreased for two trials by 1% to 7%. Estimates of IOFCwere increased in one trial by 2% for RS, and decreased infour trials by 2% to 7% for RS.
Feed efficiency and IOFC results indicate that for highproducing cows in early to mid lactation, partiallyreplacing corn grain with NDF from either high-fiberbyproducts or corn silage to formulate RS diets was notbeneficial. Reduced market prices for high-fiberbyproducts relative to corn grain and soybean meal wouldimprove the economics of feeding RS compared to NSdiets. Use of higher quality corn silage with reduced NDFcontent and (or) greater NDF digestibility when partiallyreplacing corn grain with corn silage in RS diets mayimprove responses compared to the trial reviewed herein,and further research is warranted. Furthermore, RS dietsformulated by partially replacing starch with fiber mayoffer more potential for beneficial responses when fed tolower producing, later lactation cows than evaluated in thetrials reviewed herein; potentially less concerns aboutrumen fill limitations to DMI and milk yield when partiallyreplacing starch with forage NDF or reduced feedefficiency when partially replacing starch with byproductNDF (Allen, 2008).
Based on the previous UW trial results with RS diets,Akins et al. (2012) hypothesized that Rumensin® wouldreduce DMI and thus improve milk production efficiencymore with RS than NS diets. One-hundred twenty eightcows (90 ± 33 days in milk) were stratified by breed,parity and days in milk, and randomly assigned to one of16 pens with 8 cows each per pen in the UW-MadisonEmmons-Blaine Arlington free-stall barn. Pens were
19

randomly assigned to 1 of 4 treatments in a 2 × 2 factorialdesign (formulated dietary starch content (RS (21%) vs.NS (27%)) and Rumensin® (0 g/ton (Control) vs. 18 g/ton(Rumensin®)) inclusion as main effects) for a continuouslactation trial. During the 4 week covariate period all cowswere fed the NS diet with 18 g/ton Rumensin® (NSR)followed by a 12 week treatment period with cows fedtheir assigned treatment diets of NSR, NS with 0g/tonRumensin®, RS with 0 g/ton Rumensin®, and RS with 18g/ton Rumensin®. Diets were in a TMR mixed and fedonce daily. Inclusion of Rumensin® at 18 g/ton DMimproved lactation performance, specifically milkproduction efficiency, on both RS and NS diets (Figure 1).There were few significant interactions of starch andRumensin®, thereby supporting the use of Rumensin® inboth lactation diets tested in this study.
Broderick and Radloff (2004) partially replaced starchfrom high-moisture shelled corn (HMC) with sugar fromeither dried (Trial 1) or liquid (Trial 2) molasses. Dietarystarch and total sugar concentrations (DM basis) rangedfrom 31.5% to 23.2% and 2.6% to 7.2%, respectively, inTrial 1, and from 31.4% to 26.1% and 2.6% to 10.0% inTrial 2. Cows averaged 128 and 85 DIM at trial initiationfor Trials 1 and 2, respectively, and were on treatment for 8wk. The estimated overall optimum for total dietary sugar,based on yields of fat and FCM in Trial 1 and yields ofmilk and protein in Trial 2, was 5.0% (DM basis); feedingdiets with more than 6% total sugar with the added sugarfrom molasses appeared to depress milk production.Broderick et al. (2008) partially replaced corn starch withsucrose. Dietary starch and total sugar concentrations (DMbasis) ranged from 28.2% to 21.5% and 2.7% to 10.0%,respectively. Cows averaged 77 DIM at trial initiation, andwere on treatment for 8 wk. Milk yield was unaffected bytreatment, but milk fat yield was greatest for the dietcontaining 7.1% total sugar and 24.5% starch (DM basis).Alternatives for high-sugar ingredients include molasses,whey, whey permeate, liquid feed supplements, andsucrose. Evaluate prices of these ingredients (sugar)relative the price of corn (starch) to determine appropriatesupplementation strategies.
DIGESTIBILITY OF CORN GRAIN STARCHThe impact of the digestibility of corn grain starch onlactation performance by dairy cows was reviewed byFirkins et al. (2001). Greater starch digestibility increasedmilk and protein yields. Research is limited, however, withregard to the impact of increasing starch digestibility in RSdiets on lactation performance by dairy cows.Three experiments evaluated the addition of exogenousamylase to RS diets (Gencoglu et al., 2010; Ferraretto etal., 2011b; Weiss et al., 2011). Gencoglu et al. (2010)reported that fat-corrected milk (FCM), SCM and energy-corrected milk (ECM) feed efficiencies (kg/kg DMI) were12% to 13% greater for cows fed the RS diet with amylasethan for cows fed the RS diet without added amylase.Amylase addition to RS diets tended (P < 0.09) to increase
the actual milk feed efficiency by 6% in the Ferraretto etal. (2011b) trial, but was ineffective in the OARDC trial.Across these three trials with RS diets and in the trial ofKlingerman et al. (2009) with NS diets, dietary addition ofexogenous amylase more consistently increased NDFdigestibility than starch digestibility. More research onexogenous amylase addition to both NS and RS diets iswarranted.
Total tract digestibility of starch by dairy cows rangesbetween 70% and 100% (Firkins et al., 2001) with a hostof factors that influence starch digestibility. These factorsinclude particle size (fine ground vs. coarse rolled), grainprocessing (steam flaked vs. dry rolled), storage method(dry vs. HMC), moisture content and duration of silofermentation for HMC, and type of corn endosperm(Firkins et al., 2001; Hoffman et al., 2011; Nocek andTamminga, 1991).
Kernel vitreousness, the ratio of vitreous to flouryendosperm, has been used to assess type of cornendosperm (Ngonyamo-Majee et al., 2008a, b). Increasedkernel vitreousness was related to reduced ruminal in situcorn starch degradation (Correa et al., 2002; Ngonyamo-Majee et al., 2008b). Kernel vitreousness was lower andruminal in situ starch degradation was greater for dry cornwith floury or opaque endosperm compared to normal dentendosperm (Ngonyamo-Majee et al., 2008a, b). Taylor andAllen (2005) reported greater ruminal and total tract starchdigestibilities in ruminally and duodenally cannulatedlactating dairy cows for floury (3% vitreousness) thannormal dent (67% vitreousness) endosperm dry corn. Highly vitreous corn types contain greater concentrationsof prolamin proteins than floury or opaque corn types(Larson and Hoffman, 2008). Starch granules in the cornendosperm are surrounded by hydrophobic prolaminproteins which are slowly degraded (McAllister et al.,1993). Lopes et al. (2009) conducted an experiment toevaluate the effect of type of corn endosperm on nutrientdigestibility in lactating dairy cows using near-isogenicvariants of a normal dent endosperm hybrid carryingfloury-2 or opaque-2 alleles. The percentage vitreousendosperm was zero for floury and opaque endospermcorns and 64% for the vitreous corn. Prolamin proteincontent of floury and opaque endosperm corns was 30% ofthe content found in vitreous corn. Starch disappearanceafter 8-hr ruminal in situ incubation was 32%-units onaverage greater, respectively, for floury and opaqueendosperm corns than vitreous corn. Total-tract starchdigestibility was 6.3%-units, on average, greater for cowsfed diets containing floury and opaque endosperm cornsthan vitreous corn.
Hoffman and Shaver (2009) developed a corn grainevaluation system (UWFGES) for dairy cows where total-tract starch digestibility, energy value, and relative grainquality index are predicted from equations that includestarch content, mean particle size, prolamin protein
20

content, and whether or not the corn is dry or HMC (>22.5% moisture). This system as originally proposed,however, does not account for effects of varying cornmaturities, moisture contents or extents of silofermentation. Hoffman et al. (2011) reported that ensilingHMC for 240 d reduced zein protein subunits that cross-link starch granules, and suggested that the starch-proteinmatrix was degraded by proteolytic activity over anextended ensiling period. This could explain reports ofgreater ruminal in situ starch degradability for HMC withgreater moisture contents and duration of silo fermentation(Benton et al., 2005). The Larson and Hoffman (2008)turbidity assay determination of total zein protein contentdid not detect a reduction in zein protein subunits over theensiling period for HMC as measured by high-performanceliquid chromatography (HPLC; Hoffman et al., 2011).Ammonia content increased, however, as HPLC zeinprotein subunits in HMC decreased (Hoffman et al., 2011),and ammonia nitrogen has been suggested in combinationwith mean particle size for modeling the effects of cornmaturity, moisture content and length of silagefermentation time on ruminal and total-tract starchdigestibilities and rate of ruminal starch degradation forHMC at feed out (Hoffman et al., 2012).Effects of wide differences in corn grain vitreousness orprolamin, i.e. flinty or vitreous corn versus floury oropaque corn, on starch digestibility have beendemonstrated (Correa et al., 2002; Ngonyamo-Majee et al.,2008a, b; Lopes et al., 2009; Taylor and Allen, 2005).However, incorporation of these corn endosperm propertiesinto corn breeding or hybrid selection programs for dairycattle feed has been, and continues to be, slow to evolve.Until the recent extended period of high corn prices therehad not been much interest in increasing starchdigestibility by exploiting corn’s genetic traits. Recentinterest in feeding RS diets, however, has spawned a muchgreater interest in this area. Furthermore, the potential forreduced vitreousness or prolamin corn to reduce the costand management of corn processing methods and qualitycontrol and HMC maturity, moisture content and durationof fermentation is of interest to some in the industry; moreresearch is needed, however, to better evaluate thesepotential interactions.
While interest has increased along with on-going research,practical challenges to pursuing reduced vitreousness orprolamin corn remain. The relative importance of kernelvitreousness or prolamin appears to be as follows: dry corn> HMC > corn silage. The normal co-mingling of dry cornthat occurs through grain elevators and feed industrychannels makes it very difficult to alter these parameters atthe feed manufacturer or farm level, and HMC and cornsilage comprise more of a niche market for the seed cornindustry. Incorporation of these parameters into routinecorn hybrid selection programs requires NIRS calibrations,which are not available on an industry-wide basis at thispoint. The potential for pollen drift (Thomison, 2002) tocompromise small replicated field plot hybrid evaluations
for endosperm properties warrants more scrutiny. Nitrogenfertility can influence the prolamin content of corn grain(Masoero et. al, 2011; Tsai et al., 1978), which couldconfound comparisons of field plot evaluations for thisparameter across locations or companies. Importantagronomic traits, such as yield and starch content, will alsoneed to be evaluated relative to hybrid differences forvitreousness or prolamin. Much translational research isstill needed for progress to be made in this area.CORN SILAGE FERMENTATION AND STARCHDIGESTIBILITY
Newbold et al. (2006) reported that ruminal in situ starchand crude protein degradabilities increased for corn silageas the length of silage storage time increased. Increasedcorn silage in vitro starch digestibility with greater lengthof silage storage time was reported by Hallada et al. (2008)and Der Bedrosian et al. (2010). Young et al. (2011)reported that the addition of protease enzymes and greaterlength of the ensiling period increased ammonia nitrogencontent and ruminal in vitro starch digestibility of cornsilage. The DairyOne (Ithaca, NY) on-line data base(http://www.dairyone.com/) reveals that for over 12,000corn silage samples analyzed from May-2000 throughApril-2011, ammonia nitrogen averaged 7.1% of totalnitrogen with a normal range from 3.0 to 11.1%. In ouranalysis of a dataset provided by Dairyland Labs (Arcadia,WI) with over 1,900 corn silage samples, ammonianitrogen averaged 5.7% of total nitrogen with a normalrange from 2.7 to 10.7%. Additionally, in our analysis of adataset provided by Cumberland Valley Analytical Services(Maugansville, MD) with about 44,000 corn silage samplesfrom May-2007 through February-2012, ammonia nitrogenaveraged 9.6% of total nitrogen with a normal range from7.8 to 11.4%. Corn silage DM content explained almostnone of the ammonia nitrogen variation in either dataset,which may not be too surprising since length of silagefermentation prior to on-farm sampling was unknown andcould have ranged from less than a few weeks to over ayear in storage. Research is needed to determine theeffectiveness of ammonia nitrogen content in combinationwith some measure of particle size, possibly processingscore (Ferreira and Mertens, 2005), for predicting cornsilage starch digestibility parameters.
REFERENCESAkins, M. S., K.L. Perfield, H. B. Green, R.D. Shaver. 2012.
Effects of Rumensin in lactating cow diets with differingstarch levels. Proc. High Plains Dairy Conf. Amarillo, TX.
Allen, M. S. 2008. Grouping lactating cows. Pages 1-6 in Proc.Pacific NW Anim. Nutr. Conf. Tacoma, WA.
Allen, M. S. 1997. Relationship between fermentation acidproduction in the rumen and the requirement for physicallyeffective fiber. J. Dairy Sci. 80:1447-1462.
Allen, M. S., B. J. Bradford, and M. Oba. 2009. The hepaticoxidation theory of the control of feed intake and itsapplication to ruminants. J. Anim. Sci. 87:3317-3334.
Beckman, J. L., and W. P. Weiss. 2005. Nutrient digestibility ofdiets with different fiber to starch ratios when fed tolactating dairy cows. J. Dairy Sci. 88:1015-1023.
21

Benton, J.R., T. Klopfenstein, and G.E. Erickson. 2005. Effectsof corn moisture and length of ensiling on dry matterdigestibility and rumen degradable protein. Nebraska BeefCattle Reports: 31-33.
Broderick, G. A., N. D. Luchini, S. M. Reynal,G. A. Varga, and V.A. Ishler. 2008. Effect on production of replacing dietarystarch with sucrose in lactating dairy cows. J. Dairy Sci.91:4801-4810.
Broderick, G.A., and W. J. Radloff. 2004. Effect of molassessupplementation on the production of lactating dairy cowsfed diets based on alfalfa and corn silage. J. Dairy Sci.87:2997-3009.
Correa, C. E. S., R. D. Shaver, M. N. Pereira, J. G. Lauer, and K.Kohn. 2002. Relationship between corn vitreousness andruminal in situ starch degradability. J. Dairy Sci. 85:3008-3012.
Der Bedrosian, M. C., L. Kung, Jr., K. E. Nestor, Jr. 2010. Theeffects of length of storage on the composition and nutritivevalue of corn silage. J. Dairy Sci. 93(E-Suppl. 1):176(Abstr.).
Ferraretto, L. F., R. D. Shaver, and S. J. Bertics. 2011a. Effect oflive-cell yeast at two dosages on lactation performance bydairy cows. J. Dairy Sci. (Suppl. 1):131(Abstr.).
Ferraretto, L. F., R. D. Shaver, M. Espineira, H. Gencoglu, and S.J. Bertics. 2011b. Influence of a reduced-starch diet with orwithout exogenous amylase on lactation performance bydairy cows. J. Dairy Sci. 94:1490-1499.
Ferreira, G., and D. R. Mertens. 2005. Chemical and physicalcharacteristics of corn silages and their effects on in vitrodisappearance. J. Dairy Sci. 88:4414-4425.
Firkins, J. L. 1997. Effects of feeding nonforage fiber sources onsite of fiber digestion. J. Dairy Sci. 80:1426-1437.
Firkins, J. L., M. L. Eastridge, N. R. St-Pierre, and S. M.Noftsger. 2001. Effects of grain variability and processing onstarch utilization by lactating dairy cattle. J. Anim. Sci. 79(E.Suppl.): E218-E238.
Gencoglu, H., R. D. Shaver, W. Steinberg, J. Ensink, L. F.Ferraretto, S. J. Bertics, J. C. Lopes, and M. S. Akins. 2010.Effect of feeding a reduced-starch diet with or withoutamylase addition on lactation performance in dairy cows. J.Dairy Sci. 93: 723-732.
Hallada, C. M., D. A. Sapienza, and D. Taysom. 2008. Effect oflength of time ensiled on dry matter, starch and fiberdigestibility in whole plant corn silage. J. Dairy Sci. 91(E-Suppl. 1):30 (Abstr.).
Hoffman, P.C., N.M. Esser, R.D. Shaver, W.K. Coblentz, M.P.Scott, A.L. Bodnar, R.J. Schmidt and R.C. Charley. 2011.Influence of ensiling time and inoculation on alteration ofthe starch-protein matrix in high moisture corn. J. Dairy Sci.94:2465-2474.
Hoffman , P.C., D.R. Mertens, J. Larson, W.K. Coblentz and R.D.Shaver. 2012. A Query for Effective Mean Particle Size ofDry and High Moisture Corns. J. Dairy Sci. In press.
Hoffman, P.C., and R.D. Shaver. 2009. UW Feed GrainEvaluation System. Accessed Jan. 13, 2012.http://www.uwex.edu/ces/dairynutrition/documents/WisconsinFGES.pdf
Klingerman, C. M., W. Hu, E. E. McDonell, M. C. DerBedrosian,and L. Kung, Jr. 2009. An evaluation of exogenous enzymeswith amylolytic activity for dairy cows. J. Dairy Sci.92:1050-1059.
Larson, J., and P. C. Hoffman. 2008. Technical Note: A method toquantify prolamin proteins in corn that are negatively related
to starch digestibility in ruminants. J. Dairy Sci. 91:4834-4839.
Lopes, J. C., R. D. Shaver, P. C. Hoffman, M. S. Akins, S. J.Bertics, H. Gencoglu, and J. G. Coors. 2009. Type of cornendosperm influences nutrient digestibility in lactating dairycows. J. Dairy Sci. 92:4541–4548.
McAllistar, T. A., R. C. Phillippe, L. M. Rode, and K. J. Cheng.1993. Effect of the protein matrix on the digestion of cerealgrains by ruminal microorganisms. J. Anim. Sci. 71:205-212.
Masoero F., A.Gallo, C.Zanfi, G.Giuberti, and M.Spanghero.2011. Effect of nitrogen fertilization on chemicalcomposition and rumen fermentation of different parts ofplants of three corn hybrids. Anim. Feed Sci. Technol. Inpress.
Newbold, J.R., E.A. Lewis, J. Lavrijssen, H.J. Brand, H. Vedder,and J. Bakker. 2006. Effect of storage time on ruminal starchdegradability in corn silage. J. Dairy Sci. 84(Suppl.1):T94(Abst.).
Ngonyamo-Majee, D., R. D. Shaver, J. G. Coors, D. Sapienza, C.E. S. Correa, J. G. Lauer and P. Berzaghi. 2008a.Relationships between kernel vitreousness and dry matterdegradability for diverse corn germplasm. I. Development ofnear-infrared reflectance spectroscopy calibrations. Anim.Feed Sci. Technol. 142:247-258.
Ngonyamo-Majee, D., R. D. Shaver, J. G. Coors, D. Sapienza andJ. G. Lauer. 2008b. Relationships between kernelvitreousness and dry matter degradability for diverse corngermplasm. II. Ruminal and post-ruminal degradabilities.Anim. Feed Sci. Technol. 142:259-274.
Nocek, J. E., and S. Tamminga. 1991. Site of digestion of starchin the gastrointestinal tract of dairy cows and its effects onmilk yield and composition. J. Dairy Sci. 74:3598-3629.
NRC. 2001. Nutrient Requirements of Dairy Cattle. 7th rev. ed.Natl.
Acad. Sci., Washington, DC.Shaver, R. 2010. Improving Starch Digestibility in Dairy Cows:
Opportunities with Reduced-Starch Diets. Pages 90-93 inProc. Four-State Dairy Nutr. & Mgmt Conf. Dubuque, IA.
Staples, C.R. 2007. Feeding dairy cows when corn prices arehigh. Pages 7-22 in Proc. 44th Florida Dairy ProductionConference. Gainesville, FL.
Taylor, C. C., and M. S. Allen. 2005. Corn grain endosperm typeand brown midrib 3 corn silage: Site of digestion andruminal digestion kinetics in lactating cows. J. Dairy Sci.88:1413-1424.
Thomison, P. R. 2002. Managing pollen drift in seed maizeproduction. Pages 166-171 in Proc. International SeedSeminar: Trade, Production and Technology. Santiago, Chile.Accessed April 1, 2011.http://www.seedconsortium.org/PUC/pdf%20files/27-Managing%20pollen%20drift%20in%20maize%20seed%20production.pdf
Tsai, C. Y., D. M. Huber, and H. L. Warren. 1978. Relationship ofthe kernel sink for N to maize productivity. Crop. Sci.18:399-404.
United States Department of Agriculture Economic ResearchService. 2011. Feed Grains Data: Yearbook Tables. Corn:Cash prices at principal markets. Accessed March 28, 2011.http://www.ers.usda.gov/Data/FeedGrains/Table.asp?t=12
Weiss, W. P., W. Steinberg, and M. A. Engstrom. 2011. Milkproduction and nutrient digestibility by dairy cows when fedexogenous amylase with coarsely ground dry corn. J. DairySci. 94:2492-2499.
22

Young, K. M., M. C. Der Bedrosian, J. M. Lim, A. P. T. P. Roth,S. A. Santos, and L. Kung Jr. 2011. The effects of proteaseenzymes and storage on the ensiling and nutritive value ofcorn silage. J. Dairy Sci. (Suppl. 1):214 (Abstr.).
Figure 1. Milk/DMI efficiency (lb/lb) of lactating dairycows fed diets with and without Rumensin anddifferent levels of starch. RSC = reduced starch dietwithout Rumensin; RSR = reduced starch diet withRumensin; NSC = normal starch diet withoutRumensin; NSR = normal starch diet with Rumensin.Starch x Rumensin, P = 0.08; SEM = 0.3.
Figure 1. Milk/DMI efficiency (lb/lb) of lactating dairy cows fed diets with and withoutRumensin and different levels of starch. RSC = reduced starch diet without Rumensin; RSR =reduced starch diet with Rumensin; NSC = normal starch diet without Rumensin; NSR = normalstarch diet with Rumensin. Starch x Rumensin, P = 0.08; SEM =
0.3.
1.4
1.45
1.5
1.55
1.6
1.65
RSC NSC RSR NSR
Treatment
lbmilk/lbDMI
23

SummaryConcentration and ruminal digestibility of starch inrations of lactating cows has important effects onproductivity. Starch is more digestible and less fillingthan forage fiber and provides more glucose precursorsthan fiber from any source. Ruminal fermentability ofstarch is affected by grain and endosperm type,processing and conservation method, and diet andanimal factors, and affects production of fermentationacids and microbial protein in the rumen. Excessiveruminal fermentability can decrease fiber digestibility,efficiency of microbial protein production, and alterruminal biohydrogenation, decreasing synthesis of milkfat and increasing energy partitioned to body conditionat the expense of milk.
The concentration and ruminal fermentability of starchaffects feed intake, and energy partitioning of cowsdifferently as they progress through lactation. High-producing cows in early to mid-lactation thrive on high-starch rations with highly fermentable starch sourceswhile starch concentration and fermentability shoulddecrease as lactation progresses to maintain yield ofmilk fat and prevent excessive body condition. Highlyfermentable starch sources should be limited in rationsfor the first two weeks following parturition to avoidfurther depression in feed intake, and decrease risk ofruminal acidosis and displaced abomasum. Groupingcows by physiological state (fresh, early to mid,maintenance) is required to formulate diets for starch tooptimize health and production.
IntroductionStarch is a highly digestible and energy dense feedcomponent that typically ranges from less than 20% togreater than 28% in rations fed to lactating dairy cows.Forages are supplemented with cereal grains to increaseenergy density, provide glucose precursors, and decreasethe filling effects of rations. Starch is composed ofpolymers of glucose (amylose and amylopectin) withbonds that are readily cleaved by mammalian enzymes.However, starch is packaged in granules that areembedded in a protein matrix in the seed endosperm,which varies in solubility and resistance to digestion(Kotarski et al., 1992). These differences in endospermtype have great effects on ruminal fermentability ofstarch, which ranges widely; ruminal fermentability ofstarch from various cereal grains ranges from less than
30% to more than 90% (Nocek and Tamminga, 1991;Firkins et al., 2001). Altering the concentration andruminal fermentability of starch in rations affectsdigestibility of starch (Ngonyamo-Majee et al., 2008),ruminal pH and fiber digestibility (Firkins et al., 2001),and the type, amount, and temporal absorption of fuels(e.g. acetate, propionate, lactate, glucose) available tothe cow (Allen, 2000). This has great effects onlactational performance by affecting energy intake andpartitioning as well as absorbed protein (Allen et al.,2009). In addition, effects on animal performancedepend upon physiological state of cows, which variesgreatly through lactation (Allen et al., 2005). Thereforethe optimum concentration and ruminal fermentabilityof starch in rations of lactating cows vary throughlactation. The objective of this paper is to discuss whatdetermines site of digestion and total tract digestibilityof starch, effects of concentration and ruminalfermentability of starch on animal performance, andconsiderations related to starch for formulating diets forlactating dairy cows.
Starch FermentabilityRuminal fermentability of starch is highly variable andaffected by grain type, vitreousness, processing (e.g.rolling, grinding, steam flaking), conservation method(dry or ensiled), ration composition, and animalcharacteristics. Starch in wheat, barley and oats isgenerally more readily fermented than starch in corn,and starch in sorghum is most resistant to fermentationin the rumen and digestion by the animal (Huntington,1997). These differences are largely because ofdifferences in endosperm type rather than differences instarch composition (amylose vs. amylopectin) per se.Floury endosperm contains proteins that are readilysolubilized, allowing greater access of enzymes to starchgranules while vitreous endosperm contains prolaminproteins that are insoluble and resistant to digestion,decreasing access of enzymes to starch granules(Hoffman and Shaver, 2010). Starch sources vary inamount and proportion of the two types of endospermand there is large variation in vitreousness of theendosperm (percent of the total endosperm that isvitreous) among varieties within certain grain types.Endosperm vitreousness in corn harvested dry rangesfrom 0% to greater than 75% and corn with morevitreous endosperm is more resistant to both particlesize reduction by grinding and digestion (Hoffman et
Adjusting Concentration and RuminalDigestibility of Starch Through Lactation
Mike AllenMichigan State University, 2265A Anthony Hall, East Lansing, MI 48824-1225
Phone: 517-432-1386, FAX: 517-355-0147, Email: [email protected]
24

al., 2010) than corn with more-floury endosperm.Vitreousness increases with increasing maturity atharvest (Phillipeau and Michalet-Doreau, 1997), sodifferences among corn hybrids are greatest when fielddried. Because corn silage is harvested earlier than highmoisture corn, the grain will have less vitreousendosperm and more moisture when harvested from thesame field as whole plant silage compared with high-moisture corn. However, there can be large differencesin vitreousness within corn silage harvested between30% and 40% dry matter and within high moisture cornharvested between 60% and 75% dry matter (40 and25% moisture) from the same field.
When grains are ensiled, ruminal fermentability ofstarch can be greatly affected by both grain moistureconcentration and storage time. This is because ensilingsolubilizes endosperm proteins over time, increasingstarch fermentability. The increase in protein solubilityand starch fermentability over time is greatest for grainswith higher moisture concentration (Figure 1; Allen etal., 2003). Therefore, the change is greatest for wettercorn silage and least for drier, high-moisture corn. Thischange is greatest over the first few months of ensilingand must be anticipated and accounted for whenformulating rations. Because of this, it is recommendedto wait several months after ensiling before feeding cornsilage (Allen, 1998). However, the change continues formonths at a slower rate and corn silage and highmoisture corn stored for long periods (one or two yearsor more) can be difficult to feed in high concentrationsbecause it is so readily fermented.
Processing increases rate of starch digestion and theeffects are greater for grains with more vitreousendosperm such as sorghum and corn (Huntington,1997). Access of enzymes to starch granules isincreased by steam flaking, which causes swelling anddisruption of kernel structure, and reducing particle sizeby rolling or grinding whole grains, or processing silageto crush kernels, which greatly increases surface area.Dry grains can be finely ground, greatly decreasingeffects of endosperm vitreousness on ruminalfermentability. Processing (rolling) corn silage is not aseffective at increasing surface area as fine grinding;processing can reduce, but not eliminate, differences indigestibility of sources varying in vitreousness.
Measuring Starch Concentration and FermentabilityStarch concentration is relatively consistent withincereal grain types but varies greatly within foragescontaining starch such as corn silage and small grainsilages. Therefore, book values for starch concentrationmay be acceptable for cereal grains but starchconcentration must be measured for forages from graincrops. For instance, the starch concentration of cornsilage varies from less than 20 to over 50% of DMdepending upon grain concentration, which, in turn is
dependent upon genetics, environment and maturity atharvest. The starch concentration of corn silage isinversely related to concentration of NDF; fibrousstover fraction of the plant is enriched if kernels don’tfill.
The non-fiber carbohydrate (NFC) concentration ofdiets should not be relied upon as a measure of starchconcentration. The NFC fraction is calculated bysubtracting measured components (NDF, CP, etherextract, ash) from total DM. It contains othercarbohydrates such as sugars and pectin and can beunderestimated to the extent that non-protein nitrogenis present. While starch, sugars and pectin are generallyhighly digestible, their effects on rumen microbialpopulations and fuels available to the animal differgreatly. Starch that is ruminally-fermented increasespropionate production in the rumen (Sutton et al.,2003) and starch that escapes ruminal fermentationprovides glucose that is absorbed or metabolized tolactate in the small intestine (Reynolds et al., 2003).Sugars are nearly completely fermented in the rumenand generally increase butyrate production (Oba, 2011).Most strains of pectin-degrading rumen bacteriaproduce acetic and formic acids and relatively littlepropionic acid (Dehority, 1969). Propionic and lacticacids are glucose precursors while formic, acetic, andbutyric acids are not. In addition, propionate candecrease feed intake under some conditions (Allen,2000) and starch, sugars, and pectin have differenteffects on microbial populations in the rumen that canaffect fiber digestion and ruminal biohydrogenation offatty acids. Therefore, NFC is not a useful proxy forstarch when formulating rations for lactating cows.
Table 1. Effects of dietary treatment on passage rate(kp) of starch from the rumen1.1Determined by dividing duodenal flux (g/h) by rumenpool size (g) and multiplying by 100.
Experiment Treatment kp, %/h P valueOba and Allen, 2000b bm3 corn silage 12.9 0.02
control corn silage 10.629% diet NDF 14.5 <0.000138% diet NDF 9.0
Oba and Allen, 2003a high-moisture corn 15.4 0.07dry ground corn 19.7
Voelker and Allen, 2003bhigh-moisture corn 15.9 0.0124% beet pulp 23.5
Ying and Allen, 2005 high-moisture corn 7.1 <0.0001dry ground corn 16.3
vitreous endosperm 16.0 <0.001floury endosperm 7.5
Taylor and Allen, 2005 vitreous endosperm 21.2 0.10floury endosperm 16.2
Allen et al., 2008 vitreous endosperm 25.7 <0.001floury endosperm 16.0
Relative differences in rate of starch digestion can be
25

determined by in vitro starch digestion (IVSD) withruminal microbes. This can be done by incubatingsamples over time in rumen fluid with buffered mediaand evaluating the rate of starch disappearance or, lesscostly and equally informative, by evaluating starchdisappearance over a period of time (e.g. 7 hours). Webegan using a 7-h incubation time over 20 years agowhen our objective was to predict in vivo ruminaldigestibility of starch because we thought it was areasonable mean residence time of starch in rumens oflactating cows. However, we subsequently realized thatwas naïve because ruminal digestibility of starch in vivois highly affected by the enzyme activity of the rumenfluid and particle size of the starch source, and thatresidence time of starch in the rumen is extremelyvariable, not only across cows, but also across sources ofstarch (Table 1). We continue to use IVSD with a 7 hretention time because we think it provides usefulinformation about relative rates of fermentation amongstarch sources. However, it is very important to knowthat 7-h IVSD is a relative measure of rate of starchdigestion among sources only. Samples must be groundbefore analysis, which removes important variation formany comparisons (e.g. processed vs. unprocessed cornsilage). Comparisons must be done in the same in vitrorun (at the same time) because IVSD of the samesources is highly variable across runs. This is becauseenzyme activities (amylases and proteases) of rumenfluid are highly variable from cow to cow, time relativeto feeding, and diet consumed. In our laboratory, thecoefficient of variation for 7-h IVSD across runs can beas high as 25% even after attempting to minimizevariation by taking rumen fluid from several cows fed aspecific diet at the same time of day relative to feeding.This is much higher than our coefficient of variation for30-h in vitro NDF digestibility of less than 3%.
Because starch digestion is inhibited by insolubleproteins in the endosperm, the solubility of protein hasbeen measured as an indicator of relative differences instarch digestibility. Like IVSD, determination ofprotein solubility requires grinding samples, removingvariation among sources. Because it is a chemicalrather than biological measure, it is less variable acrossruns than IVSD. Accuracy of ruminal starchdigestibility prediction from protein solubility is limitedby the relationship between protein solubility and rateof starch digestion as well as limited knowledge ofpassage rate of starch from the rumen. Therefore, likeIVSD, measures of protein solubility provide someinformation related to ruminal starch digestion butcannot be used to measure ruminal starch digestibilityaccurately.
Prediction by modelsAlthough measurement of digestion rate of feedfractions in vitro and in situ can provide relevantinformation regarding relative differences among feeds,
absolute, not relative, values are required by models topredict ruminal digestibility. Therefore, despite theirpromise, ration formulation models that include rumensub-models such as CNCPS do not predict ruminalstarch digestibility accurately even if in vitro rates ofstarch digestion are used as inputs (Allen, 2011).Accuracy and precision of prediction of ruminal starchdigestibility was poor for several models including CPMand AMTS in a recent evaluation; AMTS and CPMover-predicted ruminal starch digestibility for corn grainby over 25 percentage units (~80% vs. 55%), leading theauthors to conclude that the model estimates were notuseful (Patton et al., 2012). The primary factorslimiting accurate determinations of digestion rate invitro or in situ are 1) the inability to mimic the increasein surface area and breakdown of particle size byrumination, 2) variation in enzyme activity and ratio ofenzyme to substrate in the rumen over time, and 3) lackof understanding and data on passage rates of starch.
Rates of starch digestion determined in vitro are muchdifferent than actual rates of digestion because feedparticles containing starch that are consumed by cowsare larger than what is required for in vitro analysis andbecause enzyme activity in the rumen is extremelyvariable depending upon diet, time since eating, and thecow. Grinding feeds is necessary to obtain uniformsamples for analysis in the laboratory but grindingincreases surface area accessible to microbes, increasingrate of digestion compared to intact feeds in vivo. Onthe other hand, not grinding at all will underestimaterate of digestion because feeds are crushed and groundby chewing over time, before they pass from the rumen.This is an unsolvable problem because simulation of theeffects of chewing over time of incubation in vitro or insitu is infeasible.
The high variation in IVSD across runs prompted us toevaluate the effect of rumen fluid sampled before andafter feeding on IVSD-7h which was 33% greater afterfeeding compared to before feeding (41.2 vs. 30.9%, P <0.01; Fickett and Allen, 2002). Enzyme activity relatedto starch fermentation is also increased with higherstarch diets; we reported that the fractional rate ofstarch digestion determined in vivo with the pool andflux method was greater for diets with higher starchconcentration and lower NDF from forage (Oba andAllen, 2003a) or beet pulp (Voelker and Allen, 2003b).Therefore, at least for starch, digestion is a second-orderprocess dependent upon both substrate and enzymeactivity. This is a problem for utilization of current datawith most existing models in which digestion is modeledas a first-order process dependent on feedcharacteristics only.
Passage rate of starch was greatly affected by particlesize, conservation method, and endosperm type for corn(Table 1; Ying and Allen, 2005; Allen et al., 2008).
26

However, little data exists for passage rates of starchand how it is affected by diet and level of intake.Because passage rate is as important as digestion ratefor determining ruminal starch digestibility, accuratepredictions by models that use digestion kinetics topredict starch digestibility are not currently possible. Inaddition, models such as CNCPS that use digestionrates for carbohydrate fractions but passage rates forentire feeds result in even greater inaccuracies fordetermination of ruminal starch digestion.
Production ResponseThe filling effects and fermentability of rations areaffected by the concentration and ruminalfermentability of starch and can affect DMI, nutrientpartitioning, microbial protein production, and total-tract digestibility. Increasing the starch concentrationof the ration offered to lactating cows from ~23 to~34% (~24 to 16% forage NDF, respectively) resulted invariable effects on DMI and FCM yield dependingupon the milk yield of cows (range in FCM: ~50 to~130 lb/d); DMI response to the high-starch, low forageNDF ration increased linearly with increasing milkyield of cows throughout the range while FCMresponse increased only for cows above ~90 lb/d ofFCM (Voelker and Allen, 2003a; Figure 2). Responsefor DMI was likely because the higher starch diet wasless filling (16% forage NDF) and rumen fill is a greaterlimitation to feed intake as milk yield increases (Allen,1996), while response for FCM likely depended uponeffects of the ration on digestibility and energypartitioning among cows.
The physiological state of animals determines the effectsof starch fermentability on DMI (Bradford and Allen,2007) and production (Bradford and Allen, 2004)responses. High moisture corn compared to dry groundcorn had opposite effects on milk yield for cowsdepending on initial milk yield, with no change for thegroup overall; high moisture corn increasedconcentration of milk fat and yield of FCM for cowsproducing over ~90 lb/day but decreased both for cowsproducing less than that amount (Bradford and Allen,2004). Effect of treatment on DMI was not related tomilk yield but was affected by physiological state ofcows; depression in DMI by the high moisture corncompared with the dry corn treatment was related toplasma insulin concentration and insulin response to aglucose challenge (Bradford and Allen, 2007). Feedintake of cows with greater insulin concentration, andlower insulin response to a glucose challenge, wasdepressed to a greater extent by high moisture corncompared with dry ground corn. As lactation proceedsand milk yield declines, feed intake is increasinglydominated by metabolic signals. Highly fermentablediets often decrease feed intake in mid to late lactation,likely from stimulation of hepatic oxidation bypropionate (Allen et al., 2009). Reducing ruminal
fermentability of starch by substituting dry corn forhigh moisture corn in rations often increases energyintake and partitioning to milk for these cows.
Energy partitioning between milk production and bodycondition varies depending upon fuels available and asphysiological state changes throughout lactation.Substitution of fiber for starch greatly alters fuelsavailable for intermediary processes and often results ingreater partitioning of energy to milk rather than bodycondition. Substitution of soyhulls for dry ground cornup to 40% of diet DM increased milk fat percent(linearly from 3.60 to 3.91%) and decreased body weightgain (linearly from 1.02 to -0.14 kg/d) with no effect onmilk yield (~29 kg/d) and a slight decrease in DMI(tendency, linearly from 23.8 to 22.7 kg/g, Ipharraguerreet al., 2002). We showed that beet pulp decreased BCSwithout decreasing yields of milk or milk fat whensubstituted for high-moisture corn up to 12% of dietDM (Voelker and Allen, 2003a). Furthermore, weshowed that a 69% forage diet (0% corn grain)containing brown midrib corn silage increased energypartitioned to milk, decreasing body weight gain whilenumerically increasing FCM yield compared with a 40%forage diet (29 % corn grain) containing control cornsilage (Oba and Allen, 2000a). In contrast, DMI andmilk yield was reduced when the control corn silage,which had ~20% lower in vitro NDF digestibility (46.5%vs. 55.9) than the brown midrib corn silage, was fed inthe higher forage diets.
As lactation proceeds, insulin concentration andsensitivity of tissues increase and energy is increasinglypartitioned to body condition. Intravenous glucoseinfusion of up to 30% of net energy requirementlinearly increased plasma insulin, energy balance, bodyweight and back fat thickness, without affecting DMIor milk yield of mid-lactation cows (Al-Trad et al.,2009). An experiment conducted with cows in the last 2months of lactation showed that substitution of beetpulp for barley grain linearly decreased body conditionscore and back fat thickness, maintained milk yield andlinearly increased milk fat yield and milk energy output(Mahjoubi et al., 2009). Decreased body conditionscore and increased milk fat yield might have beenbecause of a linear decrease in plasma insulinconcentration which linearly increased plasma NEFAconcentration.
High starch diets might result in greater insulinconcentration, partitioning energy to adipose at theexpense of milk, but they also often result in lowerruminal pH resulting in milk fat depression from alteredbiohydrogenation of polyunsaturated fatty acids in therumen reducing milk energy output. While increasedenergy retention as body condition might be because ofincreased insulin as observed by Ipharraguerre et al.(2002) and Mahjoubi et al., (2009), it might also be a
27

result of altered gene expression in adipose tissue.Harvatine et al. (2009) reported that CLA-induced milkfat depression increased gene expression for enzymesand regulators of fat synthesis in adipose tissue. Theenergy spared from the reduction in milk fat synthesiswas likely partitioned toward adipose tissue fat stores.Reducing ration starch concentration by increasing fiberfrom forages or non-forage fiber sources can maintainmilk yield while decreasing gain in body condition.
Increasing ruminal degradability of starch generallyincreases microbial nitrogen flow to the duodenum butexcessive ruminal starch digestion might decreaseruminal fiber digestibility, offsetting its effects (Firkinset al., 2001). In addition, starch sources with fasterrates of fermentation might decrease efficiency ofmicrobial protein production; microbial growth can beuncoupled from OM fermentation under someconditions (Russell and Cook, 1995). Greaterconcentration of starch in rations (32 vs. 21% of DM)increased flow of microbial nitrogen from the rumenwith no effect on efficiency of microbial nitrogenproduction in a study from our laboratory withlactating cows (Oba and Allen, 2003b). However,although ruminal starch digestibility was increased byhigh moisture corn compared with dry ground in thatexperiment, high moisture corn decreased efficiency ofmicrobial nitrogen production compared with dry cornand did not affect flow of microbial nitrogen from therumen. While flow of microbial nitrogen was positivelyrelated to true ruminal OM digestibility in thatexperiment, it was negatively related to rate of starchdigestion across all cow period means. Microbialgrowth might be limited when rate of starch digestion isvery fast (Oba and Allen, 2003b). Therefore, increasingruminal starch degradation by increasing starchconcentration of diets might improve flow of microbialnitrogen to the duodenum to a greater extent thanincreasing ruminal fermentability of starch.
Formulating Rations for StarchWe know a great deal about what factors affect ruminaldigestibility of starch that can be routinely used forration formulation even if we cannot accuratelymeasure rates of digestion and passage of starch.Starch concentration and ruminal digestibility is sovariable across feeds that we can measure starchconcentration and use literature values for ruminaldigestibility for initial formulation which can beadjusted using qualitative knowledge of factors thataffect ruminal starch digestibility discussed above.Although we should strive to increase accuracy ofprediction over time, we are not able to accuratelypredict animal responses to starch concentration andfermentability because of the many interactions thatultimately affect response such a stocking density,effective fiber concentration, milk yield, physiologicalstate, etc. However, ration formulation should be an
iterative process that includes cows in the loop;evaluation of cow response will provide feedback tooptimize diets. Cow responses include DMI; yields ofmilk, fat, and protein; milk urea nitrogen; bodycondition; manure consistency; ketones; etc. Grainsthat differ in ruminal starch fermentability, but havehigh whole tract digestibility (e.g. high moisture cornand ground dry corn), allow evaluation of optimalruminal starch digestibility without other confoundingeffects (e.g. effects of changing forage NDFconcentration on feed intake) and diet starchconcentration can be reduced by substitution of a non-forage fiber source, such as beet pulp, soyhulls, or corngluten feed, for grains.
Group feeding complicates interpretation of responsesfor DMI and milk yield. Mean milk yield for the groupmasks effects of diets because large changes in milkyield of individual cows within the group might occurwith no change in milk yield for the group overall. Thisis most evident when all lactating cows (with greatdifferences in physiological state) are offered the samediet. Individual milk meters provide timely feedbackregarding response of individuals within the group andare an important tool for diet formulation andgrouping. The same is true for individual DMIresponse, but this is not feasible economically for group-housed cows. While that limits the usefulness of DMIdetermination for the group, it is still a very usefulmeasurement, particularly in combination with milkyield to provide important clues for the effects of thediet change. Evaluation of cow response requires moreattention by nutritionists and coordination with themanagement teams on farms. The extent to whichnutritionists and the management team interact willvary from farm-to-farm, but this is an importantdeterminant of the success of the nutrition program.The following recommendations for ration starchconcentration and ruminal fermentability for cows asthey progress through lactation should be adjusted asindicated by cow response.
Fresh cow ration (from parturition to 10 days to 3 weeksfollowing parturition) Fresh cows are in a lipolytic state, are at increased riskfor metabolic disorders, and feed intake is likelycontrolled by oxidation of fuels in the liver (Allen et al.,2009). These cows require glucose precursors andrations should contain higher starch concentrations tothe extent possible. However, they also have lowerrumen digesta mass, which increases risk for ruminalacidosis and displaced abomasum. Highly fermentablestarch sources increase fermentation acid productionincluding propionate, which can stimulate oxidation offuels in the liver, suppressing feed intake (Allen et al.,2009). Therefore, highly fermentable starch sourcesshould be limited during this period which lasts up totwo weeks for most cows but even longer for cows with
28

excessive body condition at parturition. Highlyfermentable starch sources such as wheat, barley, low-density steam-flaked corn, and aged (greater than 1 yearold) high moisture corn and corn silage, should belimited to allow greater starch concentrations (andglucose precursors) with less risk of acidosis ordisplaced abomasum. Supplementing corn silage baseddiets with dry ground corn works well for this rationwith a total starch concentration of 22 to 25% (DMbasis). Because feed intake is less limited by ruminaldistention during this period, and greater rumen digestamass is desirable, forage NDF concentration should begreater than 23% and use of non-forage fiber sourcesshould be limited to diluting starch concentration, ifnecessary. Starch concentrations must be decreasedwhen feeding highly fermentable starch sources.
Early to mid-lactation rationCows in early to mid-lactation have high glucoserequirement for milk production and partition relativelylittle energy to body reserves. They respond well torations with lower forage NDF concentration (low fill)and highly fermentable starch. Starch concentration ofrations should be in the range of 25 to 30% (DM basis)although the optimum concentration is dependent uponcompetition for bunk space, forage/effective NDFconcentration, and starch fermentability. Higher starch,lower fill rations generally increase peak milk yield anddecrease loss of body condition in early lactation.However, once cows replenish body condition lost inearly lactation, they should be switched to amaintenance diet with lower starch concentration andruminal fermentability.
Maintenance ration (> 150 DIM and BCS of 3)The maintenance ration is the key component of aration formulation/ grouping system to increase healthand production of cows. The goal of the maintenanceration is to maintain milk yield and body conditionthrough the rest of lactation. Cows should be offeredthe maintenance ration when they are regaining BCSand reach a BCS of 3. If they continue receiving a highstarch diet, BCS will continue to increase and they willbe at increased risk for metabolic disease followingparturition. Evidence presented above suggests thatthey are gaining condition because they are being fedrations with greater starch concentrations needed fortheir current requirement for milk production,increasing plasma glucose and insulin concentrations.Lowering ration starch concentration should limit bodycondition gain while maintaining and possiblyimproving feed intake and yields of milk and milk fat.The optimal concentration of starch is dependent uponthe milk yield of the herd and physical groups possiblebut will likely be in the range of 18 to 22% (DM basis).Starch sources that are high fermentable (high-moisturecorn, bakery waste, aged corn silage, etc.) should beavoided. Dried ground corn is an excellent starch
source because it has lower ruminal digestibility (~60%)but high total tract digestibility (< 90%). The starchconcentration of the maintenance ration should containadequate, but not excessive forage NDF concentrationto maintain DMI, and non-forage fiber sources (beetpulp, corn gluten feed, soyhulls, etc.) can be used todilute starch to the target concentration. MonitoringBCS at dry-off is essential to adjust the starchconcentration of the maintenance diet over time.
ConclusionsConcentration and ruminal fermentability of starch arehighly variable among rations fed to lactating cows andhave great effects on feed intake, energy partitioning,milk production, and health. The optimal starchconcentration and starch source in rations varies byphysiological state of cows, which changes throughlactation. Cows should be fed different rations throughlactation to maximize use of existing knowledgeregarding starch nutrition.
29

ReferencesAllen, M. S. 1996. Physical constraints on voluntary intake of
forages by ruminants. J. Anim. Sci. 74:3063-3075.Allen, Mike. Corn silage slump hit again this year. Hoard’s
Dairyman, January 25, 1998.Allen, M. S. 2000. Effects of diet on short-term regulation of
feed intake by lactating dairy cattle. J. Dairy Sci. 83:1598-1624.
Allen, M.S., R. A. Longuski and Y. Ying. 2008. Endospermtype of dry ground corn grain affects ruminal and totaltract digestion of starch in lactating dairy cows. J. DairySci. 91(E Suppl):529.
Allen, M.S. 2011. Mind over models. Proc. Tri-State DairyNutrition Conf., Dept. Dairy Sci., Ohio State University,Columbus, Ohio 43210.
Allen, M.S., B.J. Bradford, and K.J. Harvatine. 2005. The cowas a model to study food intake regulation. Ann. Rev. Nutr.25:523-547.
Allen, M.S., B. J. Bradford, and M. Oba. 2009. BOARD-INVITED REVIEW: The hepatic oxidation theory of thecontrol of feed intake and its application to ruminants. J.Anim. Sci. 87: 3317-3334.
Allen, M.S., R. A. Longuski and Y. Ying. 2008. Endospermtype of dry ground corn grain affects ruminal and totaltract digestion of starch in lactating dairy cows. J. DairySci. 91(E Suppl):529
Allen, M. S., R.J. Grant, W. P. Weiss, G. W. Roth, and J. F.Beck. 2003. Effects of endosperm type of corn grain onstarch degradability by ruminal microbes in vitro. J. DairySci. 86S:61.
Al-Trad, B., K. Reisberg, T. Wittek, G. B. Penner, A.Alkaassem, G. Gabel, M. Fu� rll, and J. R. Aschenbach.2009. Increasing intravenous infusions of glucose improvebody condition but not lactation performance inmidlactation dairy cows. J. Dairy Sci. 92:5645-5658.
Bradford, B. J. and M. S. Allen. 2004. Milk fat responses to achange in diet fermentability vary by production level indairy cattle. J. Dairy Sci. 2004 87: 3800-3807.
Bradford, B. J. and M. S. Allen. 2007. Depression in feedintake by a highly fermentable diet is related to plasmainsulin concentration and insulin response to glucoseinfusion. J. Dairy Sci. 90:3838-3845.
Dehority, B. A. 1969. Pectin-fermenting bacteria isolated fromthe bovine rumen. J. Bacteriol. 99:189-196.
Fickett, F. M. and M. S. Allen. 2002. Ruminal fluid effects onin vitro digestion kinetics of starch. J. Dairy Sci. 85S:181.
Firkins, J. L., M. L. Eastridge, N. R. St-Pierre, and S. M.Noftsger. 2001. Effects of grain variability and processingon starch utilization by lactating dairy cattle. J. Anim. Sci.79(E. Suppl.):E218–E238.
Harvatine K. J., J. W. Perfield II, and D. E. Bauman. 2009.Expression of enzymes and key regulators of lipid synthesisis upregulated in adipose tissue during CLA-induced milkfat depression in dairy cows. J. Nutr.139: 849-854.
Hoffman, P. C. and R. D. Shaver. 2010. The nutritionalchemistry of dry and high moisture corn. Pp. 179-192.Proc. 10th Western Dairy Management Conference,Department of Animal Science, Kansas State University,Manhattan, KS.
Hoffman, P. C., D. Ngonyamo-Majee, and R. D. Shaver. 2010.Technical note: Determination of corn hardness in diversecorn germplasm using near-infrared reflectance baselineshift as a measure of grinding resistance. J. Dairy Sci. 93:1685-1689.
Huntington, G. B. 1997. Starch utilization by ruminants: frombasics to the bunk. J. Anim. Sci. 75:852-867.
Ipharraguerre, I. R., R. R. Ipharraguerre, and J. H. Clark.2002. Performance of lactating dairy cows fed varyingamounts of soyhulls as a replacement for corn grain. J.Dairy Sci. 85:2905–2912.
Kotarski, S. F., R. D. Waniska and K. K. Thurn. 1992. Starchhydrolysis by the ruminal microflora. J. Nutr. 122:178.
Mahjoubi, E., H. Amanlou, D. Zahmatkesh, M. GhelichKhan, and N. Aghaziarati. 2009. Use of beet pulp as areplacement for barley grain to manage body conditionscore in over-conditioned late lactation cows. Anim. FeedSci. Tech. 153:60-67.
Ngonyamo-Majee, D, R.D. Shaver, J.G. Coors, D. Sapienza, J.G. Lauer. 2008. Relationships between kernel vitreousnessand dry matter degradability for diverse corn germplasm II.Ruminal and post-ruminal degradabilities. Anim. Feed Sci.Tech. 142:259-274.
Nocek, J. E., and S. Tamminga. 1991. Site of digestion ofstarch in the gastrointestinal tract of dairy cows and itseffect on milk and composition. J. Dairy Sci. 74:3598.
Oba, M. 2011. Review: Effects of feeding sugars onproductivity of lactating dairy cows. Can. J. Anim. Sci.91:37-46.
Oba, M., and M. S. Allen. 2000a. Effects of brown midrib 3mutation in corn silage on productivity of dairy cows fedtwo concentrations of dietary neutral detergent fiber: 1.Feeding behavior and nutrient utilization. J. Dairy Sci83:1333-1341.
Oba, M., and M. S. Allen. 2000b. Effects of brown midrib 3mutation in corn silage on productivity of dairy cows fedtwo concentrations of dietary neutral detergent fiber: 3.Digestibility and microbial efficiency. J. Dairy Sci. 83:1350-1358.
Oba, M. and M. S. Allen. 2003a. Effects of corn grainconservation method on ruminal digestion kinetics forlactating dairy cows at two dietary starch concentrations. J.Dairy Sci. 86:184-194.
Oba, M. and M. S. Allen. 2003b. Effects of dietfermentability on efficiency of microbial nitrogenproduction in lactating dairy cows. J. Dairy Sci. 86:195-207.
30

Mike HutjensNotes
31

Marty FaldetNotes
32

Barry VisserNotes
33

Results of UW-Madison CornShredlage Feeding Trial
Luiz Ferraretto and Randy ShaverDairy Science Department
UW-Madison
34

35

36

37

38

39

IntroductionDairy farmers might be over-feeding a largeproportion of lactating cows when they feed the sameration to a large group of animals. Diets are normallyformulated to provide enough nutrients to the mostproductive animals, which in turn gives extranutrients to the less productive animals. Therefore,splitting lactating cows in smaller groups andoffering group-specific feeding rations provides moreprecise nutrient requirements, increases herd’sincome over feed cost, and decreases nutrientexcretion to the environment. Depending on the farmfacilities and extra management costs, consideringadditional grouping for feeding purposes could be aprofitable decision in modern dairy farming.
Strategies for Grouping Lactating CowsThe decision to increase the number of groups withina farm, formulate more rations, and offer group-specific diets will depend on the individual cow’snutrient requirement expressed as Mcal/kg of DryMatter (DM) and % of CP of DM (McGilliard et al.,1983), the number of lactating animals, and the farm’scapacity of handle several feeding groups.
Individual Cow Nutrient Requirements and DryMatter IntakeFollowing are some principles and equations that are usedto calculate nutrient requirements of lactating dairy cattle.
Net Energy (NE)Total NE (NEtotal) of a lactating cow is the sum of theNE required for maintenance (NEmaintenance) and theNE required for milk production (NEmilk):
NEtotal (Mcal) = NEmaintenance + NEmilk [1]
The NEmaintenance is a function of animal’s bodyweight (BW in kg), NRC (2001):
NEmaintenance (Mcal) = 0.079 x BW0.75 [2]
The NEmilk depends on the cow’s milk (kg) and fatproduction, NRC (2001):
NEmilk (Mcal) = Milk x (0.36 + 0.0969 * (Fat %)) [3]then, the NE per kg of dry matter (DM) is theestimated NEtotal cow’s with respect to the cow’s drymatter intake (DMI):NE (Mcal/kg DM) = NEtotal /DMI [4]
Crude Protein (CP) Total CP (CPtotal) is also the sum of the CP requiredfor maintenance (CPmaintenance) and the CP requiredfor milk production (CPmilk):
CPtotal (g) = CPmaintenance + CPmilk [5]
The CPmaintenance is a function of animal’s BW,McGilliard et al. (1983):
CPmaintenance (g) = 104.78+0.73 x BW - 0.00015432 xBW2 [6]
The CPmilk depends on the cow’s milk (kg) and fatproduction, McGilliard et al. (1983):
CPmilk (g) = Milk x (4586 + 1036 * (Fat %))/100 [7]
then, the % CP per kg of DM is calculated using theestimated cow’s DMI:
% CP = (CPtotal /1000) /DMI [8]
Body Weight (BW)Individual cow’s BW could be either measured orestimated. If estimated, individual cow BW could beexpressed as a function of cow’s parity, days aftercalving (DIM), and an average BW of cohorts byparity using the Korver function (Korver et al., 1985)fitted to the NRC (2001) BW function (Figure 1).Figure 1. Estimated cow’s body weight (BW, kg) bydays after calving (DIM) for an average cow with 500kg BW in first parity and 600 kg BW in later parities.
40
Grouping Strategies for FeedingLactacting Dairy Cattle
Victor E. Cabrera, Francisco Contreras, Randy D. Shaver, Lou ArmentanoUniversity of Wisconsin-Madison Department of Dairy Science
1675 Observatory Dr., Madison, WI [email protected]

Dry Matter Intake (DMI)Dry matter intake could be calculated as a function ofDIM, BW, and 4% fat corrected milk (FCM) accordingto NRC (2001):
DMI = (0.372 x 4% FCM + 0.0968 x BW0.75) x (1 – e (-0.192 x ((DIM/7)+3.67)) [9]
where 4% FCM is a function of the milk fat contentwith respect to the corrected fat level (4%), NRC(2001):
4% FCM = 0.4 x Milk + 15 x (Fat %/100) x Milk [10]
Nutrient Requirements for a Group of Cows A lead factor (multiplicative factor) based on the 83rd
percentile method (Stallings and McGilliard, 1984) toadjust nutrient requirements to the 83rd percentile(mean plus one standard deviation) could be used toformulate NE and CP requirements for a particulargroup of lactating cows.
NEgroup (Mcal/kg DM) = 83rd Percentile(NEgroup_cows) [11]
CPgroup (% DM) = 83rd Percentile (CPgroup_cows) [12]
Maximum Number of Groups of Lactating Cows The maximum number of groups of cows feddifferent rations will be dictated by the dairy farmfacilities and management. Nonetheless, it seems thatthere would be little gain for feeding more than 4different diets (McGilliard et al.,1983; St. Pierre andThraen, 1999). The decision could then be confined tomanage 2, 3, or 4 lactating cow groups for feedingpurposes, in addition to the no grouping option,which formulates one ration for all lactating cows.
Criteria for Grouping Lactating Cows for FeedingPurposesAlthough there are several different criteria toformulate diets and to group cows for feedingpurposes, 4 criteria are believed to be the critical(McGilliard et al., 1983): 1) days after calving (DIM),2) fat corrected milk (FCM), 3) dairy merit (FCM andBW), and 4) cluster (combined NE and CPrequirements).
Days after calving (DIM)This criterion consists simply on grouping cowsaccording to their stage of lactation (e.g., early, mid,and late lactation animals). This is popular amongfarmers as it is easy to manage, coincides or helpwith other management practices (i.e., reproductivemanagement), and seems intuitive as cows in similarlactation stages would have similar nutrientrequirements.
Fat corrected milk (FCM)This criterion prescribes that cows should be groupedbased on their level of production measured as FCM(i.e., 4% FCM). This is also popular among dairyproducers. It seems reasonable and logic to assumethat cows with similar productivity should havesimilar nutrient requirements and should belong tothe same group and feeding ration.
Dairy merit Dairy merit by definition (McGilliard et al., 1983) is afunction of both the level of production and BW. It isdefined as FCM/BW0.75. This criterion mightoutperform DIM and FCM criteria (McGilliard et al.,1983).
ClusterCluster criterion that is a function of NE and CPrequirements seems to be the most efficient methodfor grouping cows (McGilliard et al., 1983; St-Pierreand Thraen, 1999). This method consists of usingclusters of cows with similar requirements of NE andCP within a feeding group. Cows are groupeddepending on the physical distance existing betweenobservations in a space defined by NE and CPrequirements as illustrated in Figure 2.
Figure 2. Illustration of estimated NE and CPrequirements on a 1,800-cow herd. Six hundred cows(circles) belong to a first feeding group, 600 hundredcows (squares) belong to second feeding group, and600 hundred cows (triangles) belong to third feedinggroup.
Optimize the Cows Belonging to a Group toMaximize the Income over Feed Cost (Max IOFC)
Price NE and CPThe price of NE ($/Mcal) and CP ($/kg) can bededucted by using referee feeds such as corn andsoybean meal (SBM). This calculation could be donecollecting information on the NE (Mcal/kg), CP (%),and price ($/kg) of corn and SBM and solvingEquations 13 and 14 simultaneously:
41

Corn % CP + Corn Mcal NE = $/kg Corn Price [13]
SBM % CP + SBM Mcal NE = $/kg SBM Price [14]
Cow Assignment to Feeding GroupsCows belonging to particular groups could be foundby an iterative process of searching for a globalmaximum IOFC when assigning cows to pre-definednumber and size groups on a farm. First, the possiblenumber of groups and the size of each group aredefined. Then, the aggregated cow-specific differencebetween milk sales and feed costs (IOFC) isrepeatedly calculated until the Max IOFC is found:
Max (IOFC) = ΣGgroup=1(IOFC)group) [15]
where IOFCgroup = (Milkgroup) (Milk Price) – (FeedCostgroup),
FeedCostgroup = (83%tileCPgroup) (CPPrice)) +)83%tileNElgroup) (NEl Price),
IOFC = Income over Feed Cost, and G = total numberof groups: 2, 3, or 4.
Additional Costs and Benefits of Grouping FeedingStrategies
Management costsIncreasing the number of feeding groups in a dairyfarm will likely add costs to the farm because ofadditional labor needed to formulate, prepare, andfeed more rations. This cost should be estimated andprovided by the farmer because this is a highly farm-specific figure.
Milk depression costCows that are moved from one group to anothergroup and from one ration to another ration couldlikely suffer milk depression for a period of time afterthe movement happens. This milk depression mightoccur because of social interaction adjustments orbecause of receiving a lower nutritive diet due to there-grouping.
Savings because additional groupingSome costs might also be avoided when increasingthe number of feeding groups. An example is thecosts of feeding additives, which normally aretargeted for a specific group of cows (e.g., highproducing, early lactation cows). Therefore, havingadditional feeding groups would save these costs forother feeding groups.
Overall Net Return of Grouping Strategies forFeedingThe overall Net Return could then be defined as theeconomic difference of the maximum IOFC of theoptimal grouping criterion for the farm-defined
number of feeding groups with the optimal groupcow assignment plus savings because of grouping (ifany) minus farm-expected additional managementcosts (if any) and minus farm-expected milkdepression because of grouping (if any), Equation 16.
Net Return = Max(IOFC) + Savings – Management –Milk Depression [16]
Perform Analyses of Improved Grouping StrategiesThe proposed methodology above discussed has beenimplemented on an online tool in the WisconsinDairy management Web page:
DairyMGT.info: Tools: Grouping Strategies for FeedingLactating Dairy Cattle.
This decision support system is freely and openlyavailable to anyone who would like to use it. Afterlogin in the tool, the user follows an intuitive menuthat allows customizing the analysis to any particulardairy herd system.
Figure 3. Screenshot of decision support system:Grouping Strategies for Feeding Lactating Dairy Cattleavailable at DairyMGT.info: Tools.
Get the farm data for the online toolFarm time specific dataset should contain thefollowing minimum fields of information for eachlactating cow in the herd: 1) cow identification, 2)parity, 3) days after calving (DIM), 4) milkproduction, and 5) milk fat content. Optionally, forgreater precision, if available, cow’s BW could also beused in the dataset. If cow’s BW is not available, anaverage figure for primiparous and for multiparouswould suffice. In addition to this dataset, the userneeds to define either the price and the CP and NELcontent of corn and SBM or the value of CP ($/lb)and NE ($/Mcal); the price of milk ($/cwt); andfarm-specific grouping strategies for feeding lactatingdairy cattle. Grouping strategies are discussed ingreater detail below.
42

Grouping strategies for feeding in theonline tool
Lactating cows in a farm might or might not becurrently divided in groups for feeding purposes.Whether they are grouped or not, the farm could orcould not have the ability to still increase the numberof feeding groups. More specifically:
1. If lactating cows are divided in groupsfor feeding purposes and:
a. There is no capability for doing moregroups, then there are opportunities forimproving grouping decisions by anyor various factors listed below:
i. Select the right group criterionii. Adjust diets on each one of thegroups
iii. Optimize animals belonging toeach group
b. There is capability for doing moregroups, then there are opportunities forimproving grouping decisions by anyor various factors listed below:
i. Select the right number of groupsii. Select the right group criterioniii. Adjust diets on each one of the
groupsi.v Optimize animals belonging to
each group2. If lactating cows are not divided in groupsfor feeding purposes, but the farm hascapabilities of doing groups, there areopportunities for improving groupingdecisions by any or various factors listedbelow:
i. Select the right number of groups(2, 3, or 4 groups)ii. Select the right group criterioniii. Adjust diets on each one of the
groupsiv. Optimize animals belonging to
each group
The online tool presents a decision tree diagram witha set of questions to capture current farm situation,which then is used to analyze possible groupingstrategies for feeding lactating dairy cattle.
Illustration of Grouping Strategies for FeedingLactating Dairy Cattle
Analyses from dairy farm recordsTest records from a number of Wisconsin dairy farms(n = 30) were collected and adjusted to datasetsconsisting of cow identification, lactation, days inmilk, milk production, and milk butterfat. Each farmwas then analyzed using the online tool: Groupingstrategies for feeding lactating dairy cattle.
The aim of this exercise was to demonstrate the valueof grouping compared to no grouping withoutknowing studied farms’ actual feeding strategies.Therefore, same procedure and assumptions werefollowed on each analyzed farm:
• Comparison of no grouping versus 3 same-size groups
• Prices at $15.89/cwt milk, $0.14337/lb CP,and $0.1174/Mcal NEl
• Body weight at 1,100 lb for primiparous and1,300 lb for multiparous
• Requirements of CP and NEl at the 83rd
percentile level (mean + 1 SD)• Cluster grouping criterion
Evaluations clearly and consistently demonstratedthat the income over feed cost (IOFC) in all analyzedfarms was greater for the strategy using 3 feedinggroups than the no groping strategy (Table 1).
Table 1. Comparison of income over feed cost (IOFC)of no grouping versus 3 same-size feeding groups forWisconsin dairy farms assessed by the tool: Groupingstrategies for feeding lactating dairy cattle.
Number of Additionallactating 3 same IOFCcows on size of doinganalyzed No feeding 3 samefarms grouping groups size feeding(n = 30) IOFC IOFC groups
- - - - - - $/cow per year - - - - - -
Mean 788 2,311 2,707 396
Minimum <200 697 1,059 161
Maximum >1,000 2,967 3,285 580
The analysis indicated that farms could realizebetween $161 and $580/cow per year (mean = $396)of additional IOFC by switching from no grouping to3 same-size feeding groups using the cluster criterionfor grouping. These values represented an increase ofbetween 7 and 52% of farm calculated IOFC. We canconclude that grouping would have importanteconomic implications in farm profitability.
However, performing grouping and feeding differentrations to the groups could have additional costs andpossible economic losses. After assuming reasonablecosts of management, labor, and machinery andreasonable expected milk depression on those cowsaffected by the grouping changes, the net return ofgrouping was still much greater than the no gropingoption: The additional IOFC estimated in Table 1decreased only between 9 and 25% for these scenariosand therefore 3 same-size feeding groups was stillmuch more profitable than the no grouping option.
43

Analyses with farmers inputTwo commercial dairy farms in Wisconsin werevisited with the objective to discuss and demonstrategrouping strategies on those farms. The analysis wasperformed with latest farm records and farmer’sinput and decisions to customize the tool to theirown conditions, including prices, estimated bodyweight, and current grouping feeding strategies.Importantly, the farmer decided which potentialgrouping strategies could be made on the farm. Briefsummaries of these visits are described below.
In the first farm the final strategy was to switch fromcurrently doing 3 feeding groups under the DIMcriterion to 4 groups under the cluster criterion. Afterdiscounting estimated additional costs and potentialmilk depression, results indicated that adding onemore feeding group and using the cluster criterionwould represent an additional net return of$106/cow per year on this farm.
In the second farm, a complete analysis was notpossible because the farm was already doing complexgrouping strategies beyond the capabilities of theonline tool. This farm had in place 4 feeding groupsresulting of the intersection of dividing lactatingcows by parity (first and later lactations) and bypregnancy status (non-pregnant and pregnant).Nonetheless, the farmer was interested in exploringeven more groups. The farm had the managerial andphysical capabilities to handle 4 more feeding groupsand the farmer was interested in predicting theeconomic impacts of formulating 4 additional diets totake full advantage of the 8 available pens in thefarm. Important in this farm was the fact of keepingdistinctive diets according to lactation and pregnancystatus. An undergoing follow up strategy for thisfarm is then to analyze further splitting of currentgroups by considering cow’s individual requirementsof energy and protein.
AcknowledgementThis project was supported by Agriculture and FoodResearch Initiative Competitive Grant no. 2011-68004-30340 from the USDA National Institute of Food andAgriculture.
Thanks are extended to M. Cordoba, J. Guenther, andF. San Emeterio for sharing DHIA farm test recordsand 2 anonymous dairy producers for providing theirdata and inputs to perform the illustrations in the lastsection of this manuscript.
ReferencesKorver, S., J. A. M. van Arendonk, and W. J. Koops. 1985. A
function for live-weight change between two calvingsin dairy cattle. Anim. Prod. 40:233-241.
McGilliard, M. L., J. M. Swisher, and R. E. James.1983.Grouping lactating cows by nutritionalrequirements for feeding. J. Dairy Sci. 6631084-1093.
NRC. 2001. Nutrient requirement of dairy cattle. 7th rev. ed.National Research Council, Washington, DC.: NationalAcademy Press.
St. Pierre, N. R., and C. S. Thraen. 1999. Animal groupingstrategies, sources of variation, and economic factorsaffecting nutrient balance on dairy farms. J Anim. Sci.77:72-83.
Stallings, C. C., and M. L. McGilliard. 1984. Lead factors fortotal mixed ration formulation. J. Dairy Sci. 67:902-907.
44

Take Home Message1. The economic value of a feed rests in the value
of its nutrients. In dairy, the economicallyimportant nutrients are net energy lactation(NEL), metabolizable protein (MP), effectiveNDF (eNDF), and non-effective NDF (neNDF).
2. Unit prices of the important nutrients can becalculated using the composition and prices ofall feeds being traded in a given market. Thismethod is available in a Windows-basedsoftware. Alternatively, estimates of unit pricesare being published on a monthly basis in anational dairy magazine for all major dairyregions.
3. Forage composition for NEL, MP, eNDF andneNDF can easily be determined using 11compositional inputs and equations providedin the appendix of this paper. Using data fromour experimental research station, we do notfind a strong association between in vivo totaltract NDF digestibility and in vitro NDFdigestibility (NDFd). At this point we are stillrecommending the use of protein-free NDF andlignin to estimate NDF digestibility.
4. For most feeds, the economic value iscalculated as the simple sum of the values oftheir nutrients. With forages, however, onemust introduce a correction associated withquality because forages are not entirelysubstitutable. Dairy cows exhibit a small, butsignificant response in milk yield when highquality forages are substituted for low qualityforage in otherwise equally balanced diets.
5. The values of three levels of quality withinalfalfa and grass hay are calculated over theperiod of January through March 2012. Inalfalfa, nearly 65% of the total value isassociated with the NEL content, whereas ingrass NEL content accounts for nearly 75% offorage values. Of the 11 compositional inputsrequired in the calculation of hay and silagevalues, NDF, lignin and ash appear to have thegreatest importance.
IntroductionWhat are feeds used for? Animals do not requirefeeds; animals require nutrients. Feeds are nothing
else than containers, packages of nutrients. The solevalue of a feed is in the value of the nutrients that itcontains. A feed containing no nutrient has noeconomic value. No economic value means that it isworthless - ZERO.
What are the nutrients of economic value? Theanswer to that question depends on two things. First,the nutrients of economic value are dependent on theclass of animals under consideration. For example,the nutrients of economic importance are not thesame for beef cattle, lactating dairy cows, dry cows,and replacement animals. Hence a given feed has adifferent economic value to lactating dairy cows andreplacement heifers.
Second, the nutrients of economic value dependwhether one is interested in the strategic value of afeed versus its tactical value. This begs furtherexplanations. A dairy producer feeding 50 lbs/day ofa finely chopped corn silage is looking for attributesin purchased hay that are very specific to the narrowconditions in which it is to be fed. The value of agiven lot of hay to this producer would be entirelytactical – i.e., determined by how well it fits as acomplement to other feed ingredients that areessentially pre-determined. On the other hand, adairy producer who considers all feed components ofhis dairy rations to be exchangeable (tradable) wouldlook at a given lot of hay with a strategic view. Thehay would no longer be looked at as a complement toother pre-determined feeds, but as a component ofthe whole diet. To put it differently, tactical is whenyou have painted yourself in a corner; strategic iswhen you look at the floor configuration before youstart painting.
The economic values calculated in this paper are (1)exclusively for lactating dairy cows, and (2) entirelystrategic.
Of the large set of nutrients required by dairy cows,some have large economic values while others havesmall economic values. The calcium content of feedsis a good example of a nutrient with a smalleconomic value. Calcium can be supplemented veryinexpensively in any dairy diets. This is not to say
Pricing Homegrown and Purchased ForagesNormand St-Pierre and William P. Weiss
Department of Animal Sciences, The Ohio State University, Columbus, OH-43210.Email: [email protected]
45

that calcium is not important to dairy cows or thatration balancing should ignore calcium. It just saysthat the economics of feeding cows have little to dowith calcium.
We have extensively studied the major dairy feedmarkets in the U.S. over a period of 30 years. Acrossall 3 major markets (Midwest, Northeast, West), twosets of nutrients explain over 98% of the variation infeed prices. These are:
1. Net energy for lactation (NEL), rumendegradable protein (RDP), digestible rumenundegradable protein (dRUP), effective neutraldetergent fiber (eNDF), and non-effectiveneutral detergent fiber (neNDF), or
2. NEL, metabolizable protein (MP), eNDF, andneNDF.
The two sets are entirely interchangeable and givevery similar results. The protein requirements ofdairy cows, however, are best expressed asmetabolizable protein. Therefore, nutrient set #2 willbe exclusively used in the balance of this paper.
Unit Prices of Important NutrientsCalculating nutrient unit prices. Feed markets doexist: there are people selling and buying feeds in allmajor dairy regions. But there is no market fornutrients. Or is there? Can we calculate the implicitnutrient prices from the market prices of feedstuffs?
The problem of determining the implicit price ofattributes (the nutrients) embedded in variousproducts (feedstuffs) is not at all unique to thefeed/nutrient complex. Economists have found anelegant way to solve this problem using a methodcalled hedonic pricing. We will not review the detailsof how this work in this paper. Interested reader canconsult St-Pierre and Cobanov (2000) for furtherdetails. In short, prices and nutritional compositionof all ingredients traded in a given market are used toback-calculate, using statistical methods, what themarkets are implicitly pricing the nutrients containedin feeds.
Market prices of nutrients in the Midwest for the 86months between January 2005 and March 2012 areshown in Figure 1. During this period, the cost perunit of NEL has more than tripled, the cost per unit ofMP has doubled, while the cost per unit of eNDF hassurged in the first half of 2011. The U.S. hasexperienced drastic changes in renewable energy
policies during the last decade, some of which havehad a substantial effect on feed prices. However,large variation in nutrient unit prices are still evidenteven over a much shorter period of time such as whathas occurred since January 2011 (Table 1).
What affects nutrient unit prices? Market prices ofall feeds affect nutrient unit prices, not just the pricesof corn, soybean meal and alfalfa hay. Therefore,nutrient unit prices change through time andlocation. We have already shown how nutrients canquickly change through time in Table 1. Because ofregional differences in feed prices and availability,nutrient unit prices also show substantial regionaldifferences (Table 3). In this paper we will be usingMidwest nutrient unit prices. When examining theeffect of time, we will use January 2011 to March 2012prices.
Where do I find the nutrient unit prices? You canpurchase a Windows-based software that we wrote(Sesame) for $10 at www.sesamesoft.com. Beware thatit is NOT the easiest software to use. Alternatively,we publish a regular column in Progressive Dairymanwhere we publish the nutrient unit prices for themajor dairy regions of the U.S.
Forage CompositionNutrient composition used in this paper. Each lot offorage has a unique nutrient composition that affectsits value. The nutrient composition of forages usedas examples in this paper are reported in Table 2. Weused 3 levels of quality for legume hay and grass hay.
A few things are worth mentioning here. First, noticethat the quality of alfalfa (and grass) has a muchsmaller effect on its metabolizable protein than on itscrude protein. Second, observe that in alfalfa thenon-fiber carbohydrates (NFC) contribute 2 timesmore to its energy content (i.e., TDN) than the NDF.In grass, the situation is reversed, with NDFcontributing significantly more to the energy contentthan NFC. Total tract NDF digestibility is greater ingrass (~47%) than in alfalfa (~39%) of equivalentquality.
How are NEL and MP calculated? Equations used inthe calculation of NEL and MP according to NRC(2001) are reported in the appendix. Although theseequations may seem intimidating at first, they caneasily be programmed in a computer spreadsheet.While 9 chemical entries are required for thecalculation of NEL only 5 measurements will have
46

much effect on NEL in practice: DM, CP, NDF, lignin,and ash. Other entries can simply be taken fromstandard feed composition tables.
The calculation of MP requires a measurement of CP,rumen degradability of protein (RUP_CP), and post-ruminal digestibility of RUP (RUPd). Some feedlaboratories provide estimates of RUP_CP, but thevariation within a type of hay is relatively small andlargely inconsequential to the value of the forage.Likewise, table values for RUPd should be used.
What NDF digestibility should be used? The ratio oflignin to protein-free NDF is used to estimate in vivototal tract NDF digestibility (TT-NDFd) in theequation for TDN_NDF reported in the Appendix.The 2/3 exponent is used to convert mass to surfacearea, hence representing the decrease in NDFdigestibility due to the surface interaction (i.e.,coating) of cell walls by lignin. This conceptualinteraction is necessarily a simplification of thecomplex anatomy and chemistry of plant cell walls.Some have advocated the use of in vitro NDFdigestibility (NDFd) as a proxy for the calculated TT-NDFd used when calculating TDN_NDF. Althoughthis approach is appealing, much doubt remainsregarding the relationship between NDFd and TT-NDFd. For example, we have summarized therelationship between TT-NDFd and NDFd for 23diets where TT-NDFd was measured using total fecalcollection in trials conducted at our experimentalresearch station (Figure 2). In this figure, it isapparent that NDFd overestimates differencesbetween treatments and that the magnitude of thedifference in NDFd is not related to the magnitude ofthe difference in TT-NDFd. The ranking withinexperiment was often OK with NDFd, raising thepossibility of using NDFd for energy calculation. It isclear, however, that NDFd cannot be directlysubstituted for TT-NDFd when calculating the energyof a feed. Much work is needed in this area.Meanwhile, we still recommend using the equationwith the ratio of lignin to protein-free NDF forestimating the energy contribution of NDF.
Calculating the Value of a ForageThe value of the nutrients. So far, we have shownthat nutrient unit prices can be calculated frommarket information from all feedstuffs traded in anarea. We also explained how the nutrientcomposition of forages for the economicallyimportant nutrients are calculated. Determining thevalue of the nutrients in a given forage involves a
series of simple arithmetical operations. These areillustrated for the reference alfalfa in Table 4 usingthe average price of nutrients for the Midwest fromJanuary 2011 to March 2012.
Correcting for milk production response. For mostfeeds, the sum of the values of the nutrients ascalculated in the preceding paragraph is its averageeconomic value; but not for forages. While mostfeeds are substitutable based on their nutrientcontent, this is not entirely true for forages. Whatthis means is that two rations balanced for exactly thesame nutrient density (NEL, MP, eNDF, neNDF) butusing forages of different quality do not result inexactly the same milk production. Cows fed theration based on a high quality forage respond toforage quality with additional milk productionmainly through greater dry matter intake (DMI).Note that this is not the same as the response tofeeding forages of different quality, but without anyration re-balancing. Here the rations are identical intheir nutritional content, but cows fed rations basedon higher quality forages achieve a greater level ofmilk production.
We used results from many research trials to calculatethe response to forage quality. Although one couldthink of a better marker of quality than the total NDFcontent of forage, the data did not allow thecalculation of anything more than NDF. Theresulting equations used to calculate the value perton of forage due to milk production responses are:
Alfalfa: Value of Response ($/ton) = [(P-Milk x 0.273x (44 – NDF)] x DM ÷ 100
Grass: Value of Response ($/ton) = [(P-Milk x 0.3 x(53 – NDF)] x DM ÷ 100
where P-Milk is the price of milk ($/cwt). It isimportant to understand that this adjustment to thevalue of forages means that forage values aredependent on milk prices. The difference in thevalue of a high quality forage compared to that of alow quality forage is much smaller when milk pricesare low (such as in 2009) then when milk prices arehigh (as in 2011).
Effect of forage type and quality on the value offorage in 2011. Table 5 summarizes the values ofalfalfa and grass hay for 3 levels of quality for theperiod of January 2011 to March 2012. On anaverage, the range in values due to quality is greaterin grass ($124/ton) compared to alfalfa ($73/ton).This could be due to the arbitrary range of quality
47

selected for the two types of forages. On an average,alfalfa is worth $50/ton more than grass. Comparedto alfalfa, grass hay shows a greater range in valuethrough time: $109 and $126/ton for alfalfa andgrass, respectively. More importantly, the value offorages changes considerably through time even overa short time span.
Contribution to calculated values. The value of aforage is the sum of the values of its importantnutrients plus the milk response associated with theforage quality expressed as NDF content. Thecontribution of each nutrient to the value of a forageis not the same. Table 6 shows the averagecontribution of NEL, MP, eNDF, neNDF, and milkresponse for the 15 months since January 2011 for thereference alfalfa and grass hays. On an average,energy (NEL) content accounts for nearly 65% of thevalue of alfalfa hay and 75% of the value of grass hay.Notice that the protein in alfalfa (20% crude protein)is only worth $7/ton more than the protein in grass(12% crude protein). This is because most of theprotein in forage is rumen degradable (RDP), and theunit value of RDP ($/lb) is generally null and ofteneven slightly negative (results not shown). Producingforages of greater protein content is of little valueunless the protein increase is associated with anincrease in the digestibility (energy) of the resultingfeeds.
In hay and most haycrop silages, most of the NDF iseffective, resulting in very small neNDF content(Table 2). Therefore, the contribution of neNDF to thevalue of long hays could be entirely ignored withoutmeaningful losses in the accuracy of estimating theireconomic values.
Marginal changes from compositional values. The 4nutrients used to calculate the value of a forage arecalculated from 11 compositional entries. We cancalculate the change in the value of our referencealfalfa and grass hay from a one-unit change in eachof the 11 entries (Table 7). One should be extremelycareful in the interpretation of these results. First, aone-unit change does not represent the same degreeof “difficulty” across all compositional elements. Forexample, it is considerably easier to raise the NDF ofgrass by one unit than to raise its ether extracts alsoby one unit. Second, and even more importantly, it isvery difficult in nature to change a compositionalelement by one unit without affecting any of theother compositional elements. For example, crudeprotein in alfalfa is negatively associated with NDF
content. On average, raising crude protein lowers theNDF content (i.e., the plant is more immature).Likewise, NDF and lignin content are positivelyassociated, meaning that an increase in NDF contentis generally associated with an increase in lignincontent. Keeping these reservations in mind,compositional elements can be loosely grouped into 3categories.
1. Those with a small effect on the value of hay:RUP, RUPd and NDFe,
2. Those with a medium effect on the value ofhay: DM, CP, NDICP, and
3. Those with a large effect on the value of hay:ADICP, ether extracts, NDF, lignin and ash.
Ether extracts and ADICP are relatively constantwithin hay type compared to NDF, lignin and ash.NRC (2001) reports standard deviations of 0.4(ADICP), 0.5 (ether extracts), 0.9 (lignin), 1.0 (ash),and 6.3 (NDF) percent. Thus, NDF, lignin, and ashare arguably the most influential compositionalentries to hay values. Note that the net effect of NDFon hay values incorporates its positive effect onforage value from its positive contribution to eNDF,and its negative effects on forage value from itsnegative contribution to NEL and MP.
Concluding remarksThe values calculated in this paper are on a farm-gatebasis (i.e., delivered) and not FOB. Therefore, foragegrowers would have to account for delivery costswhen estimating the value of a given hay or silage.In addition, the values calculated in this paper areaverages and represent what coherent buyers shouldbe willing to pay. Coherent behavior is often anelusive attribute in feed markets. Some buyersconsistently shop for “supreme” quality alfalfa haybecause that’s what they have been using for yearswithout ever considering whether other quality levelsor even other types of feeds make more economicsense. A very thirsty man is much more willing topay an exorbitant price for a cold beer, especially if hefails to consider the free water available from anearby fountain.
ReferencesSt-Pierre, N. R., and D. Glamocic. 2000. Estimating unitcosts of nutrients from market prices of feedstuffs. J.Dairy Sci. 83:1402-1411.
48

Appendix
Equations used to calculate NEL (NE_3X, Mcal/lb) of forages:TDN_NFC = 0.98 x (100 – NDF + NDICP – CP – EE – ASH)TDN_NDF = 0.75 x (NDF – NDICP – LIG) x (1-(LIG/(NDF-NDICP))0.667)TDN_CP = CP x exp(-1.2 x ADICP/CP)TDN_EE = (EE – 1) x 2.25TDN_1X = TDN_NFC + TDN_NDF + TDN_CP + TDN_EE - 7DE_1X = (TDN_NFC x 0.042) + (TDN_NDF x 0.042) + (TDN_CP x 0.056)
+ ((EE-1) x 0.094) - 0.3TDN_3X = TDN_1X x 0.92NE_3X = (0.6532 x DE_1X) - 0.5064 Equations used to calculate the metabolizable protein (MP, % of DM) of forages:dRUP = CP x RUP_CP x RUPd ÷ 10000dMTP = TDN_3X x 1.3 x 0.64 ÷ 10MP = dRUP + dMTPEquations used to calculate effective and non-effective NDF of forages:eNDF = NDF x NDFeneNDF = NDF - eNDFwhere:ADICP = ADF insoluble crude protein (% of DM)ASH = Ash (% of DM)CP = Crude protein (% of DM)dRUP = Digestible RUP (% of DM)dMTP = Digestible microbial true protein (% of DM)EE = Ether extracts (% of DM)eNDF = Effective NDF (% of DM)exp = The exponential function (i.e., e exponent the value in parentheses)LIG = Lignin (% of DM)NDF = Neutral detergent fiber (% of DM)NDFe = NDF effectiveness (% of NDF)NDICP = NDF insoluble crude protein (% of DM)NE_3X = Net energy for lactation measured a 3 times maintenance (Mcal/lb)neNDF = Non-effective NDF (% of DM)RUP_CP = Rumen undegradable protein (% of CP)RUPd = Digestibility of RUP (% of RUP)TDN_1X = Total digestible nutrients at 1 time maintenance (% of DM)TDN_3X = Total digestible nutrients at 3 times maintenance (% of DM)TDN_CP = TDN from the crude protein fraction (% of DM)TDN_EE = TDN from the ether extracts fraction (% of DM)TDN_NDF = TDN from the NDF fraction (% of DM)TDN_NFC = TDN from the NFC fraction (% of DM).
49

Table 1. Nutrient unit prices in the Midwest between January 2011 and March 2012.
Nutrients Average S.D. Min MaxNEL (¢/Mcal) 16.5 2.7 11.1 20.8MP (¢/lb) 23.6 9.6 9.7 40.6eNDF (¢/lb) 3.6 3.5 0.0 11.9neNDF (¢/lb) -8.7 3.7 -13.5 -3.2
Table 2. Nutrient composition of the reference alfalfa hay, reference grass hay, and low and high quality hays usedas examples.
Alfalfa GrassNutrients1 Units Reference Low High Reference Low HighDry matter % 88 88 88 88 88 88Crude protein % 20 16 24 12 8 16NDICP % 2.5 2.5 2.5 4.0 4.0 4.0ADICP % 1.5 1.5 1.5 1.0 1.0 1.0Ether extracts % 2.0 2.0 2.0 2.5 2.5 2.5NDF % 40 44 36 60 68 52ADF % 30 34 26 40 48 32Lignin % 7.0 8.8 5.4 6.5 8.5 4.5Ash % 10 10 10 7 7 7RUP %CP 25 25 25 30 30 30RUPd % RUP 70 70 70 65 65 65Effective NDF % NDF 92 92 92 98 98 98
TDN from NFC % 29.9 29.9 29.9 22.1 18.1 26.0TDN from NDF % 15.4 15.8 14.8 28.3 30.8 25.9TDN from CP % 18.3 14.3 22.3 10.9 6.9 14.8TDN from EE % 2.3 2.3 2.3 3.4 3.4 3.4TDN at 3X % 54.0 50.7 57.1 52.9 47.9 57.9NEL at 3X Mcal/cwt 57.6 51.5 63.5 53.0 44.6 61.5MP at 3X % 7.99 7.02 8.95 6.73 5.55 7.94
———————————————- Units per Ton ———————————————NEL Mcal 1014.2 906.7 1118.1 932.6 785.5 1082.3MP lbs 140.7 123.5 157.6 118.6 97.6 139.7eNDF lbs 647.7 712.4 582.9 1034.9 1172.9 896.9neNDF lbs 56.3 62.0 50.7 21.1 23.9 18.3
1NDICP = NDF insoluble crude protein; ADICP = ADF insoluble crude protein; NDF = neutral detergent fiber; ADF= acid detergent fiber; RUP = rumen undegradable protein; RUPd = RUP digestibility; TDN = total digestiblenutrients; NEL at 3X = net energy for lactation calculated at an intake of 3 times maintenance; MP at 3X =metabolizable protein calculated at 3 times maintenance.
50

Table 3. Nutrient unit prices across 3 regions1, April, 2012.
Nutrients Northeast Midwest WestNEL (¢/Mcal) 20.8 15.2 18.4MP (¢/lb) 18.8 27.2 20.4eNDF (¢/lb) -3.3 -0.2 8.5neNDF (¢/lb) -18.6 -7.1 -4.21 Northeast prices are for NY and northern PA; Midwest prices are for WI and eastern MN; West prices are for theSan Joaquin Valley of CA.
Table 4. Calculation of the value of the nutrients in one ton of the reference alfalfa hay using average nutrient unitprices from January 2011 through March 2012.
DM Mcal or Unit Prices ValueComposition % Pounds per
Ton ¢ $/tonNEL (Mcal/cwt) 57.6 88 1014.2 16.5 167.34MP (% DM) 7.99 88 140.7 23.6 33.20eNDF (% DM) 36.8 88 647.7 3.6 23.31neNDF (% DM) 3.2 88 56.3 -8.7 -4.90Total 218.95
Table 5. Value ($/ton) of alfalfa and grass hay of 3 quality levels, Midwest, January 2011 to March 2012.
Feeds Average SD1 Min MaxAlfalfa - Reference 241 37 193 302
- Low 204 36 162 265- High 277 38 223 338
Grass - Reference 191 46 145 271- Low 129 47 77 210- High 253 47 197 332
1 SD = standard deviation.
Table 6. Average contribution of NEL, MP, eNDF, neNDF, and milk response to the value of our reference alfalfaand grass hays between January 2011 and March 2012.
Alfalfa GrassComponent $/ton % of Total $/ton % of TotalNEL 154.55 64.0 141.75 73.7MP 43.75 18.2 36.88 19.2eNDF 30.44 12.6 48.64 25.3neNDF -4.78 -2.0 -1.79 -0.9Milk 17.29 7.2 -33.26 -17.3Total 240.86 100.0 192.21 100.0
51

Table 7. Marginal change in value of forage hay ($/ton) from a one-unit increase in each of the compositionalentries between January 2011 and March 2012.
Change in forage value ($/ton)Composition entries Alfalfa - Reference Grass - ReferenceDry matter (%) 2.73 2.19Crude protein (% DM) 2.12 2.23NDICP (% DM) 1.28 1.14ADICP (% DM) -5.17 -5.01Ether Extracts (% DM) 4.72 4.72NDF (% DM) -4.96 -5.10Lignin (% DM) -4.42 -5.38Ash (% DM) -3.68 -3.67RUP (% CP) 0.76 0.43RUPd (% RUP) 0.27 0.20NDF Effectiveness (% NDF) 0.93 1.40
Figure 1. Price of nutrients in the Midwest from January 2005 through March 2012. NEl$ = Net energy for lactation ($/Mcal), MP$ = metabolizable protein ($/lb), and e-NDF$ = effective NDF ($/lb).
Figure 2. Relationship between whole diet total tract in vivo NDF digestibility (TT-NDFd) expressed as deviationfrom a control diet and in vitro NDF digestibility (NDFd).
52

IntroductionInstallation of Automatic Milking Systems (AMS) inIowa is expected to more than triple in 2012. It isprobable that by 2020, 10% to 30 % of dairy producerswill be using AMS in their dairy operations. In order toassist dairy producers and their lenders make informeddecisions on the economic variables associated withAMS consideration, these authors developed a partialbudget spreadsheet tool. See Page three forassumptions and calculations.
There are two very important things to note whencomparing AMS versus conventional parlor milking.First, many factors are “highly variable” meaning thatslight changes in milk price or projected change in milkproduction, for instance, can significantly change thefinancial impact. Second, there is limited data to basevarious assumptions meaning producers andconsultants will have limited research data forprojecting costs and incomes with high confidencelevels.
Herd and Financial AssumptionsHerd size is important in calculating the number ofAMS needed. One AMS can handle an estimate 55-65milking cows. An additional 10% to 12% herd size canbe added when including dry cows. Thus, a 70 cowtotal herd per AMS can be feasible depending uponmilk production.
Milk price should be estimated as a long term, projectedaverage. Estimated cost per AMS should include newbuilding or modifications to existing structures to housethe robot and adequate alleys for cow flow. Anestimation of $10,000 per AMS for housing can beexpected and most robots coming on the market in 2011are estimated to cost around $200,000 per AMS.
Many AMS installed in 2000 are still in operation. So,“years of useful life” is an unknown variable. Sevenyears of useful life is a very conservative estimate whilemore than 12 years may be risky, especially with therapid development in AMS technology. The value ofAMS after its useful life is also not clearly defined atthis time.
Interest rate on money should display the rate whichrepresents cost of interest paid or the opportunity costof the owner’s money, or, a combination of both.Insurance rate is the rate per $1,000 of value of AMS.Value of AMS used for interest and insurance is the fullinvestment value less salvage value.
Labor Changes One of the leading interest factors of AMS is thereduction of labor. Current hours of milking for thedesignated herd size in a conventional parlor needs tobe compared to the anticipated hours of milking laborafter the AMS is installed. Typically, the trainingperiod will last three months, labor rates after thisperiod should be used in the assumptions. A reductionin time managing labor is probable.
The herd management software includes rumination,milk conductivity and cow activity. This informationcan lead to labor savings from heightened heat andmastitis detection and faster identification of sick cows.There will likely be an increase in records managementwith the AMS to utilize the software data that mightnot be there with conventional milking systems.
Milk Production and Quality ChangesProducers may experience losses in milk production sixto nine % lower from 3x milking. From 2x milking, onecould expect a three to five % increase or more. This is ahuge variable of AMS financial impact. Somatic CellCounts (SCC) and bacteria counts tend to increase inthe first few months after adoption to the AMS buttends to drop to initial levels or even lower after theadoption period.
Feed Costs and Intake ChangesFeed cost per pound and intake level changes areseldom accounted for but can be significant. Milkproduction and feed intake have a positive correlation.AMS utilize a pelleted feed during milking which mayincrease feed cost depending on cost and current TMR.However, feed cost could decrease relative to previousfeeding practices as cows are individually fed withAMS.
The Economics of Automatic Milking SystemsKristen Schulte, Farm and Agri-Business Management Specialist, ISU Extension Dairy Team
Larry Tranel, Dairy Field Specialist, ISU Extension Dairy Team14858 West Ridge LaneDubuque, IA [email protected]
53

Culling and Herd Replacement ChangesMost producers report no change in culling percent.But, expected change in turnover rate should beaccounted for in herds with poor feet and legs orpossibly herds with genetic potential for lots of reversetilt udders.
Utilities and Supply Changes for MilkingAMS systems may increase electrical usage up to 150kWh per cow per year. Water usage may decrease 50 %or more for small herds using only one AMS, but waterusage is more comparable for herds using two or threeAMS. Chemical and supply costs may be higher insome instances but in most instances would slightlydecrease.
Sample 140 Cow Dairy Converting to AMSA 140 cow herd and $17 per cwt milk price are used asa basis for installing two AMS at a cost of $210,000 perunit. A $10,600 annual maintenance agreement is alsopurchased. The producer expects a ten year useful lifeout of the AMS at which time he plans to retire andestimates the robots can be resold for $40,000 each.Using a combination of borrowed and own money, theinterest cost is 5.5 %. And, the producer further insuresthe AMS at a value of $350,000 higher than the currentsystem at a rate of $0.005 per $1,000 of valuation.
The producer is currently using 6.5 hours of labor formilking including set-up and clean-up and expects thetime for fetching cows and clean-up of the AMS areawill be 1.5 hours per day. Heat detection is projected todecrease from 30 to 0 minutes per day. The labor ratefor the milking and heat detection is currently hired at$15 per hour, including benefits and employment taxes.
The producer recognizes that there will be an additional15 minutes per day of records management with theAMS but also estimates there will be a reduction of ahalf hour per day in management of labor. The laborrate for record and labor management is valued at $20per hour.
The herd has a current bulk tank average of 70 poundsper cow on 2x milking. A seven pound per cow (10%)increase in milk production is projected. The produceralso expects the AMS to do a better job with pre andpost milking sanitation, thus reducing his SCC by five%.
The Total Mixed Ration (TMR) fed to the herdcurrently costs $0.105 per pound of dry matter. Thedaily dry matter intake per cow will increase with the
additional seven pounds of milk. Even though nowusing a pelleted feed in the AMS, a very small decreaseof $0.001, one-tenth of one cent, is estimated as thechange in cost per pound of dry matter due toindividual cow feeding.
54

The producer expects a one % decrease in herd turnoverrate. Replacement heifers are valued at $1,600 and cullcows sold for milk or dairy at an average of $850. An increase of $8.25 per cow per year for electricity isanticipated with AMS. Due to neighbor’s experiences,this producer estimated a $3 savings per cow for wateruse and a $1.50 increase in chemical or other supplyuse.
Partial Budget Analysis for 140 Cow DairyA partial budget considers changes to an operation dueto
AMS adoption including increased or decreasedincomes or expenses. All costs are on an annual basis.At $17.00 per cwt milk price for 140 cows, an additional$54,978 of milk production income is generated.Reducing SCC by five % with a $0.003 per 1,000 mlchange yielded $1,281 in premiums. A one % decreasein cow sales equaled -$1,190 in cull cow sales. Totalincreased incomes equaled $55,069.
Decreased expenses that also created a positive impactinclude labor savings of 0.5 hours of heat detection, 4
55

hours of milking and 0.5 hour of labor managementper day. This equates to financial savings of $2,738 inheat detection and $27,375 in milking labor. Andreduction in labor management time for the owner wasvalued at $3,650. The total decreased expenses equaled$33,763 and when added to increased incomes gave atotal positive impact of $88,831 by adopting AMS.
On the negative impact side only increased expenses areentered as no decreased incomes are expected. Thecapital recovery cost of the robots includes thedepreciation and annual interest cost of owning theAMS. Depreciating the AMS out over ten years andcharging 5.5 % interest against the purchase value yieldsa cost of $57,100 annually.
Increased repair and insurance costs stems from anannual maintenance contract on the AMS and theadditional value to insure the AMS at total of $12,350.Additional feed costs of $19,760 come from the drymatter needed to produce the additional milk alongwith changes in total TMR costs due to pelleted feedand/or individual feeding of cows in the AMS. Thisproducer expected a $0.001 cost reduction per pound ofdry matter. Due to one % decreased cull rate, heiferreplacement costs decrease $2,240. Increased utilities,mainly from electricity, add $945 while increasedrecords management labor adds $1,825. Total increasedexpenses and total negative impacts are $89,740.
Net financial impact, positive minus negative impacts, iscalculated at $-909 for this example. But, quality of lifeimprovements from a flexible management schedule andnot being tied to an early morning milking schedule isvalued at $10,000. And, valuing the ability to micromanage the herd with the herd record system at another$3,000 annually, the net impact becomes $12,091.
So, the adjusted value of the AMS depends heavily onthe variables used, value of the quality of life, andability to profit further from the herd managementsoftware.
56

Mike Allen, Michigan State University, 2265A Anthony Hall, East Lansing, MI 48824-1225, Phone: 517-432-1386, Email: [email protected]
Presentation at the 2012 4-State Dairy Nutrition and Management Seminar, June 13&14, 2012, Dubuque, Iowa
Mind Over Models
Mike Allen Department of Animal Science
1
Objec6ve: Review the process of ra1on formula1on to be7er balance alloca1on of resources (1me and money).
Reality check�
Overview
• Ra1on balancing programs are unbalanced: overly complicated in some areas and deficient in others
• Not considered: effects of diet on energy intake and par11oning • Accuracy of rumen models
– Rates of diges1on and passage are wrong – Incorrect model structure
• Collec1ve knowledge: qualita1ve >> quan1ta1ve • Qualita1ve knowledge very useful • Key: evaluate cow response to diet • Must reduce varia1on in feeds, ra1ons, and groups of cows

Mike Allen, Michigan State University, 2265A Anthony Hall, East Lansing, MI 48824-1225, Phone: 517-432-1386, Email: [email protected]
Presentation at the 2012 4-State Dairy Nutrition and Management Seminar, June 13&14, 2012, Dubuque, Iowa
Diet formula6on
• Choose representa1ve cow – milk yield, BW, DIM, weight loss/gain
• Calculate nutrient requirements – Maintenance, growth, milk yield, BW change
• Predict DMI • Predict energy supply
– Diges1bility – Efficiency of u1liza1on
• Predict protein (AA) supply – Rumen undegraded protein – Microbial protein
Energy intake and par66oning
• “Holy Grail” of diet formula1on
• Not considered by ra1on formula1on programs
• Major problem!
– Ra1on affects energy intake and par11oning
– Response varies by physiological state of cow
Energy intake and par66oning
• Concentra1on and diges1on characteris1cs of forage NDF
• Concentra1on and ruminal fermentability of starch
• Concentra1on and type of fat
• Physiological state of cow – Control of DMI: physical or metabolic
– Control of energy par11oning: insulin concentra1on and
sensi1vity, CLA

Mike Allen, Michigan State University, 2265A Anthony Hall, East Lansing, MI 48824-1225, Phone: 517-432-1386, Email: [email protected]
Presentation at the 2012 4-State Dairy Nutrition and Management Seminar, June 13&14, 2012, Dubuque, Iowa
Distribu1on of DM diges1bility for 29 cows consuming the same diet.
7 !
DMI of individual cows ranged from 16.6 to 31.5 kg/d it was not related to dry matter digestibility (P = 0.48). Digestibility variation (cv) Fiber: 26.5% Starch: 5.7%
Data from Voelker et al., 2002, J. Dairy Sci. 85:2650.
Varia6on among cows for ruminal pH
8
Range in mean ruminal pH for 14 cows consuming the same alfalfa silage-based diet Ruminal pH measured every 15 h for 5 days (8 observations/cow) Dry matter intake ranged from 20.6 to 30.4 kg/d but was not related to ruminal pH (P = 0.81)
Kammes and Allen, unpublished
Rate of diges6on: fiber (pdNDF) Oba and Allen 2003 J Dairy Sci 86:184
�
32% starch 21% starch HMC DRY HMC DRY
kd 2.25 2.91 3.15 3.44
pH 6.12 6.13 6.25 6.32
kd: starch concentration P = 0.01 grain type P = 0.05 interaction P = 0.44
pH: starch concentration P = 0.01 grain type P = 0.41 interaction P = 0.48
Closed: 32% starch Open: 21% starch Circle: HMC Triangle: DRY
R = 0.58, P < 0.001 �

Mike Allen, Michigan State University, 2265A Anthony Hall, East Lansing, MI 48824-1225, Phone: 517-432-1386, Email: [email protected]
Presentation at the 2012 4-State Dairy Nutrition and Management Seminar, June 13&14, 2012, Dubuque, Iowa
Ruminal fermenta6on
• Diges1bility • Absorbed protein • Feed intake
– Rumen disten1on – Type and temporal supply of fuels
• Energy par11oning – Type and temporal supply of fuels – FA Biohydrogena1on: CLA
Predic6on of absorbed protein
• Predict ruminal degrada1on of feed proteins – Degrada1on rates highly variable, difficult to measure – Passage rates unknown
• Predict microbial protein flow from rumen – Predict energy supply – Predict efficiency of u1liza1on of energy
(10-‐55 g/kg MN/FOM in 2001 Dairy NRC) – Compe11on between lysis and passage
St. Pierre, 2003 J. Dairy Sci. 86:344
255 g/d
~300 g/d
50#/d
435�
100#/d
690�

Mike Allen, Michigan State University, 2265A Anthony Hall, East Lansing, MI 48824-1225, Phone: 517-432-1386, Email: [email protected]
Presentation at the 2012 4-State Dairy Nutrition and Management Seminar, June 13&14, 2012, Dubuque, Iowa
Calcula6ng ruminal diges6bility from kine6cs
Digested�
Passed �
kd �
kp �
Rumen �
Digestibility = �kd �
kd+ kp
Assumptions: 1) Homogeneous fraction 2) First-order kinetics 3) Absolute rates required
Chemically defined frac6ons in CNCPS (1992)
Carbohydrate % h-1 A: sugars 300-500
B1: starch 20-40 B2: soluble fiber 20-40 B3: available NDF 4-9 C: unavailable NDF 0 Protein A: NPN 10,000 B1: soluble true protein 130-300 B2: moderately degraded protein 3-20 B3: slowly degraded protein 0.05-2.0 C: unavailable protein 0
Rate of diges6on in vitro
• Rate of diges1on inversely related to par1cle size – Ground feeds: rate too high – Unground feeds: rate too low – Can’t mimic in vivo par1cle size reduc1on
• Enzyme limi1ng for some substrates • Rela1ve -‐ not absolute -‐ measure • Cannot be used to predict ruminal diges1bility

Mike Allen, Michigan State University, 2265A Anthony Hall, East Lansing, MI 48824-1225, Phone: 517-432-1386, Email: [email protected]
Presentation at the 2012 4-State Dairy Nutrition and Management Seminar, June 13&14, 2012, Dubuque, Iowa
Problems with passage markers
• Fecal excre1on curves are difficult to interpret • Rare earth markers migrate from feeds • Applied to en1re feed but passage rate of feed frac1on is required
Rare earth elements as markers
• Trivalent: bind to feeds by electrosta1c a7rac1on • Stability constant: [ML] / [M][L]
• Feeds: 103 to 105 (1,000-‐100,000 to 1 ) • Preferen1ally bind to small par1cles with greater surface area • Migrate from feeds to bacteria, smaller feed par1cles, mucins (Allen, 1982)
• Precipitate as phosphates • RE phosphates very insoluble • Stability constant ~1016 (10,000,000,000,000,000 to 1)
Pool and flux vs. rare earth markers Mean Range
Pool and flux* (11 experiments, 315 records)
iNDF 3.2 %/h 1.2 - 5.3 %/h
pdNDF 2.4 %/h 0.2 - 4.3 %/h
Starch 15.3 %/h 3.4 - 33.9 %/h *currently have 18 experiments, 539 records
Rare earth markers (Seo et al. 2006, J. Dairy Sci. 89:2327-2342)
Dry forage 4.5 %/h 3.4 - 5.7 %/h
Wet forage 5.2 %/h 3.9 - 6.3 %/h
Concentrate 6.7 %/h 3.6 - 9.2 %/h

Mike Allen, Michigan State University, 2265A Anthony Hall, East Lansing, MI 48824-1225, Phone: 517-432-1386, Email: [email protected]
Presentation at the 2012 4-State Dairy Nutrition and Management Seminar, June 13&14, 2012, Dubuque, Iowa
Selec6ve reten6on in the rumen Voelker Linton and Allen, 2007 J. Dairy Sci. 90:4770
Kine6cs of par6cle size reduc6on and passage
Size Frac6on % h-‐1 % of NDF in rumen
≥ 2.4 mm iNDF 2.10 15.5
< 2.4 mm iNDF 5.67 40.7
L -‐> S iNDF 6.92
≥ 2.4 mm pdNDF 0.59 19.6
< 2.4 mm pdNDF 1.70 24.2
Voelker Linton and Allen, 2007 J. Dairy Sci. 90:4770
65% of NDF in rumen below threshold size for passage
Passage rate:
~2.8x higher for S vs L
~3.5x higher for iNDF vs pdNDF
�
Gases (CO2 + CH4)AVAILABLEUNAVAILABLE
Float
Sink Fermentation Time
Jung and Allen, 1995 J Anim Sci 73:2774

Mike Allen, Michigan State University, 2265A Anthony Hall, East Lansing, MI 48824-1225, Phone: 517-432-1386, Email: [email protected]
Presentation at the 2012 4-State Dairy Nutrition and Management Seminar, June 13&14, 2012, Dubuque, Iowa
Passage rate is affected by forage characteris6cs
Comparison of bm3 corn silage to isogenic control in 29% and 38% NDF
diets (Oba and Allen, 2000, J. Dairy Sci. 83:1350)
29% NDF 38% NDF Significance, P bm3 control bm3 control NDF CS NDFxCS
INDF kp, h-1 3.73 3.13 3.55 3.27 0.81 0.0001 0.09
Comparison of alfalfa silage (43% NDF) to orchardgrass silage (48% NDF) (Voelker Linton and Allen, 2005)
alfalfa orchardgrass Significance, P INDF kp, h-1 2.93 2.52 0.03
Ruminal starch diges6on does not follow first-‐order kine6cs
• In vitro starch diges1on intra assay c.v. ~ 25% • Diurnal varia1on: rate of starch diges1on ater feeding was 33% faster than before feeding (Ficke7 and Allen, 2002)
• Rate of starch diges1on increased with higher starch diets (Oba and Allen, 2003, Voelker and Allen, 2003)
Rate of passage: starch Ying and Allen, 2005 J. Dairy Sci. 88S:393
Dry > HM (P < 0.01) Vitreous > floury (P < 0.01) Interaction: NS
Rat
e of
sta
rch
pass
age
%/h�

Mike Allen, Michigan State University, 2265A Anthony Hall, East Lansing, MI 48824-1225, Phone: 517-432-1386, Email: [email protected]
Presentation at the 2012 4-State Dairy Nutrition and Management Seminar, June 13&14, 2012, Dubuque, Iowa
Diet consumed ≠ ra6on formulated
• Varia1on in ingredients
• Mixing errors
• Varia1on in mixing and delivery
• Selec1on among cows
Recommenda6ons
• Diet formula1on sotware: accoun1ng system • KISS: avoid overly-‐complicated models • Decrease varia1on in feeds, ra1ons, cows • Include the cow in the loop: milk yield, BCS, manure consistency, MUN, urine pH, ketones, NEFA, etc.
• Concentra1ons not amounts – Don’t get hung up on energy concentra1on
• Energy intake and par11oning is most important • Forage NDF concentra1on and diges1bility, starch fermentability, protein adequacy are most important 26
Evaluate cow responses
• Fill: Forage NDF vs. NFFS
• Glucose precursors: Corn vs. NFFS
• Site of diges1on: HMC vs. DC
• Protein: Corn vs. SBM
• Protein degradability: SBM vs. treated SBM

Mike Allen, Michigan State University, 2265A Anthony Hall, East Lansing, MI 48824-1225, Phone: 517-432-1386, Email: [email protected]
Presentation at the 2012 4-State Dairy Nutrition and Management Seminar, June 13&14, 2012, Dubuque, Iowa
Usefulness of rumen models
• Research • Codify research to help understand rumen func1on • S1mulate ideas for new research • Priori1ze ideas: sensi1vity analysis
• Teaching • Understand interac1ons of diet, microbes and animal performance
• Diet formula1on • S1mulate ideas to solve problems • Not useful for rou1ne diet formula1on

Increased costs and reduced availability of commonbedding materials such as straw and sawdust haveprompted dairy producers to search for alternativebedding sources. Sand can be considered the idealbedding source for dairy cows; it offers improvedcow comfort especially due to better cushion andtraction and it is inorganic which provides minimalnutritive support to mastitis pathogens. However, notall producers consider sand a feasible alternative fortheir operation. Inherent properties of sand can makeit difficult to handle in some manure systems. Recentimprovements in anaerobic digestion and solidsseparation technology as well as the associatedenvironmental benefits of using digesters make theman attractive option for dairy producers. Largeamounts of bedding can be obtained from mechanicalseparation of manure.
There is some skepticism among producers and otherprofessionals in the dairy industry about usingrecycled manure solids (RMS) successfully asbedding for dairy cows. Research data on the use ofRMS as bedding material for dairy cows, milk qualityand animal welfare on farms using RMS, thechemical and bacteriological characteristics of RMS,and methods of obtaining RMS for bedding in theMidwest US were not available. Therefore, theobjectives of our cross-sectional study were to 1)characterize RMS as a bedding material, 2) describedifferent methods for obtaining RMS, 3) documentmanagement practices, milk quality and animalwelfare, and 4) compare characteristics of RMSobtained from different systems.
MethodologyThe study included 38 dairy operations with herdsizes ranging from 130 to 3700 lactating cows.Average herd size was 1300 cows. Farms were visitedonce in the summer. Forty five percent of the herdshad mattresses and 55% had deep bedded stalls.Freestall dimensions - stall width, body restinglength, total stall length, neck rail height, andbedding depth – were measured during the farmvisit. The depth of bedding was estimated prior tothe addition of fresh bedding by measuring thicknessof bedding with a tape measure in stalls withmattresses. In deep-bedded stalls, bedding depth wasestimated in the back third of the stall using a steel
rod manually driven through the bedding material tothe base of the stall and measuring the portion of thesteel rod above the stall surface. Producers wereprovided with a questionnaire designed to gatherinformation related to the method of obtainingmanure solids as well as bedding and othermanagement practices. Composite samples of boththe unused and used bedding material were obtainedfrom each herd for bacterial and chemical analyses.
At the time of visit, 50% or more of the cows in alllactating pens were scored for locomotion, hygiene,and hock lesions. Animals were evaluated forlameness using a 5-point locomotion scoring method.Locomotion scores (LS) were identified as 1 = normallocomotion, 2 = imperfect locomotion, 3 = lame, 4 =moderately lame, 5 = severely lame. Locomotionscoring was performed by one observer as cows wereexiting the milking parlor. A representative numberof cows from the beginning, middle, and end of eachlactating pen were scored for locomotion to avoidbiasing the results. Lameness prevalence for eachlactating pen was calculated as the number ofanimals with LS ≥ 3 divided by the total number ofanimals scored in the pen. Severe lamenessprevalence by pen was calculated as the number ofanimals with LS ≥ 4 divided by the total number ofanimals scored in the pen. Cows were scored for hocklesions (HL) and hygiene in the milking parlor. Hocklesions were scored on a 3-point scale with 1 = nolesion, 2 = hair loss (mild lesion), 3 = swollen hockwith or without hair loss (severe lesion). Cowhygiene was assessed by the amount of dirt on theudder and lower hind legs and was based on a 5-point scale with 1 = clean and 5 = dirty. Across allfarms 37,271 cows were scored for locomotion and29,565 cows for hock lesions and hygiene to representthe average score in each pen.
On-farm herd records were collected for the entireyear and used to investigate mortality, culling, milkproduction, and mastitis incidence. Herd clinicalmastitis incidence was calculated as the number ofcases per 100 cow years (36,500 days) at risk. Both thenumber of clinical mastitis cases and cows at riskduring the year were obtained from the on-farmrecord system. Each reported clinical mastitis casewas considered to be a new case if a 14-d period had
Recycled Manure Solids for Bedding:Does It Work?
Marcia I. Endres and Adam W. HusfeldtDepartment of Animal Science
University of Minnesota, St. Paul, [email protected]
67

passed between the previous and current case ofclinical mastitis. Herd turnover rate was calculated asthe number of animals that left the farm (died orsold) over the course of 1 year divided by the averageherd inventory (dry and lactating cows). Herdturnover rate for cows less than 60 DIM wascalculated as the number of animals that died or weresold within the first 60 DIM divided by the numberof animals that freshened during the year. Daily bulktank milk information from January to December wasobtained from each herd’ s milk processor whenaccessible.
Farm characteristicsThirty-eight Midwest dairy operations fromWisconsin (26), Minnesota (6), South Dakota (4), andIowa (2) were included in this study. Anaerobicdigestion preceded mechanical manure solidsseparation on 50% of the farms, with plug-flowdigesters (14) being more common than complete-mixdigesters (5). Farms without anaerobic digesters wereseparating raw manure for bedding (13) orpurchasing manure solids from dairies withanaerobic digesters (6). All farms used mechanicalscrew press separators to obtain RMS, and 19 of the38 farms were utilizing anaerobic digestion prior tomechanical separation of manure. Average herd sizeof farms using anaerobic digesters was 1755 cows.
On the 13 farms where anaerobic digesters were notused, producers mechanically separated raw manureand either used it without treatment or subjected thesolids to mechanical drum-composting for 18 to 24 hat approximately 150°F. Nine herds used separatedraw manure solids and 4 herds used manure solidsafter drum-composting. Average herd size was 1025cows for farms utilizing a drum-composting unit and1105 cows for farms separating raw manure solids.Six herds in our study were purchasing digestedmanure solids from another dairy operation. In theseherds, manure solids were stockpiled for a period of1-3 weeks and used as needed by the dairy producer.In herds purchasing manure solids, herd sizeaveraged 542 cows.
RMS chemical and bacteriological characteristicsUnused RMS bedding moisture was 72.4% (±6.0)with a pH of 9.16 (±0.2). It contained 1.4% (±0.2) N,44.9% (±1.1) C, 32.7 (±5.2) C:N ratio, 0.44% (±0.19) P,0.70% (±0.21) K, 76.5% (±2.5) NDF, 9.4% (±2.0) ash,4.4% (±1.6) NFC, and 1.1% (±0.5) fat. Used beddingsamples had an average moisture content of 50.4%(±12.6) and a pH of 9.39 (±0.2). These samplescontained 71.3% (±4.1) NDF, 12.2% (±4.2) ash, 1.9%(±0.4) N, 43.0% (±2.1) C, and had a C:N ratio of 22.6(±4.3).
Total bacterial counts in unused bedding were4,211,927 cfu/mL and ranged from 325 to 23,373,500cfu/mL. Proportionally, samples had 58.0% bacillusspecies, 37.2% environmental Streptococci species,4.0% Staphylococcus species, and 0.9% coliforms.Separated raw manure solids contained the greatesttotal counts of bacteria prior to use as freestallbedding. In particular, populations of bacillus,coliforms, and environmental Streptococci weregreater than those found in digested and compostedmanure solids. Populations of bacillus andenvironmental Streptococci species were similarbetween digested and composted solids. Nodifference was found in the populations ofStaphylococcus species between digested, composted,and separated raw manure solids. Coliform bacteriawere not detected in unused samples of compostedsolids.
Total bacterial population in used bedding was13,285,010 cfu/mL and ranged between 25,100 and73,036,500 cfu/mL. Proportionally, bedding sampleshad 51% bacillus species, 39.3% environmentalStreptococci species, 7.4% environmentalStaphylococcus species, and 2.2% coliforms.Bacterial counts among the different types of manuresolids were more similar after use as freestallbedding; however, digested manure solids containedless total bacteria than composted (P < 0.001) andseparated raw manure solids (P = 0.006). Coliformbacteria, not present in composted solids prior to useas bedding, were found in amounts similar to that ofdigested and separated raw manure solids after useas freestall bedding at approximately 145,000cfu/mL. Environmental Streptococci were present inlower concentrations (P < 0.001) in digested manuresolids (1,379,180 cfu/mL) than composted (5,614,707cfu/mL) and separated raw (3,934,915 cfu/mL)manure solids. Digested solids also contained fewer(P < 0.05) bacillus species (1,375,599 cfu/mL) thanseparated raw (2,852,767 cfu/mL) manure solids. Nodifferences were observed in counts ofStaphylococcus species.
Digester comparison Anaerobic digestion was being utilized by 19 of the38 farms in this study and 6 herds were purchasingdigested solids from another dairy. Plug-flowdigesters were most common, with 14 of the 19 herdsusing this type of digester. The remaining 5 herdsused complete-mix digesters. Differences betweensystems include percent solids of manure entering thedigester, mixing of manure within the system, andmost notably the design. Plug-flow digesters usuallyare built below grade and plugs of fresh manureenter the digester at one end and push out digestedmanure at the opposite end. Complete-mix digesters
68

are typically silo-like tanks built above ground whichuse agitators to periodically mix digester contents.
Only minor differences existed between unused RMSobtained from plug-flow compared to complete-mixdigesters. RMS from plug-flow digesters containedless N (1.4%) than from complete-mix digesters (1.6%;P < 0.01). This difference resulted in a greater C:Nratio (P = 0.03) for solids obtained from plug-flowdigesters (31.3) compared to complete-mix (27.7)digesters. Unused RMS bedding moisture, NDF,NFC, ash, total C, P, and K content as well as pHwere not different between digester types. Bacterialpopulations of bacillus, coliforms, environmentalStreptococci, and Streptococcus species were similarbetween unused RMS obtained from plug-flow andcomplete-mix digesters.
Animal welfareStall surface was associated with lameness and hocklesion prevalence. Lameness prevalence (locomotionscore ≥3 on a 1 to 5 scale) was lower in deep beddedfreestalls (14.4%) than freestalls with mattresses(19.8%). It is interesting to note that lamenessprevalence, even for farms using mattresses, wassimilar to lameness prevalences we have observed inherds with deep bedded sand stalls. Severe lamenessprevalence (locomotion score ≥4) was also lower forcows housed in deep bedded freestalls (3.6%) thanfor cows housed in freestalls with mattresses (5.9%).Again, those prevalences are similar to what we havefound in sand-based freestalls. Producers were usinglarge quantities of solids on top of mattresses becausethe bedding material is readily available. In addition,the prevalence of hock lesions (hock lesion scores ≥2on a 1 to 3 scale) and severe hock lesions (hock lesionscore = 3) was lower in herds with deep beddedfreestalls (49.4%; 6.4%) than in herds with mattresses(67.3%; 13.2%).
Herd turnover rates were not associated with stallsurface; however, the percentage of removals due tovoluntary (low production, disposition and dairy)and involuntary (death, illness, injury, andreproductive) reasons was different between deepbedded and mattress based freestalls. Voluntaryremovals averaged 16.1% of all herd removals indeep bedded herds, whereas in mattress herds theseremovals were 7.9%. Herds utilizing RMS in deep-bedded and mattress based stalls were found to havesimilar mortality rates. Mortality rates were 8.2% forherds with deep beds and 8.6% for herds withmattresses. Nearly half of all mortalities were foundto occur prior to 60 DIM. In herds with deep beds,47.2% of mortalities occurred prior to 60 DIM (rangeof 18.7 to 74.0%). Herds with mattresses reported42.7% of deaths occurred before 60 DIM (range of33.8 to 55.3%).
Milk quality and udder healthOne major concern expressed by producersconsidering the use of manure solids for bedding isthe possibility of increased somatic cell count (SCC).We found that yearly average bulk tank SCC was275,000 cells/mL (range - 121,000 to 688,000cells/mL). This average is not very different from theaverage in the region (~290,000). Eighteen percent ofthe herds had a yearly bulk tank SCC less than200,000 cells/mL and 9% had more than 400,000cells/mL. All herds used pre and post-milking teatdisinfection, individual towels for drying udders, androutine dry cow therapy at dry off.
Cows in this study were on the average cleaner thanany other freestall study we have conducted. Thelowest percentile herds for SCC (which averaged186,000 SCC) had an average hygiene score of 2.38 (1-to-5 scale where 1 = clean and 5 = very dirty); thehighest percentile herds (average of 430,000 SCC) hadan average hygiene score of 2.62. Cleaner cows areeasier to prepare prior to milking and are lesssusceptible to mastitis. Stall maintenance and speedof moving cows to the parlor can influence cowhygiene.
Incidence rates of clinical mastitis in the currentstudy were 66.3 and 49.0 cases per 100 cow-years fordeep-bedded and mattress herds, respectively, andranged from 9.3 to 108.7 cases per 100 cow-years indeep-bedded herds and 13.2 to 107.6 cases per 100cow-years in herds with mattresses. No associationwas found between clinical mastitis incidence andstall surface. These relatively high results for clinicalmastitis incidence suggest that udder health may becompromised when using RMS as bedding forlactating dairy cows or producers using RMS arepaying closer attention and detecting clinical casesmore often.
ConclusionsDifferences in the chemical and bacteriologicalcharacteristics of digested, drum-composted, andseparated raw manure solids were found prior to andafter use as bedding. These differences were likelydue to the processes of anaerobic digestion anddrum-composting. Bacteriological differences weresubstantial in unused RMS but were minor after useas freestall bedding. Minor differences existedbetween RMS obtained from plug-flow andcomplete-mix digesters.
The use of RMS in deep-bedded freestalls appearedto provide cows with a more welfare friendly restingsurface than the use of RMS on top of mattresses.Herds with deep beds had a lower prevalence oflameness and hock lesions compared to herds withmattresses. Additionally, the prevalence of severe
69

lameness and severe hock lesions in herds with deep-bedded stalls was lower than those observed in herdswith mattresses. When the results are compared toprevious studies with sand for bedding, we learnedthat lameness prevalence was similar, hock lesionprevalence was slightly higher, and cow hygiene wasbetter in herds using RMS. Similar herd turnoverrates were found between deep-bedded and mattressbased herds; however, removals due to voluntary andinvoluntary reasons were found to be different. Deathwas indicated as the primary reason for herd removalboth during lactation and prior to 60 DIM.
It appears that excellent cow preparation at milkingtime, sanitation of milking equipment, cow hygiene,adequate dry cow housing, and bedding/stallmanagement appeared to be critical in maintaining alow SCC when using recycled manure solids forbedding and making it work. These practices areimportant when using any type of bedding and evenmore so with recycled manure solids. Overall, RMSappear to be a satisfactory bedding option forfreestall dairy herds.
AcknowledgmentsWe thank the dairy producers who participated inthis study and the extension educators and industryrepresentatives who helped identify cooperatorfarms. Thanks to Jim Salfer, Kevin Janni and JeffReneau for their input on the project. We would alsolike to thank Mark Kinsel (AgriMetrica, LLC,Ellensburg,WA) for providing us with the handheldPC software used to collect locomotion, hock lesionand hygiene scores. We also thank AgSource(Menomonie, WI) and DRMS – Dairy RecordsManagement Systems (Raleigh, NC) for access toDHIA data for some farms and the milk processorsfor access to daily bulk tank data. This project wasfunded by the University of Minnesota RapidAgricultural Response Fund.
70

Are Dairy Farmers Polluters?Strategies Aimed at New Regulation Changes
Steven A. Elliott, MSc PASGlobal Manager-Sel-Plex® and Bioplex® Minerals
Alltech Inc.
71

72

73

74

75

76

77

78

79

IntroductionHypocalcemia (low blood calcium) is an importantdeterminant of fresh cow health and milk production.Five key principles shape our understanding of thiscommon metabolic disease and how to manage it.
• Most second and greater lactation cows have atransient hypocalcemia around calving (Kimuraet al., 2006).
• Hypocalcemia is linked to other fresh cowproblems (Goff, 2008, Oetzel, 2011)
• Supplementation with oral calcium is thepreferred approach for supporting cows that areexhibiting early signs of milk fever but are stillstanding (Oetzel, 2011).
• Subclinical hypocalcemia has greater associatedcosts to your dairy than do clinical cases of milkfever (Oetzel, 2011).
• Even herds with successful anionic saltsprograms and minimal cases of clinical milk feverwill benefit from strategic use of oral calciumsupplements (Oetzel, unpublished data, 2012).
The start of each new lactation challenges a dairycow’s ability to maintain normal blood calciumconcentrations. Milk (including colostrum) is veryrich in calcium, and cows must quickly shift theirpriorities to adjust for this sudden calcium outflow.Average blood calcium concentrations noticeablydecline in second or greater lactation cows aroundcalving, with the lowest concentrations occurringabout 12 to 24 hours after calving (Figure 1) (Goff,2008, Kimura et al., 2006).
Subclinical Hypocalcemia OverviewSubclinical hypocalcemia can be defined as low bloodcalcium concentrations without clinical signs of milkfever. Subclinical hypocalcemia affects about 50% ofsecond and greater lactation dairy cattle fed typicalpre-fresh diets. If anions are supplemented to reducethe risk for milk fever, the percentage ofhypocalcemic cows is reduced to about 15 to 25%(Oetzel, 2004).
A cow does not necessarily have to becomerecumbent (down) to be negatively affected by
hypocalcemia. With or without obvious clinicalsigns, hypocalcemia has been linked to a variety ofsecondary problems in post-fresh cows (Goff, 2008,Oetzel, 2011). This happens because blood calcium isessential for muscle and nerve function - particularlyfunctions that support skeletal muscle strength andgastro-intestinal motility. Problems in either of theseareas can trigger a cascade of negative events thatultimately reduce dry matter intake, increasemetabolic diseases, and decrease milk yield (Goff,2008). This is illustrated in Figure 2.
Figure 1. Plasma concentrations of total calciumbefore and after calving in mature Jersey cows withor without clinical milk fever (Kimura et al., 2006).
Figure 2. Proposed mechanisms for reduction inmilk yield in early lactation cows due tohypocalcemia.
An Update on Hypocalcemia on Dairy FarmsGarrett R. Oetzel, DVM, MS
School of Veterinary Medicine, University of Wisconsin-Madison2015 Linden Drive, Madison, Wisconsin 53706
80

Subclinical hypocalcemia is more costly than clinicalmilk fever because it affects a much higherpercentage of cows in the herd (Oetzel, 2011). Forexample, if a 2000-cow herd has a 2% annualincidence of clinical milk fever and each case ofclinical milk fever costs $300 (Guard, 1996), the lossto the dairy from clinical cases is about $12,000 peryear. If the same herd has a 30% annual incidence ofsubclinical hypocalcemia in second and greaterlactation cows (assume 65% of cows in the herd) andeach case costs $125 (an estimate that accounts formilk yield reduction and direct costs due to increasedketosis and displaced abomasum), then the total herdloss from subclinical hypocalcemia is about $48,750per year. This is about 4 times greater than the costof the clinical cases.
A recently published, large multi-site study showsthat hypocalcemia around calving is most stronglyassociated with reduced milk yield (Chapinal et al.,2012) and increased risk for displaced abomasum(Chapinal et al., 2011). These studies alsodemonstrated that the cutpoint for serum totalcalcium is higher (about 8.5 mg/dl) than waspreviously assumed (see Figures 3 and 4).
Figure 3. Effect of serum total calcium on milk yieldfor the first 4 DHI tests after calving. Differentcutpoints were derived for serum samples collectedon weeks -1, 1, 2, and 3 after calving. Data are from2,365 cows in 55 Holstein herds in Canada and theUS (Chapinal et al., 2012).
Figure 4. Effect of serum total calcium on the oddsfor displaced abomasum after calving. Differentcutpoints were derived for serum samples collectedon weeks -1, 1, 2, and 3 after calving. Data are from2,365 cows in 55 Holstein herds in Canada and theUS (Chapinal et al., 2011).
Treatments for Subclinical Hypocalcemia andClinical Milk FeverClinical signs of milk fever in dairy cattle aroundcalving may, for convenience, be divided into threestages. Stage I milk fever is early signs withoutrecumbency. It may go unnoticed because its signsare subtle and transient. Affected cattle may appearexcitable, nervous, or weak. Some may shift theirweight frequently and shuffle their hind feet (Oetzel,2011).
Oral calcium supplementation is the best approachfor hypocalcemic cows that are still standing, such ascows in Stage 1 hypocalcemia or who haveundetected subclinical hypocalcemia (Oetzel, 2011).Cows absorb an effective amount of calcium into herbloodstream within about 30 minutes ofsupplementation. Blood calcium concentrations aresupported for only about four to six hours afterwards(Goff and Horst, 1993, 1994) for most forms of oralcalcium supplementation.
Intravenous (IV) calcium is not recommended fortreating cows that are still standing (Oetzel, 2011).Treatment with IV calcium rapidly increases bloodcalcium concentrations to extremely high andpotentially dangerous levels (Goff, 1999). Extremelyhigh blood calcium concentrations may cause fatalcardiac complications and (perhaps mostimportantly) shut down the cow’s own ability tomobilize the calcium she needs at this critical time(Oetzel, 2011). Cows treated with IV calcium oftensuffer a hypocalcemic relapse 12 to 18 hours later(Curtis et al., 1978, Thilsing-Hansen et al., 2002). Theproblems with IV calcium treatment are illustrated inFigure 5.
81

Figure 5. Effect of IV calcium treatment with 10.8 gof elemental calcium on serum total calciumconcentrations in a mature Jersey cow with clinicalmilk fever (Goff, 1999).
Cows in Stage II milk fever are down but not flat outon their side. They exhibit moderate to severedepression, partial paralysis, and typically lie withtheir head turned into their flank. Stage IIIhypocalcemic cows are flat out on their side,completely paralyzed, typically bloated, and areseverely depressed (to the point of coma). They willdie within a few hours without treatment (Oetzel,2011). Stage II and Stage III cases of milk fevershould be treated immediately with slow IVadministration of 500 ml of a 23% calcium gluconatesolution. This provides 10.8 grams of elementalcalcium, which is more than sufficient to correct thecow’s entire deficit of calcium (about 4 to 6 grams).Giving larger doses of calcium in the IV treatmenthas no benefit (Doze et al., 2008). Treatment with IVcalcium should be given as soon as possible, asrecumbency can quickly cause severe musculoskeletaldamage.
To reduce the risk for relapse, recumbent cows thatrespond favorably to IV treatment need additionaloral calcium supplementation once they are alert andable to swallow, followed by a second oralsupplement about 12 hours later (Oetzel, 2011,Thilsing-Hansen et al., 2002).
Transient hypocalcemia can occur in cows wheneverthey go off feed or have periods of decreasedintestinal motility (DeGaris and Lean, 2008). It can bedifficult to tell which comes first - the hypocalcemiaor the gastrointestinal stasis. Whatever the case, thetwo problems can positively reinforce each other.During the experimental induction of hypocalcemia,Huber et al. (1981) noted that ruminal contractionsceased well before the onset of clinical signs of milk
fever. Off-feed cows, particularly in early lactation,are very likely to benefit from prompt oral calciumsupplementation. Even herds with successful anionicsalts programs and minimal clinical cases of milkfever will benefit from strategic use of oral calciumsupplements (Oetzel, unpublished data, 2012). Startby supplementing all standing cows who haveclinical signs of hypocalcemia and all down cowsfollowing successful IV treatment. For herds with ahigh incidence of hypocalcemia, it may also beeconomically beneficial to strategically supplementall fresh cows with oral calcium. Finally, cows withhigh milk yield in the previous lactation (>105% ofherd average ME milk production) and lame cowshave the best response to oral calciumsupplementation (Oetzel, unpublished data, 2012).These cows gave 6.8 lbs more milk at first DHI testcompared to unsupplemented cows.
Types of Oral Calcium SupplementationThe source of calcium in an oral supplement and itsphysical form greatly influence calcium absorptionand blood calcium responses. Calcium chloride hasthe greatest ability to support blood calciumconcentrations (Goff and Horst, 1993, 1994). This canbe explained by its high calcium bioavailability andits ability to invoke an acidic response in the cow,which causes her to mobilize more of her owncalcium stores. Providing a typical amount ofelemental calcium chloride (e.g., 50 grams ofelemental calcium) in a small oral dose provided thebest absorption (Figure 6). Administering 100 gramsof elemental calcium from calcium chloride in waterresulted in excessively high blood calcium - thiscould shut down the cow’s own calcium homeostaticmechanisms and to invoke a calcitonin response toprotect her from hypercalcemia.
Figure 6. Effect of two different doses of oralcalcium chloride on plasma total calciumconcentrations, expressed as percent of baselinevalues (Goff and Horst, 1993).
82

The risk of aspiration is great when thin liquids aregiven orally, and calcium chloride is very caustic toupper respiratory tissues. Calcium propionate ismore slowly absorbed (presumably because it is notacidogenic) and must be given at higher doses ofelemental calcium (usually 75 to 125 grams).
Calcium carbonate in water did not increase bloodcalcium concentrations at all (see Figure 7) (Goff andHorst, 1993). This may be explained by its poorerbioavailability and by the alkalogenic response it caninvoke.
Figure 7. Effect of oral calcium chloride and oralcalcium carbonate on plasma calcium, expressed aspercent of baseline values (Goff and Horst, 1993).
A combination of calcium chloride and calciumsulfate delivered in a fat-coated bolus (Bovikalc®,Boehringer Ingelheim Vetmedica, St. Joseph, MO)resulted in more sustained improvements in bloodcalcium concentrations (see Figure 8) than wereobserved in previous studies with oral calciumchloride or calcium propionate in water (Sampson etal., 2009).
Figure 8. Effect of administration of two Bovikalc®boluses on blood ionized calcium concentrations(expressed as percent of baseline). Experimentalanimals were Holstein cows (n=20) withhypocalcemia at calving (Sampson et al., 2009).
Subcutaneous Calcium TreatmentSubcutaneous calcium can be used to support bloodcalcium concentrations around calving, but hassubstantial limitations (Goff, 1999). Absorption ofcalcium from subcutaneous administration requiresadequate peripheral perfusion. It may be ineffectivein cows that are severely hypocalcemic ordehydrated. Subcutaneous calcium injections areirritating and can cause tissue necrosis;administration should be limited to no more than 75ml of a 23% calcium gluconate solution (about 1.5 gelemental calcium) per site. Calcium solutions thatalso contain glucose should not be givensubcutaneously. Glucose is very poorly absorbedwhen given by this route. Abscessation and tissuesloughing may result when glucose is givensubcutaneously.
The kinetics of subcutaneously administered calciumindicate that it is well-absorbed initially, but thatblood concentrations fall back to baseline values inabout 6 hours (see Figure 9) (Goff, 1999). Thus,repeat doses would be necessary to equal thesustained blood calcium support that is possible withoral calcium boluses.
83

Figure 9. Effect of subcutaneous administration of500 ml of 23% calcium gluconate on plasma totalcalcium, expressed as percent of baseline. The 500ml solution was divided into 10 different sites(Goff, 1999).
Timing of Oral Calcium Supplementation Relativeto CalvingStrategies for giving oral calcium supplementsaround calving should include at least two doses -one at calving calving and a second dose the nextday. The expected nadir in blood calciumconcentrations occurs between 12 and 24 hours aftercalving (Goff, 2008, Sampson et al., 2009). Givingonly one oral calcium supplement around calvingtime leaves the cow without support when her bloodcalcium concentrations are naturally the lowest. It isinteresting to note that the original protocols for oralcalcium supplementation called for 4 doses - oneabout 12 hours before calving, one at calving, one 12hours post-calving, and one 24 hours post-calving. Itwas very difficult to predict when at cow was in factabout 12 hours from expected calving, and manycows calved without receiving this dose (Oetzel,1996). The dose at calving is not practicallychallenging to administer, and providing a dosesometime the day after calving will provide criticalsupport around the time of nadir and can still bepractical in large dairies where the post-fresh pen islocked up just once daily.
Milk Fever Prevention - Dietary CalciumRestrictionThe traditional method of preventing milk fever hasbeen to restrict calcium intake during the dry period.If extremely low calcium diets (< 20 grams of dailycalcium) are fed before parturition and high-calciumdiets are fed after parturition, the incidence of milkfever can be drastically reduced (Green et al., 1981).Low calcium diets prior to calving apparentlyprevent the cow’s active intestinal calcium absorptionand bone calcium resorption mechanisms from
becoming quiescent and unable to respond to thesudden calcium outflow that occurs at parturition.Calcium intake during the dry period is usuallyrestricted by replacing some or all of the alfalfa in adry cow diet with a grass hay and using additionalcorn silage and concentrates.
Milk Fever Prevention - Dietary AcidificationDietary acidity or alkalinity is more important incontrolling milk fever than calcium intake. The useof diets low in dietary cation-anion difference(DCAD) to prevent milk fever has been extensivelystudied and reviewed (DeGaris and Lean, 2008). Alarge meta-analysis (Charbonneau et al., 2006)demonstrated that reducing pre-fresh DCAD by 300meq/kg of diet dry matter (a typical approach)reduced the odds for clinical milk fever 5.1-fold,reduced urinary pH from 8.1 to 7.0, and reduced drymatter intake by 11.3%. It is important to implementa low DCAD strategy only in herds that already havegood intakes in the pre-fresh group and canwithstand an 11% intake reduction. Despite theexpected decrease in pre-fresh dry matter intake,post-fresh intakes are improved when low DCADdiets are fed (Eppard et al., 1996, Joyce et al., 1997).Beede et al. (1992) reported 3.6% more ME milk whenlow DCAD diets are fed.
Milk Fever Prevention - Dietary MagnesiumMagnesium also plays an important role inmaintaining calcium homeostasis around calving(DeGaris and Lean, 2008). A large meta-analysis(Lean et al., 2006) found that increasing dietarymagnesium greatly reduced the odds for clinical milkfever. Magnesium is known to participate in calciumhomeostasis via release of parathyroid hormone andthe synthesis of the active form of vitamin D (1,25dihydroxycholecalciferol). Total intakes of about 40to 50 grams of dietary Mg (about 0.30 to 0.45% of dietdry matter, depending on total dry matter intake)have been suggested (DeGaris and Lean, 2008),although this is complicated because of theinteractions between other dietary factors (DCAD,dietary calcium, and dietary phosphorus).
84

ReferencesBeede, D. K., C. A. Risco, G. A. Donovan, C. Wang, L. F.
Archbald, and W. K. Sanchez. 1992. Nutritionalmanagement of the late pregnant dry cow withparticular reference to dietary cation-anion differenceand calcium supplementation. The Bovine Proceedings24:51-55.
Chapinal, N., M. Carson, T. F. Duffield, M. Capel, S.Godden, M. Overton, J. E. Santos, and S. J. LeBlanc. 2011.The association of serum metabolites with clinicaldisease during the transition period. J. Dairy Sci.94:4897-4903.
Chapinal, N., M. E. Carson, S. J. LeBlanc, K. E. Leslie, S.Godden, M. Capel, J. E. Santos, M. W. Overton, and T. F.Duffield. 2012. The association of serum metabolites inthe transition period with milk production and early-lactation reproductive performance. J. Dairy Sci. 95:1301-1309.
Charbonneau, E., D. Pellerin, and G. R. Oetzel. 2006. Impactof lowering dietary cation-anion difference innonlactating dairy cows: A meta-analysis. J. Dairy Sci.89:537-548.
Curtis, R. A., J. F. Cote, M. C. McLennan, J. F. Smart, and R.C. Rowe. 1978. Relationship of methods of treatment torelapse rate and serum levels of calcium andphosphorous in parturient hypocalcaemia. Can. Vet. J.19:155-158.
DeGaris, P. J. and I. J. Lean. 2008. Milk fever in dairy cows:a review of pathophysiology and control principles. Vet.J. 176:58-69.
Doze, J. G., R. Donders, and J. H. van der Kolk. 2008.Effects of intravenous administration of two volumes ofcalcium solution on plasma ionized calciumconcentration and recovery from naturally occurringhypocalcemia in lactating dairy cows. Am J Vet Res69:1346-1350.
Eppard, P. J., J. J. Veenhuizen, W. J. Cole, P. G. Comens-Keller, G. F. Hartnell, R. L. Hintz, L. Munyakazi, P. K.Olsson, R. H. Sorbet, T. C. White, C. A. Baile, R. J.Collier, J. P. Goff, and R. L. Horst. 1996. Effect of bovinesomatotropin administered to periparturient dairy cowson the incidence of metabolic disease. J. Dairy Sci.79:2170-2181.
Goff, J. P. 1999. Treatment of calcium, phosphorus, andmagnesium balance disorders. Vet. Clin. North Am.Food Anim. Pract. 15:619-639.
Goff, J. P. 2008. The monitoring, prevention, and treatmentof milk fever and subclinical hypocalcemia in dairycows. Vet. J. 176:50-57.
Goff, J. P. and R. L. Horst. 1993. Oral administration ofcalcium salts for treatment of hypocalcemia in cattle. J.Dairy Sci. 76:101-108.
Goff, J. P. and R. L. Horst. 1994. Calcium salts for treatinghypocalcemia: carrier effects, acid- base balance, andoral versus rectal administration. J. Dairy Sci. 77:1451-1456.
Green, H. B., R. L. Horst, D. C. Beitz, and E. T. Littledike.1981. Vitamin D metabolites in plasma of cows fed aprepartum low-calcium diet for prevention of parturienthypocalcemia. J. Dairy Sci. 64:217-226.
Guard, C. L. 1996. Fresh cow problems are costly; cullinghurts the most. Hoard’s Dairyman 141:8.
Huber, T. L., R. C. Wilson, A. J. Stattleman, and D. D.Goetsch. 1981. Effect of hypocalcemia on motility of theruminant stomach. Am. J. Vet. Res. 42:1488-1490.
Joyce, P. W., W. K. Sanchez, and J. P. Goff. 1997. Effect ofanionic salts in prepartum diets based on alfalfa. J. DairySci. 80:2866-2875.
Kimura, K., T. A. Reinhardt, and J. P. Goff. 2006. Parturitionand hypocalcemia blunts calcium signals in immunecells of dairy cattle. J. Dairy Sci. 89:2588-2595.
Lean, I. J., P. J. DeGaris, D. M. McNeil, and E. Block. 2006.Hypocalcemia in dairy cows: meta-analysis and dietarycation anion difference theory revisited. J. Dairy Sci.89:669-684.
Oetzel, G. R. 1996. Effect of calcium chloride gel treatmentin dairy cows on incidence of periparturient diseases. J.Am. Vet. Med. Assoc. 209:958-961.
Oetzel, G. R. 2004. Monitoring and testing dairy herds formetabolic disease. Vet. Clin. North Am. Food Anim.Pract. 20:651-674.
Oetzel, G. R. 2011. Non-infectious diseases: Milk fever. inEncyclopedia of Dairy Sciences. Vol. 2. F. J. W. Fuquay,P.F, McSweeney, P.L.H. , ed. Academic Press, San Diego.
Sampson, J. D., J. N. Spain, C. Jones, and L. Carstensen.2009. Effects of calcium chloride and calcium sulfate inan oral bolus given as a supplement to postpartum dairycows. Vet. Ther. 10:131-139.
Thilsing-Hansen, T., R. J. Jørgensen, and S. Østergaard.2002. Milk fever control principles: a review. Acta Vet.Scand. 43:1-19.
85

Management to support the metabolic adaptationsrelated to energy metabolism that a dairy cowundergoes during the transition period and earlylactation is a critical factor in transition period success.Energy balance is tightly linked with reproductiveperformance (Butler and Smith, 1989), aspects of healthand immunity (LeBlanc, 2010), and markers ofexcessive negative energy balance are generallynegatively associated with milk yield (Ospina et al.,2010). Although a common notion is that milk yield isthe major driver of negative energy balance, severaldata summaries (Santos et al., 2009; reviewed byGrummer et al., 2010) suggest that the relationship ofnegative energy balance is actually greater with drymatter intake (DMI) than with milk yield. Therefore,the major determinant of successful management ofenergy metabolism in transition cows may be the degreeand rate to which energy intake increases during theearly postpartum period.
Clearly, nutritional and environmental management ofdairy cattle during the dry and transition period haveimportant carryover ramifications both for DMI andoverall lactational and reproductive performance alongwith health in early lactation. The purpose of this paperis to briefly overview intake regulation in dairy cattle,describe key metabolic changes in transition cows asthey integrate with intake regulation and then to reviewkey nutritional factors during both the prepartum andpostpartum period that impact peripartal DMI andenergy metabolism so that we can optimize energy andnutrient intake and subsequent performance and healthoutcomes.
INTAKE REGULATION IN DAIRY CATTLEThe first key concept to understand is that intakeregulation in dairy cattle is complex. The variousmetabolic factors that influence DMI in dairy cattle werewell-reviewed by Ingvartsen and Andersen (2000) andincludes a variety of direct and indirect signals related tothe environment, immune system, adipose tissue, signalsfrom the gut and pancreas, and energy sensing of theliver relative to overall energy demand (Figure 1). It islikely that changes in these signals (and cow-to-cowvariation in response to various environmental andmetabolic stimuli) are responsible both for changes inoverall average pen DMI but also variation in cow to cowDMI that likely is more associated with transitionmanagement challenges than average pen DMI per se.
More recently, Allen and coworkers (Allen et al., 2005;Allen et al., 2009) proposed that a major regulator ofDMI in ruminants, and particularly dairy cattle, washepatic energy status. This is largely driven byoxidation of fuels such as propionate derived fromruminal fermentation of rapidly fermentablecarbohydrates and nonesterified fatty acids (NEFA),which are increased in the bloodstream during periodsof negative energy balance and body fat mobilization(Figure 2). In periods when oxidative fuel metabolismby the liver exceeds liver energy requirements, the brainis signaled to decrease DMI. As will be discussed morein detail below, this theory is particularly attractive inexplaining metabolic influences on DMI during theprepartum period. As will be described below,modulation of these pathways, particularly bypropionate is less likely during the immediatepostpartum period because of the large increases inliver energy demands along with other reasons that willbe discussed below.
METABOLIC ADAPTATIONS IN THETRANSITION COWIt is well-recognized that the dairy cows undergoimportant metabolic adaptations during late pregnancy tosupport fetal demands and at the onset of lactation tosupport milk production. These homeorhetic adaptationsinvolved in the regulation of nutrient and energypartitioning during late pregnancy and early lactationoccur in a variety of target tissues, and typically involvechanges in responses of tissues such as adipose tissue andmuscle to homeostatic signals such as insulin andepinephrine (Bauman and Currie, 1980; Bell, 1995). Asdescribed above, one major adaptation includes a largeincrease in glucose demand by the mammary gland that issupported by dramatically increased glucose output bythe liver (Reynolds et al., 2003). In addition, peripheraltissues (primarily skeletal muscle) decrease their use ofglucose for fuel (Bauman and Elliot, 1983; Petterson etal., 1993), thereby sparing glucose for use by the graviduterus and lactating mammary gland. Furthermore,increased mobilization of body fat stores facilitated bychanges in adipose tissue metabolism contributes tomeeting increased whole-body needs for energy at theonset of lactation (Petterson et al., 1994). The net resultof these adaptations is coordinated support of fetal needsand subsequent high milk production in the face ofdecreasing and eventually insufficient DMI during latepregnancy and early lactation.
Managing Energy Metabolism inTransition Dairy Cows
Thomas R. Overton1
Department of Animal ScienceCornell University
86

These changes in tissue metabolism that occur in dairycows during the transition period are mediated largelyby changes in responses to hormonal signals such asinsulin. Decreased responses of these tissues to insulinare referred to in general terms as insulin resistance. Asreferenced above, some aspects of insulin resistance(such as those related to skeletal muscle) are veryfavorable for support of pregnancy and lactationbecause of glucose sparing for the fetus and lactatingmammary gland (Bell, 1995). At the same time, webelieve that insulin resistance in adipose tissue maycontribute to the increasing circulating concentrationsof NEFA and decreasing DMI as cows approachcalving. Allen et al. (2005) suggested that the increasedcirculating concentrations of NEFA during latepregnancy and subsequent oxidation of these NEFA bythe liver is the cause of the decreased DMI as cowsapproach calving. Increased resistance of adipose tissueto insulin would predispose to the cow to mobilizeNEFA, hence potentially creating a vicious cycle ofNEFA mobilization and DMI reduction during the lateprepartum period. This would also help to explainmetabolically why high body condition score (BCS)cows have lower DMI and more rapid decreases in DMIduring the prepartum period than cows of moderate orlow BCS (Grummer et al., 2004).
Several years ago, we became interested in furtherunderstanding the nature and timing of insulinresistance, with specific focus on determining whetherthe relationships of NEFA and DMI could bemodulated during the transition period. Initial researchconducted in our lab (Smith, 2004) suggested thatadipose tissue in periparturient dairy cows actually maybe more refractory to insulin during the prepartumperiod than during the postpartum period. Subsequentwork also generally supported the concept that insulinresistance may be greater during the prepartum periodthan the postpartum period (Smith et al., 2006).
As a result of this work and other circumstantialevidence that accentuated insulin resistance during theprepartum period contributes to lower peripartal DMI,elevated NEFA concentrations, and increased bodycondition score (BCS) loss during early lactation, wewanted to determine whether specific modulation ofinsulin resistance in adipose tissue during the prepartumperiod would decrease NEFA mobilization and changethe patterns of DMI and NEFA during the transitionperiod. Using an experimental approach, weadministered compounds (thiazolidinediones; TZD)analogous to those used to treat Type II diabetes inhumans to dairy cows during the prepartum period. Inthe first study, TZD administration tended to decreasecirculating concentrations of NEFA and tended toincrease DMI during the period from 7 days beforecalving until 7 days after calving (Smith et al., 2007).Importantly, TZD administration did not appear to
interfere with the glucose sparing by peripheral tissuesthat is important for support of pregnancy andlactation.
In a second study (Smith et al., 2009) conducted usinglarger numbers of cows, we replicated the results of thefirst experiment in that TZD administration during theprepartum period decreased circulating NEFAconcentrations and increased DMI during theimmediate pre- and postpartum periods. In addition,TZD administration improved postpartum energybalance, decreased BCS loss, and decreased days to firstovulation in treated cows. These results suggested thatspecific modulation of insulin resistance in adiposetissue could have very positive effects on metabolicchanges during the transition period and havesubstantial carryover effects on the dynamics ofmetabolism and performance during early lactation. Itshould be noted that this work was conducted as proofof concept relative to the mechanisms of metabolicregulation; TZD currently is not available in a form thatcan be used practically in the dairy industry and wouldrequire regulatory approval before such use.
PREPARTUM NUTRITIONAL MANAGEMENTAND RELATIONSHIPS WITH PERIPARTAL DRYMATTER INTAKEAlthough modulation of insulin resistance usingpharmaceutical approaches is intriguing, it causes us toask questions regarding which aspects of nutritionalmanagement may influence insulin resistance. Duringthe past few years, energy nutrition of cows during thedry period has received substantial renewed attention(Drackley and Janovick-Guretzky, 2007) and anincreasing body of information suggests that energynutrition may interact with insulin resistance during thelate prepartum period.
For many years, the emphasis of researchers andindustry professionals was to maximize DMI in orderto ensure that cows consumed enough energy during thedry period. This strategy was supported in part byresearch that demonstrated that cows with lower NEFAconcentrations during the last two weeks before calvingon commercial dairy farms had decreased incidence ofmost postcalving metabolic disorders (displacedabomasum, ketosis, retained placenta, mastitis; Dyk,1995). Given that higher DMI typically results in lowercirculating NEFA, the association between higher DMIand improved health and performance was implied. Ourexperience would suggest that many farms indeed hadimproved health and performance when managementchanges were implemented that increased DMI of cows,particularly during the close-up period.On the other hand, evidence suggests that plane ofnutrition, in particular energy intake during theprepartum period, modulates the degree of insulinresistance and hence the relationships between NEFA
87
and DMI during the immediate peripartal period.Mashek and Grummer (2003) reported that cows thathad larger decreases in DMI during the prepartumperiod, generally because of higher DMI during weeks3 and 4 before calving, had higher concentrations ofplasma NEFA and liver triglycerides during thepostpartum period. More direct experimental evidencewas provided by Douglas et al. (2006), who reportedthat cows fed at 80% of calculated energy requirementsfor the entire dry period had lower NEFAconcentrations during the postpartum period, lowerconcentrations of both circulating glucose and insulinduring the prepartum period, and higher DMI duringthe postpartum period than cows consuming 160% ofpredicted energy requirements throughout the dryperiod. Similarly, Holcomb et al. (2001) reported thatcows subjected to feed restriction during the lateprepartum period had blunted NEFA curves during theperiparturient period. In addition, Holtenius et al.(2003) determined that cows that were dramaticallyoverfed (178% of calculated energy requirements) forthe last 8 weeks before calving had higherconcentrations of insulin and glucose during theprepartum period, greater insulin responses to glucosechallenge during the prepartum period, and higherconcentrations of circulating NEFA during thepostpartum period than cows fed for 75 or 110% ofcalculated energy requirements. Furthermore, Agenaset al. (2003) reported that the same cows fed for 178%of calculated energy requirements prepartum had lowerDMI and prolonged negative energy balance during thepostpartum period compared with cows assigned to theother two prepartum treatments. Dann et al. (2006)demonstrated that overfeeding (150% of calculatedenergy requirements) during the far-off period may haveexacerbated insulin resistance as cows approachedcalving, resulting in higher NEFA and BHBA and lowerDMI and energy balance during the first 10 dayspostcalving.
Recently, we compared responses to insulin throughglucose tolerance tests conducted on dry cows fed ahigh energy, corn silage-based (~ 0.69 Mcal/lb of NEL;170% of predicted energy requirements) ration versus ahigh straw, bulky diet (~ 0.61 Mcal/lb of NEL; 119% ofpredicted energy requirements; Schoenberg andOverton, 2012). Responses of NEFA to the glucosetolerance test were more refractory in the cows fed thehigh energy diet, suggesting that feeding the high energydiet to dry cows accentuated the insulin resistanceexpressed in adipose tissue. Collectively, these resultssupport that overfeeding energy to dry cows results inchanges in metabolism that in turn likely predisposecows to decreased DMI and higher NEFA during theimmediate peripartal period.This knowledge has supported the evolution inrecommendations for energy nutrition of dairy cowsduring both the far-off and close-up periods during thepast several years, with the goal of meeting, but not
dramatically exceeding, energy requirements. My targetrange for both the far-off and close-up periods isbetween 110 and 120% of energy requirements. Inpractice, this can be achieved by formulating dietsduring the far-off period to contain no more than 0.59to 0.63 Mcal/lb of NEL in order to achieve the targetNEL intake of approximately 15 to 17 Mcal forHolsteins during this timeframe. During the close-upperiod, conventional recommendations as describedabove have been to maximize DMI, and hence energyintake. Although this still applies in many herdsituations, we believe that some well-managed herds inwhich close-up cows consume large amounts of feed (>31 to 32 lbs/day of dry matter in comingledcow/springing heifer groups) have increased rates ofmetabolic disorders because of excessive energy intakeduring the close-up period. Accordingly, some of theseherds have had success in moderating energy intakeduring the close-up period in group-feeding situationsby incorporating straw or other low potassium, lowenergy forage to lower overall dietary energyconcentration. Our recommendations would be toformulate the close-up diet at approximately 0.64 to0.66 Mcal/lb of NEL if the group is a commingledcow/heifer group and approximately 0.61 to 0.63Mcal/lb of NEL if the group is composed of matureanimals and DMI is high. This lower energy diet alsocan be an acceptable one-group dry cow approach ifoverall herd management dictates such an approach.Diets formulated in these ranges will help to ensureadequate, but not excessive energy intake within thedynamics of group-feeding and competition amonganimals.
Diets formulated using a combination of corn silage andstraw to form the forage component of the diet typicallycan have between 5 to 10 lbs of chopped straw, makingfeeding management a critical component ofimplementation of bulky, low energy dry cow diets. Asdescribed by Drackley (2007), the three key components ofthis implementation are 1) prevention of sorting, 2)ensuring continuous and non-crowded access to the TMR,and 3) careful monitoring of dry matter content andattention to detail. Most of these diets will contain addedwater in order to aid with prevention of sorting. A finalpoint relative to these types of diets is that it is importantto account for the metabolizable protein requirements ofthe cow during late pregnancy. These diets typicallycontain lower amounts of ruminally fermentablecarbohydrate than those that have been typically fed forthe last ten to fifteen years, and therefore will supply lessmetabolizable protein from ruminal bacteria. Inclusion ofrumen-undegradable protein sources to result in totalmetabolizable protein supply in the range of 1,100 to 1,200g/d is critical for early lactation performance and overallsuccess. Furthermore, in anecdotal cases where these dietshave been linked with lower milk yield during earlylactation, I speculate that energy intake may have beenpushed too low, especially during the close-up period.
88

POSTPARTUM NUTRITIONAL MANAGEMENTAND RELATIONSHIPS WITH DRY MATTERINTAKE AND METABOLISM IN EARLYLACTATIONAs is described in another paper in the proceedings(Dann and Nelson, 2011), the amount of researchspecifically conducted to explore the relationships ofpostpartum nutritional management and the dynamicsof DMI and BCS during early lactation has been verylimited. Allen et al. (2009) would suggest that feedinghighly fermentable diets to cows during early lactationwould decrease DMI and overall energy status. Icontend that modulation of DMI by propionate duringvery early lactation is less likely than at other phases oflactation for several reasons. First, NEFA likely are thepredominant oxidative fuel for liver during this periodand so any hypophagic effect of propionate woulddepend upon NEFA supply to the liver. Second, wedemonstrated that there is a positive correlationbetween liver capacity to convert propionate to glucoseand fat free NEL intake (proxy for carbohydrate intake)in cows at d 1 and 21 postcalving that does not existeither before calving or at peak lactation (Drackley etal., 2001). This suggests that the liver has the capacityto direct additional propionate toward glucose. Third,hepatic energy requirements increase dramatically at theonset of lactation (Reynolds et al., 2003). The firstpoint is supported by recent work (Stocks and Allen,2011), in which they determined that the hypophagiceffects of propionate increased when hepatic acetyl CoAconcentrations are higher, as they would be if cows weremobilizing large amounts of adipose tissue with thecorresponding proportionate uptake of NEFA by theliver.
The limited work in fresh cows (with the exception ofthe results from Dann and Nelson, 2011) suggests thatfeeding more fermentable diets during early lactationdoes not decrease DMI or negatively impact otheraspects of performance and metabolic health.Andersen et al. (2002; 2003) fed cows either a low (25%concentrate) or high (75% concentrate) diet with wholecrop barley silage as the forage base from calvingthrough 8 wk postcalving. Feeding the high energy dietdid not affect DMI, increased net energy intake andmilk yield, and did not affect BCS change in earlylactation. Cows fed the high energy diet had greaterliver capacity to convert fatty acids to CO2, lowercapacity to convert fatty acids to triglycerides in liver,and lower blood ketones (Andersen et al., 2002).
Rabelo et al. (2003; 2005) fed cows and first calf heiferseither low or high energy diets prepartum followed byeither low or high energy diets postpartum until d 20postcalving, then all cows were fed the high energy dietthrough d 70 postcalving. The postcalving diets werebased upon alfalfa silage and corn silage – the “low”energy diet contained 29.9% NDF and 41.4% NFC; the
“high” energy diet contained 24.9% NDF and 47.2%NFC. Cows fed the high energy diet postpartum tendedto have higher DMI and had higher energy intake from d1 to 30; overall effects of treatment from d 1 to 70postcalving were not significant. Rates of increase ofmilk production were greater for cows fed high energydiets postcalving, and plasma concentrations of BHBAwere substantially lower for cows fed the high energy dieton d 7 and 21 postcalving.
Although these studies (Andersen et al., 2002; Rabelo etal., 2003) suggest that higher energy diets are preferableduring the postcalving period, the diets fed by Andersenrepresent the extremes and those fed by Rabelo are bothhigher energy diets by industry standards. This areacertainly warrants active investigation.SUMMARY AND CONCLUSIONSSuccess in management of energy metabolism duringthe transition period depends upon excellentmanagement in a number of different areas to managethe dynamics of DMI and body condition mobilizationalong with optimize performance. Our understandingof the metabolic regulation underpinning the changesthat occur in energy metabolism of cows during thetransition period is increasing, and with thisunderstanding has come new potential opportunities forenhancing transition cow health and performance.Controlling energy intake of cows during the prepartumperiod (both far-off and close-up) is an importantfactor that predisposes cows to smoother adaptations tolactation. Furthermore, available information suggeststhat feeding higher energy diets (or not feeding a dietlower in energy than the high cow diet) promotes higherenergy intake and milk yield along with bettermetabolic status during the postpartum period.
REFERENCESAgenas, S., E. Burstedt, and K. Holtenius. 2003. Effects of
feeding intensity during the dry period. 1. Feed intake,body weight, and milk production. J. Dairy Sci. 86:870-882.
Allen, M. S., B. J. Bradford, and K. J. Harvatine. 2005. Thecow as a model to study food intake regulation. Ann. Rev.Nutr. 25:523-547.
Allen, M. S., B. J. Bradford, and M. Oba. 2009. The hepaticoxidation theory of the control of feed intake and itsapplication to ruminants. J. Anim. Sci. 87:3317-3334.
Andersen, J. B., N. C. Friggens, K. Sejrsen, M. T. Sorensen, L.Munksgaard, and K. L. Ingvartsen. 2003. Livest. Prod.Sci. 81:119-128.
Andersen, J. B., T. Larsen, M. O. Nielsen, and K. L.Ingvartsen. 2002. Effect of energy density in the diet andmilking frequency on hepatic long chain fatty acidoxidation in early lactating dairy cows. J. Vet. Med. A49:177-183
Bauman, D. E., and W. B. Currie. 1980. Partitioning ofnutrients during pregnancy and lactation: a review ofmechanisms involving homeostasis and homeorhesis. J.Dairy Sci. 63:1514-1529.
Bauman, D. E. and J. M. Elliot. 1983. Control of nutrientpartitioning in lactating ruminants. In Biochemistry ofLactation. T. B. Mepham (ed.). Elsevier Science
89

Publishers, Amsterdam, NL, pp. 437-468.Bell, A. W. 1995. Regulation of organic nutrient metabolism
during transition from late pregnancy to early lactation. J.Anim Sci. 73:2804-2819.
Butler, W. R., and R. D. Smith. 1989. Interrelationshipsbetween energy balance and postpartum reproductivefunction in dairy cattle. J. Dairy Sci. 72:767-783.
Dann, H. M., N. B. Litherland, J. P. Underwood, M. Bionaz,A. D’Angelo, J. W. McFadden, and J. K. Drackley. 2006.Diets during far-off and close-up dry periods affectperiparturient metabolism and lactation in multiparouscows. J. Dairy Sci. 89:3563-3577.
Dann, H. M., and B. H. Nelson. 2011. Early lactation dietsfor dairy cattle – focus on starch. Proceedings, CornellNutrition Conference for Feed Manufacturers. Syracuse,NY.
Douglas, G. N., T. R. Overton, H. G. Bateman II, H. M.Dann, and J. K. Drackley. 2006. Prepartal plane ofnutrition, regardless of dietary energy source, affectsperiparturient metabolism and dry matter intake inHolstein cows. J. Dairy Sci. 89:2141-2157.
Drackley, J. K. 2007. Energy for dry and transition cowsrevisited. Proceedings, 8th Fall Dairy Conference. PRO-DAIRY and College of Veterinary Medicine, CornellUniversity, Ithaca, NY. pp. 69-78.
Drackley, J. K., and N. A. Janovick-Guretzky. 2007.Controlled energy diets for dry cows. Proceedings, 8thWestern Dairy Management Conference, Reno, NV.Oregon State Univ., Corvallis, pp. 7-16.
Drackley, J. K., T. R. Overton, and G. N. Douglas. 2001.Adaptations of glucose and long-chain fatty acidmetabolism in liver of dairy cows during theperiparturient period. J. Dairy Sci. 84:E100-E112.
Dyk, P. B. 1995. The association of prepartum non-esterifiedfatty acids and body condition with peripartum healthproblems on 95 Michigan dairy farms. M. S. Thesis,Michigan State University, East Lansing.
Grummer, R. R., D. G. Mashek, and A. Hayirli. 2004. Drymatter intake and energy balance in the transition period.Vet. Clin. Food Anim. 20:447-470.
Grummer, R. R., M. C. Wiltbank, P. M. Fricke, R. D.Watters, and N. Silvia-Del-Rio. 2010. Management of dryand transition cows to improve energy balance andreproduction. J. Reprod. Dev. 56:S22-S28.
Holcomb, C. S., H. H. Van Horn, H. H. Head, M. B. Hall,and C. J. Wilcox. 2001. Effects of prepartum dry matterintake and forage percentage on postpartum performanceof lactating dairy cows. J. Dairy Sci. 84:2051-2058.
Holtenius, K., S. Agenas, C. Delavaud, and Y. Chilliard. 2003.Effects of feeding intensity during the dry period. 2.Metabolic and hormonal responses. J. Dairy Sci. 86:883-891.
Huzzey, J. M., and T. R. Overton. 2010. Measuring the effectof stress during the transition period on subsequenthealth and performance of dairy cattle. Proceedings,Cornell Nutrition Conference for Feed Manufacturers.Syracuse, NY. pp. 76-86.
Ingvartsen, K. L., and J. B. Andersen. 2000. Integration ofmetabolism and intake regulation: A review focusing onperiparturient animals. J. Dairy Sci. 83:1573-1597.
LeBlanc, S. 2010. Monitoring metabolic health of dairy cattlein the transition period. J. Reprod. Dev. 56:S29-S35.
Mashek, D. G., and R. R. Grummer. 2003. The ups anddowns of feed intake in prefresh cows. Proc. Four-StateNutr. Conf. LaCrosse, WI. MidWest Plan Servicepublication MWPS-4SD16. pp. 153-158.
Ospina, P. A., D. V. Nydam, T. Stokol, and T. R. Overton.2010. Associations of elevated nonesterified fatty acidsand beta-hydroxybutyrate concentrations with early
lactation reproductive performance and milk productionin transition dairy cattle in the northeastern United States.J. Dairy Sci. 93:1596-1603.
Petterson, J. A., F. R. Dunshea, R. A. Ehrhardt, and A. W.Bell. 1993. Pregnancy and undernutrition alter glucosemetabolic responses to insulin in sheep. J. Nutr. 123:1286-1295.
Petterson, J. A., R. Slepetis, R. A. Ehrhardt, F. R. Dunshea,and A. W. Bell. 1994. Pregnancy but not moderateundernutrition attenuates insulin suppression of fatmobilization in sheep. J. Nutr. 124:2431-2436.
Rabelo, E., R. L. Rezende, S. J. Bertics, and R. R. Grummer.2005. Effects of pre- and postfresh transition diets varyingin dietary energy density on metabolic status ofperiparturient dairy cows. J. Dairy Sci. 88:4375–4383.
Rabelo, E., R. L. Rezende, S. J. Bertics, and R. R. Grummer.2003. Effects of transition diets varying in dietary energydensity on lactation performance and ruminal parametersof dairy cows. J. Dairy Sci. 86:916–925.
Reynolds, C. K., P. C. Aikman, B. Lupoli, D. J. Humphries,and D. E. Beever. 2003. Splanchnic metabolism of dairycows during the transition from late gestation throughearly lactation. J. Dairy Sci. 86:1201-1217.
Santos, J.E.P., H. M. Rutigliano, and M. F. S’a Filho. 2009.Risk factors for resumption of postpartum estrous cyclesand embryonic survival in lactating dairy cows. Anim.Reprod. Sci. 110:207–221.
Schoenberg, K. M., and T. R. Overton. 2012. Effects of planeof nutrition and 2,4-thiazolidinedione on insulinresponses and adipose tissue gene expression in dairycattle during late gestation. J. Dairy Sci. 95:670-682.
Smith, K. L. 2004. Effects of prepartum carbohydrate sourceand chromium supplementation in dairy cows during theperiparturient period. M. S. Thesis. Cornell Univ., Ithaca,NY.
Smith, K. L., W. R. Butler, and T. R. Overton. 2009. Effectsof prepartum 2,4-thiazolidinedione on metabolism andperformance in transition dairy cows. J. Dairy Sci.92:3623-33.
Smith, K. L., A. K. Rauf, B. C. Benefield, A. W. Bell and T.R. Overton. 2006. Responses of tissues to insulin asaffected by homeorhetic state in dairy cattle. J. Dairy Sci.89(Suppl. 1):352. (Abstr.).
Smith, K. L., S. E. Stebulis, M. R. Waldron, and T. R.Overton. 2007. Prepartum 2,4-thiazolidinedione altersmetabolic dynamics and dry matter intake of dairy cows.J. Dairy Sci. 90:3660-3670.
Stocks, S. E., and M. S. Allen. 2011. Hypophagic effects ofpropionate are greater for cows with elevated hepaticacetyl CoA concentrations. J. Dairy Sci. 94(E. Suppl.1):512. (Abstr.)
90

Figure 1. “Simplified” diagram on intake regulation in dairycattle. From Ingvartsen and Andersen, 2000.
Figure 2. Mechanisms of intake regulation according to thehepatic oxidation theory. From Allen et al., 2009.
1 Contact at 272 Morrison Hall, Ithaca, NY 14853. Phone(607) 255-2878 Email [email protected]
91

OverviewBlood metabolites have been used in herd-leveldiagnostics of transition cow management for anumber of years (Ingraham and Kappel, 1988; Herdt,2000; Oetzel, 2004), mostly with focus on identifyingopportunities to decrease the incidence of metabolicdisorders related to energy metabolism. Recently,there has been a resurgence of interest in the use ofblood metabolites, primarily nonesterified fatty acids(NEFA) and beta-hydroxybutyrate (BHBA) forevaluation of transition cow programs. Thisresurgence is largely based on recent findings thatboth NEFA and BHBA are associated witheconomically important herd parameters beyondmetabolic disease incidence, namely milk productionand reproductive performance. In addition, theincreased availability of accurate cow-side tests forBHBA in blood (Precision Xtra, Abbott Laboratories)and milk (KetoTest, Elanco Animal Health) has maderoutine evaluation of BHBA in herds simple, fast, andlow cost. In light of these findings, new research hasbegun to evaluate the relationships of biomarkersrelated to stress and inflammation [e.g. plasmahaptoglobin (Hp) and fecal cortisol metabolites(FCORT)] with metabolic disease and milkproduction in order to identify other useful andphysiologically relevant markers for herd-leveldiagnostics and evaluation of transition cowprograms. This paper reviews our recent findings inthese areas and provides recommendations on howthese markers should be interpreted for evaluatingtransition cow programs.
Use of Analytes Related to Energy Metabolism –NEFA & BHBAOetzel (2004) characterized well the typical use ofblood analytes related to energy metabolism intransition management diagnostics – NEFA duringthe prepartum period to assess precalving energystatus and BHBA during the postpartum period toassess incidence of subclinical (and clinical) ketosis.This approach was supported in part by workconducted in Michigan (Cameron et al., 1998) thatassociated increased prepartum concentrations ofNEFA, reflective of negative energy balance, with agreater incidence of displaced abomasum. Duffield etal. (1998) defined and characterized subclinicalketosis in herds in Ontario during the postpartum
period and demonstrated that administration ofmonensin in a controlled-release capsule woulddecrease the incidence of subclinical ketosis in dairycows during early lactation.
Recently, our group conducted a large-scaleevaluation of the associations of prepartum NEFAand postpartum NEFA and BHBA with postpartumhealth, milk production, and reproductiveperformance in dairy herds in the northeastern US(Ospina et al., 2010a, 2010b, 2010c). In order to havebeen included in the study a herd must have: 1) hadgreater than 250 milking cows, 2) housed cows infree-stalls, 3) fed a total mixed ration (TMR), and 4)participated in DHIA and/or use Dairy Comp 305(Valley Ag. Software, Tulare CA). Farms were visitedonce and during the farm visit two cohorts of animalswere selected: those 14 to 2 days prepartum andthose 3 to 14 days postpartum. Within each cohort,convenience samples of 15 apparently healthyanimals were evaluated. Briefly, 10 mL of blood wascollected from the coccygeal vein or artery into a red-top tube. The sera from the prepartum cohort wereanalyzed for NEFA and the sera from animalssampled after calving were analyzed for NEFA,BHBA. For all animals sampled, the incidence of thediseases of interest [displaced abomasum (DA),clinical ketosis (CK), and metritis (MET) and/orretained placenta (RP)] within 30 days in milk, timeto pregnancy within 70 days post voluntary waitingperiod and Mature Equivalent 305 (ME 305) milk at120 days in milk were recorded. The final datasetincluded 100 herds with an average herd size of 840cows. A total of 2758 cows were sampled withinthese herds (1440 animals sampled prepartum and1318 sampled postpartum) with an approximatedistribution of 35% primiparous (entering firstlactation) and 65% multiparous (entering second orgreater lactation) cows.
Critical threshold values for prepartum NEFA andpostpartum NEFA and BHBA and the associated riskratios for disease are presented in Table 1. If animalshad prepartum serum NEFA concentrations greaterthan about 0.30 mEq/L, they were twice as likely todevelop one or more of the diseases of interest.Animals with postpartum serum NEFA and BHBAconcentrations greater than about 0.60 mEq/L and 10
Using Physiological Markers in Herd-LevelTransition Diagnostics
J. M. Huzzey1,*, D. V. Nydam2, P. A. Ospina1, and T. R. Overton1†1Department of Animal Science
2 Department of Population Medicine and Diagnostic SciencesCornell University, Ithaca NY
92

mg/dL, respectively, were four times as likely todevelop one of more of the diseases of interest thananimals with lower concentrations of thesemetabolites. The risk ratio for individual disordersvaried widely within these groups. These results areconsistent with prior work and support theimportance of maintaining adequate energy intakeprepartum and controlling body condition score lossand overall energy status during the postpartumperiod with respect to disease.
The relationships of prepartum NEFA andpostpartum NEFA and BHBA with reproductiveperformance for the first 70 days after voluntarywaiting period are described in Table 2. Animalswith prepartum NEFA greater than about 0.3 mEq/Lwere nearly 20% less likely to become pregnant thananimals with lower concentrations. Animals withgreater than about 0.70 mEq/L of NEFA (whilecontrolling for BHBA) and/or greater than 10 mg/dLof BHBA were 13 to 16% less likely to becomepregnant than animals with lower concentrations. Inall models, multiparous cows were less likely thanprimiparous cows to become pregnant in the first 70days following the voluntary waiting period.
Associations of analytes related to energy metabolismwith subsequent milk production (assessed asmature-equivalent 305-day lactational milk, predictedat approximately 120 DIM) are depicted in Table 3.Regardless of parity, animals with greater than about0.3 mEq/L of NEFA during the prepartum periodhad nearly 700 kg less ME305 projected milk thananimals with lower concentrations. During thepostpartum period, there were interesting differencesin associations of energy-related analytes with milkproduction depending upon parity. In primiparouscows (heifers), postpartum NEFA concentrationsgreater than about 0.6 mEq/L and BHBAconcentrations over about 9 mg/dL were associatedwith increased milk yield. In multiparous cows,postpartum NEFA concentrations greater than about0.7 mEq/L and BHBA concentrations greater thanabout 10 mg/dL were associated with lowerpredicted milk yield.
Among animals sampled during the prepartumperiod (2 to 14 days before calving), 45% ofprimiparous animals and 26% of multiparous cowshad NEFA concentrations at or above 0.3 mEq/L.Among animals sampled during the postpartumperiod (3 to 14 days after calving), 25% ofprimiparous animals and 33% of multiparous cowshad NEFA concentrations at or above 0.7 mEq/L.Furthermore, 15% of primiparous animals and 27% ofmultiparous cows had BHBA concentrations at orabove 10 mg/dL. In the vast majority of participatingfarms, primiparous and multiparous animals would
have been commingled during the period beforecalving– these results suggest that heifers inparticular may be compromised from the standpointof energy intake relative to requirements in thesesystems. Furthermore, these energy-related analytesappear more likely to be elevated in multiparouscows than primiparous cows during the period aftercalving.
Ospina et al. (2010c) also used this dataset to compareherds with greater than 15% of animals over thecritical thresholds for the analytes during theprepartum and postpartum periods with those withless than 15% of animals over the thresholds duringeach period and results from this analysis arepresented in Table 4. It should be noted that thenumbers in this table reflect the associations amongall animals in the herd, not just sampled animals inthe study. As suggested by the results in the table,those herds with more than 15% of animals withprepartum NEFA and/or postpartum NEFA andBHBA over the critical thresholds had slightly greaterdisease incidence, poorer reproductive performance,and lower ME305 projected milk yield in bothprimiparous and multiparous cows. In the U.S.system, the associations of these analytes at the herd-level with decreased milk yield and poorerreproductive performance would be much moreeconomically meaningful than those with diseaseincidence.
In terms of practical application of this information,we believe that measurement of energy-relatedanalytes is a useful tool for monitoring herds,evaluation of potential opportunities for improvedtransition cow management, or diagnostics. In termsof the target windows, we recommend sampling 12 to15 cows per group within the windows of interestdescribed above – prepartum samples should beanalyzed for NEFA and postpartum samples can beanalyzed for NEFA and/or BHBA. The cowsideblood or milk tests for BHBA described above arevery accurate and represent an excellent first step orfront line analysis because of convenience and cost.Because the incidence of herds with high postpartumNEFA in our dataset was much greater than that withhigh postpartum BHBA, we would encouragepractitioners and consultants to take the extra stepand consider analysis for postpartum NEFA insituations where they believe that early lactation milkproduction and reproductive performance arecompromised yet the BHBA data are unrevealing.Finally, prepartum NEFA continue to be useful inhelping to identify situations in which larger thandesired proportions of prepartum cows havecompromised energy status.
93

Table 5 describes three possible outcomes andpotential interpretations for a herd to consider afterNEFA and/or BHBA evaluation in prepartum andpostpartum groups. If NEFA is elevated in prepartumcows, it is generally a good signal that either energyintake as a whole is inadequate orfacility/management issues exist and are causingsignificant cow to cow variation in DMI and henceNEFA concentration. Independent of postpartumanalyte values, we associate elevated prepartumNEFA with negative disease, reproductive, andproduction outcomes at the herd level (Table 4). Themost likely analyte pattern for a herd that isoverfeeding energy either far-off or close-up is lowNEFA values prepartum but high NEFA and/or BHBvalues postpartum. Herds and consultants shouldremember, however, that a number of factors specificto either nutritional management or facility/groupingmanagement also can elevate postpartumconcentrations of NEFA and/or BHB independent ofprepartum values. Typically, when herds are overfedeither far-off or close-up, we see a subsequent rapidand marked loss of BCS among fresh cows – NEFAtesting of the fresh cows can help to confirm this.
Potential field-based markers for inflammation andstress in transition cowsAn emerging area of focus within our research groupis in understanding the relationship of inflammationand stress with transition cow health andperformance (Huzzey et al., 2011; Huzzey andOverton, 2010). We envision that biomarkers relatedto inflammation [e.g. Haptoglobin (hp)] or stress[fecal cortisol metabolites (FCORT)] could also beuseful for evaluating the effects of non-nutritionalmanagement factors, such as overstocking orcommingling of cows and heifers, on physiology.Haptoglobin is an acute phase protein that issynthesized and released by liver as part of theinflammatory response and has been shown to beelevated in cows with metritis (Huzzey et al., 2009).Although there are many acute phase proteins, Hphas been of particular interest for the detection of sickanimals due to its very low concentrations in theblood of healthy animals (Eckersall, 2000). Fecalcortisol metabolites are reflective of circulatingconcentrations of cortisol approximately 10 to 12hours prior to the collection of the fresh fecal sample.Concentrations of FCORT have been suggested to bea better indictor of physiological stress responsesthan direct measurements of plasma cortisol due tothe feedback-free nature of the sampling method(Palme et al., 1999). Restraint and handling, which arerequired during blood sampling, can cause aphysiological stress response and raise circulatingcortisol concentrations quickly (Cook et al., 2000).Further, the release of cortisol from the adrenal glandduring the day is pulsatile and has a diurnal cycle
that is subject to substantial individual variation.Because FCORT does not have the same limitationsrelative to sampling, as does serum or plasmacortisol, it offers a potential way to study activationof the hypothalamic-pituitary-axis in response toexposure to stressors.
To evaluate whether prepartum physiologicalindicators of stress and inflammation were associatedwith the occurrence of health disorders after calvingand milk yield, data were collected from 412 cows ontwo commercial dairies in New York State. Farmswere visited weekly to collect blood, fecal samples,and BCS. Sampling began approximately 4 wk priorto each cow’s expected calving date. One blood andfecal sample per cow was collected between d -21 to -15 relative to the actual calving date to represent wk -3, d -14 to -8 (wk -2), and d -7 to -2 (wk -1).Prepartum plasma was analyzed for NEFA, Hp, andcortisol and FCORT concentrations (11,17-dioxoandrostanes) were determined from fecalsamples.
Health events occurring within 30 DIM, includingretained placenta (RP), displaced abomasum (DA),and death (not including voluntary culls) werecollected from DairyCOMP 305. A postpartum bloodsample was collected within 3 to 10 d after calving.Based on this postpartum blood sample, sub-clinicalketosis (SCK) was diagnosed when plasma BHBAwas ≥ 10 mg/dl (Ospina et al., 2010a) and HighHaptoglobin (HiHp, suggestive of an infection suchas metritis) was diagnosed when plasma Hp was ≥ 1g/L (Huzzey et al., 2009). Cows were divided into 3health categories for statistical analysis: 1) Nodisorder of interest (NDI); 2) One disorder (RP, DA,SCK, or HiHp); or 3) More than one disorder (RP,DA, SCK, HiHp) or death.
As expected prepartum plasma NEFA was a strongpredictor of postpartum health; however, thisrelationship was dependent on the degree of illnessafter calving. Cows that developed multiple disordersafter calving or that died had the greatestconcentrations of NEFA, relative to the other twohealth categories, particularly during the 2-weekperiod before calving. There were no associationsbetween prepartum Hp or FCORT concentration andthe occurrence of one disorder (RP, DA, SCK orHiHP) by 30 DIM. Hp concentration tended to begreater during wk -2 and -1 and FCORT tended to begreater during wk -3 and -2 for cows that developedmore than one disorder or that died by 30 DIMrelative to cows the NDI category; however, neitherof these analytes could predict which cows would goon to develop health complications as well asprepartum NEFA concentration (Huzzey et al., 2011).
94

In order to evaluate the relationships of theseanalytes with subsequent milk yield, herd DC305records were used to collect information on eachcows predicted 305ME from the 2nd test day(approximately 62 DIM). A range of metaboliccutpoints were evaluated for each period and theeffect of being above or below the cutpoint onpredicted 305ME was then evaluated (Huzzey andOverton, 2010).
Projected 305ME milk yield tended to be 2328 lbslower in heifers with haptoglobin concentrations >1.1 g/L during weeks -3 and -2, relative to heiferbelow this cutpoint. Multiparous cows withhaptoglobin > 1.1 g/L during weeks -2, -1 or +1 hadon average 3315 lbs lower projected 305ME milkyield (Figure 1), relative to multiparous cows belowthis cutpoint.
There was no association between plasma cortisoland milk yield at any period relative to calving foreither multiparous or primiparous cows (data notshown). Concentrations of FCORT were notsignificantly associated with 305ME milk yield inprimiparous cows; however, multiparous cows withFCORT > 2500 ng/g fecal DM during weeks -3 or -2relative to calving had on average 2429 lbs lower305ME milk yield relative to cows below thiscutpoint. Projected 305ME milk yield was 2926 lbslower among MP cows with fecal cortisol metabolites> 700 ng/g fecal DM during week +1 (Figure 2).
In summary, cows with higher concentrations ofNEFA (data not shown; with the exception of heifersduring week +1), haptoglobin, or fecal cortisolmetabolites around calving have lower projected305ME at the 2nd test day and these associations areapparent up to 3 weeks prior to the onset of lactation.While higher concentrations of NEFA, Hp, andFCORT are associated with lower predicted milkyield, the significance of these relationships wasstronger for Hp and FCORT relative to NEFA,particularly when these analytes are measuredduring the week after calving. If we focus on thepostpartum period it is also appears that both Hpand FCORT are more sensitive to 305ME milk yieldprojections than NEFA; the magnitude of thedifference in projected 305ME between those animalsthat were above versus below the indicated cutpointswere much greater when using HP or FCORT topredict these differences compared to NEFA. Finally,a greater proportion of animals were above the Hpand FCORT cutpoints during week +1 then wereabove the NEFA cutpoint. These results suggest thathaptoglobin or fecal cortisol metabolites may bealternative and perhaps more effective analytes fordetecting cows at risk for reduced milk yield, thanNEFA. Our next step for this research will be to
determine how herds vary in the concentrations ofthese analytes and how management factors impactthese measures on dairy farms.
Summary and conclusionsCirculating concentrations of energy-relatedmetabolites (prepartum NEFA and postpartum NEFAand/or BHBA) are highly associated withpostpartum outcomes relative to disease, milkproduction, and reproductive performance in dairycattle. As such, they can be an important componentof evaluation of transition cow programs. Our recentdata suggest that associations of elevatedconcentrations of these metabolites during theprepartum and postpartum period with subsequentmilk yield and reproductive performance may bemore meaningful at the farm level than theirassociations with metabolic disease. Because ofconvenience and cost, evaluation of postpartumBHBA in milk or blood at the farm level is a preferredfirst-line monitoring tool, although prepartum andpostpartum NEFA concentrations in serum or plasmacan provide additional insight into transitionmanagement opportunities. New research from ourgroup suggests that elevated concentrations ofbiomarkers related to inflammation and stress(plasma haptoglobin and fecal cortisol metabolites)during the transition period also are associated withdecreased milk yield in early lactation – we will beconducting further research to develop these aspotential tools to help identify opportunities forimproved transition cow management.
95

ReferencesCameron, R. E., P. B. Dyk, T. H. Herdt, J. B. Kaneene, R.
Miller, H. F. Bucholtz, J. S. Liesman, M. J. VandeHaar,and R. S. Emery. 1998. Dry cow diet, management, andenergy balance as risk factors for displacedabomasums in high producing dairy herds. J. DairySci. 81:132-139.
Cook, C.J., D. J. Mellor, P. J. Harris, J. R. Ingram, and L. R.Matthews. 2000. Hands-on and hands-off measurementof stress. In: Moberg G.P. and J. A. Mench, ed. TheBiology of Animal Stress. CABI Publishing, p.123-46.
Duffield, T. F., D. Sandals, K. E. Leslie, K. Lissemore, B. W.McBride, J. H. Lumsden, P. Dick, and R. Bagg. 1998.Efficacy of monensin for the prevention of subclinicalketosis in lactating dairy cows. J. Dairy Sci. 81:2866-2873.
Eckersall, P. D. 2000. Recent advances and future prospectsfor the use of acute phase proteins as markers ofdisease in animals. Rev. Med. Vet. 151:577-584.
Herdt, T. H. 2000. Variability characteristics and testselection in herd-level nutritional and metabolic profiletesting. Vet. Clin. North Am. Food Anim. Pract. 16:387-403.
Huzzey, J. M., T. F. Duffield, S. J. LeBlanc, D. M. Veira, D.M. Weary, and M. A. von Keyserlingk. 2009. Shortcommunication: Haptoglobin as an early indicator ofmetritis. J. Dairy Sci. 92:621-625.
Huzzey, J. M., and T. R. Overton. 2010. Measuring theeffect of stress during the transition period onsubsequent health and performance of dairy cattle.Proceedings, Cornell Nutrition Conference for FeedManufacturers, Syracuse, NY, pp. 76-86. Accessed on6/1/2011 athttp://www.ansci.cornell.edu/cnconf/2010proceedings/index.html
Huzzey J. M., D. V. Nydam, R. J. Grant, and T. R. Overton.2011. Associations of prepartum plasma cortisol,haptoglobin, fecal cortisol metabolites, andnonesterified fatty acids with postpartum health statusin Holstein dairy cows. J. Dairy Sci. 94 :5878–5889.
Ingraham, R. H., and L. C. Kappel. 1988. Metabolic profiletesting. Vet. Clin. North Am. Food Anim. Pract. 4:391-411.
Oetzel, G. R. 2004. Monitoring and testing dairy herds formetabolic disease. Vet. Clin. North Am. Food Anim.Pract. 20:651-674.
Ospina, P. A., D. V. Nydam, T. Stokol, and T. R. Overton.2010a. Associations of elevated nonesterified fattyacids and beta-hydroxybutyrate concentrations withearly lactation reproductive performance and milkproduction in transition dairy cattle in the northeasternUnited States. J. Dairy Sci. 93:1596-1603.
Ospina, P. A., D. V. Nydam, T. Stokol, and T. R. Overton.2010b. Evaluation of nonesterified fatty acids and beta-hydroxybutyrate in transition dairy cattle in thenortheastern United States: Critical thresholds forprediction of clinical diseases. J. Dairy Sci. 93:546-54.
Ospina, P. A., D. V. Nydam, T. Stokol, and T. R. Overton.2010c. Association between the proportion of sampledtransition cows with increased nonesterified fatty acidsand �-hydroxybutyrate and disease incidence,pregnancy rate, and milk production at the herd level.J. Dairy Sci. 93:3595-3601.
Palme, R., C. Robia, S. Messmann, J. Hofer, and E. Möstl.1999. Measurement of faecal cortisol metabolites inruminants: a non-invasive parameter of adrenocorticalfunction. Wien. Tierärztl. Mschr. 86:237-241.
96

Table 1. Receiver operator characteristic (ROC) curve determination of critical NEFA (mEq/L) and BHBA (mg/dL)thresholds as predictors of disease and risk ratios of disease based upon these critical thresholds (Ospina et al.,2010b).
Prepartum cohort (2 to 14 days prepartum)Disease Critical prepartum Risk 95 % P-value
NEFA1 Ratio CI2DA 0.27 2.0 1.1 – 3.7 0.03 CK 0.26 1.8 1.2 – 2.5 0.001 Met and/or RP 0.37 2.2 1.6 – 3.0 < 0.0001 Any of the three 0.29 1.8 1.4 – 2.2 < 0.0001
Postpartum cohort (3 to 14 days postcalving)Disease Critical postpartum Risk 95 % P-value
NEFA1 Ratio CI2
DA 0.72 9.7 4.2 – 22 <0.0001 CK 0.57 5.0 2.3 – 11 <0.0001 Met 0.36 17 2.0 – 134 0.008 Any of the three 0.57 4.4 2.6 – 7.3 < 0.0001 Disease Critical BHBA1 Risk 95 % P-value
Ratio CI2
DA 10 6.9 3.7 – 12.9 <0.0001 CK 10 4.9 3.2 – 7.3 <0.0001 Met 7 2.3 1.1 – 5.1 0.037 Any of the three 10 4.4 3.1 – 6.3 <0.0001 1Highest combination of specificity and sensitivity based upon ROC analysis2Risk ratio confidence interval
Table 2. Cox proportional hazard model of the effect of NEFA (mEq/L) and/or BHBA (mg/dL), covariates, andanimals clustered within herds on days to conception after voluntary waiting period (Ospina et al., 2010a).
Sampled population Variable Hazard P-valuePrepartum cohort NEFA ≥ 0.27 0.81 0.01
Parity 0.73 0.001Postpartum cohort NEFA ≥ 0.72 0.84 0.05
BHBA ≥ 10 0.93 0.4Parity 0.81 0.01
Postpartum cohort BHBA ≥ 10 0.87 0.1Parity 0.80 0.01
Table 3. Mixed models for the effect of NEFA (mEq/L) and/or BHBA (mg/dL), covariates, and herd as a randomeffect on milk production assessed as ME305 milk at 120 days in milk (Ospina et al., 2010a).
Sampled Population Variable Difference in ME milk yield (kg) P-valuePrepartum NEFA ≥ 0.33 -683 0.001
Parity -556 0.01Postpartum -- heifers NEFA ≥ 0.57 +488 0.02
BHBA ≥ 10 -143 0.5Postpartum -- heifers BHBA ≥ 9 +403 0.04Postpartum -- cows NEFA ≥ 0.72 -647 0.001
BHBA ≥ 10 -165 0.4Postpartum - cows BHBA ≥ 10 -393 0.04
97

Table 4. Herd-level impacts of elevated prepartum and postpartum nonesterified fatty acids (NEFA) andpostpartum beta-hydroxybutyrate (BHBA) in commercial dairy farms (Ospina et al., 2010c)
Metabolite level Herd alarm Herd-level impactPrepartum NEFA (14 to 2 d prepartum) >15% -1.2% 21-d pregnancy> 0.3 mEq/L + 3.6% disease incidence
- 282 kg ME305 milk
Postpartum NEFA (3 to 14 d postpartum) >15% - 0.9% 21-d pregnancy rate> 0.6 (heifers) – 0.7 (cows) mEq/L > 15% + 1.7% disease incidence
Heifers: - 288 kg ME305 milkCows: -593 kg ME 305 milk
Postpartum BHBA (3 to 14 d postpartum) > 15% - 0.8% 21-d pregnancy rate> 10 (cows) – 12 (heifers) mg/dL 1.8% disease incidence
> 20%* *Heifers: -534 kg ME305 milkCows: -358 kg ME 305 milk
15% of 15 animals sampled = 2 to 3 animals over threshold; 90% confidence interval that it sample represents herdprevalence
Table 5. Interpretation of energy-related metabolites [nonesterified fatty acids (NEFA) and beta-hydroxybutyrate(BHBA)] to assess herd-level opportunities.
Scenario Likely cause and possibilitiesHigh prepartum NEFA Likely starting with low DMI in close-up cowsHigh postpartum NEFA and/or BHBA Too low energy in prefresh diet, facility and/or management
issues (grouping, stocking density, heat stress?)High prepartum NEFA Low DMI in close-up cowsLow postpartum NEFA and/or BHBA Sampling the survivors in the fresh pen?
Is herd outmanaging or putting band-aids on fresh cow issues?Low prepartum NEFA Is herd overfeeding energy either far-off or close-up?High postpartum NEFA and/or BHBA Diet or facility/management issues specific to maternity/fresh
group
98

Figure 1. Difference in predicted 305ME milk yield for cows above the indicated Haptoglobin (Hp)cutpoints relative to cows that are below the cutpoints
Figure 2. Difference in predicted 305ME milk yield for cows above the indicated fecal cortisol metabolite(FCORT) cutpoints relative to cows that are below the cutpoints
1 Current affiliation: Animal Welfare Program, University of British Columbia, Vancouver BC2 Contact at 272 Morrison Hall, Ithaca, NY 14853. Phone (607) 255-2878 Email [email protected]
99

[Dr. Sheila McGuirk at the School of VeterinaryMedicine also contributed to this manuscript]
BackgroundKetosis has emerged as the most common metabolicdisease of dairy cattle. About 30% of cows haveelevated blood BHBA concentrations in earlylactation (Oetzel, 2004). Individual herds can havemuch higher rates (McArt et al., 2011) (McArt et al.,2012). Cows affected with ketosis have been well-documented to have reduced milk yield, increasedrisk for metritis, and increased risk for DA (Dohooand Martin, 1984, Duffield et al., 2009, Ospina et al.,2010). Early detection using a cowside bloodβ−hydroxybutyrate (BHBA) test and prompttreatment with oral propylene glycol significantlyreduces the losses associated with ketosis (McArt etal., 2012, McArt et al., 2011).
Human patients with Type I diabetes mellitus are atrisk for diabetic ketoacidosis and often need tomonitor their blood BHBA concentrations.Monitoring blood BHBA is superior to monitoringurine acetoacetate using urine test strips. AbbottLaboratories has developed a very small hand-heldmeter (Precision XtraTM) that measures either wholeblood BHBA or whole blood glucose. As far as weknow, no other human glucometer can also functionas a ketometer (i.e., able to measure blood BHBA).The Precision XtraTM meter gives excellent results formeasuring whole blood BHBA in cows. Noadditional calibration or adjustment from the humansystem is needed.
The Precision XtraTM ketone monitoring system is asimple and direct electrochemical test (which mayexplain why it works well for both human andbovine blood). The ketone test strip contains theenzyme �-hydroxybutyrate dehydrogenase, whichoxidizes BHBA to acetoacetate. This reduces NAD+
to NADH. The NADH is then reoxidized to NAD+
by an electron transfer mediator molecule. Theelectrical current generated by this conversion ismeasured by the meter and is directly proportional tothe BHBA concentration.
Equipment Needed for Cowside Blood BHBATesting
1. Abbott Precision XtraTM meterThese meters retail are available from mostveterinary distributors for about $50. Most humanpharmacies also stock the meters, but theytypically retail for about $75 to $90. Sometimesthe meters can be found on sale at humanpharmacies. Contact Abbott Animal HealthCustomer Service (888-299-7416) for updatedinformation about veterinary suppliers of themeters.
2. Abbott Precision XtraTM Blood Ketone test stripsThe blood ketone test strips (which measureBHBA) are sold in boxes of 10 strips each. Expectto pay about $13 to $15 for a box of 10 strips ($1.30to $1.50 per strip) through a veterinary distributor.Contact Abbott Animal Health Customer Service(888-299-7416) for updated information aboutveterinary suppliers of the blood ketone test strips.Most human pharmacies do not stock the bloodketone strips routinely but can order them. Expectto pay about $40 to $75 for a box of 10 strips ($4.50to $7.50 per strip) if purchased through a humanpharmacy or on-line human pharmacy distributor.
Spending $1.50 per BHBA test is cheaper thansending a blood sample to a lab for BHBA testing,but more expensive than cowside urine or milktests. Cowside urine and milk tests are not asaccurate as the blood tests.
If you find the blood ketone strips at a very cheapprice (eBay, other web vendors) then they may bevery short-dated or even out of date. Out of datestrips cannot be used - the meter will give an errormessage and will not display a ketone reading.
On-Farm Ketosis MonitoringGarrett R. Oetzel, DVM, MS
School of Veterinary Medicine, University of Wisconsin-Madison2015 Linden Drive, Madison, Wisconsin 53706
100

How to Use the Cowside Blood BHBA Test in Cattle1. Remove a ketone test strip from its foil packet andinsert it into the meter (with the contact bars onthe test strip facing up). The meter willautomatically turn itself on, recognize the lotnumber of the test strip, and prompt you that it isready for the blood sample to be applied to theend of the test strip. Make sure that the displayedlot number on the meter is the same as the lotnumber on the test strip. Note that you must putthe ketone calibrator strip (one of these isprovided in each box of 10 strips) into the meterthe first time you use a test strip from a new boxof 10 test strips. The meter then “remembers” thislot of test strips and recognizes themautomatically when they are placed in the meter.No further calibration of the meter is necessary.
Be sure to keep the ketone test strip dry beforeusing it. Moisture on the test strip may falselylower the BHBA test results.
Note that you must put the test strip into themeter before applying blood to it.
2. Obtain a drop of blood from the cow. The bestway we have found to do this is to collect a verysmall amount of blood from the tail vein using asmall needle (20 or 22 gauge) and small syringe (1ml tuberculin syringe or a 3 ml syringe). You onlyneed a good flash of blood in the syringe (<0.1 ml)and you have the entire sample you need. Cowsthat are lying down often don’t even get up whenyou insert such a small needle in the tail vein.
3. Apply a drop of blood from the syringe to the endof the test strip. The strip will draw the blood intoa small sample well, and the meter will indicatewhen the sample well is full. The amount ofblood needed is very small (1.5 microliters).
4. Wait 10 seconds for the meter to display theresults (it will count down the time). BHBAresults are displayed as mmol/L (same asmillimoles/liter or mM). To convert frommmol/L to mg/dL, multiply the test result by10.3. So, a test result on the meter of 1.4 mmol/Lequals 14.4 mg/dL. Published literature suggeststhat between about 1.2 and 1.4 mmol/L BHBA isthe threshold level at which cows begin to showproblems due to ketosis (reduced milk yieldand/or higher risk of secondary diseases).Because the meter gives slightly lower test resultsthan serum tests done at a laboratory and becausewe don’t want to misclassify cows that may haveketosis as being normal, we recommendclassifying all cows with 1.2 mmol/L or higherBHBA concentrations as having ketosis.
5. We have found that this small, hand-held meterworks very well cowside. It is not necessary tobring the blood samples inside. If it is coldoutside be sure to keep the meter and test stripswarm in your pocket.
Accuracy of the Cowside Blood BHBA TestEven using the human blood calibration inherent inthe ketone monitoring system, the BHBA results onblood from cattle are surprisingly accurate. The firstreport about the application of this meter to cattlewas an abstract in the Journal of Dairy Science(Endecott, 2004). No accuracy information wasincluded in this abstract, although in the oral abstractpresentation the authors presented data indicatingthat the ketometer BHBA values were very similar tocommercial laboratory BHBA test results. A laterDanish abstract (Jeppesen, 2006) indicated that BHBAresults from the ketometer (marketed by Abbott inEurope as the MediSense® system) were highlycorrelated to laboratory test results for BHBA (R2 =0.987).
Three recent research studies (Burke et al., 2008,Iwersen et al., 2009, Oetzel and McGuirk, 2008) allgave very similar results and all confirm the excellentaccuracy of the Precision Xtra™ blood ketone systemfor diagnosing ketosis in dairy cattle. These studiesinvolved a total of 622 cows with a 14.1% prevalenceof ketosis. The average R2 between hand-held meterand laboratory BHBA results was 0.94. The hand-held meter was 91% sensitive and 94% specific fordiagnosing ketosis (pooled results from all threetrials). The positive predictive value for the meterwas 73% and the pooled negative predictive valuewas 98%.
These results are extremely encouraging and suggestthat BHBA results from the hand-held meter areexcellent – far better than the other cowside tests(urine acetoacetate or milk BHBA) that are currentlyavailable.
It should be noted that the hand-held meter is notsufficiently accurate for research purposes (Kaiser etal., 2009). This is particularly true in research studiesevaluating small changes in blood BHBA that fallbelow the ketosis threshold.
101

Application of the Cowside Blood BHBA Test onDairy FarmsThe most rewarding use of cowside blood BHBAtesting is for herd-based ketosis monitoring (Oetzel,2004). The cowside BHBA test with the hand-heldmeter can be used in place of submitting serum orplasma samples to a laboratory for BHBA testing. Insummary, the protocol involves testing 12 or morecows in early lactation. If more than 10% of the cowstested have elevated blood BHBA, then the group isconsidered to have a ketosis problem.
The advantages of using cowside blood BHBA testingfor herd-based monitoring (instead of submittingsamples to a laboratory) are obvious. Cost of theketone test strips are less than the cost of laboratorytesting, the results are known immediately, only avery small blood sample is required, and there is noneed to process or mail serum or plasma samples to alaboratory.
The cowside blood BHBA test can also be used to testindividual cows for ketosis. Cowside blood BHBAinformation can then be used for individual cowtreatment decisions. Other cowside tests (milk BHBAor urine acetoacetate) have been traditionally usedfor this purpose. The cowside blood BHBA test hasmuch better combined sensitivity and specificity theother cowside tests. However, the blood BHBA test ismore expensive and requires some skill in samplecollection and some training to learn to operate themeter. The choice of the best protocol for individualcow ketosis testing depends on the uniquecircumstances within each dairy herd.
Comments about Cowside Blood Glucose TestingThere may be some usefulness for cowside bloodglucose testing. The test strips for whole bloodglucose for the Abbott Precision XtraTM meter arereadily available (usually in stock at mostpharmacies), cost less than $1.00 each, and are as easyto use as the blood ketone strips. However,agreement between laboratory plasma glucose andwhole blood glucose using the cowside test is not asgood as it is for BHBA. We compared blood glucosedetermined by the hand-held meter compared tolaboratory analysis and found an R2 of 0.56 (Oetzeland McGuirk, 2008). The hand-held meter withglucose strips was about 55% sensitive and 99%specific in diagnosing hyperglycemia (blood glucose>79 mg/dl).
We suggest that cowside blood glucose testing beused only for individual cow treatment decisions andnot as a herd-based monitoring test. Glucose is notuseful as a herd-level test because it is a highlyregulated metabolite that is unlikely to change inresponse to overall herd management or nutrition.
Also, the necessary cut points and alarm levels forherd-based glucose testing have not been derived.Herd-level problems with energy nutrition arediagnosed by monitoring blood BHBA in the freshcows, milk yield and body condition score for the restof lactation, and blood nonesterified fatty acids(NEFA) in the pre- and post-fresh cows.
We have found that blood glucose is consistently lowin cows at the time of their first ketosis diagnosis,even if the cow is in very early lactation andapparently has Type II ketosis with underlying fattyliver. Some have reported finding cows that aresimultaneously hyperglycemia and ketotic, but this isapparently a rare finding. Thus it is not necessary toconfirm the hypoglycemia before treating these cowswith an oral glucose precursor or IV glucose.
There are many situations involving individual sickfresh cows where their glucose status is uncertainand some information about their blood glucosestatus could guide treatment decisions. We areparticularly concerned about avoiding glucosetreatment in cows that are already hyperglycemic.Situations in which glucose testing could be usefulinclude chronically ketotic cows (particularlyfollowing multiple ketosis treatments), any sick cowsthat are less than about 4 days in milk (these cows areoften hyperglycemic because they calved so recently),and off-feed cows without an obvious cause. In thesesituations, knowledge of the cow’s glucose statuswould be valuable prior to treatment. Treating cowswith IV glucose (or over-treatment with oral glucoseprecursors) can have negative consequences andshould not be undertaken in cows that are alreadyhyperglycemic. For example, the hand-held metercould be used to show that routine treatment of justfresh cows with IV glucose is unnecessary andcontraindicated because these cows are alreadyhyperglycemic. Veterinarians or producers thatalready use the meter for blood BHBAdeterminations may find it useful to purchase someblood glucose test strips and use them for occasionalblood glucose testing.
102

ReferencesBurke, C. M., K. E. Leslie, and L. M. Neuder. 2008. Testcomparison of Precision Xtra and Ketostix for ketosis indairy cows. Proc. Am. Assoc. Bov. Pract. 41:287.
Dohoo, I. R. and S. W. Martin. 1984. Subclinical ketosis:prevalence and associations with production anddisease. Canadian journal of comparative medicine.Revue canadienne de medecine comparee 48:1-5.
Duffield, T. F., K. D. Lissemore, B. W. McBride, and K. E.Leslie. 2009. Impact of hyperketonemia in early lactationdairy cows on health and production. J. Dairy Sci.92:571-580.
Endecott, R. L., Black, C. M., Notah, K. A., Petersen, M. K.2004. Blood ketone leves of young postpartum rangecows increased after supplementation ceased. J. DairySci. 87 (Suppl. 1):114.
Iwersen, M., U. Falkenberg, R. Voigtsberger, D. Forderung,and W. Heuwieser. 2009. Evaluation of an electroniccowside test to detect subclinical ketosis in dairy cows.J. Dairy Sci. 92:2618-2624.
Jeppesen, R. J., Enemark, M. D., Enevoldsen, C. 2006.Ketone body measurement in dairy cows.ReferenceOS43-42 in 24th World Buiatrics Congress. World Assoc.Buiatrics, Nice, France.
Kaiser, T. M., S. E. Stebulis, and R. R. Grummer. 2009. Theaccuracy and precision of the hand-held PrecisionXtraTM meter for measuring beta-hydroxybutyrate inwhole blood from dairy cows. J. Dairy Sci. 92, E-Suppl.1:478.
McArt, J. A., D. V. Nydam, and G. R. Oetzel. 2012. A fieldtrial on the effect of propylene glycol on displacedabomasum, removal from herd, and reproduction infresh cows diagnosed with subclinical ketosis. J. DairySci. 95:2505-2512.
McArt, J. A., D. V. Nydam, P. A. Ospina, and G. R. Oetzel.2011. A field trial on the effect of propylene glycol onmilk yield and resolution of ketosis in fresh cowsdiagnosed with subclinical ketosis. J. Dairy Sci. 94:6011-6020.
Oetzel, G. R. 2004. Monitoring and testing dairy herds formetabolic disease. Vet. Clin. North Am. Food Anim.Pract. 20:651-674.
Oetzel, G. R. and S. M. McGuirk. 2008. Evaluation of ahand-held meter for cowside evaluation of blood beta-hydroxybutyrate and glucose concentrations in dairycows. Proc. Am. Assoc. Bov. Pract. 41:234.
Ospina, P. A., D. V. Nydam, T. Stokol, and T. R. Overton.2010. Evaluation of nonesterified fatty acids and beta-hydroxybutyrate in transition dairy cattle in thenortheastern United States: Critical thresholds forprediction of clinical diseases. J. Dairy Sci. 93:546-554.
103
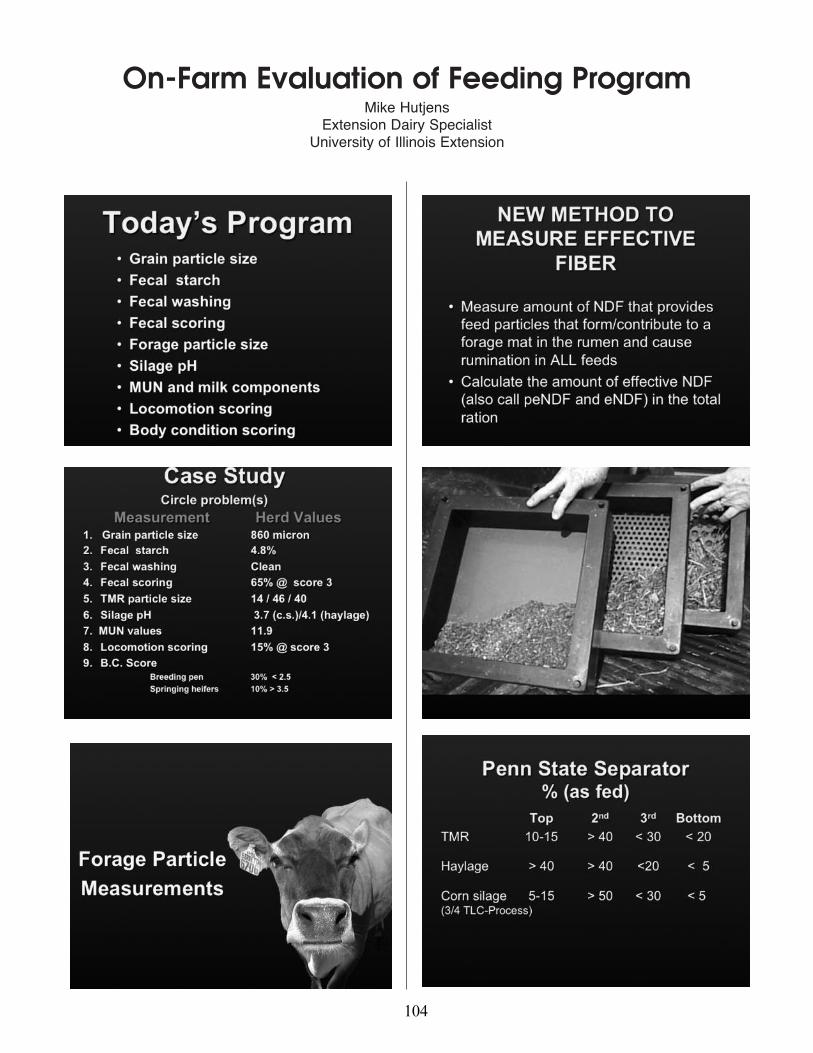
On-Farm Evaluation of Feeding ProgramMike Hutjens
Extension Dairy SpecialistUniversity of Illinois Extension
104

105

106

107

108

109

110

111

IntroductionThe period from three weeks before to three weeksafter parturition in dairy cows, also known as thetransition period, is characterized by significantchanges in hormonal profile, feed intake, nutrientrequirements, metabolism, and energy balance. Thesechanges are known to dramatically affect immunefunction. Consequently, cows are at greater risk ofhealth disorders and mortality during early lactation.In the last week of gestation, concentrations ofprogesterone decrease as concentrations of cortisol,estradiol, prostaglandin F2α, and prolactin increase(Stevenson, 2007). These changes are important foronset of colostrum production and preparation forparturition. Cortisol, the key hormone that triggersparturition (Akers, 2002), is known to alter neutrophilmorphology and functionality (Burton and Kehrli,1995a; Burton et al., 1995b; Burton et al., 2005). At thesame time that dramatic hormonal changes areoccurring, feed intake in the last 14 d beforeparturition decreases by approximately 50%, reachingits nadir on the day before parturition (Grummer etal., 2004). Although feed intake starts to increaseimmediately after parturition, it is not sufficient tomeet nutrient requirements for the rapidly increasingmilk yield. Thus, cows suffer from negative energybalance for up to 8 to 12 weeks after parturition andmust utilize body energy reserves to meet nutrientrequirements for milk production. At the same timethat decline in feed intake starts to occur, adecoupling of the somatotropic axis occurs thatresults in elevated concentrations of growth hormone(GH) and reduced circulating concentrations ofinsulin and insulin-like growth factor-1 (IGF-1),because of down regulation of expression of GHreceptor 1-alfa (Rhoads et al., 2004; Lucy, 2008).Furthermore, around the time of parturition cowsundergo a state of insulin resistance in which glucosereceptor dependent uptake of glucose by muscle andadipose tissue is reduced and GH-induced lipolysis isincreased. These are considered homeorhetic changesto assure that cows continue to produce milk duringperiods of scarce nutrient availability. Thecombination of reduced feed intake, negative energybalance, increased GH concentration, and insulinresistance result in elevated plasma concentrations ofnon-esterified fatty acids (NEFA). Exposure of cowsto severe and prolonged negative energy balance and
extremely elevated concentrations of NEFApredispose cows to hepatic lipidosis (Grummer et al.,2004), compromised liver function, incompleteoxidation of NEFA, and elevated concentrations ofketone bodies [e.g. beta-hydroxy butirate (BHBA)](Grummer et al., 2004).
Elevated plasma NEFA concentration is associatedwith reduced neutrophil function (Klucinski et al.,1988; Rukkwamsuk et al., 1999; Hammon et al., 2006)and reduced feed intake during the prepartum periodis associated with reduced peripartum neutrophilactivity (phagocytosis and oxidative burst) andincreased likelihood of metritis postpartum(Hammon et al., 2006). Furthermore, postpartumhepatic lipidosis has been associated with increasedlength of bacterial shedding from mastitic cows (Hillet al., 1985) and prepartum increase in fatmobilization and serum lipoprotein metabolismresulted in increased risk of metritis and retainedfetal membranes (Kaneene et al., 1997). Increasingprepartum and postpartum NEFA plasmaconcentrations were associated with increased risk ofretained fetal membranes, metritis, clinical ketosis,and displacement of abomasum (DA; Ospina et al.,2010). Accentuated negative energy balanceaccompanied by increased BHBA plasmaconcentrations during early postpartum also has beenassociated with increased risk of metritis and DA(Ospina et al., 2010), endometritis (Reist et al.; 2003),and other peripartum diseases (Erb and Grohn, 1988;Grohn et al., 1989; Correa et al., 1993). Therefore,situations of stress, limited availability of and/oraccess to feed and water during the transition periodare likely to exacerbate the negative energy balanceand further compromise immune function andincrease the risk for postpartum diseases.
Regrouping of dairy cows is used in dairy operationsto maintain homogenous groups in terms of gestationstage to optimize nutritional management. Thus, inmany dairy operations cows are housed as a groupfrom approximately 230 to 250 d of gestation in socalled “dry cow pens” and as another group from 251d of gestation to parturition in so called “close-upcow pens”. Every week, cows from the dry-cow penare moved to the close-up cow pen, which results inweekly disruption of social interactions and for many
Transition Cow Grouping Strategy:Effects on Cow Health
Ricardo C. Chebel and Paula R.B. Silva225 VMC 1365 Gortner Ave., St. Paul, MN 55108
112

cows disruption of social interactions in the last daysbefore parturition. Constant regrouping of cowschanges the hierarchical order among them, forcingcows to reestablish social relationships throughphysical and nonphysical interactions andexacerbating aggressive and submissive behaviors(von Keyserlingk et al., 2008). Furthermore, becausedry-cows and close-up cows are not producing milk,their management is often taken for granted resultingin overstocked pens, insufficient water and feedavailability, and exposure to adverse weatherconditions (i.e. heat stress). These managerialinadequacies that increase and prolong the negativeenergy balance during the peripartum transform thenormal homeorhetic changes into metabolic diseases(i.e. excessively elevated fat mobilization, hepaticlipidosis, and ketosis) further suppressing immunefunction of dairy cows and predisposing them tohealth disorders, and compromised productive,reproductive, and economic performances.
Stocking density prepartum and its effects onbehavior, feed intake, and immune functionCows are social animals and as such are highlysusceptible to social interactions and hierarchicalorder. Situations of limited space or access to feedexacerbate aggressive and submissive behaviors. Twosmall but elegant studies conducted in researchfacilities of the University of British Columbia inCanada demonstrated the effects of overstocking ofprepartum cows on behavior and feed intake.According to one of these studies, cows housed inpens in which the ratio of cows to feeding bin was 2:1had altered behavior compared with cows housed inpens with cow to feeding bin ratio of 1:1(Hosseinkhani et al., 2008). Similarly, the secondstudy demonstrated that cows housed in pens with30 cm/cow of feed bunk space had altered behaviorcompared with cows housed in pens with 60 cm/cowof feed bunk space (Proudfoot et al., 2009). Thesealtered behaviors included increased rate of feedintake, fewer meals per day, increased feed sorting,decreased overall feed intake, increased standingtime, and increased rate of displacement from thefeeding area (Hosseinkhani et al., 2008; Proudfoot etal., 2009). The consequences of stocking density fordominant and submissive cows are likely to bedistinct. Dominant cows are predisposed to ruminalacidosis when they have increased rate of feed intake,fewer meals per day, and increased feed sorting. Onthe other hand, submissive cows are more likely tohave metabolic diseases such as hepatic lipidosis andketosis because of reduced feed intake and to developlameness because of increased standing time anddisplacement rate. Therefore, overstocking of pens ofprepartum cows, a common problem in dairyoperations of all sizes, predisposes all cows toinadequate nutrient intake prepartum and
consequently compromised immune function.
We are unaware of studies with dairy cows that haveevaluated the effects of stocking density on immuneparameters during the periparturient period. Dairyewes, however, that were housed in high stockingdensity (1.5 m2/ewe) conditions during theperipartum period up to mid-lactation had reducedanti-ovalbumin IgG concentration in response to anovalbumin challenge compared with ewes housed inlow stocking density (3 m2/ewe) conditions(Carporese et al., 2009). Furthermore, ewes that werehoused in high stocking density conditions tended tohave greater number of aggressive interactions andhad reduced milk yield and increased milk somaticcell count (Carporese et al., 2009). Therefore,increased stocking density is likely to affect immunefunction of dairy cows as well.
Regrouping frequency and its effects on behavior, feedintake, and milk yieldThe effects of regrouping frequency of cows onbehavior, feed intake, and health has been less studiesand has yielded more contradictory results. In smallstudies also conducted in Canada cows weredemonstrated to have reduced feeding time, greaterrate of displacement from the feed bunk and stalls,and reduced milk yield on the days followingregrouping (von Keyserlingk et al., 2008). Althoughthe question has not yet been definitively answered,cows may require 3 to 14 days after regrouping toreestablish social stability to pre-regrouping levels(Grant and Albright, 1995). This could be a significantproblem for close-up cows because weekly entry ofnew cows in the close-up could result in socialdisruption and stress on the last days of gestation,compromising further dry matter intake (DMI) andimmune parameters.
Coonen et al. (2011) evaluated dry matter intake,plasma NEFA concentration, and 30-d milk yield ofclose-up cows (14 to 28 d before expected calving date)that were housed in stable (no new cows entering theclose-up pen) or dynamic pen (new cows entering theclose-up pen twice weekly). The pens were relativelysmall (10 cows per pen) and the total number of cowsused in the experiment was 85. Cows were observedtwice weekly for 1 h after feed delivery to evaluatesocial disruption in the feed bunk. In this small studyno differences in feed bunk displacement rate, DMI,NEFA concentrations during the peripartum, and milkyield between ‘stable’ and ‘dynamic’ grouping systemswere observed (Table 1). It is likely that the lack ofdifference in displacement rate from the feed bunk inthis study was a consequence of the monitoringschedule used, but the lack of difference DMI, NEFAconcentration, and milk yield are novel and importantto evaluate in larger studies.
113

In a recent study (Silva et al., 2012a) the hypothesisthat constant disturbance of social order prepartumby weekly introducing new cows in a close-up penwas tested in a large dairy herd (6,400 lactatingcows). Cows (254 ± 7 d of gestation) were paired bygestation length and assigned randomly to an All-In-All-Out (AIAO) or control treatments. In the AIAO (n= 259) treatment, groups of 44 cows were moved intoa pen where they remained for 5 wk, whereas in thecontrol treatment (n = 308) approximately 10 cowswere moved into a pen weekly to maintain stockingdensity of 100% and 92% relative to stalls andheadlocks, respectively. Cows in the AIAO treatmentthat had not calved by 5 wk remained in the samepen until calving but new cows were added to thepen to achieve 100% stocking density relative tostalls. Pens were identical in size (44 stalls and 48headlocks) and design and each of the pens receivedeach treatment a total of 3 times, totaling 6 replicates.Video recording cameras were placed above the feedlane for determination of feed bunk displacementactivity (Lobeck et al., 2012). Displacement from thefeed bunk was measured, in both pens, during 3 h onthe day cows were moved to the close-up pen (-30 dbefore expected calving date) at 13:00 ± 1:00 andfollowing fresh feed delivery (05:00 ± 1:00) 1, 2, 3 and7 d after cows were moved to control close-up pen.Displacement rate was calculated as dailydisplacements divided by the number of cows in thepen to account for stocking density. Cows wereexamined at enrollment, calving, and 28 and 56 DIMfor body condition score (BCS; 1 = emaciated to 5 =obese) and lameness and at 1, 4, 7, 10, and 14 DIM forretained fetal membranes (RFM) and metritis. Cowswere observed daily for DA and mastitis until 60DIM. Blood was sampled weekly from all cows from21 d before expected calving date to 21 DIM fordetermination of non-esterified fatty acid (NEFA)concentration. Blood was sampled weekly from 14 dbefore expected calving date to 14 DIM from asubgroup of cows (n = 34/treatment) to determineneutrophil phagocytosis (PHAGO), oxidative burst(OXID), expression of CD18 and L-selectin, and forhematology. Milk production and components weremeasured monthly and energy corrected milk yieldwas calculated for the first 3 tests. Cows wereexamined by ultrasound for detection of corpusluteum (CL) at 39 ± 3 and 56 ± 3 DIM. Cows werepresynchronized with three injections ofprostaglandin F2α at 41 ± 3, 55 ± 3, and 69 ± 3 DIM,and those observed in estrus after 55 DIM wereinseminated, whereas cows not observed in estruswere enrolled in an Ovsynch56 protocol at 81 ± 3DIM. Pregnancy exam was conducted 38 ± 3 and 66 ±3 d after AI.
In figure 1 we observe that the average stockingdensity of the control pen varied between 100 and
69.5%, whereas the average stocking density in theAIAO pen varied between 100 and 7.3% (Silva et al.,2012a). There were 17 AIAO cows that did not calvewithin 5 wk and had to be mixed with other cows.The average interval between mixing of these cowsand calving was 4.1 ± 0.6 d. The data referent to thesecows is discussed later in this manuscript (Silva et al.,2012b).
A greater number of displacements was observed inthe control treatment than in the AIAO treatment(22.0 ± 1.0 vs. 10.4 ± 1.0; P < 0.01; Lobeck et al., 2012).Similarly, displacement rate was greater for thecontrol than AIAO treatment (0.54 ± 0.03 vs. 0.31 ±0.03; P < 0.001; Lobeck et al., 2012). Treatment did notaffect BCS (P > 0.59) or lameness (P > 0.35) at anyinterval of the study (Silva et al., 2012a). Glucose(59.2 ± 1.3 mg/dl; P = 0.28) and NEFA (227.2 ± 3.2�mol/L; P = 0.17) concentrations were not affected bytreatment (Silva et al., 2012a). Percentage ofneutrophil positive for OXID (P = 0.91) and PHAGO(P = 0.98) and intensity of OXID (P = 0.94) andPHAGO (P = 0.91) were not different betweentreatments. In addition, percentages of neutrophilexpressing CD18 (P = 0.17) or L-Selectin (P = 0.83)were not different between treatments (Silva et al.,2012c). Number of leukocytes (P = 0.64), neutrophils(P = 0.33), and lymphocytes (P = 0.80) were notaffected by treatment (Silva et al., 2012c). Similarly,treatment had no effect on incidence of RFM (P =0.84), metritis (P = 0.35), acute metritis (P = 0.54), DA(P = 0.92), and mastitis (P = 0.47; Table 1; Silva et al.,2012b). Treatment had no effect on milk yield (33.1 ±0.3 kg/d, P = 0.82), energy corrected milk (37.2 ± 0.3kg/d, P = 0.66), and linear somatic cell score (2.9 ±0.1, P = 0.28; Silva et al., 2012b). Percentage of cowswith a CL on d 39 (P = 0.17) and 56 (P = 0.96) andpercentage of cows pregnant after first AI (P = 0.47)were not affected by treatment (Silva et al., 2012b).
Among AIAO cows, those that did not calve within35 d after enrollment and had an additional change ingroup a few days before calving (average 4.1 ± 0.6 d)had similar incidence of health disorders andreproductive performance compared with those thatcalved within 35 d after enrollment and were onlyregrouped once, at enrollment. Furthermore, cowswith additional regrouping a few days prepartumhad greater yield of ECM than those that did nothave additional regrouping (39.1 ± 2.4 vs 32.3 ± 1.4kg/d; P < 0.01).
According to the current experiment, even though incommercial herds where size of close-up pens isexpected to be larger than in research facilities,weekly entry of new cows in a close-up pen isexpected to cause more agonistic interactions in thefeed bunk than stable pen. In the current experiment,
114

however, the increased rate of displacement from thefeed bunk did not result in compromised innateimmune function or metabolic parameters.
Correspondingly to these findings, increased socialdisturbance in the control treatment did not result ingreater incidence of diseases or reduced reproductiveand productive performances. It is interesting thateven AIAO cows that underwent group changewithin 4.1 ± 0.6 d prepartum no significant increasein incidence of disease or reduction in reproductiveperformance were observed. From the currentexperiment and from the experiment by Coonen et al.(2011) we conclude that conventional prepartumgrouping strategy (i.e. weekly entry of new cows tothe close-up pen) does not affect health of cows.These are important findings because the averagestocking density of the control pen was 87%, whereasin the AIAO pen it was 73% (Silva et al., 2012a).Therefore, in a herd with 1,000 lactating dairy cows,with 110 calving per month, and a close-up period of28 d, the dairy would need 126 stalls if a conventionalsystem is implemented and 150 stalls if an AIAOsystem is implemented. If the cost of a stall isapproximately $ 5,000, the additional cost to build theclose-up pen for an AIAO system would beapproximately $ 120,000.
Conclusions and recommendationsCows exposed to conditions that limit feed intakeprepartum (i.e. overstocking or lack of water) are atgreater risk of immune suppression and metabolicdiseases peripartum and health disorderspostpartum. Furthermore, because a positivecorrelation exists between prepartum andpostpartum feed intake (Grummer et al., 2004),conditions that limit feed intake prepartum are likelyto have a profound effect on productivity of dairycows and economic sustainability of dairy operations.Weekly prepartum regrouping affects behavior ofdairy cows, particular in the feed bunk in the hoursfollowing feeding. Weekly prepartum regrouping ofdairy cows, however, does not seem to be associatedwith immune and metabolic parameters peripartumand health postpartum. Furthermore, because ‘All-In-All-Out’ or ‘stable’ prepartum grouping strategyresults in reduced average stocking density comparedwith a conventional system (weekly entrance of newcows in the close-up pen), the cost to build facilitiesfor an ‘All-In-All-Out’ system would be significantlygreater than the cost to build close-up pens forconventional systems.
The current recommendations indicate that stockingdensity during the prepartum should be 1 cow perstall and at least 27 inches of linear feed bunk spaceper cow in pens with headlocks and 30 inches oflinear feed bunk space per cow in pens without
headlocks. Another very important, and oftenoverlooked, requirement of prepartum cows is wateravailability. Current recommendations indicate thatthere should be at least 3 inches of linear space ofwater trough/cow and 20 cows/water trough.
ReferencesAkers, R. M. 2002. Endocrine, growth factor, and neural
regulation of mammary development. In Lactation andthe Mammary Gland, edn. 1, pp 165-198. Ames, IA:Blackwell Publishing Professional.
Burton, J. L., and M. E Kehrli Jr. 1995a. Regulation ofneutrophil adhesion molecules, and shedding ofStaphylococcus aureus in milk of cortisol- anddexamethasone-treated cows. Am. J. Vet. Res. 56:997-1006.
Burton, J. L., M. E. Kehrli Jr., S. Kapil, and R. L. Horst.1995b. Regulation of L-selectin and CD18 on bovineneutrophils by glucocorticoids: effects of cortisol anddexamethasone. J. Leukoc. Biol. 57:317-325.
Burton, J. L., S. A. Madsen, L. Chang, P. S. D. Weber, K. R.Buckham, R. van Dorp, M. Hickey, and B. Earley. 2005.Gene expression signatures in neutrophils exposed toglucocorticoids: A new paradigm to help explain“neutrophil dysfunction” in parturient dairy cows. Vet.Immunol. Immunopathol. 105:197-219.
Carporese, M., G. Annicchiarico , L. Schena, A. Muscio, R.Migliore, and A. Sevi. 2009. Influence of spaceallowance and housing conditions on the welfare,immune response and production performance of dairyewes. J. Dairy Res. 76:66-73.
Coonen, J. M., M. J. Maroney, P. M. Crump, and R. R.Grummer. 2011. Short communication: Effect of a stablepen management strategy for precalving cows on drymatter intake, plasma nonesterified fatty acid levels,and milk production J. Dairy Sci. 94:2413–2417.
Correa, M. T., H. Erb, and J. Scarlett. 1993. Path analysis forseven postpartum disorders of Holstein cows. J. DairySci. 76:1305-1312.
Erb, H. N., and Y. T. Grohn. 1988. Symposium: healthproblems in the periparturient cow. Epidemiology ofmetabolic disorders in the periparturient dairy cow. J.Dairy Sci. 71:2557-2571.
Grant, R. J., and J. L. Albright. 1995. Feeding behavior andmanagement factors during the transition period indairy cattle. J. Anim. Sci. 73:2791-2803.
Grohn, Y.T., H. N. Erb, C. E. McCulloch, and H. S.Saloniem. 1989. Epidemiology of metabolic disorders indairy cattle: association among host characteristics,disease, and production. J. Dairy Sci. 72:1876-1885.
Grummer, R. R., D. G. Mashek, and A. Hayirli. 2004. Drymatter intake and energy balance in the transitionperiod. Vet. Clin N Am. Food Anim. 20:447-470.
Hammon, D. S., I. M. Evjen, T. R. Dhiman, J. P. Goff, and J.L. Walters. 2006. Neutrophil function and energy statusin Holstein cows with uterine health disorders. VetImmunol Immunopathol 113:21-29.
Hill, A. W., I. M. Reid, and R. A. Collins. 1985. Influence ofliver fat on experimental Escherichia coli mastitis inperiparturient cows. Vet. Rec. 117:549-551.
Hosseinkhani, A., T.J. DeVries, K.L. Proudfoot, R.Valizadeh, D.M. Veira, and M.A.G. von Keyserlingk.2008. The effects of feed bunk competition on the feedsorting behavior of close-up dry cows. J. Dairy Sci.91:1115-1121.
115

Kaneene, J. B., R. Miller, T. H. Herdt, and J. C. Gardiner.1997. The association of serum nonesterified fatty acidsand cholesterol, management and feeding practiceswith peripartum disease in dairy cows. Prev. Vet. Med.31:59-72.
Klucinski, W., A. Degorski, E. Miernik-Degorska, S.Targowski, and A. Winnicka. 1988. Effect of ketonebodies on the phagocytic activity of bovine milkmacrophages and polymorphonuclear leukocytes. Z.Veterinärmed. 35:632-639.
Lobeck, K. M., M. I. Endres, P. R. B. Silva, R. C. Chebel.2012. Effect of prepartum grouping strategy onagonistic behavior of dairy cows. J. Dairy Sci (Abst).
Lucy MC. 2008. Functional differences in the growthhormone and insulin-like growth factor axis in cattleand pigs: implications for post-partum nutrition andreproduction. Reprod Domest Anim. 43(Suppl 2):31-39.
Ospina, P. A., D. V. Nydam, T. Stokol, and T. R. Overton.2010. Evaluation of nonesterified fatty acids and �-hydroxybutyrate in transition dairy cattle in thenortheastern United States: Critical thresholds forprediction of clinical diseases. J. Dairy Sci. 93:546-554.
Proudfoot, K. L., D. M. Veira, D. M. Weary, and M.A.G. vonKeyserlingk. 2009. Competition at the feed bunkchanges the feeding, standing, and social behavior oftransition dairy cows. J. Dairy Sci. 92:3116-3123.
Reist, M. , D. K. Erdin, D. von Euw, K. M. Tschumperlin, H.Leuenberger, H. M. Hammon, N. Kunzi, and J. W.Blum. 2003. Use of threshold serum and milk ketoneconcentrations to identify risk for ketosis andendometritis in high-yielding dairy cows. AJVR 64:188-194.
Rhoads, R. P., J. W. Kim, B. J. Leury, L. H. Baumgard, N.Segoale, S. J. Frank, D. E. Bauman, and Y. R. Boisclair.2004. Insulin increases the abundance of the growthhormone receptor in liver and adipose tissue ofperiparturient dairy cows. J. Nutr. 134:1020-1027.
Rukkwamsuk, T., T. A. Kruip, and T. Wensing. 1999.Relationship between overfeeding and overconditioning in the dry period and the problems ofhigh producing dairy cows during the postparturientperiod. Vet. Quart. 21:71-77.
Silva, P. R. B., J. G. N. Moraes, L. G. D. Mendonça, A. A.Scanavez, G. Nakagawa, M. I. Endres, R. C. Chebel.2012a. Effects of prepartum grouping strategy on bodycondition score and metabolic parameters ofperipartum dairy cows. J. Dairy Sci (Abst).
Silva, P. R. B., J. G. N. Moraes, L. G. D. Mendonça, A. A.Scanavez, G. Nakagawa, M. I. Endres, J. Fetrow, R. C.Chebel. 2012b. Effects of prepartum grouping strategyon health, reproductive, and productive parameters ofdairy cows. J. Dairy Sci (Abst).
Silva, P. R. B., J. G. N. Moraes, L. G. D. Mendonça, A. A.Scanavez, G. Nakagawa, M. I. Endres, M. A. Ballou, R.C. Chebel. 2012c. Effects of prepartum groupingstrategy on immune parameters of peripartum dairycows. J. Dairy Sci (Abst).
Stevenson, J. S. 2007. Clinical reproductive physiology ofthe cow. In Current Therapy in Large AnimalTheriogenology, edn 2, pp 259-270. Saint Louis, MO:Saunders Elsevier.
von Keyserlingk, M.A.G., D. Olenick, and D.M. Weary.2008. Acute behavioral effects of regrouping dairycows. J. Dairy Sci. 91:1011-1016.
116

Table 1. Effects of stable and dynamic prepartum housing systems on feed bunk displacement, dry matter intake(DMI), plasma concentration of non-esterified fatty acids (NEFA), and milk yield [Adapted from Coonen et al.(2011)].
HousingVariables Stable Dynamic P-valueFeed bunk displacements 1.17 ± 0.52 1.69 ± 0.77 0.39DMI postpartum, kg/d 25.5 ± 1.6 25.7 ± 1.0 0.53NEFA, mEq/L
> d -15 0.21 ± 0.04 0.18 ± 0.04 0.69d -9 to -14 0.28 ± 0.04 0.21 ± 0.04 0.32d -3 to -6 0.36 ± 0.04 0.32 ± 0.04 0.63
Lactation first 30 DIMMilk yield, kg/d 34.6 ± 1.4 36.9 ± 3.4 0.32Fat, % 4.59 ± 0.16 4.54 ± 0.33 0.88Protein, % 3.33 ± 0.12 3.39 ± 0.14 0.62
Table 2. Effects of a conventional and All-In-All-Out prepartum grouping systems on plasma concentration of non-esterified fatty acids (NEFA), incidence of postpartum diseases, culling, yield of energy corrected milk (ECM),resumption of cyclicity, estrous expression, and pregnancy to first postpartum AI [Adapted from Silva et al. (2012a),Silva et al. (2012b), and Silva et al. (2012c)].
Conventional AIAOP-value
(n=308) (n=259)NEFA from 21 d before to 21 d after calving, �mol/L 80.4 ± 8.2 62.9 ± 8.5 0.17NEFA > 100 �mol/L (21 d before calving), % 62.7 55.8 0.19NEFA > 130 �mol/L (7 d before calving), % 25.4 25.5 0.99Retained fetal membranes, % 10.9 11.6 0.84Metritis, % 16.7 19.8 0.35Displacement of abomasum, % 3.2 1.7 0.92Mastitis, % 13.8 11.3 0.47Culling within 60 DIM, % 9.1 8.9 0.9490-d ECM, kg/d 37.5 ± 0.4 36.8 ± 0.4 0.66Cyclic by 53 DIM 90.1 90.2 0.96Cows inseminated in estrus, % 93 91 0.52Pregnant 63 d after first AI, % 36.3 40.0 0.47
Figure 1. Stocking density of prepartum pens with conventional or All-In-All-Out grouping strategy (Silva et al.,2012a).
117

Iowa State University Leo Timms [email protected]
GETTING INDIVIDUAL COW WEIGHTSGETTING INDIVIDUAL COW WEIGHTS
How often? At least monthly!How often? At least monthly!
118
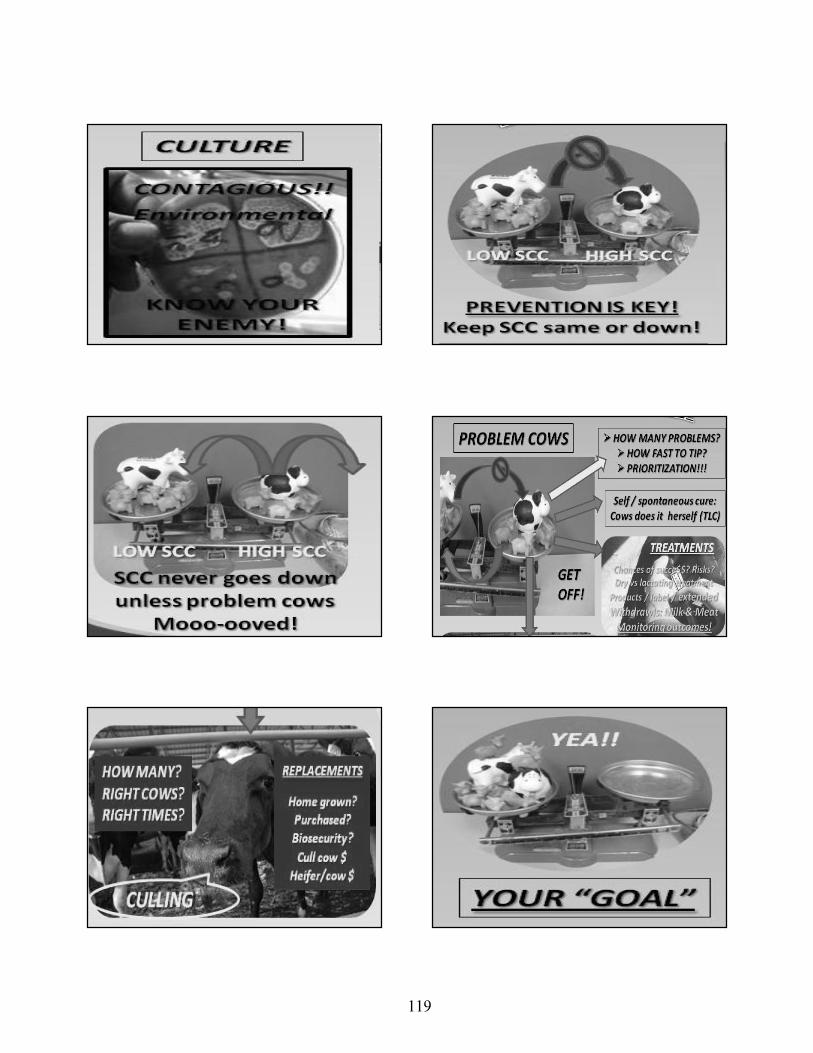
119

IntroductionDespite the widespread adoption of hormonalsynchronization protocols that allow for timedartificial insemination (TAI), detection of behavioralestrus continues to play an important role in theoverall reproductive management program on mostdairies in the U.S. (Caraviello et al., 2006; Miller et al.,2007). Several challenges for estrus detection onfarms include attenuation of the duration of estrousbehavior associated with increased milk productionnear the time of estrus resulting in shorter periods oftime in which to visually detect estrous behavior(Lopez et al., 2004), low number of cows expresingstanding estrus (Lyimo et al., 2000; Roelofs et al.,2005; Palmer et al., 2010), silent ovulations (Thatcherand Wilcox, 1973; Palmer et al., 2010; Ranasinghe etal., 2010), and reduced expression of estrous behaviordue to confinement (Palmer et al., 2010). Whateverthe cause, the low efficiency of estrus detection notonly increases time from calving to first AI butincreases the average interval between AI services(Stevenson and Call, 1983) thereby limiting the rate atwhich cows become pregnant.
Because of the impact of AI service rate onreproductive performance and the problemsassociated with visual estrus detection on farms,many technologies have been developed to enhanceestrus detection by providing continuous surveillanceof behavior including rump-mounted devices andandrogenized females (Gwazdauskas et al., 1990),pedometry (Peralta et al., 2005; Roelofs et al., 2005),and radiotelemetry (Walker et al., 1996; Dransfield etal., 1998; Xu et al., 1998). New electronic systems thatincorporate accelerometers as a means to associateincreased physical activity with estrous behavior incattle (Holman et al., 2011; Jónsson et al., 2011) havebeen developed and marketed to the dairy industry.Whereas a large body of literature exists on theaccuracy and efficacy of using various technologies topredict ovulation and timing of AI in relation toovulation in lactating dairy cows, no other studieshave investigated accelerometers for such purposes.
ExperimentTo assess the use of an accelerometer system forreproductive management, lactating Holstein cowsfrom a commercial dairy farm located insouthwestern Wisconsin milking approximately 1,000cows were used in a field trial, which was performedfrom August, 2010 to June, 2011. At 14 d after calving,all cows were fitted with an accelerometer(Heatime®, SCR Engineers, Ltd., Netanya, Israel)attached to a neck collar and an electronicidentification tag. After each milking, data collectedby the accelerometer was read by a transceiver unitplaced in an archway at the milking parlor exit andthen transferred to the accelerometer herdmanagement software (Data Flow™; Micro DairyLogic, Amarillo, TX) installed on the on-farmcomputer. The accelerometer system continuouslymonitored individual cow activity and recordedaverage activity for 2 h time periods. The raw activityof individual cows was plotted as a bar graph whereeach bar represented a 2 h block of time. The onset ofactivity was defined as the time at which the first barof raw activity of an estrus event was identified.Duration of activity was defined has the time intervalbetween the beginning and end of activity for anestrus event. Twice daily (a.m. and p.m.), a list ofcows determined by the accelerometer system to beeligible for insemination was generated, and cowsappearing on the list generated by the accelerometersystem were inseminated. Thus, inseminations wereconducted twice daily (a.m. and p.m.) by two herdpersonnel with each cow receiving a singleinsemination based on activity.
Each week, cohorts of 10 to 15 cows from 46 to 52DIM were evaluated by transrectal ultrasonographyto determine uterine health and record ovarianstructures. Cows without signs of uterine disease andat least one follicle ≥ 10 mm in diameter received ani.m. injection of GnRH followed by an i.m. injectionof PGF2a� 7 d later to synchronize estrus (Figure 1).Transrectal ultrasonography was performed at thetime of the PGF2a�� injection for subsequentdetermination of ovulatory response to GnRHtreatment. A total of 112 cows were enrolled, but only
Assessment of an Accelerometer System forDetection of Estrus and Timing of Artificial
Insemination in Lactating Dairy CowsP. M. Fricke, A. Valenza, G. Lopes Jr., M. C. Amundson, and J. O. Giordano
Department of Dairy Science, University of Wisconsin-Madison. Email: [email protected]
120

89 cows that were considered properly synchronizedwere included in the analyses. Transrectalultrasonography was performed at the time of thePGF2a�� injection for subsequent determination ofovulatory response to GnRH treatment. Diameter ofovarian structures was estimated and recorded usingon-screen background gridlines comprising squareswith 10 mm sides in the portable scanner. Ovulationwas defined as the presence of a follicle ≥ 10 mm atthe initial ultrasound examination at the time of theGnRH injection and the presence of a new corpusluteum in the same location at the subsequentultrasound examination at the time of the PGF2a��injection. Thereafter, ovarian ultrasonography wasperformed 48 h after the PGF2a�� injection and thenevery 8 h until ovulation occurred or until 96 h,whichever occurred first. Cows failing to ovulatewithin 96 h of the PGF2a�� injection were re-examined3 d later (i.e., 7 d after the PGF2a�� injection) todetermine whether ovulation had occurred.
Figure 1. Diagram of experimental activities. Cowsfrom 46 to 52 d postpartum received a G-P protocolto synchronize estrus using i.m. injections of GnRH(100 µg) and PGF2� (25 mg). Transrectalultrasonography (US) was used to assess ovarianstructures during the protocol and time of ovulationafter induction of luteolysis, and blood samples (B)were collected to assess serum progesterone.
ResultsThe percentage of cows with estrus events detectedby the accelerometer system and the distribution ofcows by occurrence of estrus and ovulation arepresented in Table 1. Throughout the study period,78% of cows ovulated within 7 d after induction ofluteolysis. Of the cows that ovulated, 59% ovulatedwithin 96 h, whereas 41% ovulated from 96 to 168 h(4 to 7 d) after induction of luteolysis. Overall, 71% ofcows were detected in estrus by the accelerometersystem, and 95% of cows showing estrus ovulatedwhereas 5% did not ovulate within 7 d of inductionof luteolysis. Of the cows not detected in estrus bythe accelerometer system, 35% ovulated whereas 65%did not ovulate within 7 d of induction of luteolysis.
Table 1. Percentage of cows determined to be inestrus, and distribution of cows by estrous activityand ovulation after induction of luteolysis based onuse of an accelerometer system1.
Activity and ovulation responses ofcows after induction of luteolysis % (n)Cows with estrous activity 71 (89)
Cows that ovulated 95 (63)Cows with no ovulation 5 (63)
Cows with no estrous activity 29 (89)Cows that ovulated 35 (26)Cows with no ovulation 65
(26)1Heatime®, SCR Engineers, Ltd., Netanya, Israel.
The duration of estrus activity for cows detected inestrus by the accelerometer system (16.1 ± 4.7 h,range = 4.0 to 28.0; Figure 2) was not affected (P =0.74) by parity (16.4 vs. 17.2 h for primiparous andmultiparous, respectively) or milk production nearthe time of estrus (P = 0.51). The duration of estrusobserved in this experiment is comparable to themean duration (13.4 h) reported for cows monitoredfor estrus by visual observation of both primary(standing to be mounted) and multiple secondarysigns of estrous behavior (Roelofs et al., 2004).Conversely, duration of estrus activity observed inthe present experiment is considerably longer thanthe mean duration of estrus based on the intervalbetween the first and last standing event of estrusdetected using an electronic pressure-sensing system(Dransfield et al., 1998; Xu et al., 1998). Discrepanciesbetween the duration of estrus based on activity orvisual observation with that recorded based onstanding events are possibly due to the uncoupling ofexpression of secondary signs of estrus behavior andstanding estrus. Indeed, Sveberg et al., (2011)reported that secondary signs of estrous behavior,which can certainly be detected by visual observationor increased activity, increased significantly within 1to 3 h before the initiation of standing estrus inlactating dairy cows.
121

Figure 2. Distribution of cows based on duration ofactivity associated with estrus for cows detected inestrus by an accelerometer system (Heatime®) within7 d after synchronization of estrus. Cows weresynchronized using an i.m. injection of GnRH (100µg) followed 7 d later by induction of luteolysis usingPGF2a� (25 mg).
We did not expect that ~30% of cows would fail toshow estrus within 7 d after the PGF2a� injectionbecause a follicle >10 mm was present in all cows atthe time of the PGF2a�� injection, and all cowsincluded in the analysis underwent luteal regressionwithin 48 h after PGF2a�� treatment. In another studyin which cows received two sequential PGF2a��injections at 35 and 49 DIM, only 67.9% of cowsdetermined to be cycling by 49 DIM were detected inestrus and inseminated after the second PGF2a��injection leading the authors to conclude that issuesother than cyclicity status affected efficiency andaccuracy of estrus detection (Chebel and Santos,2010). The percentage of cows that failed to ovulatewithin the group of cows not detected in estrus was65% for the accelerometer system suggesting thatestrus did not occur in these cows. The remaining35% of ovulations in cows not detected in estrus mayhave been silent ovulations (ovulation withoutestrus), a phenomena described in lactating dairycows especially during the early postpartum period(Thatcher and Wilcox, 1973; Palmer et al., 2010;Ranasinghe et al., 2010). In addition, 5% of cowsdetected in estrus failed to ovulate within 7 d afterinduction of luteolysis. The overall rate of ovulationfailure in lactating dairy cows that showed estrusbehavior was 6.5% and was greater during the warmthan during the cool season (López-Gatius et al.,2005). This rate of ovulation failure represents a smallpercentage of the population of cows in thisexperiment and could occur due to failure in themechanism triggering ovulation (i.e. no LH surge or
insufficient LH secretion) or a lack of response by thedominant follicle to the LH surge.
Figure 3. Whisker graph of the interval from AI toovulation (n = 38 cows). AI was conducted twicedaily based on cows detected in estrus by anaccelerometer system (Heatime®). Ovulation wasdetermined using transrectal ultrasonographyconducted every 8 h from 48 to 96 h after inductionof luteolysis. Cows were synchronized using an i.m.injection of GnRH (100 µg) followed 7 d later byinduction of luteolysis using PGF2a�� (25 mg).
Due to the short lifespan of the oocyte in cattle(Hunter, 2003), the interval from AI to ovulation iscritical for optimizing fertility in lactating dairy cowsinseminated after estrus. In the present study, themean interval from AI to ovulation was 7.9 h (Figure3). This mean interval may seem appropriate becauseit allows for the 6 to 8 h required for the sustainedphase of sperm transport to the site of fertilizationand sperm capacitation (Hunter and Wilmut, 1983;Wilmut and Hunter, 1984; Hawk, 1987); however, thedegree of variation in the AI to ovulation interval(Figure 3) is a major concern. Overall, 21% of cowsreceived AI between 0 to 12 h after ovulation, atiming associated with low fertilization rates andembryo quality in lactating dairy cows (Roelofs et al.,2006) possibly due to aging of the oocyte during theperiod required for sperm transport and capacitation.By contrast, only 1 cow was inseminated more than24 h before ovulation, a period that results in highfertilization rates but low embryo quality possiblydue to aging of the spermatozoa (Roelofs et al., 2006).Based on these data, it may be helpful to eitherreduce the variation in the AI to ovulation interval sothat more cows are inseminated at the optimal timein relation to ovulation or alternatively to inseminatecows a few hours earlier to reduce the probability ofinseminating cows after or around the time of
122

ovulation when detected in estrus using theaccelerometer system.
ConclusionA practical implication of these data is that only twothirds of the cows that were considered properlysynchronized would have been inseminated based onthe accelerometer system and would go on to ovulateafter AI. The remaining cows either would not beinseminated because they were not detected in estrusor would not have a chance to conceive to AI becausethey would fail to ovulate after estrus. These dataunderscore the importance of implementing acomprehensive reproductive management programfor identification and treatment of cows that wouldotherwise not be inseminated and to identify thosecows failing to ovulate when cycling spontaneously.Based on data from the present experiment using thisaccelerometer system, the mean time of AI in relationto ovulation was acceptable for most of the cowsdetected in estrus; however, variability in theduration of estrus and timing of AI in relation toovulation could lead to poor fertility in some cows.
ReferencesCaraviello, D. Z., K. A. Weigel, P. M. Fricke, M. C. Wiltbank,M. J. Florent, N. B. Cook, K. V. Nordlund, N. R. Zwald,and C. L. Rawson. 2006. Survey of managementpractices on reproductive performance of dairy cattle onlarge US commercial farms. J. Dairy Sci. 89(12):4723-4735.
Chebel, R. C. and J. E. Santos. 2010. Effect of inseminatingcows in estrus following a presynchronization protocolon reproductive and lactation performances. J. Dairy Sci.93(10):4632-4643.
Dransfield, M. B., R. L. Nebel, R. E. Pearson, and L. D.Warnick. 1998. Timing of insemination for dairy cowsidentified in estrus by a radiotelemetric estrus detectionsystem. J. Dairy Sci. 81(7):1874-1882.
Gwazdauskas, F. C., R. L. Nebel, D. J. Sprecher, W. D.Whittier, and M. L. McGilliard. 1990. Effectiveness ofrump-mounted devices and androgenized females fordetection of estrus in dairy cattle. J. Dairy Sci.73(10):2965-2970.
Hawk, H. W. 1987. Transport and fate of spermatozoa afterinsemination of cattle. J. Dairy Sci. 70(7):1487-1503.
Holman, A., J. Thompson, J. E. Routly, J. Cameron, D. N.Jones, D. Grove-White, R. F. Smith, and H. Dobson. 2011.Comparison of oestrus detection methods in dairy cattle.Vet. Rec. 169(2):47.
Hunter, R. H. F. 2003. The process of ovulation andsheeding of an oocyte. Pages 262-286 in Physiology ofthe graafian follicle and ovulation. CambridgeUniversity Press.
Jónsson, R., M. Blanke, N. K. Poulsen, F. Caponetti, and S.Højsgaard. 2011. Oestrus detection in dairy cows fromactivity and lying data using on-line individual models.Computers and Electronics in Agriculture 76(1):6-15.
López-Gatius, F., M. López-Béjar, M. Fenech, and R. H. F.Hunter. 2005. Ovulation failure and double ovulation indairy cattle: risk factors and effects. Theriogenology63(5):1298-1307.
Lyimo, Z. C., M. Nielen, W. Ouweltjes, T. A. Kruip, and F. J.van Eerdenburg. 2000. Relationship among estradiol,cortisol and intensity of estrous behavior in dairy cattle.Theriogenology 53(9):1783-1795.
Miller, R. H., H. D. Norman, M. T. Kuhn, J. S. Clay, and J. L.Hutchison. 2007. Voluntary waiting period and adoptionof synchronized breeding in dairy herd improvementherds. J. Dairy Sci. 90(3):1594-1606.
Palmer, M. A., G. Olmos, L. A. Boyle, and J. F. Mee. 2010.Estrus detection and estrus characteristics in housed andpastured Holstein-Friesian cows. Theriogenology74(2):255-264.
Peralta, O. A., R. E. Pearson, and R. L. Nebel. 2005.Comparison of three estrus detection systems duringsummer in a large commercial dairy herd. Anim.Reprod. Sci. 87(1-2):59-72.
Ranasinghe, R. M., T. Nakao, K. Yamada, and K. Koike.2010. Silent ovulation, based on walking activity andmilk progesterone concentrations, in Holstein cowshoused in a free-stall barn. Theriogenology 73(7):942-949.
Roelofs, J. B., E. G. Bouwman, S. J. Dieleman, F. J. VanEerdenburg, L. M. Kaal-Lansbergen, N. M. Soede, and B.Kemp. 2004. Influence of repeated rectal ultrasoundexaminations on hormone profiles and behaviouraround oestrus and ovulation in dairy cattle.Theriogenology 62(7):1337-1352.
Roelofs, J. B., E. A. Graat, E. Mullaart, N. M. Soede, W.Voskamp-Harkema, and B. Kemp. 2006. Effects ofinsemination-ovulation interval on fertilization rates andembryo characteristics in dairy cattle. Theriogenology66(9):2173-2181.
Roelofs, J. B., F. J. van Eerdenburg, N. M. Soede, and B.Kemp. 2005. Pedometer readings for estrous detectionand as predictor for time of ovulation in dairy cattle.Theriogenology 64(8):1690-1703.
Stevenson, J. S. and E. P. Call. 1983. Influence of earlyestrus, ovulation, and insemination on fertility inpostpartum Holstein cows. Theriogenology 19(3):367-375.
Sveberg, G., A. O. Refsdal, H. W. Erhard, E. Kommisrud, M.Aldrin, I. F. Tvete, F. Buckley, A. Waldmann, and E.Ropstad. 2011. Behavior of lactating Holstein-Friesiancows during spontaneous cycles of estrus. J. Dairy Sci.94(3):1289-1301.
Thatcher, W. W. and C. J. Wilcox. 1973. Postpartum estrusas an indicator of reproductive status in the dairy cow. J.Dairy Sci. 56(5):608-610.
Walker, W. L., R. L. Nebel, and M. L. McGilliard. 1996. Timeof ovulation relative to mounting activity in dairy cattle.J. Dairy Sci. 79(9):1555-1561.
Wilmut, I. and R. H. F. Hunter. 1984. Sperm transport intothe oviducts of heifers mated early in oestrus. Reprod.Nut. and Dev. 24(4):461-468.
Xu, Z. Z., D. J. McKnight, R. Vishwanath, C. J. Pitt, and L. J.Burton. 1998. Estrus detection using radiotelemetry orvisual observation and tail painting for dairy cows onpasture. J. Dairy Sci. 81(11):2890-2896.
123

The President signed the Food Safety Modernization Act(FSMA) into law on January 4, 2011. The 115-page lawprovides a host of new authorities for the U.S. Food andDrug Administration (FDA) not seen since the creation ofthe FDA in the federal Food, Drug and Cosmetic Act of1938.
The centerpiece of the new law is Section 418: HazardAnalysis and Risk-Based Preventive Controls, whichrequires domestic food and feed facilities that manufacture,process, pack or hold food or feed products to perform ahazard analysis at each facility for hazards that are“reasonably foreseen,” prepare adequate controls to“significantly minimize or prevent the occurrence” of each,monitor performance and maintain records routinely.Facilities must maintain such records for at least two years.
FDA is to draft regulations for feed, food, produce andimported products to implement this new law. Facilitiesmaking products for exported to the U.S. are required tocomply with the same provision. Facilities that importproducts must assure that the foreign facilities havedeveloped hazard analyses and written risk-basedpreventive controls. This can be accomplished by directinspection of the foreign facilities or the use of FDA-accredited third party entities that can certify compliancewith the new law.
FSMA provides FDA with authorities to revoke facilityregistrations, thereby halting operations at these plants.FSMA also grants FDA mandatory recall and
administrative detention authorities under specificconditions or causes.
Implementation of the Safe Food Transportation Act of1990 is required by FSMA, and FDA must promulgaterules within 18 months enactment of FSMA.
Congress is unlikely to fully fund the requirements of thisnew law (a budget request of $300 million), includinghiring 4,000 new field staff; 600 or more foreign facilityinspections annually and the development of performancestandards for affected industry, which are thetolerances/guidance levels for contaminants, among manyother requirements.
The cost of preventive control regulations for the industryis estimated to exceed $1 billion and may cause delay inFSMA rulemaking. The food and feed industry estimatesthat training and compliance inspections will take 10 yearsto fully implement the provisions of FSMA.
For more information visitwww.fda.gov/food/foodsafety/FMSA.
1Contact at: 2101Wilson Blvd., Suite 916, Arlington, VA22201, (703) 524-0810, Email: [email protected].
Food Safety Modernization ActRichard S. Sellers1
American Feed Industry AssociationArlington, Virginia
124

Notes

Notes

Notes